
Comparison of Measurements of External Load between Professional Soccer Players


 ,
, 
Abstract
:1. Introduction
2. Materials and Methods
2.1. Study Design
2.2. Participants
2.3. External Training Load
2.3.1. GPS
2.3.2. Data Collection by GPS
2.3.3. Calculate Training Load
2.4. Statistical Analysis
3. Results
4. Discussion
Limitations of Study
5. Conclusions
Author Contributions
Funding
Institutional Review Board Statement
Informed Consent Statement
Data Availability Statement
Acknowledgments
Conflicts of Interest
References
- Draganidis, D.; Chatzinikolaou, A.; Jamurtas, T.; Barbero, J.C.; Tsoukas, D.; Theodorou, A.; Margonis, K.; Michailidis, Y.; Avloniti, A.; Theodorou, A.; et al. The time-frame of acute resistance exercise effects on football skill performance: The impact of exercise intensity. J. Sports Sci. 2013, 31, 714–722. [Google Scholar] [CrossRef] [PubMed]
- Swallow, W.E.; Skidmore, N.; Page, R.M.; Malone, J.J. An examination of in-season external training load in semi-professional soccer players: Considerations of one and two match weekly microcycles. Int. J. Sports Sci. Coach. 2021, 16, 192–199. [Google Scholar] [CrossRef]
- Nobari, H.; Oliveira, R.; Clemente, F.; Pérez-Gómez, J.; Pardos-Mainer, E.; Ardigò, L. Somatotype, Accumulated Workload, and Fitness Parameters in Elite Youth Players: Associations with Playing Position. Children 2021, 8, 375. [Google Scholar] [CrossRef] [PubMed]
- Nobari, H.; Vahabidelshad, R.; Pérez-Gómez, J.; Ardigò, L.P. Variations of training workload in micro-and meso-cycles based on position in elite young soccer players: A competition season study. Front. Physiol. 2021, 12, 529. [Google Scholar] [CrossRef] [PubMed]
- Rice, S.M.; Purcell, R.; De Silva, S.; Mawren, D.; McGorry, P.D.; Parker, A. The Mental Health of Elite Athletes: A Narrative Systematic Review. Sports Med. 2016, 46, 1333–1353. [Google Scholar] [CrossRef] [Green Version]
- Eckard, T.G.; Padua, D.A.; Hearn, D.W.; Pexa, B.S.; Frank, B.S. The Relationship Between Training Load and Injury in Athletes: A Systematic Review. Sports Med. 2018, 48, 1929–1961. [Google Scholar] [CrossRef] [PubMed]
- Drew, M.K.; Finch, C.F. The Relationship Between Training Load and Injury, Illness and Soreness: A Systematic and Literature Review. Sports Med. 2016, 46, 861–883. [Google Scholar] [CrossRef]
- Nobari, H.; Kargarfard, M.; Minasian, V.; Cholewa, J.M.; Pérez-Gómez, J. The effects of 14-week betaine supplementation on endocrine markers, body composition and anthropometrics in professional youth soccer players: A double blind, randomized, placebo-controlled trial. J. Int. Soc. Sports Nutr. 2021, 18, 20. [Google Scholar] [CrossRef]
- Schmikli, S.L.; de Vries, W.R.; Brink, M.S.; Backx, F.J. Monitoring performance, pituitary–adrenal hormones and mood profiles: How to diagnose non-functional over-reaching in male elite junior soccer players. Br. J. Sports Med. 2012, 46, 1019–1023. [Google Scholar] [CrossRef]
- Meeusen, R.; Duclos, M.; Foster, C.; Fry, A.; Gleeson, M.; Nieman, D.; Raglin, J.; Rietjens, G.; Steinacker, J.; Urhausen, A. Prevention, diagnosis and treatment of the overtraining syndrome: Joint consensus statement of the European College of Sport Science (ECSS) and the American College of Sports Medicine (ACSM). Eur. J. Sport Sci. 2013, 13, 1–24. [Google Scholar] [CrossRef] [Green Version]
- Schmikli, S.; Brink, M.; De Vries, W.; Backx, F. Can we detect non-functional overreaching in young elite soccer players and middle-long distance runners using field performance tests? Br. J. Sports Med. 2011, 45, 631–636. [Google Scholar] [CrossRef] [PubMed] [Green Version]
- Braun, H.; Von Andrian-Werburg, J.; Schänzer, W.; Thevis, M. Nutrition status of young elite female German football players. Pediatric Exerc. Sci. 2018, 30, 157–167. [Google Scholar] [CrossRef] [PubMed]
- Griffin, A.; Kenny, I.C.; Comyns, T.M.; Lyons, M. The association between the acute: Chronic workload ratio and injury and its application in team sports: A systematic review. Sports Med. 2020, 50, 561–580. [Google Scholar] [CrossRef] [PubMed]
- Nobari, H.; Mainer-Pardos, E.; Zamorano, A.D.; Bowman, T.G.; Clemente, F.M.; Pérez-Gómez, J. Sprint variables are associated with the odds ratios of non-contact injuries in professional soccer players. Int. J. Environ. Res. Public Health 2021, 18, 10417. [Google Scholar] [CrossRef]
- Ball, S.; Halaki, M.; Sharp, T.; Orr, R. Injury patterns, physiological profile, and performance in university rugby union. Int. J. Sports Physiol. Perform. 2018, 13, 69–74. [Google Scholar] [CrossRef]
- Rogalski, B.; Dawson, B.; Heasman, J.; Gabbett, T.J. Training and game loads and injury risk in elite Australian footballers. J. Sci. Med. Sport 2013, 16, 499–503. [Google Scholar] [CrossRef]
- Bowen, L.; Gross, A.S.; Gimpel, M.; Li, F.-X. Accumulated workloads and the acute: Chronic workload ratio relate to injury risk in elite youth football players. Br. J. Sports Med. 2017, 51, 452–459. [Google Scholar] [CrossRef] [Green Version]
- Nobari, H.; Aquino, R.; Clemente, F.M.; Khalafi, M.; Adsuar, J.C.; Pérez-Gómez, J. Description of acute and chronic load, training monotony and strain over a season and its relationships with well-being status: A study in elite under-16 soccer players. Physiol. Behav. 2020, 225, 113117. [Google Scholar] [CrossRef]
- Nobari, H.; Khalili, S.M.; Zamorano, A.D.; Bowman, T.G.; Adsuar, J.C.; Perez-Gomez, J.; Granacher, U. Workload is Associated with the Occurrence of Non-Contact Injuries in Professional Male Soccer Players: A Pilot Study. Preprint 2021. [Google Scholar] [CrossRef]
- Lu, D.; Howle, K.; Waterson, A.; Duncan, C.; Duffield, R. Workload profiles prior to injury in professional soccer players. Sci. Med. Footb. 2017, 1, 237–243. [Google Scholar] [CrossRef]
- Barnes, C.; Archer, D.T.; Hogg, B.; Bush, M.; Bradley, P.S. The evolution of physical and technical performance parameters in the English Premier League. Int. J. Sports Med. 2014, 35, 1095–1100. [Google Scholar] [CrossRef]
- Morton, R. Modelling training and overtraining. J. Sports Sci. 1997, 15, 335–340. [Google Scholar] [CrossRef] [PubMed]
- Rico-González, M.; Los Arcos, A.; Rojas-Valverde, D.; Clemente, F.M.; Pino-Ortega, J. A survey to assess the quality of the data obtained by radio-frequency technologies and microelectromechanical systems to measure external workload and collective behavior variables in team sports. Sensors 2020, 20, 2271. [Google Scholar] [CrossRef] [PubMed] [Green Version]
- Hulin, B.T.; Gabbett, T.J.; Caputi, P.; Lawson, D.W.; Sampson, J.A. Low chronic workload and the acute: Chronic workload ratio are more predictive of injury than between-match recovery time: A two-season prospective cohort study in elite rugby league players. Br. J. Sports Med. 2016, 50, 1008–1012. [Google Scholar] [CrossRef]
- Schwellnus, M.; Soligard, T.; Alonso, J.-M.; Bahr, R.; Clarsen, B.; Dijkstra, H.P.; Gabbett, T.J.; Gleeson, M.; Hägglund, M.; Hutchinson, M.R.; et al. How much is too much? (Part 2) International Olympic Committee consensus statement on load in sport and risk of illness. Br. J. Sports Med. 2016, 50, 1043–1052. [Google Scholar] [CrossRef] [PubMed] [Green Version]
- Impellizzeri, F.M.; Tenan, M.S.; Kempton, T.; Novak, A.; Coutts, A.J. Acute: Chronic workload ratio: Conceptual issues and fundamental pitfalls. Int. J. Sports Physiol. Perform. 2020, 15, 907–913. [Google Scholar] [CrossRef]
- Gabbett, T.J. The training—Injury prevention paradox: Should athletes be training smarter and harder? Br. J. Sports Med. 2016, 50, 273–280. [Google Scholar] [CrossRef] [PubMed] [Green Version]
- Nobari, H.; Kharatzadeh, M.; Khalili, S.M.; Pérez-Gómez, J.; Ardigò, L.P. Fluctuations of Training Load Variables in Elite Soccer Players U-14 throughout the Competition Season. Healthcare 2021, 9, 1418. [Google Scholar] [CrossRef]
- Nobari, H.; Oliveira, R.; Clemente, F.M.; Adsuar, J.C.; Pérez-Gómez, J.; Carlos-Vivas, J.; Brito, J.P. Comparisons of Accelerometer Variables Training Monotony and Strain of Starters and Non-Starters: A Full-Season Study in Professional Soccer Players. Int. J. Environ. Res. Public Health 2020, 17, 6547. [Google Scholar] [CrossRef]
- Nobari, H.; Castillo, D.; Clemente, F.M.; Carlos-Vivas, J.; Pérez-Gómez, J. Acute, chronic and acute/chronic ratio between starters and non-starters professional soccer players across a competitive season. Proc. Inst. Mech. Eng. Part P J. Sports Eng. Technol. 2021, 17543371211016594. [Google Scholar] [CrossRef]
- Nobari, H.; Oliveira, R.; Brito, J.; Pérez-Gómez, J.; Clemente, F.; Ardigò, L. Comparison of running distance variables and body load in competitions based on their results: A full-season study of professional soccer players. Int. J. Environ. Res. Public Health 2021, 18, 2077. [Google Scholar] [CrossRef]
- World Medical Association. Declaración de Helsinki de la AMM-Principios Eticos Para las Investigaciones Médicas en Seres Humanos; World Medical Association: Ferney-Voltaire, France, 2019. [Google Scholar]
- Williams, J.; Tessaro, E. Validity and reliability of a 15 Hz GPS Device for court-based sports movements. J. Strength Cond. Res. 2018, 28. [Google Scholar] [CrossRef]
- Nobari, H.; Banoocy, N.K.; Oliveira, R.; Pérez-Gómez, J. Win, Draw, or Lose? Global Positioning System-Based Variables’ Effect on the Match Outcome: A Full-Season Study on an Iranian Professional Soccer Team. Sensors 2021, 21, 5695. [Google Scholar] [CrossRef] [PubMed]
- Malone, S.; Owen, A.; Newton, M.; Mendes, B.; Collins, K.D.; Gabbett, T.J. The acute: Chonic workload ratio in relation to injury risk in professional soccer. J. Sci. Med. Sport 2017, 20, 561–565. [Google Scholar] [CrossRef] [PubMed] [Green Version]
- Clemente, F.M.; Silva, A.F.; Clark, C.C.; Conte, D.; Ribeiro, J.; Mendes, B.; Lima, R. Analyzing the seasonal changes and relationships in training load and wellness in elite volleyball players. Int. J. Sports Physiol. Perform. 2020, 15, 731–740. [Google Scholar] [CrossRef]
- Hulin, B.T.; Gabbett, T.J.; Lawson, D.W.; Caputi, P.; Sampson, J.A. The acute: Chronic workload ratio predicts injury: High chronic workload may decrease injury risk in elite rugby league players. Br. J. Sports Med. 2016, 50, 231–236. [Google Scholar] [CrossRef] [Green Version]
- Hedges, L.V.; Olkin, I. Statistical Methods for Meta-Analysis; Academic Press: Cambridge, MA, USA, 2014. [Google Scholar]
- Haddad, M.; Stylianides, G.; Djaoui, L.; Dellal, A.; Chamari, K. Session-RPE method for training load monitoring: Validity, ecological usefulness, and influencing factors. Front. Neurosci. 2017, 11, 612. [Google Scholar] [CrossRef] [Green Version]
- Hopkins, W.G.; Marshall, S.W.; Batterham, A.M.; Hanin, J. Progressive statistics for studies in sports medicine and exercise science. Med. Sci. Sports Exerc. 2009, 41, 3. [Google Scholar] [CrossRef] [Green Version]
- Silva, J.R.; Magalhães, J.F.; Ascensão, A.A.; Oliveira, E.M.; Seabra, A.F.; Rebelo, A.N. Individual match playing time during the season affects fitness-related parameters of male professional soccer players. J. Strength Cond. Res. 2011, 25, 2729–2739. [Google Scholar] [CrossRef] [Green Version]
- Dalen, T.; Jørgen, I.; Gertjan, E.; Havard, H.G.; Ulrik, W. Player load, acceleration, and deceleration during forty-five competitive matches of elite soccer. J. Strength Cond. Res. 2016, 30, 351–359. [Google Scholar] [CrossRef]
- Arcos, A.L.; Mendez-Villanueva, A.; Martinez-Santos, R. In-season training periodization of professional soccer players. Biol. Sport 2017, 34, 149. [Google Scholar] [CrossRef]
- Gabbett, T.J.; Jenkins, D.G. Relationship between training load and injury in professional rugby league players. J. Sci. Med. Sport 2011, 14, 204–209. [Google Scholar] [CrossRef] [PubMed]
- Bowen, L.; Gross, A.S.; Gimpel, M.; Bruce-Low, S.; Li, F.-X. Spikes in acute: Chronic workload ratio (ACWR) associated with a 5–7 times greater injury rate in English Premier League football players: A comprehensive 3-year study. Br. J. Sports Med. 2020, 54, 731–738. [Google Scholar] [CrossRef] [PubMed] [Green Version]
- Anderson, L.; Orme, P.; Di Michele, R.; Close, G.L.; Milsom, J.; Morgans, R.; Drust, B.; Morton, J.P. Quantification of seasonal-long physical load in soccer players with different starting status from the English Premier League: Implications for maintaining squad physical fitness. Int. J. Sports Physiol. Perform. 2016, 11, 1038–1046. [Google Scholar] [CrossRef] [PubMed] [Green Version]
- Curtis, R.M.; Huggins, R.A.; Benjamin, C.L.; Sekiguchi, Y.; Arent, S.M.; Armwald, B.C.; Pullara, J.M.; West, C.A.; Casa, D.J. Seasonal Accumulated Workloads in Collegiate Men’s Soccer: A Comparison of Starters and Reserves. J. Strength Cond. Res. 2019, 35, 3184–3189. [Google Scholar] [CrossRef] [PubMed]
- Fanchini, M.; Rampinini, E.; Riggio, M.; Coutts, A.J.; Pecci, C.; McCall, A. Despite association, the acute: Chronic work load ratio does not predict non-contact injury in elite footballers. Sci. Med. Footb. 2018, 2, 108–114. [Google Scholar] [CrossRef]
- Enright, K.; Green, M.; Hay, G.; Malone, J.J. Workload and injury in professional soccer players: Role of injury tissue type and injury severity. Int. J. Sports Med. 2020, 41, 89–97. [Google Scholar] [CrossRef]
- Oliveira, R.; Brito, J.P.; Martins, A.; Mendes, B.; Marinho, D.A.; Ferraz, R.; Marques, M.C. In-season internal and external training load quantification of an elite European soccer team. PLoS ONE 2019, 14, e0209393. [Google Scholar] [CrossRef] [Green Version]
- Clemente, F.M.; Rabbani, A.; Conte, D.; Castillo, D.; Afonso, J.; Clark, C.C.T.; Nikolaidis, P.T.; Rosemann, T.; Knechtle, B. Training/match external load ratios in professional soccer players: A full-season study. Int. J. Environ. Res. Public Health 2019, 16, 3057. [Google Scholar] [CrossRef] [Green Version]


| Variables | Season Period | Group | % Difference (Non-Starters vs. Starters) | p | Hedges’s g (95% CI) (Non-Starters vs. Starters) | Inference | |
|---|---|---|---|---|---|---|---|
| Starters | Non-Starters | ||||||
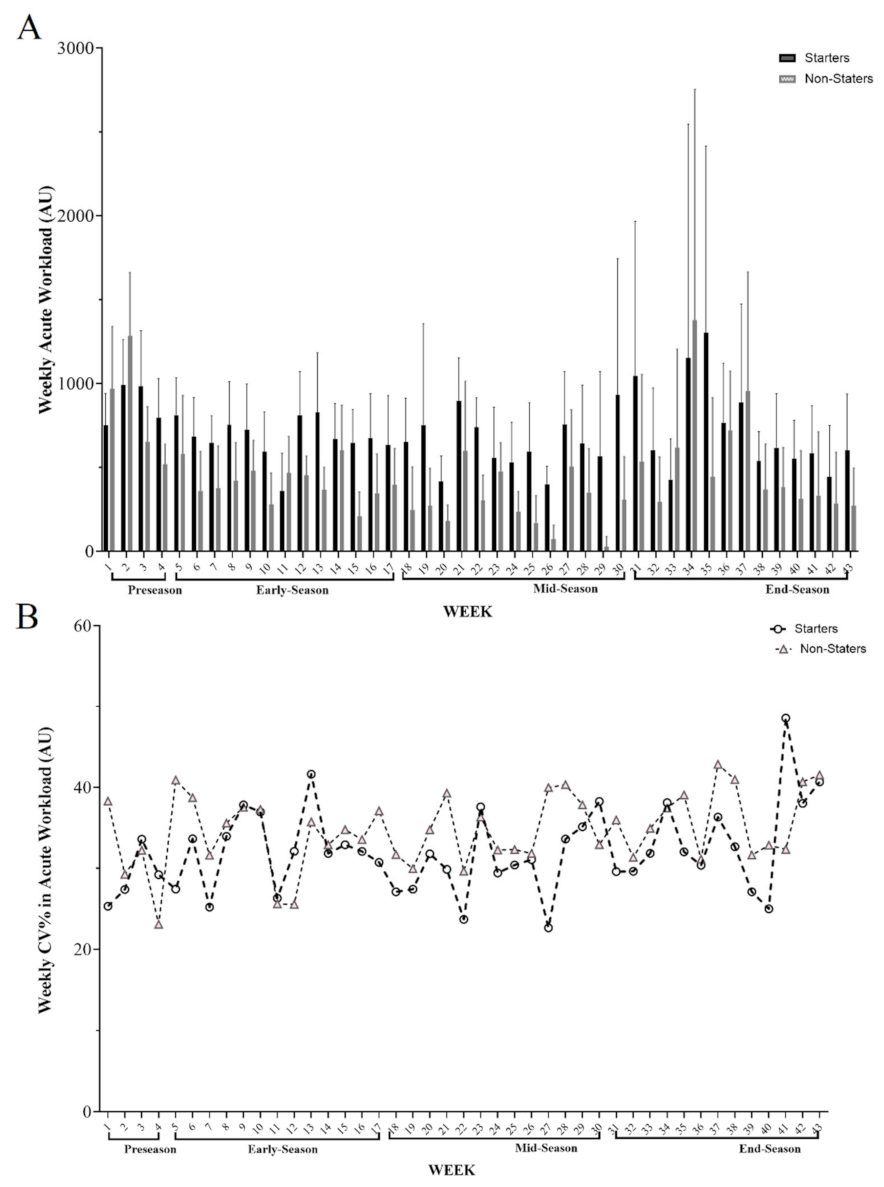
| AW (A.U.) | Pre-Season | 880.9 (129.8) | 856.0 (183.6) | 2.4 (−12.7 to 7.7) | 0.307 | 0.1 (−0.7 to 1.0) | small |
| Early-Season | 680.6 (151.9) | 411.4 (56.1) | 2.6 (1.5 to 3.8) | 0.227 | 2.1 (1.0 to 3.3) | very large | |
| Mid-Season | 649.8 (190.9) | 288.5 (66.2) | 3.6 (2.2 to 5.0) | 0.008 * | 2.3 (1.1 to 3.5) | very large | |
| End-Season | 732.5 (258.6) | 531.1 (137.9) | 4.0 (−275.5 to 20.1) | 0.035 * | 0.9 (−0.0 to 1.8) | moderate to large | |
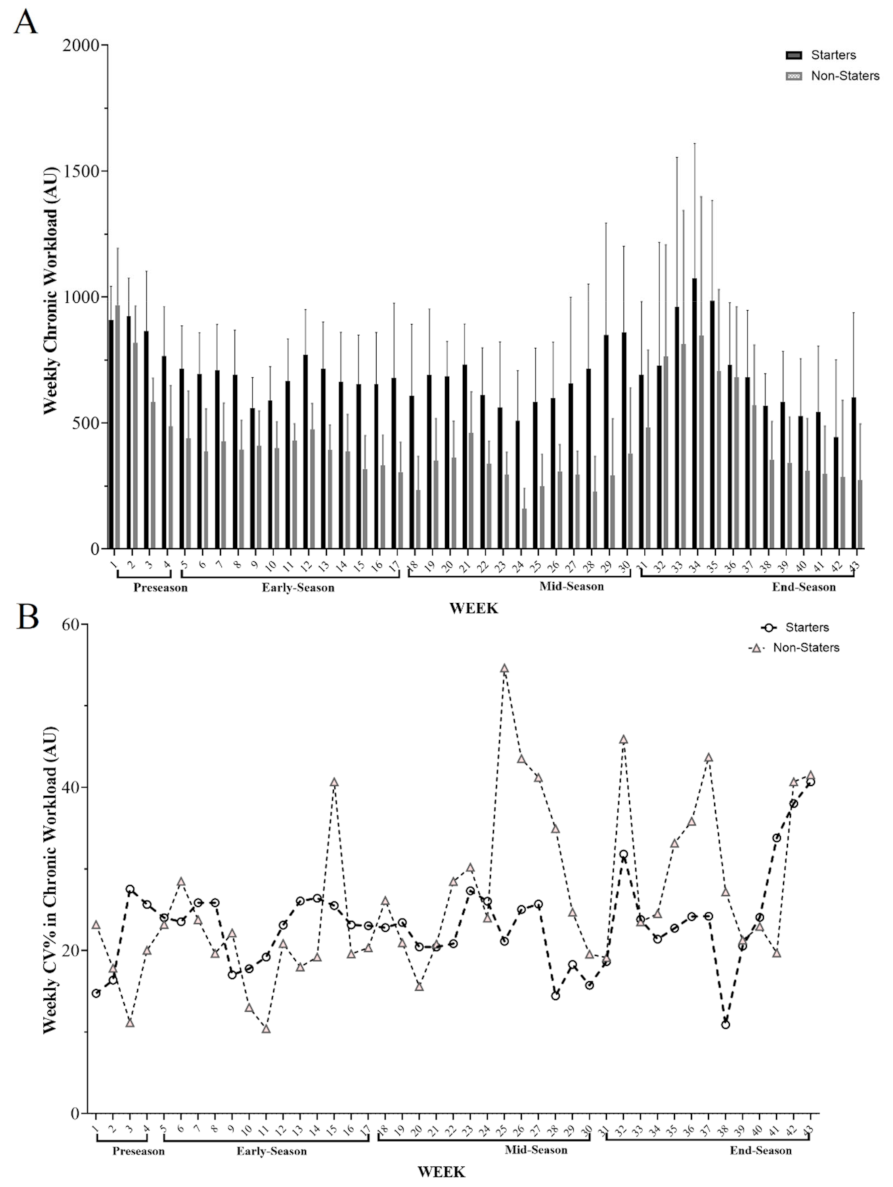
| CW (A.U.) | Pre-Season | 916.4 (132.6) | 893.5 (182.8) | 2.2 (−1.3 to 1.7) | 0.756 | 0.1 (−0.7 to 1.0) | small |
| Early-Season | 696.8 (155.6) | 425.4 (51.8) | 2.7 (1.5 to 3.8) | <0.001 * | 2.1 (1.0 to 3.3) | very large | |
| Mid-Season | 637.3 (194.2) | 301.3 (60.4) | 3.3 (1.9 to 4.7) | <0.001 * | 2.1 (1.0 to 3.3) | very large | |
| End-Season | 752.7 (250.5) | 526.3 (148.6) | 2.2 (2.3 to 4.2) | 0.017 * | 1.0 (0.0 to 1.9) | large to very large | |
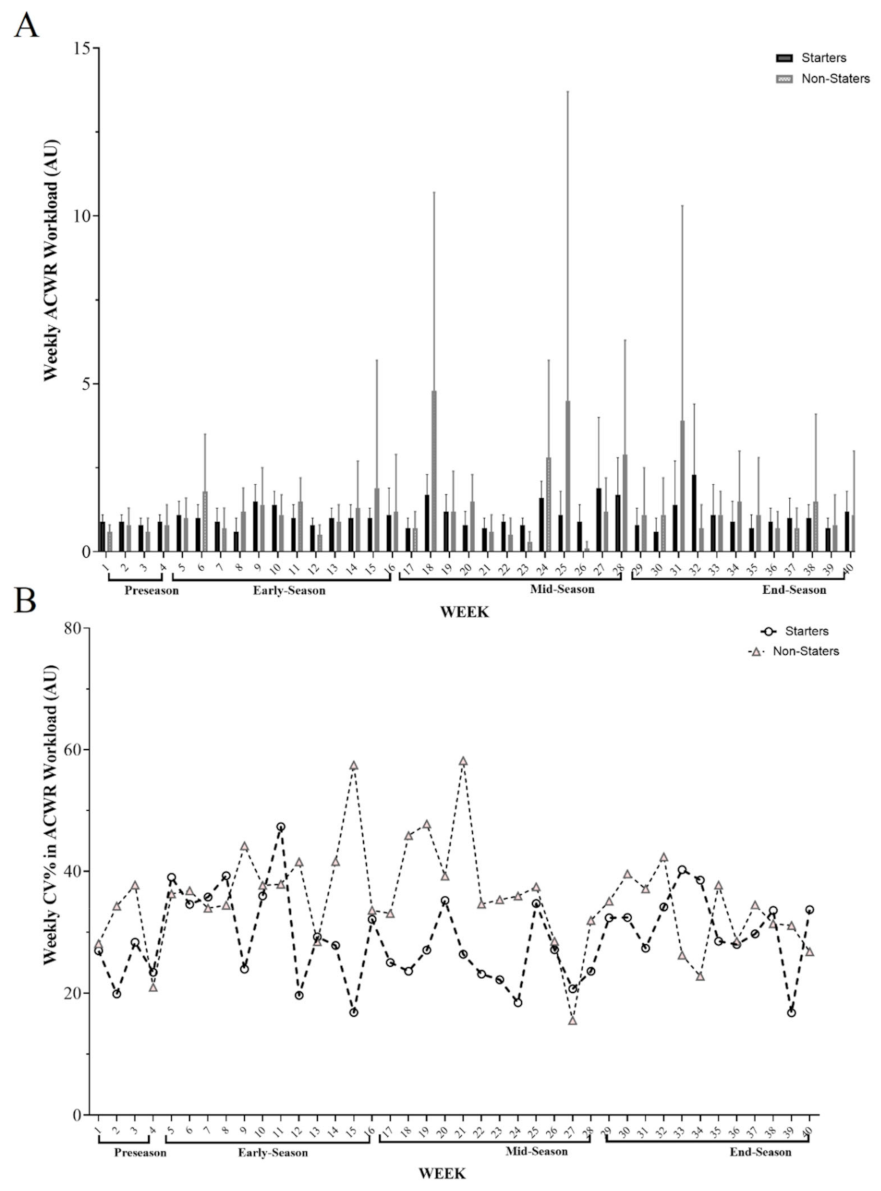
| wACWR (A.U.) | Early-Season | 1.0 (0.0) | 1.0 (0.1) | −0.5 (−12 to 13) | 0.133 | 0.0 (−0.9 to 0.9) | trivial |
| Mid-Season | 1.1 (0.2) | 1.6 (0.7) | −5.0 (−9.8 to −1.4) | 0.043 * | −0.9 (−1.9 to −0.0) | trivial | |
| End-Season | 1.10 (0.16) | 1.4 (0.38) | −3.0 (−6.0 to 0.1) | 0.010 * | −0.9 (−1.8 to 0.0) | trivial | |
| Variables | Season Period | Group | %Difference (Non-Starters vs. Starters) | p | Hedges’s g (95% CI) (Non-Starters vs. Starters) | Inference | |
|---|---|---|---|---|---|---|---|
| Starters | Non-Starters | ||||||
| wTD (m) | Pre-Season | 4995.8 (399.9) | 4755.8 (356.3) | 240 (−1.2 to 6) | 0.187 | 0.60 (−0.31 to 1.52) | trivial |
| Early-Season | 4745.9 (498.9) | 2974.2 (466.7) | 17.7 (1.3 to 2.2) | <0.001 * | 3.49 (2.06 to 4.92) | very large to nearly perfect | |
| Mid-Season | 4568.3 (593.2) | 2385.7 (559.2) | 218.2 (1.6 to 2.7) | <0.001 * | 3.61 (2.15 to 5.06) | very large to nearly perfect | |
| End-Season | 4116.3 (668) | 2696.7 (679.9) | 141.9 (7.6 to 2) | <0.001 * | 2.01 (0.90 to 3.11) | very large | |
| wSTD (m) | Pre-Season | 2541.4 (479.7) | 2546.6 (571.3) | −520 (−5.1 to 5.0) | 0.883 | −0.00 (−0.91 to 0.89) | trivial |
| Early-Season | 1869.3 (282.8) | 1123.7 (199.4) | 7.4 (5.0 to 9.8) | <0.000 * | 2.88 (1.59 to 4.16) | very large | |
| Mid-Season | 1782.5 (402.8) | 854.8 (220.4) | 9.2 (6.0 to 1.2) | <0.000 * | 2.68 (1.44 to 3.92) | very large | |
| End-Season | 1876.4 (425.9) | 1194.7 (413.0) | 6.8 (2.7 to 1.0) | <0.003 * | 1.55 (0.52 to 2.57) | large | |
| wDT (min) | Pre-Season | 76.8 (5.8) | 76.1 (4) | 70 (−4.1 to 5.5) | 0.704 | 0.13 (−0.76 to 1.04) | trivial |
| Early-Season | 67.2 (5.4) | 48.9 (7.4) | 1.8 (1.2 to 2.4) | <0.001 * | 3.34 (1.94 to 4.73) | very large | |
| Mid-Season | 59 (7.5) | 37.7 (6.7) | 2.1 (1.4 to 2.8) | <0.001 * | 4.25 (2.63 to 5.88) | nearly perfect | |
| End-Season | 51.8 (10.3) | 39.3 (11.5) | 1.2 (1.9 to 2.3) | <0.017 * | 1.09 (0.127 to 2.058) | small to moderate | |
| wMS (km·h−1) | Pre-Season | 26.3 (2.5) | 23.9 (2.3) | 240 (0 to 4.7) | 0.052 | 0.91 (−0.03 to 1.85) | Moderate to large |
| Early-Season | 28.5 (2.4) | 18.8 (2.4) | 97 (7.3 to 12) | <0.001 * | 3.48 (2.05 to 4.91) | very large | |
| Mid-Season | 26.1 (3.3) | 17.1 (1.7) | 90 (6.4 to 11.5) | <0.001 * | 3.34 (1.954 to 4.74) | very large | |
| End-Season | 23.9 (3.2) | 18.5 (2) | 54 (2.7 to 8) | <0.001 * | 2.07 (0.95 to 3.18) | very large | |
| wRS (number) | Pre-Season | 88.3 (23.6) | 75.4 (26.1) | 1.2 (−1.1 to 3.7) | 0.271 | 0.49 (−0.41 to 1.41) | small |
| Early-Season | 62.5 (9.5) | 43.2 (7.2) | 1.9 (1.1.0 to 2.7) | <0.001 * | 2.17 (1.03 to 3.30) | very large | |
| Mid-Season | 59.5 (10.0) | 36.5 (8.9) | 2.3 (1.3 to 3.2) | <0.001 * | 2.31 (1.15 to 3.47) | very large | |
| End-Season | 61.3 (13.3) | 44.1 (15.3) | 1.7 (0.3 to 3.1) | <0.016 * | 1.15 (0.17 to 2.12) | large | |
Publisher’s Note: MDPI stays neutral with regard to jurisdictional claims in published maps and institutional affiliations. |
© 2022 by the authors. Licensee MDPI, Basel, Switzerland. This article is an open access article distributed under the terms and conditions of the Creative Commons Attribution (CC BY) license (https://creativecommons.org/licenses/by/4.0/).
Share and Cite
Gholizadeh, R.; Nobari, H.; Bolboli, L.; Siahkouhian, M.; Brito, J.P. Comparison of Measurements of External Load between Professional Soccer Players. Healthcare 2022, 10, 1116. https://doi.org/10.3390/healthcare10061116
Gholizadeh R, Nobari H, Bolboli L, Siahkouhian M, Brito JP. Comparison of Measurements of External Load between Professional Soccer Players. Healthcare. 2022; 10(6):1116. https://doi.org/10.3390/healthcare10061116
Chicago/Turabian StyleGholizadeh, Roghayyeh, Hadi Nobari, Lotfali Bolboli, Marefat Siahkouhian, and João Paulo Brito. 2022. "Comparison of Measurements of External Load between Professional Soccer Players" Healthcare 10, no. 6: 1116. https://doi.org/10.3390/healthcare10061116
APA StyleGholizadeh, R., Nobari, H., Bolboli, L., Siahkouhian, M., & Brito, J. P. (2022). Comparison of Measurements of External Load between Professional Soccer Players. Healthcare, 10(6), 1116. https://doi.org/10.3390/healthcare10061116