
Detection of Electroencephalographic Abnormalities and Its Associated Factors among Children with Autism Spectrum Disorder in Thailand

 , and
, and
Abstract
:1. Introduction
2. Materials and Methods
2.1. Participants
2.2. Inclusion and Exclusion Criteria
2.3. Procedure and Data Collection
2.4. Ethical Approval and Consent to Participate
2.5. Statistical Analysis
3. Results
- Sensitivity: 93.3% (95% confidence interval [95% CI]: 85.9–97.5)
- Specificity: 25.6% (95% CI: 13.0–42.1)
- Receiver operating characteristic (ROC) area: 0.59 (95% CI: 0.52–0.67)
- Positive predictive value (PPV): 74.1% (95% CI: 65.0–81.9)
- Negative predictive value (NPV): 62.5% (95% CI: 35.4–84.8)
4. Discussion
5. Conclusions
Author Contributions
Funding
Institutional Review Board Statement
Informed Consent Statement
Data Availability Statement
Acknowledgments
Conflicts of Interest
References
- American Psychiatric Association. Diagnostic and Statistical Manual of Mental Disorders: DSM-5™, 5th ed.; American Psychiatric Publishing, Inc.: Arlington, VA, USA, 2013. [Google Scholar]
- Elsabbagh, M.; Divan, G.; Koh, Y.-J.; Kim, Y.S.; Kauchali, S.; Marcín, C.; Montiel-Nava, C.; Patel, V.; Paula, C.S.; Wang, C.; et al. Global Prevalence of Autism and Other Pervasive Developmental Disorders. Autism Res. 2012, 5, 160–179. [Google Scholar] [CrossRef] [PubMed] [Green Version]
- Plubrukarn, R.; Piyasil, V.; Moungnoi, P.; Tanprasert, S.; Chutchawalitsakul, V. Trend study of autistic spectrum disorders at Queen Sirikit National Institute of Child Health. J. Med. Assoc. Thail. 2005, 88, 891–897. [Google Scholar]
- Hansakunachai, T.; Roongpraiwan, R.; Sombuntham, T.; Limprasert, P.; Ruangdaraganon, N. A new structured interview for children with autism spectrum disorder based on the DSM-IV. J. Med. Assoc. Thail. 2014, 97, S7–S14. [Google Scholar]
- Autism at a Glance in Asean under the Autism Mapping Project in the Asean Region Part II. Available online: https://www.apcdfoundation.org/th/node/118/ (accessed on 7 October 2021).
- Buescher, A.V.S.; Cidav, Z.; Knapp, M.; Mandell, D.S. Costs of Autism Spectrum Disorders in the United Kingdom and the United States. JAMA Pediatr. 2014, 168, 721–728. [Google Scholar] [CrossRef]
- Zwaigenbaum, L.; Brian, J.A.; Ip, A. Early detection for autism spectrum disorder in young children. Paediatr. Child Health 2019, 24, 424–432. [Google Scholar] [CrossRef] [PubMed] [Green Version]
- Mulligan, C.K.; Trauner, D.A. Incidence and Behavioral Correlates of Epileptiform Abnormalities in Autism Spectrum Disorders. J. Autism Dev. Disord. 2014, 44, 452–458. [Google Scholar] [CrossRef]
- Ošlejšková, H.; Makovska, A.; Autrata, R. Complicated relationship between autism with regression and epilepsy. Neuroendocr. Lett. 2008, 29, 558–570. [Google Scholar]
- Amiet, C.; Gourfinkel-An, I.; Bouzamondo, A.; Tordjman, S.; Baulac, M.; Lechat, P.; Mottron, L.; Cohen, D. Epilepsy in Autism is Associated with Intellectual Disability and Gender: Evidence from a Meta-Analysis. Biol. Psychiatry 2008, 64, 577–582. [Google Scholar] [CrossRef]
- Bryson, S.E.; Clark, B.S.; Smith, I.M. First Report of a Canadian Epidemiological Study of Autistic Syndromes. J. Child Psychol. Psychiatry 1988, 29, 433–445. [Google Scholar] [CrossRef]
- Hughes, J.R.; Melyn, M. EEG and Seizures in Autistic Children and Adolescents: Further Findings with Therapeutic Implications. Clin. EEG Neurosci. 2005, 36, 15–20. [Google Scholar] [CrossRef]
- Boutros, N.N.; Lajiness-O’Neill, R.; Zillgitt, A.; Richard, A.E.; Bowyer, S.M. EEG changes associated with autistic spectrum disorders. Neuropsychiatr. Electrophysiol. 2015, 1, 3. [Google Scholar] [CrossRef] [Green Version]
- Volkmar, F.R.; Nelson, D.S. Seizure Disorders in Autism. J. Am. Acad. Child Adolesc. Psychiatry 1990, 29, 127–129. [Google Scholar] [CrossRef] [PubMed]
- Rossi, P.G.; Parmeggiani, A.; Bach, V.; Santucci, M.; Visconti, P. EEG features and epilepsy in patients with autism. Brain Dev. 1995, 17, 169–174. [Google Scholar] [CrossRef]
- Kawasaki, Y.; Yokota, K.; Shinomiya, M.; Shimizu, Y.; Niwa, S.-I. Brief Report: Electroencephalographic Paroxysmal Activities in the Frontal Area Emerged in Middle Childhood and During Adolescence in a Follow-up Study of Autism. J. Autism Dev. Disord. 1997, 27, 605–620. [Google Scholar] [CrossRef] [PubMed]
- Tuchman, R.F.; Rapin, I. Regression in Pervasive Developmental Disorders: Seizures and Epileptiform Electroencephalogram Correlates. Pediatrics 1997, 99, 560–566. [Google Scholar] [CrossRef]
- Chez, M.G.; Chang, M.; Krasne, V.; Coughlan, C.; Kominsky, M.; Schwartz, A. Frequency of epileptiform EEG abnormalities in a sequential screening of autistic patients with no known clinical epilepsy from 1996 to 2005. Epilepsy Behav. 2006, 8, 267–271. [Google Scholar] [CrossRef]
- Kim, H.L.; Donnelly, J.H.; Tournay, A.E.; Book, T.M.; Filipek, P. Absence of Seizures Despite High Prevalence of Epileptiform EEG Abnormalities in Children with Autism Monitored in a Tertiary Care Center. Epilepsia 2006, 47, 394–398. [Google Scholar] [CrossRef]
- Spence, S.J.; Schneider, M.T. The Role of Epilepsy and Epileptiform EEGs in Autism Spectrum Disorders. Pediatric Res. 2009, 65, 599–606. [Google Scholar] [CrossRef]
- Hartley-McAndrew, M.E.; Weinstock, A. Autism Spectrum Disorder: Correlation between Aberrant Behaviors, EEG Abnormalities and Seizures. Neurol. Int. 2010, 2, 42–47. [Google Scholar] [CrossRef] [Green Version]
- Anukirthiga, B.; Mishra, D.; Pandey, S.; Juneja, M.; Sharma, N. Prevalence of Epilepsy and Inter-Ictal Epileptiform Discharges in Children with Autism and Attention-Deficit Hyperactivity Disorder. Indian J. Pediatrics 2019, 86, 897–902. [Google Scholar] [CrossRef]
- Keller, R.; Basta, R.; Salerno, L.; Elia, M. Autism, epilepsy, and synaptopathies: A not rare association. Neurol. Sci. 2017, 38, 1353–1361. [Google Scholar] [CrossRef] [PubMed]
- Daniel, W. Biostatistics: A Foundation for Analysis in the Health Sciences; John Wiley & Sons: Hoboken, NJ, USA, 1999. [Google Scholar]
- Scheffer, I.E.; Berkovic, S.; Capovilla, G.; Connolly, M.B.; French, J.; Guilhoto, L.; Hirsch, E.; Jain, S.; Mathern, G.W.; Moshé, S.L.; et al. ILAE classification of the epilepsies: Position paper of the ILAE Commission for Classification and Terminology. Epilepsia 2017, 58, 512–521. [Google Scholar] [CrossRef] [PubMed] [Green Version]
- Fisher, R.S.; Cross, J.H.; French, J.A.; Higurashi, N.; Hirsch, E.; Jansen, F.E.; Lagae, L.; Moshé, S.L.; Peltola, J.; Roulet Perez, E.; et al. Operational classification of seizure types by the International League Against Epilepsy: Position Paper of the ILAE Commission for Classification and Terminology. Epilepsia 2017, 58, 522–530. [Google Scholar] [CrossRef] [PubMed]
- Vittayakorn, S.; Satiansukpong, N.; Sung, -U.S.; Pongsaksri, M.; Phiraban, C.; Sasat, D. The effect of Thai elephant-assisted therapy program on sensory processing function in persons with autism. J. Assoc. Med. Sci. 2009, 42, 57. [Google Scholar]
- Satiansukpong, N. Reliability and Validity of Dunn’s Sensory Profile among Thai Children Living in Large Metropolitan Areas; New York University, School of Education: New York, NY, USA, 2002. [Google Scholar]
- Sunakarach, K.; Kessomboon, P. Validity and reliability of the Thai version of the Autism Treatment Evaluation Checklist: A two-phase diagnostic accuracy study. F1000Res 2018, 7, 538. [Google Scholar] [CrossRef] [Green Version]
- Fong, C.Y.; Tay, C.G.; Ong, L.C.; Lai, N.M. Chloral hydrate as a sedating agent for neurodiagnostic procedures in children. Cochrane Database Syst. Rev. 2017, 11, Cd011786. [Google Scholar] [CrossRef]
- Kuratani, J.; Pearl, P.L.; Sullivan, L.R.; Riel-Romero, R.M.S.; Cheek, J.; Stecker, M.M.; Orta, D.S.J.; Selioutski, O.; Sinha, S.R.; Drislane, F.W.; et al. American Clinical Neurophysiology Society Guideline 5: Minimum Technical Standards for Pediatric Electroencephalography. Neurodiagn. J. 2016, 56, 266–275. [Google Scholar] [CrossRef]
- Mickey, R.M.; Greenland, S. The Impact of Confounder Selection Criteria on Effect Estimation. Am. J. Epidemiol. 1989, 129, 125–137. [Google Scholar] [CrossRef]
- StataCorp. Stata Statistical Software: Release 15; StataCorp: College Station, TX, USA, 2017. [Google Scholar]
- Neurological Institute of Thailand. Clinical Practice Guidelines for Epilepsy; Tanapress: Bangkok, Thailand, 2016. [Google Scholar]

| Variable | Number | Percent | ||
|---|---|---|---|---|
| Characteristic | ||||
| Gender | ||||
| Female | 16 | 12.5 | ||
| Male | 112 | 87.5 | ||
| Age (years old) | ||||
| Median (Interquartile range) | 4.8 (3.9–6.2) | |||
| History of epilepsy | ||||
| Focal type | 12 | 9.4 | ||
| Generalized type | 2 | 1.6 | ||
| No | 114 | 89.0 | ||
| EEG testing | ||||
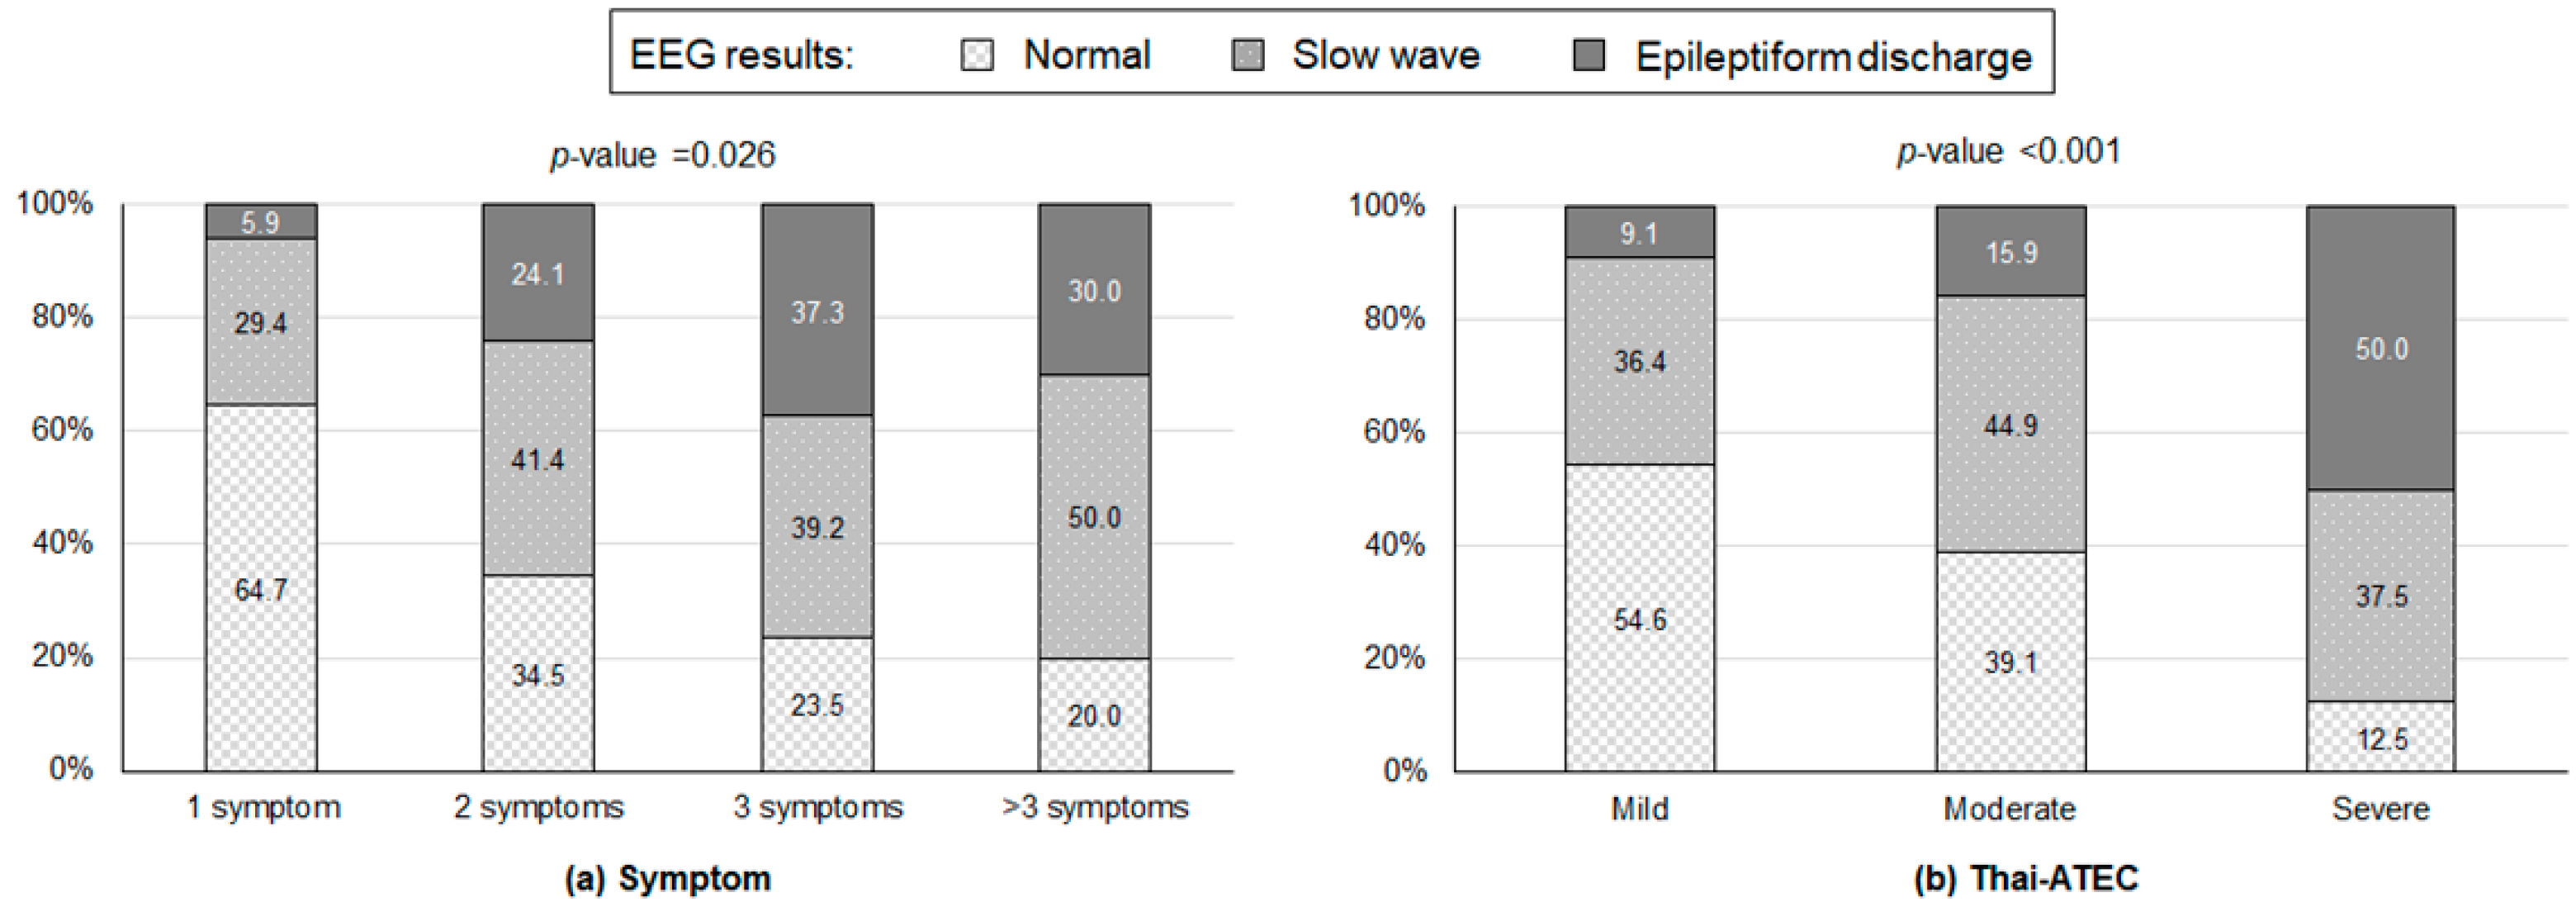
| Overall EEG results | ||||
| Normal | 39 | 30.5 | ||
| Slow-wave | 53 | 41.4 | ||
| Epileptiform-discharge | 36 | 28.1 | ||
| EEG of the frontal part | ||||
| Normal | 48 | 37.5 | ||
| Abnormal on the left | 9 | 7.0 | ||
| Abnormal on the right | 6 | 4.7 | ||
| Abnormal on the left and right | 65 | 50.8 | ||
| EEG of the temporal part | ||||
| Normal | 120 | 93.7 | ||
| Abnormal on the left | 1 | 0.8 | ||
| Abnormal on the right | 2 | 1.6 | ||
| Abnormal on the left and right | 5 | 3.9 | ||
| EEG of the parietal part | ||||
| Normal | 121 | 94.5 | ||
| Abnormal on the left | 3 | 2.4 | ||
| Abnormal on the right | 1 | 0.8 | ||
| Abnormal on the left and right | 3 | 2.3 | ||
| EEG of the occipital part | ||||
| Normal | 114 | 89.0 | ||
| Abnormal on the left | 2 | 1.6 | ||
| Abnormal on the left and right | 12 | 9.4 | ||
| EEG result in on central/mid part | ||||
| Normal | 116 | 90.6 | ||
| Abnormal | 12 | 9.4 | ||
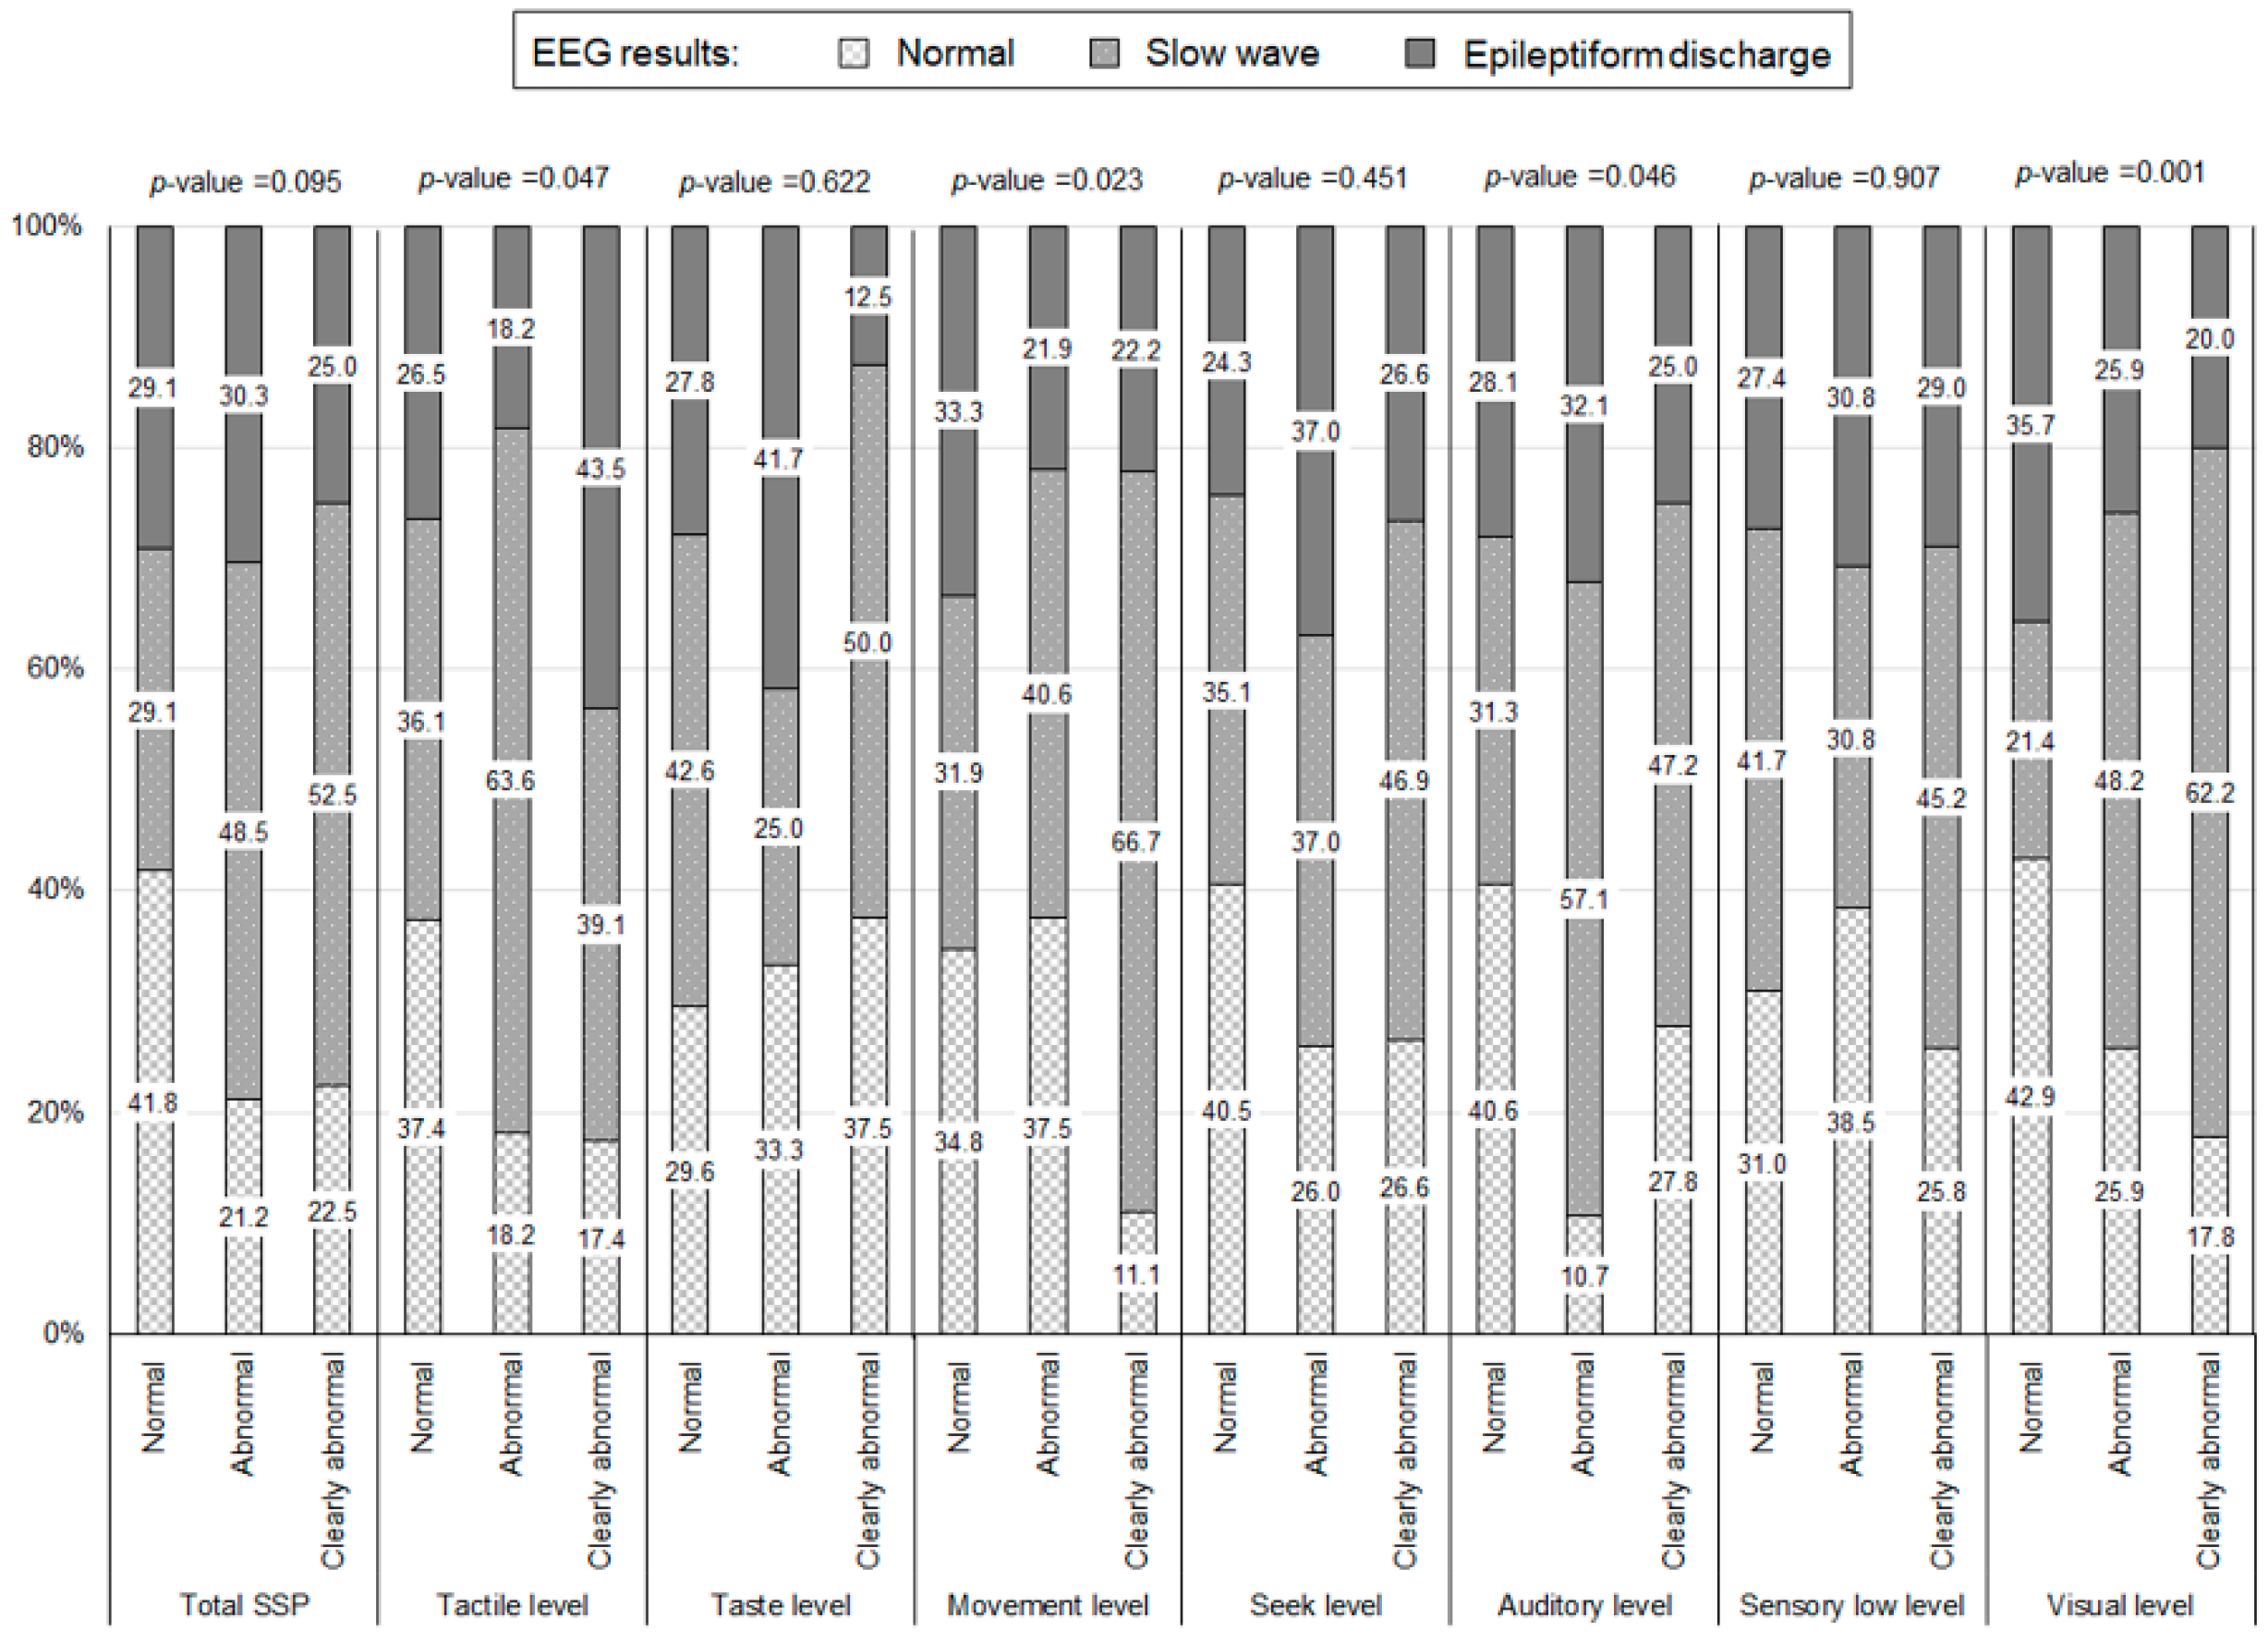
| SSP | ||||
| Tactile level | ||||
| Clearly abnormal | 23 | 18.0 | ||
| Abnormal | 22 | 17.2 | ||
| Normal | 83 | 64.8 | ||
| Taste level | ||||
| Clearly abnormal | 8 | 6.2 | ||
| Abnormal | 12 | 9.4 | ||
| Normal | 108 | 84.4 | ||
| Movement level | ||||
| Clearly abnormal | 27 | 21.1 | ||
| Abnormal | 32 | 25.0 | ||
| Normal | 69 | 53.9 | ||
| Seeking level | ||||
| Clearly abnormal | 64 | 50.0 | ||
| Abnormal | 27 | 21.1 | ||
| Normal | 37 | 28.9 | ||
| Auditory level | ||||
| Clearly abnormal | 36 | 28.1 | ||
| Abnormal | 28 | 21.9 | ||
| Normal | 64 | 50.0 | ||
| Sensory low level | ||||
| Clearly abnormal | 31 | 24.2 | ||
| Abnormal | 13 | 10.2 | ||
| Normal | 84 | 65.6 | ||
| Visual level | ||||
| Clearly abnormal | 45 | 35.2 | ||
| Abnormal | 27 | 21.1 | ||
| Normal | 56 | 43.7 | ||
| Overall | ||||
| Clearly abnormal | 40 | 31.2 | ||
| Abnormal | 33 | 25.8 | ||
| Normal | 55 | 43.0 | ||
| Thai-ATEC | ||||
| Overall Thai-ATEC level | ||||
| Mild | 11 | 8.6 | ||
| Moderate | 69 | 53.9 | ||
| Severe | 48 | 37.5 | ||
| Symptoms | n | N | Percent |
|---|---|---|---|
| One diagnosed | |||
| 1 | 17 | 5.9 |
| 2 | 17 | 11.8 |
| 2 | 17 | 11.8 |
| 1 | 17 | 5.9 |
| 11 | 17 | 64.7 |
| Two diagnosed | |||
| 3 | 29 | 10.3 |
| 3 | 29 | 10.3 |
| 1 | 29 | 3.5 |
| 18 | 29 | 62.1 |
| 2 | 29 | 6.9 |
| 2 | 29 | 6.9 |
| Three diagnosed | |||
| 1 | 51 | 1.96 |
| 1 | 51 | 1.96 |
| 5 | 51 | 9.8 |
| 1 | 51 | 1.96 |
| 1 | 51 | 1.96 |
| 4 | 51 | 7.84 |
| 1 | 51 | 1.96 |
| 3 | 51 | 5.88 |
| 4 | 51 | 7.84 |
| 12 | 51 | 23.53 |
| 13 | 51 | 25.49 |
| 2 | 51 | 3.92 |
| 1 | 51 | 1.96 |
| 2 | 51 | 3.92 |
| Four diagnosed | |||
| 1 | 23 | 4.4 |
| 2 | 23 | 8.7 |
| 8 | 23 | 34.8 |
| 3 | 23 | 13.0 |
| 1 | 23 | 4.4 |
| 8 | 23 | 34.8 |
| Five diagnosed | |||
| 1 | 6 | 16.7 |
| 1 | 6 | 16.7 |
| 3 | 6 | 50.0 |
| 1 | 6 | 16.7 |
| |||
| 1 | 1 | 100.0 |
| Variable | Univariable Ordinal Logistic Regression | Multivariable Ordinal Logistic Regression | |||||||||
|---|---|---|---|---|---|---|---|---|---|---|---|
| cOR | 95% CI of cOR | p-Value | aOR | 95% CI of aOR | p-Value | ||||||
| Gender | 0.564 | ||||||||||
| Female (ref.) | 1.00 | ||||||||||
| Male | 1.33 | 0.50 | - | 3.56 | - | - | - | - | - | ||
| History of epilepsy | 0.513 | ||||||||||
| No (ref.) | 1.00 | ||||||||||
| Yes | 0.70 | 0.24 | - | 2.04 | - | - | - | - | - | ||
| Tactile level | 0.118 | ||||||||||
| Normal (ref.) | 1.00 | - | - | - | - | - | |||||
| Abnormal | 1.32 | 0.58 | - | 3.02 | - | - | - | - | - | ||
| Clearly abnormal | 2.52 | 1.05 | - | 6.05 | - | - | - | - | - | ||
| Taste level | 0.638 | ||||||||||
| Normal (ref.) | 1.00 | - | - | - | - | - | |||||
| Abnormal | 1.31 | 0.41 | - | 4.22 | - | - | - | - | - | ||
| Clearly abnormal | 0.59 | 0.16 | - | 2.17 | - | - | - | - | - | ||
| Movement level | 0.423 | ||||||||||
| Normal (ref.) | 1.00 | - | - | - | - | - | |||||
| Abnormal | 0.71 | 0.32 | - | 1.56 | - | - | - | - | - | ||
| Clearly abnormal | 1.31 | 0.59 | - | 2.87 | - | - | - | - | - | ||
| Seeking level | 0.334 | ||||||||||
| Normal (ref.) | 1.00 | - | - | - | - | - | |||||
| Abnormal | 2.00 | 0.78 | - | 5.12 | - | - | - | - | - | ||
| Clearly abnormal | 1.51 | 0.71 | - | 3.22 | - | - | - | - | - | ||
| Auditory level | 0.156 | ||||||||||
| Normal (ref.) | 1.00 | - | - | - | - | - | |||||
| Abnormal | 2.23 | 0.99 | - | 5.02 | - | - | - | - | - | ||
| Clearly abnormal | 1.30 | 0.61 | - | 2.78 | - | - | - | - | - | ||
| Sensory low level | 0.879 | ||||||||||
| Normal (ref.) | 1.00 | - | - | - | - | - | |||||
| Abnormal | 0.89 | 0.29 | - | 2.72 | - | - | - | - | - | ||
| Clearly abnormal | 1.18 | 0.55 | - | 2.50 | - | - | - | - | - | ||
| Visual level | 0.786 | ||||||||||
| Normal (ref.) | 1.00 | - | - | - | - | - | |||||
| Abnormal | 1.22 | 0.52 | - | 2.89 | - | - | - | - | - | ||
| Clearly abnormal | 1.28 | 0.62 | - | 2.65 | - | - | - | - | - | ||
| Symptoms | 0.002 | 0.018 | |||||||||
| 1 (ref.) | 1.00 | ||||||||||
| 2 | 3.72 | 1.12 | - | 12.31 | 3.74 | 1.07 | - | 13.02 | |||
| >2 | 6.56 | 2.23 | - | 19.30 | 5.14 | 1.66 | - | 15.96 | |||
| Thai-ATEC | <0.001 | <0.001 | |||||||||
| Mild (ref.) | 1.00 | 1.00 | |||||||||
| Moderate | 1.86 | 0.54 | - | 6.37 | 1.36 | 0.38 | - | 4.89 | |||
| Severe | 9.23 | 2.48 | - | 34.34 | 6.25 | 1.62 | - | 24.20 | |||
| Predictive Model Results | Actual EEG Results | |||||
|---|---|---|---|---|---|---|
| Normal (n = 39) | Slow-Wave (n = 53) | Epileptiform-Discharge (n = 36) | ||||
| n/N | % | n/N | % | n/N | % | |
| Normal (n = 16) | 10/16 | 62.5 | 6/16 | 37.5 | 0/16 | 0.0 |
| Slow-wave (n = 67) | 25/67 | 37.3 | 29/67 | 43.3 | 13/67 | 19.4 |
| Epileptiform-discharge (n = 45) | 4/45 | 8.9 | 18/45 | 40 | 23/45 | 51.1 |
| Probability of an Abnormal EEG (Percent) | |||||
|---|---|---|---|---|---|
| Pattern | Symptoms | Thai-ATEC Level | Normal | Slow-Wave | Epileptiform-Discharge |
| 1 | 1 | Mild | 77.13 | 19.44 | 3.43 |
| 2 | 1 | Moderate | 47.44 | 40.86 | 11.70 |
| 3 | 1 | Severe | 39.60 | 44.97 | 15.43 |
| 4 | 2 | Mild | 71.23 | 24.16 | 4.61 |
| 5 | 2 | Moderate | 39.86 | 44.85 | 15.29 |
| 6 | 2 | Severe | 32.50 | 47.60 | 19.90 |
| 7 | >2 | Mild | 35.03 | 46.82 | 18.15 |
| 8 | >2 | Moderate | 12.61 | 42.08 | 45.31 |
| 9 | >2 | Severe | 9.49 | 37.22 | 53.29 |
Publisher’s Note: MDPI stays neutral with regard to jurisdictional claims in published maps and institutional affiliations. |
© 2022 by the authors. Licensee MDPI, Basel, Switzerland. This article is an open access article distributed under the terms and conditions of the Creative Commons Attribution (CC BY) license (https://creativecommons.org/licenses/by/4.0/).
Share and Cite
Tangviriyapaiboon, D.; Traisathit, P.; Siripornpanich, V.; Suyakong, C.; Apikomonkon, H.; Homkham, N.; Thumronglaohapun, S.; Srikummoon, P. Detection of Electroencephalographic Abnormalities and Its Associated Factors among Children with Autism Spectrum Disorder in Thailand. Healthcare 2022, 10, 1969. https://doi.org/10.3390/healthcare10101969
Tangviriyapaiboon D, Traisathit P, Siripornpanich V, Suyakong C, Apikomonkon H, Homkham N, Thumronglaohapun S, Srikummoon P. Detection of Electroencephalographic Abnormalities and Its Associated Factors among Children with Autism Spectrum Disorder in Thailand. Healthcare. 2022; 10(10):1969. https://doi.org/10.3390/healthcare10101969
Chicago/Turabian StyleTangviriyapaiboon, Duangkamol, Patrinee Traisathit, Vorasith Siripornpanich, Chidawan Suyakong, Hataichanok Apikomonkon, Nontiya Homkham, Salinee Thumronglaohapun, and Pimwarat Srikummoon. 2022. "Detection of Electroencephalographic Abnormalities and Its Associated Factors among Children with Autism Spectrum Disorder in Thailand" Healthcare 10, no. 10: 1969. https://doi.org/10.3390/healthcare10101969
APA StyleTangviriyapaiboon, D., Traisathit, P., Siripornpanich, V., Suyakong, C., Apikomonkon, H., Homkham, N., Thumronglaohapun, S., & Srikummoon, P. (2022). Detection of Electroencephalographic Abnormalities and Its Associated Factors among Children with Autism Spectrum Disorder in Thailand. Healthcare, 10(10), 1969. https://doi.org/10.3390/healthcare10101969