Article

Advanced Models for Modulus and Strength of Carbon-Nanotube-Filled Polymer Systems Assuming the Networks of Carbon Nanotubes and Interphase Section

1
Breast Cancer Research Center, Biomaterials and Tissue Engineering Research Group, Department of Interdisciplinary Technologies, Motamed Cancer Institute, ACECR, Tehran 15179-64311, Iran
2
Department of Mechanical Engineering (BK21 Four), College of Engineering, Kyung Hee University, Yongin 449-701, Gyeonggi, Korea
*
Author to whom correspondence should be addressed.
Mathematics 2021, 9(9), 990; https://doi.org/10.3390/math9090990
Submission received: 30 March 2021 / Revised: 22 April 2021 / Accepted: 26 April 2021 / Published: 28 April 2021
(This article belongs to the Special Issue Mathematical Modeling and Simulation in Mechanics and Dynamic Systems)

Abstract

:
This study focuses on the simultaneous stiffening and percolating characteristics of the interphase section in polymer carbon nanotubes (CNTs) systems (PCNTs) using two advanced models of tensile modulus and strength. The interphase, as a third part around the nanoparticles, influences the mechanical features of such systems. The forecasts agree well with the tentative results, thus validating the advanced models. A CNT radius of >40 nm and CNT length of <5 μm marginally improve the modulus by 70%, while the highest modulus development of 350% is achieved with the thinnest nanoparticles. Furthermore, the highest improvement in nanocomposite’s strength (350%) is achieved with the CNT length of 12 μm and interfacial shear strength of 8 MPa. Generally, the highest ranges of the CNT length, interphase thickness, interphase modulus and interfacial shear strength lead to the most desirable mechanical features.

1. Introduction

Carbon nanotubes (CNTs) have attracted considerable interest due to their outstanding physical and mechanical features [1,2,3,4,5,6,7]. Since the CNTs have an exceptionally high Young’s modulus and tensile strength, they are used as fortifications in polymers to form polymer nanocomposites (PCNTs) [8,9,10,11,12]. Nevertheless, the CNTs incline to form agglomerates owing to van der Waals attraction, which reduces their surface area, disturbs net formation and eventually, weakens the mechanical features of nanocomposites [13]. Therefore, a satisfactory CNT dispersion is essential to exploit the potential of nanoparticles as reinforcing agents.
The joined net of the CNTs is produced after the percolation onset [14,15,16]. In fact, the percolation onset is the minimum filler concentration that can lead to net formation in a medium. Moreover, the electrical conductivity of the system increases prominently after the percolation onset. Studies have attempted to obtain a low percolation onset by altering material- and fabrication-related factors [16,17]. The percolation onset can affect the mechanical features of systems [18,19,20]. Favier et al. [21] correlated the high shear modulus of films composed of cellulose whiskers to the percolation onset and formation of the net. Accordingly, development of the percolated microstructures significantly enhances the mechanical features of such materials. Most models for estimating the percolation onset have the functional form of a power law [22]. These models, which fairly predict the electrical conductivity of composites, have been used to model the mechanical features of composites since percolation of electrical conductivity tends to occur along with mechanical percolation. However, they do not consider microstructural mechanisms other than connectivity in the modeling process.
The interface/interphase section in the system originates from a perturbation of media in the presence of nanoparticles (interfacial bonding between phases) or interference in the mobility of long polymer chains [23,24,25]. Actually, the extremely large surface area per unit volume of nanoparticles and the robust interfacial connections lead to formation of a significant third phase as an interphase section in the nanocomposites [26,27,28,29,30]. The interphase is created between the polymer matrix and nanoparticles, which is different from both the polymer and nanoparticles. The interphase section is tougher than the polymer matrix reinforcing the nanocomposites. It was reported that the viscoelastic behavior of the PCNTs depends on the interface state and consequently, the functionalization of CNT surfaces is essential for using the CNTs [31]. Hence, the interphase should be considered to realize unforeseen trends in the features of a nanocomposite. Figure 1 schematically depicts a CNT and the surrounding interphase in a polymer system.
Many researchers have attempted to characterize the interface/interphase features. Generally, it has been reported that the dimensions and stiffness of the interphase are the main factors affecting the mechanical behavior of systems. Therefore, the interphase plays a reinforcing role in the mechanical testing of systems. The percolation onset may occur in the interphase section since it accelerates formation of a connected structure before the physical assembly of nanoparticles. The positive effect of interfacial interaction on the percolation onset has been confirmed and it is indicative of interphase percolation [32]. Interphase percolation has been studied based on the extension of the filler-excluded volume [33,34].
Although existing studies have considered the reinforcing feature of the interphase, percolation of the interphase section has not been clarified adequately. The interphase section can accelerate the percolation onset in PCNTs, resulting in a new approach for the formation of the network structure and significant improvement in the mechanical features. In this work, two advanced models of the tensile modulus and strength of systems are proposed to express the stiffening and percolating characteristics of the interphase in PCNTs. Likewise, the excluded volume of nanoparticles assumes the role of the interphase section in the percolation onset. The predictions of the proposed advanced models are compared to the tentative ranks of several examples. Finally, the influences of various factors on the mechanical features of systems are plotted considering the strengthening and percolating roles of the interphase section. The advanced models are helpful and valuable to predict and optimize the tensile modulus and strength of the PCNTs assuming the stiffening and percolating characteristics of the interphase section.

2. Upgrading of Models and Equations

The Halpin–Tsai model supposes the perfect stress transference between the polymer medium and a filler and the random three-dimensional (3D) arrangement of the filler [35] as:
E L = E m ( 1 + 2 α η φ f 1 η φ f )
E T = E m ( 1 + 0.5 φ f 1 φ f )
η = E f / E m 1 E f / E m + 2 α
α = l d
where EL and ET are the moduli in the longitudinal and transverse directions, respectively. Moreover, Em and Ef denote the Young’s moduli of the polymer media and the filler, respectively and φ f denotes the filler volume fraction. In addition, α is the aspect ratio of the filler and l and d denote the length and diameter of the particles, respectively. Moreover, ER the relative modulus (nanocomposite’s modulus per media modulus) for a random 3D arrangement of the fillers is as follows:
E R = 1 5 E L E m + 4 5 E T E m
This model does not consider the reinforcing effect of the interphase section. Therefore, it incorrectly predicts the modulus of systems. The above equations can be improved by assuming the interphase section. Accordingly, the interphase is considered as a separate phase that reinforces the systems apart from the nanoparticles. In fact, the dimensions and concentration of the interphase are assumed to be similar to those of the nanoparticles since both the nanoparticles and the interphase section reinforce a system simultaneously. The advanced equations are given as:
E L = E m ( 1 + 2 α f η f φ f + 2 α i η i φ i 1 η f φ f η i φ i )
E T = E m ( 1 + 0.5 φ f + + 0.5 φ i 1 φ f φ i )
η f = E f / E m 1 E f / E m + 2 α f
η i = E i / E m 1 E i / E m + 2 α i
α i = l t
where the subscripts f and i denote the filler and the interphase, respectively. Moreover, αi denotes the aspect ratio of the interphase around the nanoparticles and t denotes the thickness of the interphase section. These equations express the reinforcing effect of the interphase in systems. The interphase modulus (Ei) is an intermediate quantity between Ef and Em and its value provides information on the quality of the interphase section. The modulus of a nanocomposite, calculated using this model, depends on φ f , R, l, Ef and Em, which are the factors of the classical Halpin–Tsai model, as well as on the additional factors due to the interphase section, namely, t and Ei. The advanced model assuming the interphase area does not consider the perfect stress transfer between the polymer and the filler since it correlates the extent of stress transferred to the interphase features.
For systems containing cylindrical fillers, the volume portion of the interphase φ i is defined [36] as:
φ i = φ f [ ( 1 + t R ) 2 1 ]
where R is the radius of the nanotubes (R = d/2). By substituting Equation (11) into Equations (6) and (7), the modulus can be correlated to the characteristics of the polymer media, nanoparticles and interphase section.
Chatterjee [37] proposed a relationship between the percolation onset and the aspect ratio of CNTs as follows:
φ p 1 α f
By substituting αf (the aspect ratio of the CNT as l/d) from Equation (12) into Equation (6), the modulus can be expressed in terms of the percolation onset. However, the interphase section swells the CNT nets and accelerates the percolation onset. Assuming the existence of interphase section, the percolation onset of nanoparticles in the PCNTs can be expressed in terms of the CNT volume (V) and excluded volume around CNTs (Vex) [38] as:
φ p = V V e x = π R 2 l + ( 4 / 3 ) π R 3 32 3 π ( R + t ) 3 [ 1 + 3 4 ( l R + t ) + 3 32 ( l R + t ) 2 ]
Clearly, the CNT volume does not change due to the interphase part, while the excluded volume is assumed to increase to R + t due to the interphase section. When this equation is compared to the tentative rank of percolation onset, the value of t is obtained, whereas Equation (12) does not consider the interphase section. Moreover, it is possible to calculate the percolation onset in a sample using the CNT dimensions and interphase thickness. It is necessary to precisely determine the percolation onset to compute the minimum CNT concentration required for the formation of CNT nets in systems. We added the interphase part to the terms EL, ET and φ p and developed the terms η i , αi and φ i by assuming the interphase section. All of these terms assume the role of the interphase section in the stiffening of systems. By substituting φ p from the above equation into Equations (6) and (8) (αf = 1/ φ p ), the modulus of PCNTs can be expressed by assuming the reinforcing and networking effects of the interphase section.
We proposed a model to determine the tensile strength of the PCNTs by assuming the interphase features in our previous work [39]:
σ c = η o α f τ ( 1 + t R ) φ f + σ m [ 1 ( 1 + t R ) 2 φ f ]
where σm denotes the media strength. In addition, ηo is an orientation factor (1 for full filler arrangement, 3/8 for arbitrary in-plane 2D location and 1/5 for haphazard 3D filler organization). Moreover, τ denotes the interfacial shear strength. This equation considers the reinforcing effect of the interphase in PCNTs.
By substituting αf (αf = 1/ φ p ) from Equation (13) into the above model, the tensile strength can be expressed by simultaneously considering the stiffening and percolating influences of the interphase section. The relative strength (nanocomposite’s strength per media strength) can be computed by rearranging Equation (14) as:
σ R = 1 + η o α f τ ( 1 + t R ) φ f σ m ( 1 + t R ) 2 φ f
Moreover, it was suggested that τ is correlated to the interfacial factor, B in the Pukanszky model [39] as:
τ = σ m ( B 2.04 ) η o α f
By substituting τ from Equation (16) into Equation (15), one can calculate the relative strength as follows:
σ R = 1 + ( B 2.04 ) ( 1 + t R ) φ f ( 1 + t R ) 2 φ f
Pukanszky [40] recommended the following model to determine the strength of a system by:
σ R = 1 φ f 1 + 2.5 φ f exp ( B φ f )
where B displays a measurable rank for filler–media interaction/linkage as:
B = ( 1 + A c d f t ) ln ( σ i σ m )
where Ac and df are the specific surface area and density of the filler, respectively. Similarly, σi is the interphase strength. The Pukanszky model can be restructured as follows:
ln ( σ R 1 + 2.5 φ f 1 φ f ) = B φ f
One can calculate B based on the linear association between ln ( σ R 1 + 2.5 φ f 1 φ f ) and φ f . The value of B is calculated using the tentative ranks of strength determined using the latter relationship. This rank is then used in Equation (17) to express the tensile strength in terms of the interphase thickness and other material factors. There are many types of CNTs such as single-walled nanotubes (SWNTs) and multi-walled nanotubes (MWNTs). The improved models can be applied for all types of long CNTs.

3. Results and Discussion

3.1. Confirming Views

The concurrent stiffening and percolating features of the interphase section in the PCNTs are described in this section using the proposed advanced models. The models are first applied to estimate the modulus and strength of some specimens described in the literature. The tentative ranks of samples are fitted to the proposed models. Based on the fitting results, the values of all of the interphase terms are calculated. The ranks of t and Ei are obtained by fitting Equations (6)–(10) to the tentative ranks. Additionally, τ and B are calculated by fitting Equations (16) and (17) to the tentative ranks of strength. These equations may yield dissimilar values of each interphase term, but we report the average and reasonable ranks for the examples considered herein. Moreover, the models are used to demonstrate influences of all the factors on the modulus and strength of PCNTs.

3.2. Tensile Modulus

Figure 2 shows the tentative points of the relative modulus and the forecasts made using the advanced model (Equations (6)–(10)) for the polyamide 6 (PA6)/multi-walled carbon nanotubes (MWCNTs) [41], epoxy/MWCNTs [42], phenolic/MWCNTs [43] and PA6/MWCNTs-NH2 [44] samples. The forecasted values agree well with the tentative ranges, thus validating the ability of the advanced model to calculate the modulus. This model usually provides superior forecasts at low volume proportions of nanoparticles since the deficient dispersion of nanoparticles at high filler percentages may lead to deviations from the forecasts.
According to the expressed equations, the advanced model can forecast the modulus using suitable values of several factors. The material factors, such as R, Em and l can be found in the original references reporting the mentioned samples. Moreover, the rank of Ef is reflected as 1000 GPa according to [45]. Consequently, the values of the interphase factors, including t and Ei, can be computed by applying the tentative ranks to the advanced model. This technique forecasts the interphase features using the tentative outputs of the modulus.
In the case of the PA6/MWCNTs, t and Ei are calculated as 4 nm and 10 GPa, respectively. Moreover, in the case of the epoxy/MWCNTs sample, t = 14 nm and Ei = 70 GPa, based on the fitting of the tentative data to the advanced model. Moreover, the computed values of t and Ei for the phenolic/MWCNTs system are 25 nm and 130 GPa, respectively, while those for the PA6/MWCNTs-NH2 system are 25 nm and 50 GPa. As identified, the interphase thickness cannot be higher than the radius of gyration of the macromolecules. Moreover, the interphase modulus varies between the values of the media modulus and the filler stiffness, that is, Em < Ei < Ef. According to these criteria, the calculations of the interphase features are correct. Therefore, the advanced model provides correct ranks for the interphase attributes of the PCNTs.
The calculations indicate different ranks of the interphase within the reported samples. The best interphase is formed in the case of the phenolic/MWCNTs system, while the poorest interphase is formed in the case of the PA6/MWCNTs sample. The interphase thickness and modulus depend on the interfacial interaction/attachment between the polymer media and the nanoparticles [46,47]. Researchers have applied different methods to improve the interfacial features such as modification of the nanofiller surface or use of compatibilizers [48]. According to the above calculations, the best and the poorest interfacial features are obtained in the case of the phenolic/MWCNTs and PA6/MWCNTs samples, respectively.
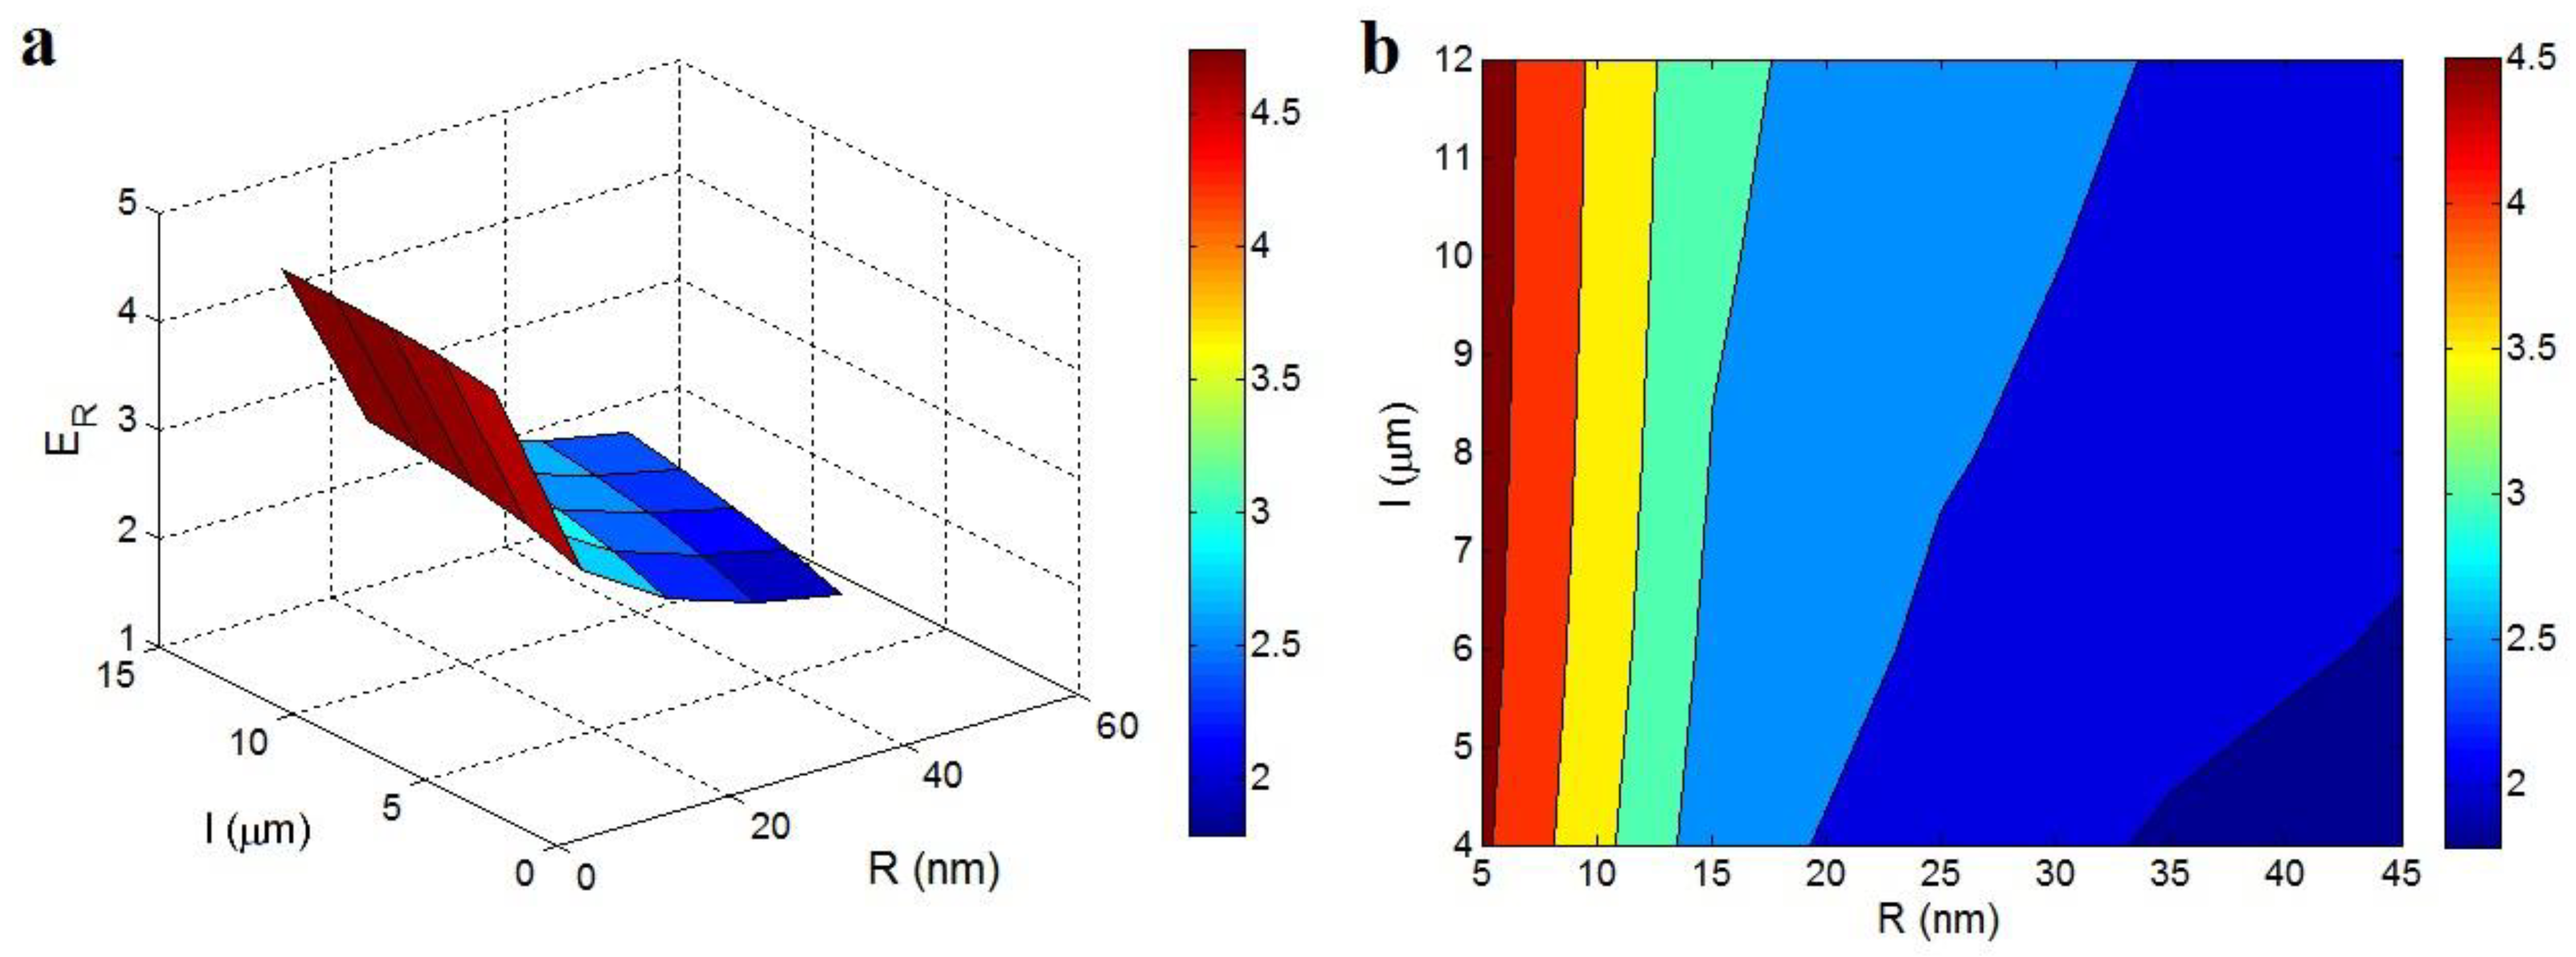
Figure 3 reveals the effects of R and l on the modulus, computed using the advanced model at the normal ranks of Em = 2 GPa, φ f = 0.02, Ef = 1000 GPa, Ei = 100 GPa and t = 10 nm. The modulus is low when R is large and l is small, while the thinnest nanotubes yield the highest modulus. These comments indicate the undesirable effects of thick and small nanotubes and the desirable effects of thin nanoparticles on the modulus of PCNTs. ER improves by approximately 70 % upon the addition of nanotubes with R > 40 nm and l < 5 μm, while we get the best relative modulus of 4.5 when R = 5 nm. Therefore, it is significant to use thin nanoparticles when producing these systems. However, the nanoparticles tend to aggregate/agglomerate [49,50], which increases their thickness. Thus, the aggregation/agglomeration of nanoparticles should be prevented to control their thickness.
A low rank of R increases the extent of the surface area of nanoparticles, which increases the interfacial area/interaction, since smaller nanoparticles induce stronger interfacial contact with the polymer media owing to the analogous sizes of the nanoparticles and the macromolecules, which is also called the nano-effect [51]. Therefore, smaller nanoparticles increase the interfacial/interphase area and strengthen the interfacial communication. Since a larger and stronger interphase leads to stronger reinforcement in such systems, the advanced model properly predicts the influence of nanoparticle size on the modulus.
Figure 4 additionally illustrates the roles of the interphase factors in the relative modulus, as determined using the advanced model at Em = 2 GPa, φ f = 0.02, Ef = 1000 GPa, l = 5 μm and R = 10 nm. The maximum modulus is observed at the uppermost ranks of t and Ei. The relative modulus of 7.5 is obtained with t = 25 nm and Ei = 250 GPa. However, the modulus decreases as the values of the interphase features decrease, for example, t = 5 nm and Ei = 50 GPa lead to ER = 2.7. Therefore, the interphase features directly affect the modulus according to the advanced model. These ranges are commonsensical since the interphase acts as a reinforcing agent in the systems.
A thicker interphase produces a stronger nanocomposite, since a thicker interphase shows the stronger connections between the polymer matrix and nanoparticles, which can bear and transfer more stress during loading [52,53]. In fact, a thick interphase reveals the strong interfacial attachments reinforcing the samples. Moreover, the interphase section helps accelerate the percolation onset in the PCNTs owing to the connections within the section. Certainly, a denser interphase accelerates the formation of connections in the interphase area, which advances the percolation onset. Therefore, the effect of interphase thickness on the modulus is reasonable. Moreover, a strong interphase stops the separation of nanoparticles from the polymer media in the loading process. Therefore, a greater amount of stress can be transferred from the polymer media to the nanoparticles without debonding, thus leading to a high range of modulus.

3.3. Tensile Strength

Figure 5 compares the tentative ranks of the relative strength with the forecasts obtained using the advanced model (Equation (17)) for the poly (vinyl alcohol) (PVA)/MWCNTs [54], polysilsesquioxane (PSE)/MWCNTs [55], chitosan/MWCNTs [56] and poly (phenylene sulfide) (PPS)/MWCNTs [57] systems. The forecasts follow the tentative ranges for all the systems. Therefore, the advanced model can appropriately forecast the tensile strength.
By comparing the tentative ranks to the forecasts obtained using the proposed model, the value of t can be calculated for the samples. To calculate τ from Equation (16), B should be determined using the tentative ranks of strength and the Pukanszky model. B is calculated as 17.18, 145.5, 118.3 and 26.43, respectively, for the PVA/MWCNTs, PSE/MWCNTs, chitosan/MWCNTs and PPS/MWCNTs systems. With the abovementioned values, the values of τ are calculated to be 3.8, 3.54, 12.9 and 1.18 MPa, respectively for the mentioned samples. Based on the values of B and those of other factors, such as R, l and σm reported in the original references, the values of t are predicted as 4, 7, 8 and 10 nm, respectively, for the PVA/MWCNTs, PSE/MWCNTs, chitosan/MWCNTs and PPS/MWCNTs systems. Hence, the advanced model can be used to compute t by assuming the fortifying and percolating characteristics of the interphase section. Moreover, the advanced model can be used to compare the interphase conditions of several samples. The interphase condition is illustrative of interfacial interaction/attachment, which controls the mechanical features of a system. Among the samples, the PPS/MWCNTs system exhibits the best interfacial/interphase features, while the PVA/MWCNTs system shows the poorest interphase section.
Figure 6 shows the influences of R and φ f on the relative strength using Equation (17) with σm = 40 MPa, l = 10 μm, B = 30 and t = 10 nm. As expected, a high volume proportion of thin nanoparticles increase the strength greatly. The σR rank of 4.5 is achieved with R = 5 nm and φ f = 0.05, whereas σR = 1.3 is obtained for R > 25 nm and φ f < 0.014. Accordingly, the size and concentration of the CNTs significantly alter the strength of systems. Small nanoparticles generate a large surface area, thus intensifying the interfacial interaction (nano-effect) [51]. The interphase power depends on the interfacial communication/linkage and therefore, thin CNTs strengthen the interphase area in systems. Consequently, thin nanotubes increase the strength of systems owing to the higher ranks of interfacial range/contacts/bonding between thinner CNTs and polymer media.
The overall strength of a sample depends on the interfacial/interphase features between the polymer media and the nanofillers [58,59] since the stress is transferred through the interphase section. Moreover, a high nanoparticle content leads to a significant increase in strength since the strength of the CNTs is considerably higher (11–50 GPa) than that of polymer media (up to 60 MPa). However, good dispersion of nanoparticles is assumed in the advanced model and the aggregation/agglomeration of nanoparticles at high φ f may reduce the strength of a system. Generally, the advanced model shows the reasonable effects of R and φ f on the strength by considering the stiffening and percolation of the interphase section.
Figure 7 shows the influences of l and τ on the relative strength as determined using the advanced model at σm = 40 MPa, φ f = 0.02, R = 10 nm and t = 10 nm. The highest relative strength of 4.5 is expectedly observed at the maximum ranks of l and τ, that is, l = 12 μm and τ = 8 MPa. The poorest relative strength of 1.25 is observed at the least ranks of l = 4 μm and τ = 2 MPa. Consequently, l and τ positively influence the strength of the systems.
A long nanotube can promote the interfacial extent, which enhances the mechanical involvement between the polymer media and the nanoparticles. Moreover, it increases the aspect ratio, which increases the overall system’s strength [60]. Furethermore, a high rank of the interfacial shear strength τ indicates the strong interfacial interaction/adhesion, which leads to formation of a strong interphase. As stated, a strong interphase mainly strengthens the system due to the fortifying efficiency of the interphase as the third phase in addition to the polymer media and the nanoparticles. The reinforcing effect of the interphase in systems has been extensively validated in tentative and theoretical studies [61,62].
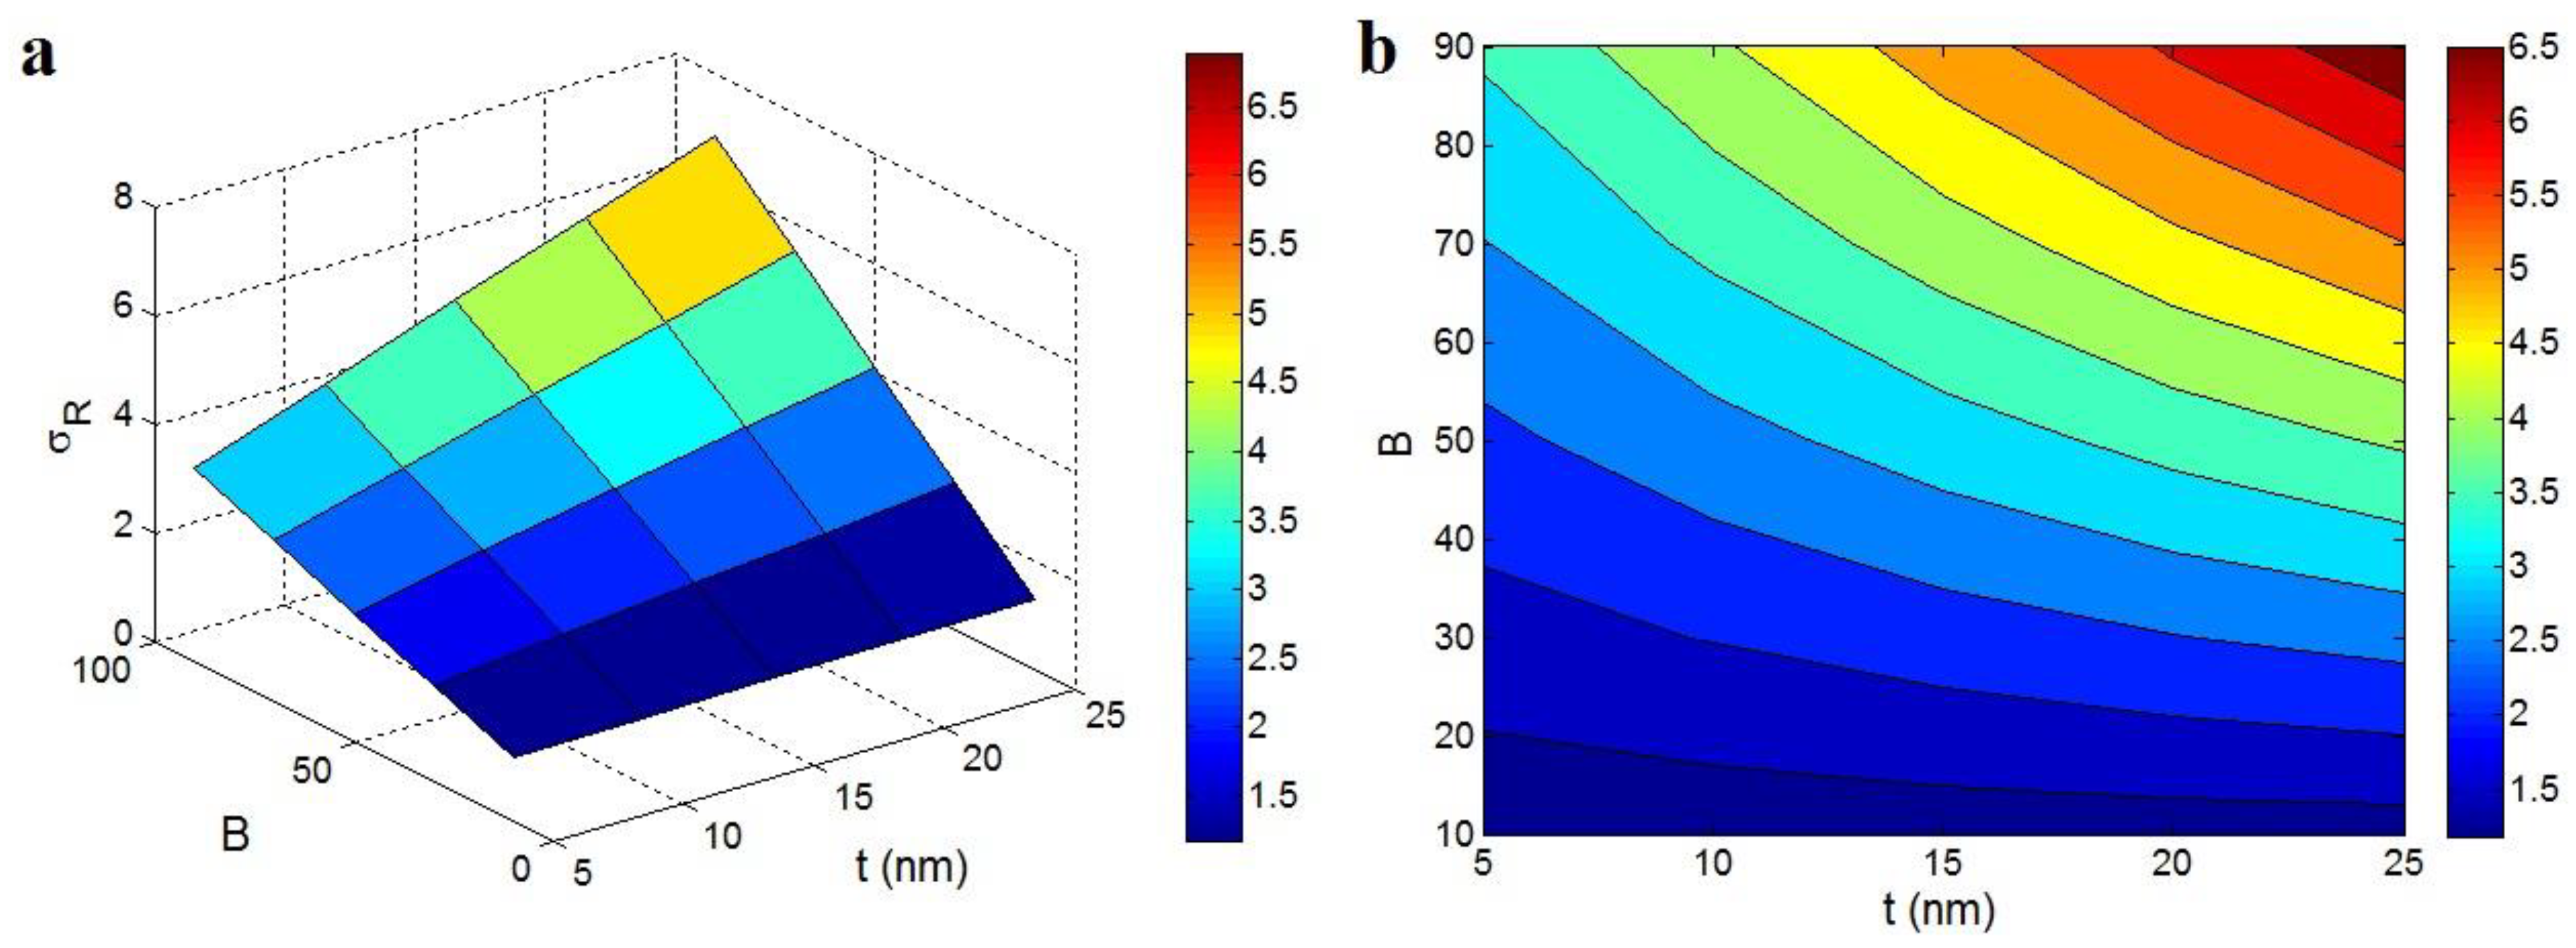
Figure 8 additionally shows the relative strength determined using the advanced model in terms of the interfacial/interphase factors, t and B at σm = 40 MPa, φ f = 0.02, l = 10 μm and R = 10 nm. The worst outputs are obtained for the lowest ranges of these factors, while the best outputs are obtained for the highest values of t and B. Consequently, these factors directly affect the tensile strength and a significant strength enhancement is achieved with a thick interphase and high B, that is, substantial interfacial features. The maximum σR of 6.5 is observed at t = 25 nm and B = 90, whereas a slight improvement in strength is achieved with the lowest ranks of t and B. This trend is sensible since the high ranks of these factors promote the reinforcing and percolation effects of the interphase section. A denser interphase leads to a greater interphase concentration in systems, which increases the strength.
The positive influence of a thick interphase on the mechanical features of systems has been established in the literature [35,63]. Likewise, a thick interphase easily percolates in a system, which accelerates the percolation onset. The networking of nanoparticles improves the mechanical features considerably. Consequently, it is expected that a thicker interphase will increase the strength. The direct relationship between the strength of a nanocomposite and B is common in systems, according to the Pukanszky model (Equation (18)). The rank of B reveals the features of the interphase section, such as t and σi (Equation (19)). A higher value of B indicates a thicker and stronger interphase section, which leads to a stronger system based on the strengthening and percolating influences of the interphase section. Hence, the advanced equations accurately illustrate the effects of t and B on the strength of a nanocomposite.

4. Conclusions

Two models were improved for determining the modulus and strength of systems and used to investigate the fortifying and percolating characteristics of the interphase section in PCNTs. The forecasts generated by both models exhibited a good match with the tentative ranges, which validated the modulus and strength values calculated using the advanced models. In addition, the tentative ranges and the advanced models were used to determine the interphase features. The undesirable effects of thick and small nanotubes and the desirable effects of thin nanoparticles on the modulus were observed. The ER improved by only approximately 70% when R > 40 nm and l < 5 μm, but the maximum relative modulus of 4.5 was obtained with the lowest value of R of 5 nm. Likewise, the best modulus was detected with the highest ranges of t and Ei. The highest relative modulus of 7.5 was achieved with t = 25 nm and Ei = 250 GPa. Consequently, t, Ei and l positively influenced the stiffness of systems. A high concentration of thin nanoparticles led to considerable increase in strength, as determined using the advanced model. A σR grade of 4.5 was obtained with R = 5 nm and φ f = 0.05, whereas σR = 1.3 was obtained with R > 25 nm and φ f < 0.014. The greatest relative strength of 4.5 was acquired with the maximum ranges of l and τ. However, the poorest relative strength of 1.25 was observed at the minimum series of l = 4 μm and τ = 2 MPa. Moreover, the best grades of the advanced model for strength were obtained with the highest ranks of t and B since they indicate the magnitude of the interfacial/interphase features. Generally, the strength of a nanocomposite meaningfully improves as the values of φ f , l, τ, t and B increase largely, although a high value of R (thick CNTs) decreases the strength.

Author Contributions

Formal analysis, Y.Z.; Funding acquisition, K.R.; Methodology, Y.Z. and K.R.; Validation, K.R.; Writing—original draft, Y.Z.; Writing—review & editing, K.R. All authors have read and agreed to the published version of the manuscript.

Funding

This research received no external funding.

Institutional Review Board Statement

Not applicable.

Informed Consent Statement

Not applicable.

Data Availability Statement

Not applicable.

Acknowledgments

This work was supported by the Basic Science Research Program through the National Research Foundation of Korea (NRF) funded by the Ministry of Education, Science and Technology (project number: 2020R1A2B5B02002203).

Conflicts of Interest

The authors declare no conflict of interest.

References

  1. Khan, A.A.P.; Bazan, G.C.; Alhogbi, B.G.; Marwani, H.M.; Khan, A.; Alam, M.; Rahman, M.M.; Asiri, A.M. Nanocomposite cross-linked conjugated polyelectrolyte/MWCNT/poly (pyrrole) for enhanced Mg2+ ion sensing and environmental remediation in real samples. J. Mater. Res. Technol. 2020, 9, 9667–9674. [Google Scholar] [CrossRef]
  2. Kim, S.; Zare, Y.; Garmabi, H.; Rhee, K.Y. Variations of tunneling properties in poly (lactic acid)(PLA)/poly (ethylene oxide)(PEO)/carbon nanotubes (CNT) nanocomposites during hydrolytic degradation. Sens. Actuators A Phys. 2018, 274, 28–36. [Google Scholar] [CrossRef]
  3. Zare, Y.; Rhee, K.Y. Expression of normal stress difference and relaxation modulus for ternary nanocomposites containing biodegradable polymers and carbon nanotubes by storage and loss modulus data. Compos. Part B Eng. 2018, 158, 162–168. [Google Scholar] [CrossRef]
  4. El Sayed, A.M. Synthesis, optical, thermal, electric properties and impedance spectroscopy studies on P (VC-MMA) of optimized thickness and reinforced with MWCNTs. Results Phys. 2020, 17, 103025. [Google Scholar] [CrossRef]
  5. Zare, Y.; Rhee, K.Y. Following the morphological and thermal properties of PLA/PEO blends containing carbon nanotubes (CNTs) during hydrolytic degradation. Compos. Part B Eng. 2019, 175, 107132. [Google Scholar] [CrossRef]
  6. Zare, Y.; Rhee, K.Y. A power model to predict the electrical conductivity of CNT reinforced nanocomposites by considering interphase, networks and tunneling condition. Compos. Part B Eng. 2018, 155, 11–18. [Google Scholar] [CrossRef]
  7. Behdinan, K.; Moradi-Dastjerdi, R.; Safaei, B.; Qin, Z.; Chu, F.; Hui, D. Graphene and CNT impact on heat transfer response of nanocomposite cylinders. Nanotechnol. Rev. 2020, 9, 41–52. [Google Scholar] [CrossRef] [Green Version]
  8. Fard, M.Y.; Raji, B.; Pankretz, H. Correlation of nanoscale interface debonding and multimode fracture in polymer carbon composites with long-term hygrothermal effects. Mech. Mater. 2020, 150, 103601. [Google Scholar] [CrossRef]
  9. Yazik, M.M.; Sultan, M.; Mazlan, N.; Talib, A.A.; Naveen, J.; Shah, A.; Safri, S. Effect of hybrid multi-walled carbon nanotube and montmorillonite nanoclay content on mechanical properties of shape memory epoxy nanocomposite. J. Mater. Res. Technol. 2020, 9, 6085–6100. [Google Scholar] [CrossRef]
  10. Chen, J.; Han, J. Effect of hydroxylated carbon nanotubes on the thermal and electrical properties of derived epoxy composite materials. Results Phys. 2020, 18, 103246. [Google Scholar] [CrossRef]
  11. Mahmoodi, M.; Rajabi, Y.; Khodaiepour, B. Electro-thermo-mechanical responses of laminated smart nanocomposite moderately thick plates containing carbon nanotube—A multi-scale modeling. Mech. Mater. 2020, 141, 103247. [Google Scholar] [CrossRef]
  12. Ajori, S.; Parsapour, H.; Ansari, R. Structural properties and buckling behavior of non-covalently functionalized single-and double-walled carbon nanotubes with pyrene-linked polyamide in aqueous environment using molecular dynamics simulations. J. Phys. Chem. Solids 2019, 131, 79–85. [Google Scholar] [CrossRef]
  13. Heller, D.A.; Barone, P.W.; Swanson, J.P.; Mayrhofer, R.M.; Strano, M.S. Using Raman spectroscopy to elucidate the aggregation state of single-walled carbon nanotubes. J. Phys. Chem. B 2004, 108, 6905–6909. [Google Scholar] [CrossRef]
  14. Haghgoo, M.; Ansari, R.; Hassanzadeh-Aghdam, M.; Nankali, M. Analytical formulation for electrical conductivity and percolation threshold of epoxy multiscale nanocomposites reinforced with chopped carbon fibers and wavy carbon nanotubes considering tunneling resistivity. Compos. Part A Appl. Sci. Manuf. 2019, 126, 105616. [Google Scholar] [CrossRef]
  15. Maiti, S.; Bera, R.; Karan, S.K.; Paria, S.; De, A.; Khatua, B.B. PVC bead assisted selective dispersion of MWCNT for designing efficient electromagnetic interference shielding PVC/MWCNT nanocomposite with very low percolation threshold. Compos. Part B Eng. 2019, 167, 377–386. [Google Scholar] [CrossRef]
  16. Poothanari, M.A.; Xavier, P.; Bose, S.; Kalarikkal, N.; Komalan, C.; Thomas, S. Compatibilising action of multiwalled carbon nanotubes in polycarbonate/polypropylene (PC/PP) blends: Phase morphology, viscoelastic phase separation, rheology and percolation. J. Polym. Res. 2019, 26, 178. [Google Scholar] [CrossRef]
  17. Haghgoo, M.; Hassanzadeh-Aghdam, M.; Ansari, R. A comprehensive evaluation of piezoresistive response and percolation behavior of multiscale polymer-based nanocomposites. Compos. Part A Appl. Sci. Manuf. 2020, 130, 105735. [Google Scholar] [CrossRef]
  18. Zare, Y. An approach to study the roles of percolation threshold and interphase in tensile modulus of polymer/clay nanocomposites. J. Colloid Interface Sci. 2017, 486, 249–254. [Google Scholar] [CrossRef]
  19. Li, H.-X.; Zare, Y.; Rhee, K.Y. The percolation threshold for tensile strength of polymer/CNT nanocomposites assuming filler network and interphase regions. Mater. Chem. Phys. 2018, 207, 76–83. [Google Scholar] [CrossRef]
  20. Zare, Y.; Rhee, K.Y. The mechanical behavior of CNT reinforced nanocomposites assuming imperfect interfacial bonding between matrix and nanoparticles and percolation of interphase regions. Compos. Sci. Technol. 2017, 144, 18–25. [Google Scholar] [CrossRef]
  21. Favier, V.; Chanzy, H.; Cavaille, J. Polymer nanocomposites reinforced by cellulose whiskers. Macromolecules 1995, 28, 6365–6367. [Google Scholar] [CrossRef]
  22. Ouali, N.; Cavaillé, J.; Perez, J. Elastic, viscoelastic and plastic behavior of multiphase polymer blends. Plast. Rubber Compos. Process. Appl. 1991, 16, 55–60. [Google Scholar]
  23. Zare, Y.; Garmabi, H. Modeling of interfacial bonding between two nanofillers (montmorillonite and CaCO3) and a polymer matrix (PP) in a ternary polymer nanocomposite. Appl. Surf. Sci. 2014, 321, 219–225. [Google Scholar] [CrossRef]
  24. Wan, C.; Chen, B. Reinforcement and interphase of polymer/graphene oxide nanocomposites. J. Mater. Chem. 2012, 22, 3637–3646. [Google Scholar] [CrossRef]
  25. Herasati, S.; Zhang, L.; Ruan, H. A new method for characterizing the interphase regions of carbon nanotube composites. Int. J. Solids Struct. 2014, 51, 1781–1791. [Google Scholar] [CrossRef] [Green Version]
  26. Zare, Y.; Rhee, K.Y. Development of a conventional model to predict the electrical conductivity of polymer/carbon nanotubes nanocomposites by interphase, waviness and contact effects. Compos. Part A Appl. Sci. Manuf. 2017, 100, 305–312. [Google Scholar] [CrossRef]
  27. Zare, Y. A simple technique for determination of interphase properties in polymer nanocomposites reinforced with spherical nanoparticles. Polymer 2015, 72, 93–97. [Google Scholar] [CrossRef]
  28. Zare, Y. Assumption of interphase properties in classical Christensen–Lo model for Young’s modulus of polymer nanocomposites reinforced with spherical nanoparticles. RSC Adv. 2015, 5, 95532–95538. [Google Scholar] [CrossRef]
  29. Hassanzadeh-Aghdam, M.K.; Mahmoodi, M.J.; Ansari, R. Creep performance of CNT polymer nanocomposites-An emphasis on viscoelastic interphase and CNT agglomeration. Compos. Part B Eng. 2019, 168, 274–281. [Google Scholar] [CrossRef]
  30. Zare, Y. Estimation of material and interfacial/interphase properties in clay/polymer nanocomposites by yield strength data. Appl. Clay Sci. 2015, 115, 61–66. [Google Scholar] [CrossRef]
  31. Pan, Y.; Weng, G.; Meguid, S.; Bao, W.; Zhu, Z.; Hamouda, A. Interface effects on the viscoelastic characteristics of carbon nanotube polymer matrix composites. Mech. Mater. 2013, 58, 1–11. [Google Scholar] [CrossRef]
  32. Celzard, A.; McRae, E.; Deleuze, C.; Dufort, M.; Furdin, G.; Marêché, J. Critical concentration in percolating systems containing a high-aspect-ratio filler. Phys. Rev. B 1996, 53, 6209. [Google Scholar] [CrossRef]
  33. Pontefisso, A.; Zappalorto, M.; Quaresimin, M. Influence of interphase and filler distribution on the elastic properties of nanoparticle filled polymers. Mech. Res. Commun. 2013, 52, 92–94. [Google Scholar] [CrossRef]
  34. Dominkovics, Z.; Hári, J.; Kovács, J.; Fekete, E.; Pukánszky, B. Estimation of interphase thickness and properties in PP/layered silicate nanocomposites. Eur. Polym. J. 2011, 47, 1765–1774. [Google Scholar] [CrossRef]
  35. Saatchi, M.; Shojaei, A. Mechanical performance of styrene-butadiene-rubber filled with carbon nanoparticles prepared by mechanical mixing. Mater. Sci. Eng. A 2011, 528, 7161–7172. [Google Scholar] [CrossRef]
  36. Ji, X.L.; Jiao, K.J.; Jiang, W.; Jiang, B.Z. Tensile modulus of polymer nanocomposites. Polym. Eng. Sci. 2002, 42, 983. [Google Scholar] [CrossRef]
  37. Chatterjee, A.P. A model for the elastic moduli of three-dimensional fiber networks and nanocomposites. J. Appl. Phys. 2006, 100, 054302. [Google Scholar] [CrossRef]
  38. Zare, Y.; Rhee, K.Y.; Park, S.-J. Modeling the roles of carbon nanotubes and interphase dimensions in the conductivity of nanocomposites. Results Phys. 2019, 15, 102562. [Google Scholar] [CrossRef]
  39. Zare, Y. Effects of interphase on tensile strength of polymer/CNT nanocomposites by Kelly–Tyson theory. Mech. Mater. 2015, 85, 1–6. [Google Scholar] [CrossRef]
  40. Pukanszky, B. Influence of interface interaction on the ultimate tensile properties of polymer composites. Composites 1990, 21, 255–262. [Google Scholar] [CrossRef]
  41. Shao, W.; Wang, Q.; Wang, F.; Chen, Y. The cutting of multi-walled carbon nanotubes and their strong interfacial interaction with polyamide 6 in the solid state. Carbon 2006, 44, 2708–2714. [Google Scholar] [CrossRef]
  42. Zou, W.; Du, Z.-J.; Liu, Y.-X.; Yang, X.; Li, H.-Q.; Zhang, C. Functionalization of MWNTs using polyacryloyl chloride and the properties of CNT–epoxy matrix nanocomposites. Compos. Sci. Technol. 2008, 68, 3259–3264. [Google Scholar] [CrossRef]
  43. Yeh, M.-K.; Tai, N.-H.; Lin, Y.-J. Mechanical properties of phenolic-based nanocomposites reinforced by multi-walled carbon nanotubes and carbon fibers. Compos. Part A Appl. Sci. Manuf. 2008, 39, 677–684. [Google Scholar] [CrossRef]
  44. Chen, G.-X.; Kim, H.-S.; Park, B.H.; Yoon, J.-S. Multi-walled carbon nanotubes reinforced nylon 6 composites. Polymer 2006, 47, 4760–4767. [Google Scholar] [CrossRef]
  45. Bhuiyan, M.A.; Pucha, R.V.; Worthy, J.; Karevan, M.; Kalaitzidou, K. Understanding the effect of CNT characteristics on the tensile modulus of CNT reinforced polypropylene using finite element analysis. Comput. Mater. Sci. 2013, 79, 368–376. [Google Scholar] [CrossRef]
  46. Li, Y.; Waas, A.M.; Arruda, E.M. The effects of the interphase and strain gradients on the elasticity of layer by layer (LBL) polymer/clay nanocomposites. Int. J. Solids Struct. 2011, 48, 1044–1053. [Google Scholar] [CrossRef] [Green Version]
  47. Lu, P.; Leong, Y.; Pallathadka, P.; He, C. Effective moduli of nanoparticle reinforced composites considering interphase effect by extended double-inclusion model–Theory and explicit expressions. Int. J. Eng. Sci. 2013, 73, 33–55. [Google Scholar] [CrossRef]
  48. Nesterov, A.; Lipatov, Y. Compatibilizing effect of a filler in binary polymer mixtures. Polymer 1999, 40, 1347–1349. [Google Scholar] [CrossRef]
  49. Shokri-Oojghaz, R.; Moradi-Dastjerdi, R.; Mohammadi, H.; Behdinan, K. Stress distributions in nanocomposite sandwich cylinders reinforced by aggregated carbon nanotube. Polymer Compos. 2019, 40, E1918–E1927. [Google Scholar] [CrossRef]
  50. Daghigh, H.; Daghigh, V. Free vibration of size and temperature-dependent carbon nanotube (CNT)-reinforced composite nanoplates with CNT agglomeration. Polym. Compos. 2019, 40, E1479–E1494. [Google Scholar] [CrossRef]
  51. Crosby, A.J.; Lee, J.Y. Polymer nanocomposites: The “nano” effect on mechanical properties. Polym. Rev. 2007, 47, 217–229. [Google Scholar] [CrossRef]
  52. Zare, Y.; Fasihi, M.; Rhee, K.Y. Efficiency of stress transfer between polymer matrix and nanoplatelets in clay/polymer nanocomposites. Appl. Clay Sci. 2017, 143, 265–272. [Google Scholar] [CrossRef]
  53. Zare, Y. Effects of imperfect interfacial adhesion between polymer and nanoparticles on the tensile modulus of clay/polymer nanocomposites. Appl. Clay Sci. 2016, 129, 65–70. [Google Scholar] [CrossRef]
  54. Mi, Y.; Zhang, X.; Zhou, S.; Cheng, J.; Liu, F.; Zhu, H.; Dong, X.; Jiao, Z. Morphological and mechanical properties of bile salt modified multi-walled carbon nanotube/poly (vinyl alcohol) nanocomposites. Compos. Part A Appl. Sci. Manuf. 2007, 38, 2041–2046. [Google Scholar] [CrossRef]
  55. Yuen, S.M.; Ma, C.C.M. Morphological, electrical, and mechanical properties of multiwall carbon nanotube/polysilsesquioxane composite. J. Appl. Polym. Sci. 2008, 109, 2000–2007. [Google Scholar] [CrossRef]
  56. Cao, X.; Dong, H.; Li, C.M.; Lucia, L.A. The enhanced mechanical properties of a covalently bound chitosan-multiwalled carbon nanotube nanocomposite. J. Appl. Polym. Sci. 2009, 113, 466–472. [Google Scholar] [CrossRef]
  57. Yu, S.; Wong, W.M.; Hu, X.; Juay, Y.K. The characteristics of carbon nanotube-reinforced poly (phenylene sulfide) nanocomposites. J. Appl. Polym. Sci. 2009, 113, 3477–3483. [Google Scholar] [CrossRef]
  58. Tserpes, K.; Chanteli, A.; Floros, I. Prediction of yield strength of MWCNT/PP nanocomposite considering the interphase and agglomeration. Compos. Struct. 2017, 168, 657–662. [Google Scholar] [CrossRef]
  59. Lazzeri, A.; Phuong, V.T. Dependence of the Pukánszky’s interaction parameter B on the interface shear strength (IFSS) of nanofiller-and short fiber-reinforced polymer composites. Compos. Sci. Technol. 2014, 93, 106–113. [Google Scholar] [CrossRef]
  60. Ghasemi, A.; Mohammadi, M.; Mohandes, M. The role of carbon nanofibers on thermo-mechanical properties of polymer matrix composites and their effect on reduction of residual stresses. Compos. Part B Eng. 2015, 77, 519–527. [Google Scholar] [CrossRef]
  61. Zare, Y.; Rhim, S.; Garmabi, H.; Rhee, K.Y. A simple model for constant storage modulus of poly (lactic acid)/poly (ethylene oxide)/carbon nanotubes nanocomposites at low frequencies assuming the properties of interphase regions and networks. J. Mech. Behav. Biomed. Mater. 2018, 80, 164–170. [Google Scholar] [CrossRef]
  62. Zare, Y. Modeling the yield strength of polymer nanocomposites based upon nanoparticle agglomeration and polymer–filler interphase. J. Colloid Interface Sci. 2016, 467, 165–169. [Google Scholar] [CrossRef]
  63. Joshi, P.; Upadhyay, S. Effect of interphase on elastic behavior of multiwalled carbon nanotube reinforced composite. Comput. Mater. Sci. 2014, 87, 267–273. [Google Scholar] [CrossRef]
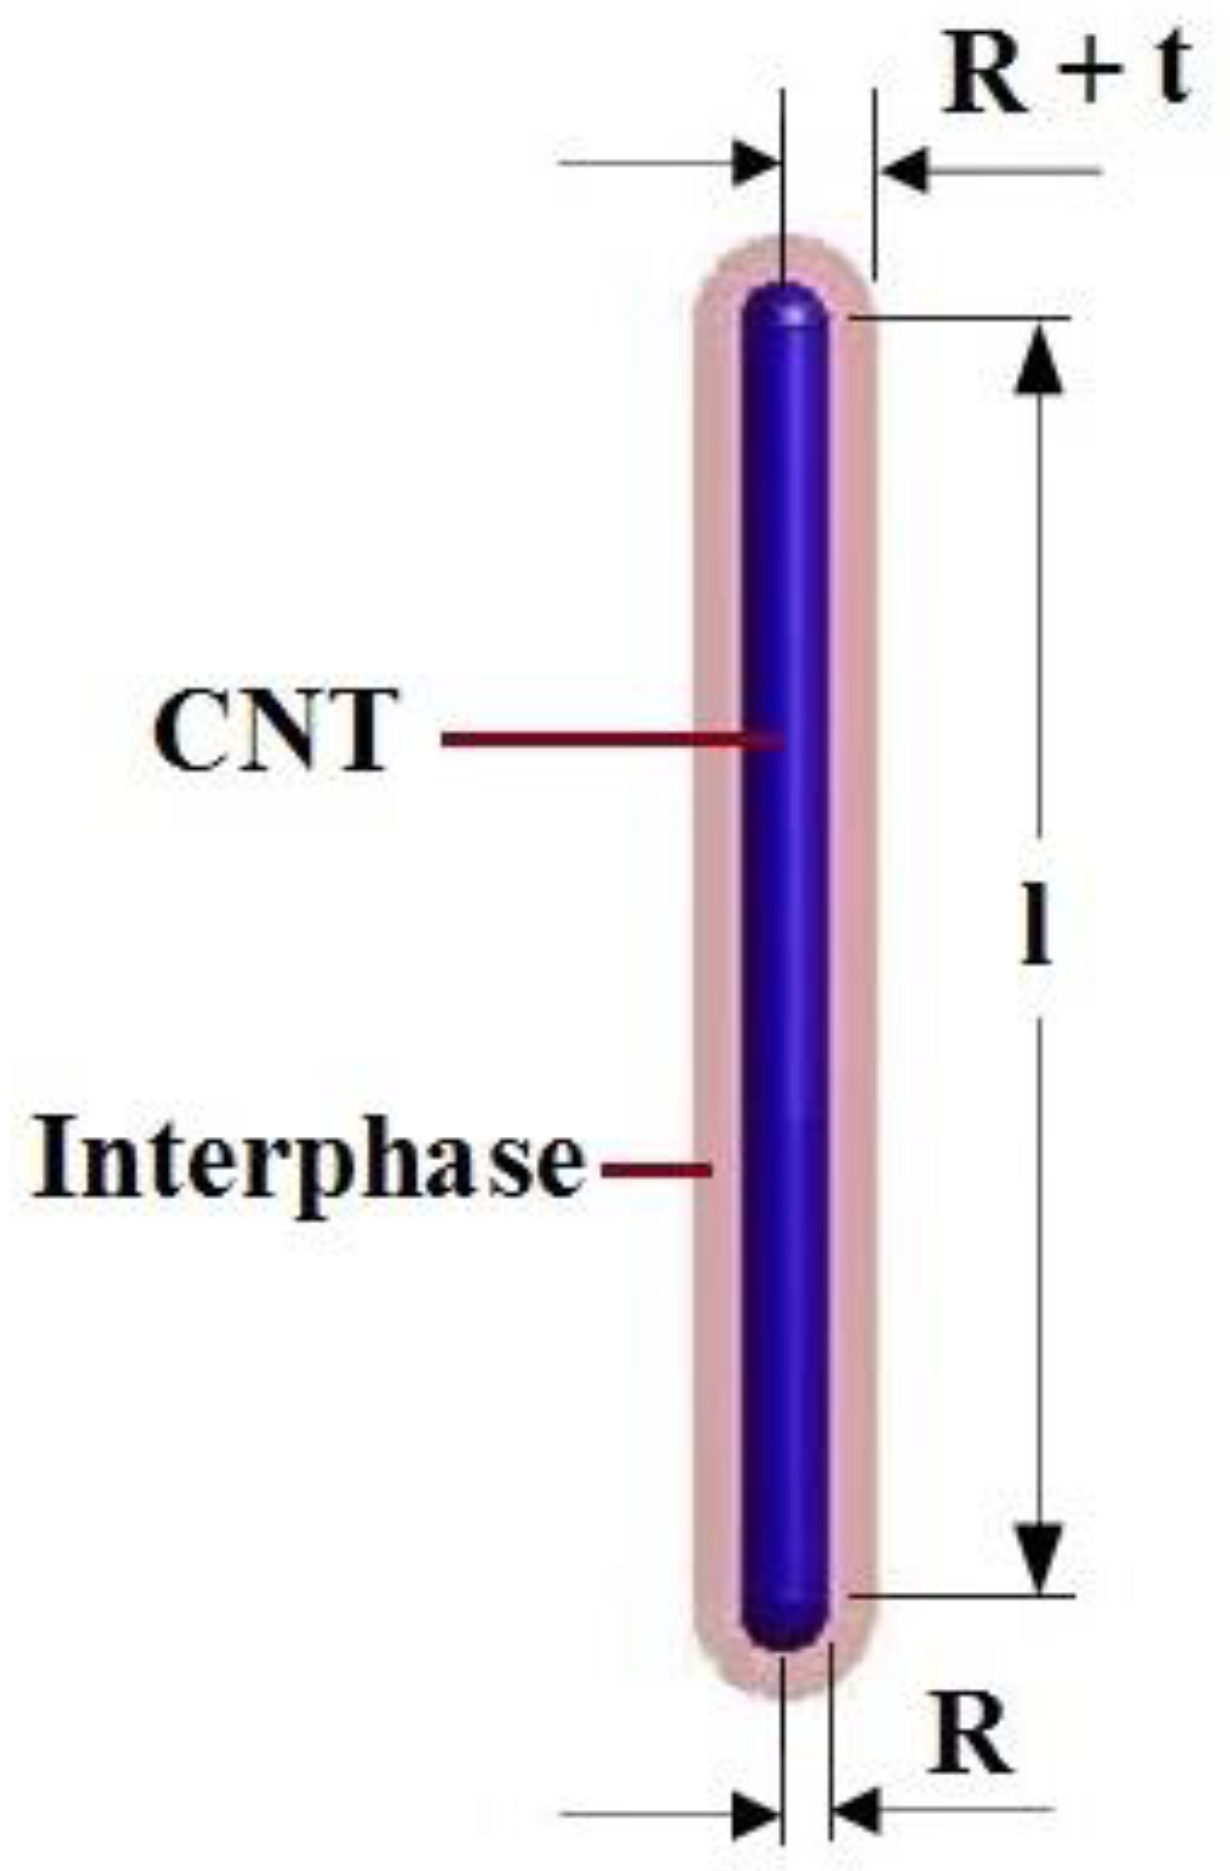
Figure 1. Schematic diagram of a CNT and the surrounding interphase in systems.
Mathematics 09 00990 g001
Figure 2. Tentative and theoretical ranks of relative modulus computed using the advanced model for (a) PA6/MWCNTs [41], (b) epoxy/MWCNTs [42], (c) phenolic/MWCNTs [43] and (d) PA6/MWCNTs-NH2 [44] samples.
Mathematics 09 00990 g002
Figure 3. (a) The 3D and (b) contour plans of the influences of R and l on the relative modulus as predicted by the advanced model when Em = 2 GPa, φ f = 0.02, Ef = 1000 GPa, Ei = 100 GPa and t = 10 nm.
Mathematics 09 00990 g003
Figure 4. Relative modulus assuming interphase factors according to the advanced model at Em = 2 GPa, φ f = 0.02, Ef = 1000 GPa, l = 5 μm and R = 10 nm: (a) 3D and (b) contour plans.
Mathematics 09 00990 g004
Figure 5. Comparison between the tentative and theoretical (Equation (17)) ranks of relative strength for (a) PVA/MWCNTs [54], (b) PSE/MWCNTs [55], (c) chitosan/MWCNTs [56] and (d) PPS/MWCNTs [57] systems.
Mathematics 09 00990 g005
Figure 6. Influences of R and φ f on the relative strength as determined using the advanced model: (a) 3D and (b) contour plots.
Mathematics 09 00990 g006
Figure 7. Influences of l and τ on the relative strength (Equation (17)) at σm = 40 MPa, φ f = 0.02, R = 10 nm and t = 10 nm: (a) 3D and (b) contour plots.
Mathematics 09 00990 g007
Figure 8. (a) The 3D and (b) contour plots of the relative strength in terms of t and B as determined using the advanced model at σm = 40 MPa, φ f = 0.02, l = 10 μm and R = 10 nm.
Mathematics 09 00990 g008
Publisher’s Note: MDPI stays neutral with regard to jurisdictional claims in published maps and institutional affiliations.