Model to Optimize the Decision Making on Processes in IT Departments


Escuela de Ciencias e Ingeniería, Universidad a Distancia de Madrid (UDIMA), Collado Villalba, 28400 Madrid, Spain
Mathematics 2021, 9(9), 983; https://doi.org/10.3390/math9090983
Submission received: 19 April 2021
/
Revised: 23 April 2021
/
Accepted: 25 April 2021
/
Published: 27 April 2021
Abstract
:The objective of this article is the definition of an algorithm aimed to settle the sequence of implementation of Information Technology Infrastructure Library (ITIL) processes that should be followed in the technology departments for its proper management. The mathematical model presented solves the question of the best ITIL process to implement by using an optimization function that considers the objectives and restrictions given by the company. This model is the basis for an iterative greedy algorithm proposed that generates the optimal sequence of ITIL processes to implement. The algorithm has been proven in a company with satisfactory results: the proposed sequence of implementation allowed the company to properly manage the IT department as well as get close to competitors based on the objectives and restrictions reported by the company. The novelty of this contribution relies on the design of an algorithm to generate an optimal and specific sequence of ITIL processes to implement in the IT department of a company, as the previous solutions relied on generic sequences or required external consultants to get their opinion and so did not have a mathematical basis.
1. Introduction
The increasing dependency on Information Technologies (IT) is modifying the way that companies are managing IT departments. The quality of the services offered from these departments has a direct impact of the costs assumed by the company as well as the productivity and the satisfaction of the clients (both internal and external), as pointed out in [1].
In this scenario, the priority of IT managers focuses on offering a really high-quality service to clients by using as few resources as possible and reaching the objectives of efficiency, cost, and time, which were previously fixed. Although it is possible to invent processes and procedures to manage the IT departments and achieve these goals, it is quite accepted to use standardized processes as the ones covered in the Information Technology Infrastructure Library (ITIL) [2]. There are some other standards [3,4,5], but ITIL is clearly the most implemented one in IT departments in first-world countries as well as in emerging-world countries [6,7].
The Information Technology Infrastructure Library is a set of processes oriented to offer high-quality technological services in any kind of industry. The processes are not specifically defined for IT companies, but they can be implemented in any company in any industry: these processes do not specify the hardware or software to use nor does it specify the platforms or infrastructures. The processes are classified in groups for a proper definition, design, implementation, operation, and maintenance of services in the IT departments [7]. So, the only requirement to implement ITIL is the existence of an IT department that offers technological services to the rest of the company or to the external clients [8], no matter if it is a big or a small organization [9].
The latest versions of ITIL identify five groups of processes [7], although there are slight differences in the processes specified in each version: (a) Service strategy group of processes, (b) Service design group of processes, (c) Service transition group of processes, (d) Service operation group of processes, and (e) Service improvement group of processes. These groups contain up to thirty processes in total. Some examples of the processes defined are Incidence management, Problem management, Access management (to systems), Change management, and Configuration management, among others.
The main problem that organizations are facing when implementing these processes is that the ITIL standard does not define any strategy nor does it define a sequence to implement the processes: no order of processes is defined, no specificity for each company is addressed, no indication is mentioned. It only includes the list of processes and their classes as well an exhaustive explanation of each process [8].
The interest in ITIL has grown quickly in the latest years due to the fact that it is the most exhaustive and detailed standard in terms of the number of processes specified from its initial versions [10]. Different authors have investigated about the implementation of ITIL. The approaches have been quite different: some of them worked on the factors that most affect the success or failure of the ITIL implementations, and some others worked on defining a partial list of processes or generic (non-adapted to each company) sequences. So, it is common to hire consultants and experts to give their opinion on which one should be the correct order of processes for the implementation project. That solution is expensive and quite subjective. The real-world situations are often far from the conditions assumed in the standards: this is a clear example where the standard just defines the processes without paying any attention to the reality of the companies. The standard does not enter in the strategy, the sequence, the set of processes to implement, or the differences among companies to adopt ITIL.
The lack of criteria in ordering the processes to be implemented has been identified as one of the main reasons why the implementations fail. Examples about it can be found in [11] (“… the organizations attempt to implement all or many of the ITIL processes at once” and [12] when explaining that the implementations of ITIL fail because “traditionally most organizations start implementing Incident management followed by Problem management and Change Management”. That is, there is no specific sequence of implementation of processes for each company, and thus, this leads to a failure. The references analyzed show that companies are interested in ITIL, but there is a gap to fill between the theory explained in the standard and the real projects to implement it.
So considering:
- The increasing need of implementing management processes in the IT departments
- The great importance of ITIL as a reference in the market, and
- The lack of clear strategies and guides to implement the processes defined in ITIL,
The aim of the paper is:
- To present an algorithm that provides an optimal sequence of implementation of ITIL processes specifically defined for each company.
The next section presents a literature review to show the different approaches to the problem. In Section 3, the materials and methods are exposed: this includes the database definition (used with the algorithm) and the algorithm itself; and a brief real case of application is presented. Finally, the results and the conclusions are explained.
2. Literature Review
A literature review to understand the state of art has been developed. The main question to solve is to find models, methodologies, and algorithms to sequence the implementation of ITIL processes specifically defined for its implementation in a specific company.
The summary of the findings is that there are two main groups of strategies to implement ITIL.
- Fixed sequences, success factors, and methodologies that influence on the implementation: A great number of works have been published about fixed or static sequences of implementation of processes as well as factors that may help (or make more difficult) the implementation of ITIL.
- Dynamic sequences: Some other authors have worked out the definition of specific sequences for each company, following different criteria.
These two main groups of strategies to define the sequence of implementation of processes for the IT departments are explained in the next sub-sections.
2.1. Fixed Sequences, Success Factors, and Methodologies
The number of papers published about fixed sequences and success factors to implement ITIL processes in IT departments is clearly higher than the papers about dynamic sequences.
The strategies that focus on success factors areas are analyzed by [13,14,15]. These authors find factors that may affect the success of an implementation of processes in the IT departments. The proposed factors are mainly selected by observation or by asking experts and ITIL consultants. Another approach about success factors can be found in [16]. In this case, the selection of the factors that eases the implementation of the processes is obtained with a more sophisticated method, as it applies the AHP (analytical hierarchical process), which is used to evaluate, measure, and cancel inconsistencies in the expert opinions. In all cases, the critical factors identified are related to organizational issues, change of management, and the involvement of the steering committee of the company.
In the case of [17], the success factors in the implementation are centered on the resources: procedures, software, and other tools are identified as critical for the project to succeed.
The work presented in [18] is based on the BPC (Business Process Change) model to determine the success factors. This paper shows the same weakness as the ones previously mentioned: there is no proposal of sequence of implementation, or just the first process to implement is mentioned. An alternative work is shown in [19], which analyzes the failure factors: the literature does not show a sequence of implementation of processes (except in some cases where the first processes are pointed out).
Regarding the possible strategies to implement the processes in ITIL, a good example can be found in [8,20,21]. The problem found with these approaches is that they represent a kind of tips and receipts to follow. They do not offer a clear sequence of implementation of processes but a sequence of steps during the implementation. So, definitively, they do not solve the problem of the sequence of implementation of processes.
Nevertheless, the works in [22,23,24] are more interesting, as they present methods to define the sequence of implementation of processes. The methods are based on the maturity of the processes, and so, the processes selected are those in an initial state. The idea works fine, but it does not take into account the possible objectives of the company and it does not consider that some IT processes could be useless for that specific company. In addition, these methods do not consider information from the competitor to establish the sequences. These weaknesses require reviewing the list of proposed processes before proceeding with its implementation, and so, they require a consultant review.
Some other authors have also worked out the possibility of defining a static and common sequence of implementation of processes for the IT department. These sequences are identical for all companies with no dependency on the starting of the implementation, on the size of the company, on the competitors. They can be labeled as ‘universal sequences’.
The cases explained in [25,26] are based on a mathematical and graphical model that searches for the relationships between processes. The list of processes is generated in terms of the internal dependency between processes, so deadlocks are avoided. These methods are really interesting, but they do show a great weakness as they just take into consideration internal factors of the processes, that is, they only consider the internal relationships among the processes without any other consideration of the company or the market (competitors). In addition, another important weakness detected is that these methods can establish a sequence where the less important processes could be firstly implemented as they could be the processes less dependent among all.
The model presented in [27] is also based on the maturity of processes. However, in this case, a first model with isolated (and prioritized) processes is presented. After that, a second model with dependencies among the ITIL processes complemented with a model that considers the maturity of processes is established. The result is a fixed and unique sequence of implementation of ITIL processes that should be implemented in the organizations. The idea could be fine, but it shows the disadvantage that it is unique for all organizations independently of size, staff, competitors, etc. That is, it generates a sequence non-adapted to any specific company.
2.2. Dynamic Sequences
Regarding non-fixed sequences, there are clearly less references than for static sequences. The references [2,32,33] define dynamic sequences of processes: this clearly solves one of the problems, but the problem of the dependency on experts still remains. These references address how to solve the problem of sequencing the processes, but they need to query consultants’ opinion. The strategies presented are not the same: while [2] and [32] considers internal and external factors, the translation into a numerical model is based on fuzzy logic techniques; the case shown in [33] reveals a management-based approach. That is, [33] is oriented to define a sequence of implementation of processes that generates ‘quick wins’ in the company.
The model presented in [34] generates a sequence that depends on the organization, but it does not strictly generate an optimal sequence, because there is a previous prioritization of the ‘critical’ processes. That is, the knowledge about the criticism of some processes places them in the first positions of the sequence of implementation of processes. Once more, the current situation of the company has not been considered, because what happens if the process is already implemented or if the process is not useful for the company? It means that this solution orders the ITIL processes, but it does not consider any information about competitors. The reference [35] also generates a dynamic sequence, but it needs the experts’ opinions and it just considers characteristics such as size, age, staff, etc. for the generation of the sequence of processes to implement: it does not consider at all the objectives of the company to define the sequence. Finally, a similar strategy is presented in the reference [36]
2.3. Lessons Learned from Literature Reviewed
We can conclude out of the literature review that there has been a permanent interest in solving the question of how to implement the processes of ITIL as well as interest less often in how to order them and what strategies should be followed, but there is no clear algorithm that defines the order of processes for a specific company. That is, there is no clear mathematical method to determine the specific sequence of ITIL processes that should be implemented in each company, even if this is an issue that appears frequently in the literature. Whenever any approach for the sequence has been exposed, the parameters considered to generate the sequence are both external (competitors) and internal (characteristics of the company), but the objectives of the company have been considered rarely.
3. Research Methodology
As a result of the literature review and the gap identified, we propose the next question to solve:
Question: is it possible to define an algorithm to generate an optimal sequence of processes to be implemented in the IT departments subject to the next restrictions?
- Restriction 1: It must consider the characteristics of the company
- Restriction 2: It must consider the information of competitors
- Restriction 3: It must consider the aims of the company that implements the processes
- Restriction 4: It must not require hiring experts or consultants
The aim of this paper is to define an algorithm to generate an optimal sequence of processes to be implemented. If it is possible to find this algorithm, then the answer to the previous question would be affirmative.
3.1. Description of the Methodology
The proposal presented in this paper requires two blocks. The first one is a database with data gathered through a web survey: these data will be used by the algorithm. The dataset contains information about companies’ characteristics and the level of ITIL implementation. That is, for every participant in the survey, information such as the age, the industry, the staff, etc. was collected. The information about the level of implementation of every ITIL process was also collected. All these data are stored in a database, which is used in combination with the algorithm to generate an ordered set of ITIL processes.
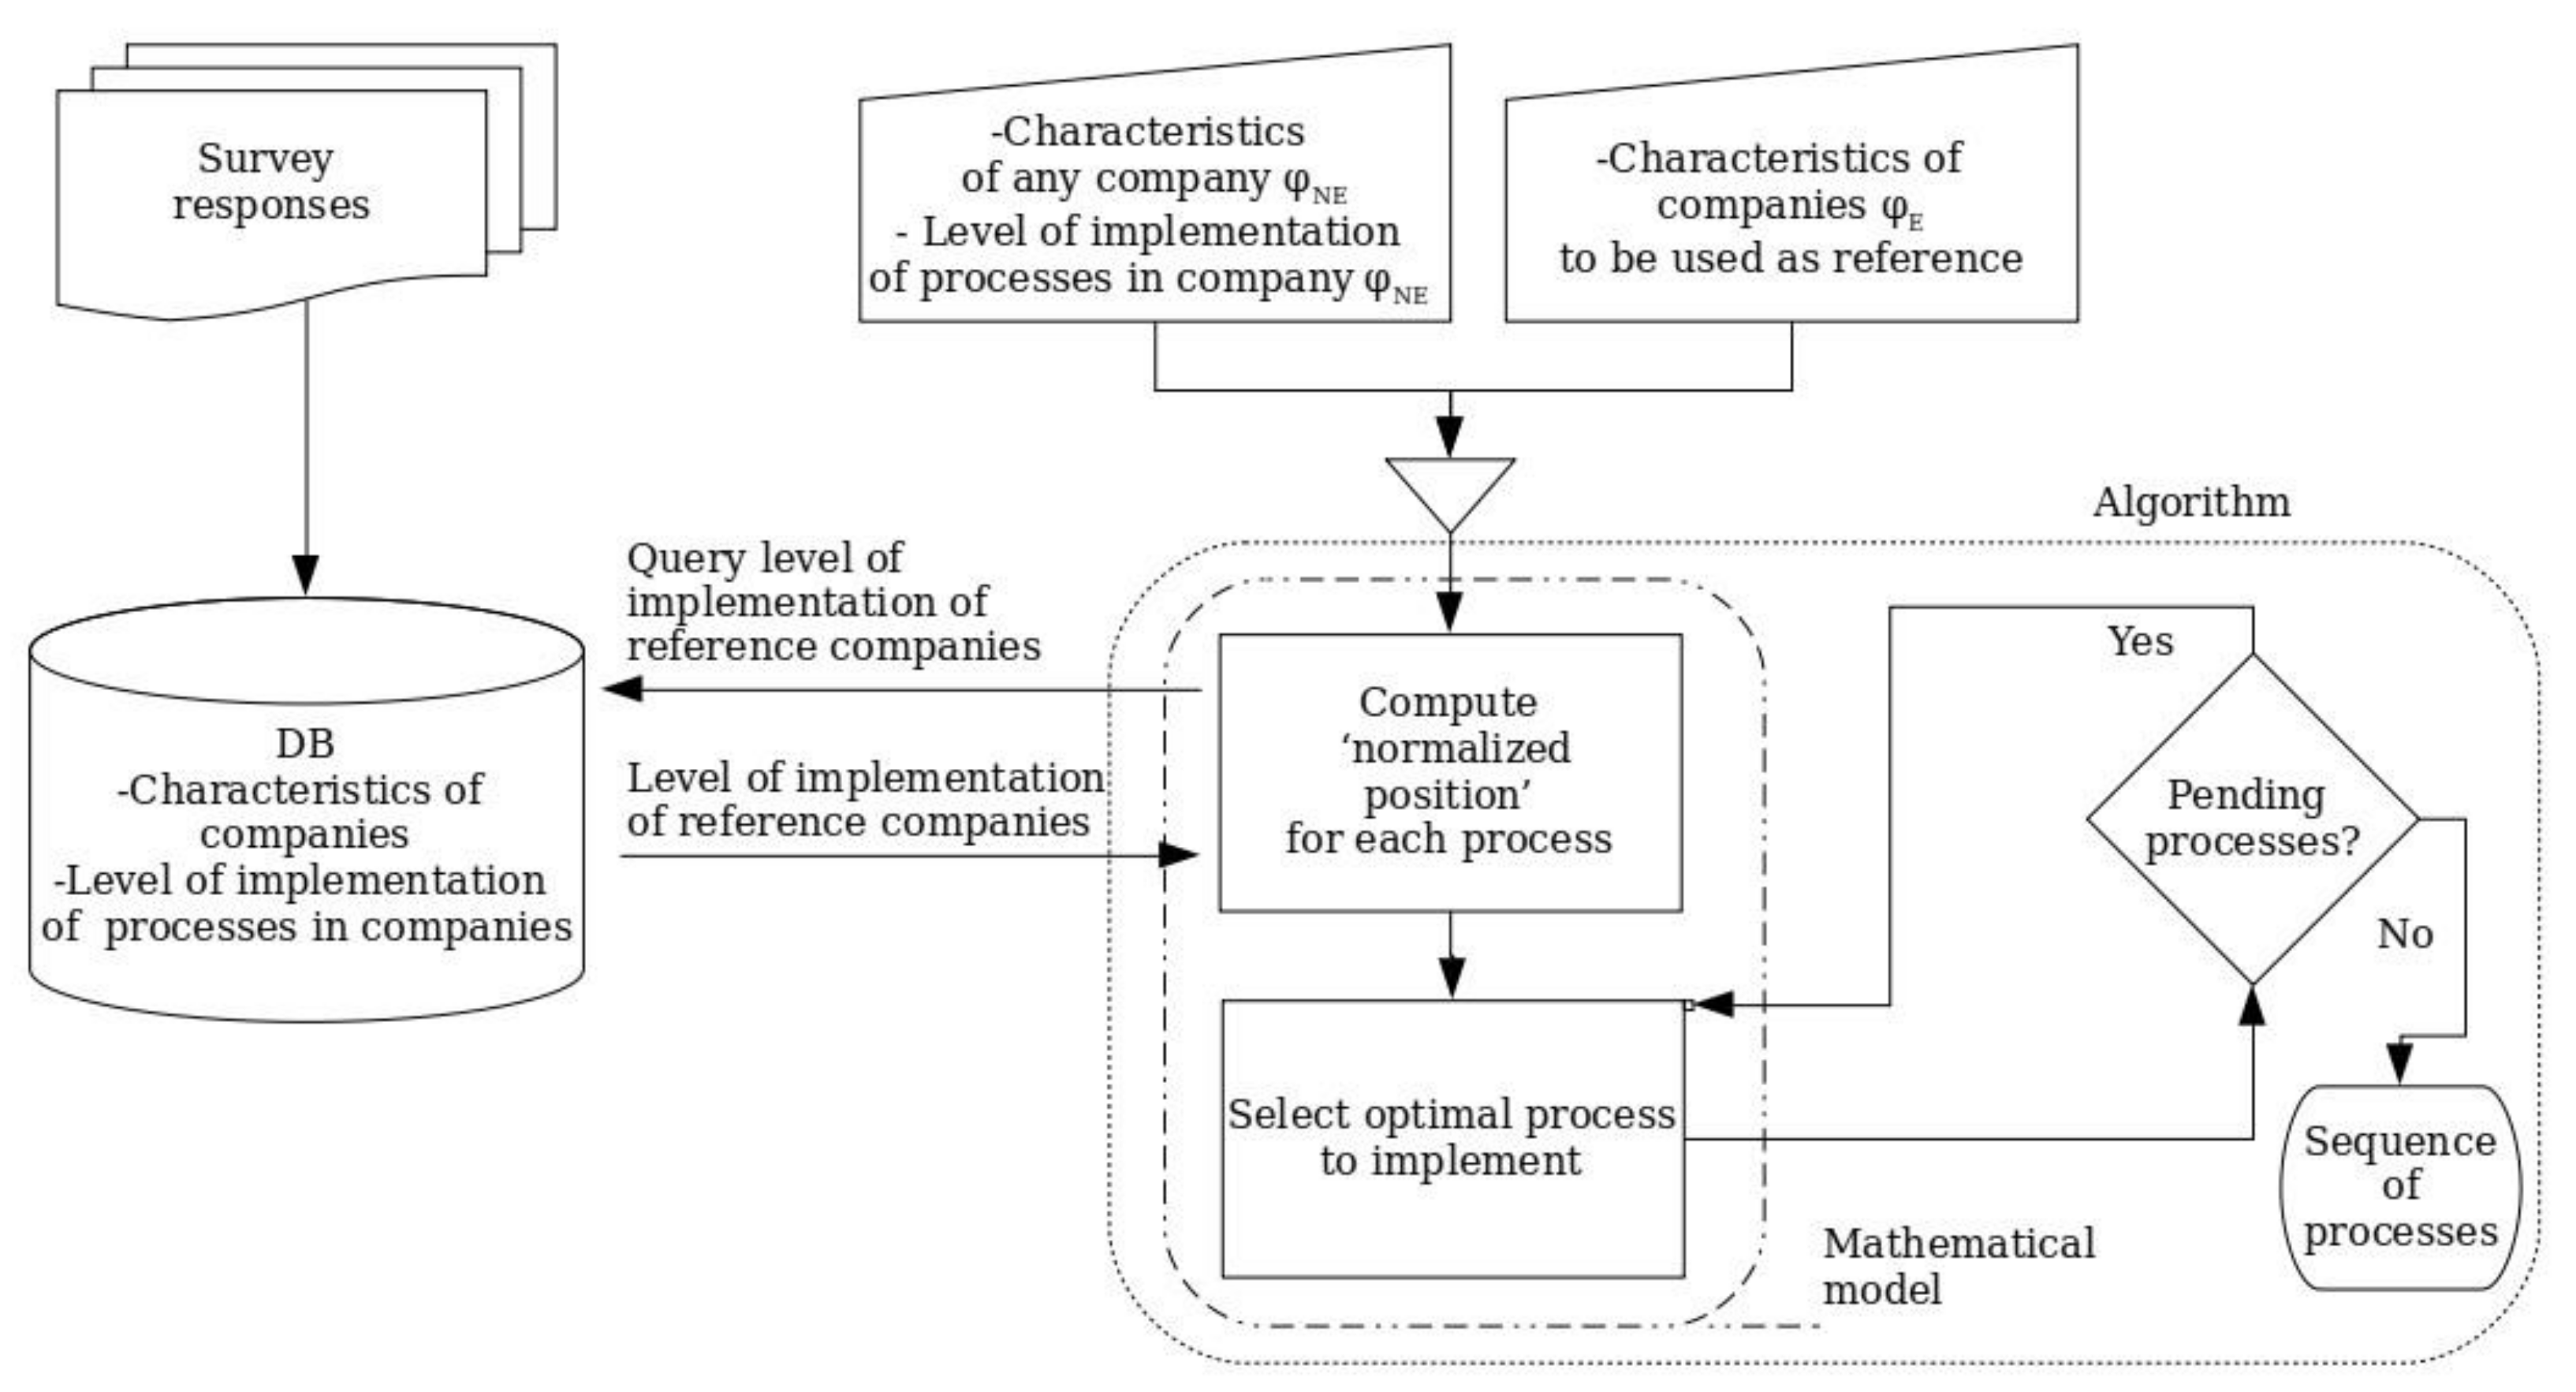
The second block is the mathematical model for the optimal selection of the process to implement and the algorithm itself, which represents the main contribution of the paper. The mathematical basis will be presented in Section 3.3, and the steps of the algorithm will be presented in Section 3.4. The iterative algorithm selects the best process to implement using the optimization model described in Section 3.3 with the data stored in the database. Figure 1 represents the flow of information and how the algorithm gets information from the database and generates a sequence of processes to be implemented according to specific optimization parameters (characteristics of the company and aims). The optimization parameters are set by the company interested in getting the ITIL processes sequence to be implemented. To make it clear, let us show an example of how it works: the database contains information about the size, age, industry, and other characteristics of a set of companies collected from a survey. It also includes information about the level of implementation of every ITIL process for each participant. Let us assume that another new company desires to implement ITIL, but it does not know the exact order of ITIL processes that it should follow. We are given a restriction; for example: the company desires to get the sequence that makes it get closest to companies with less than four people in IT staff and in the same industry as itself. In that case, the algorithm, based on the mathematical model (explained in Section 3.3) and considering the characteristics of the company, the level of implementation of ITIL processes in the company, and the companies in the database, will select—one by one—the ITIL processes to minimize the distance to companies that satisfy the restrictions given. At the end of the algorithm a sequence of ITIL processes is obtained, so the company already knows the order to follow.
Both the database and the algorithm are explained in the next sub-sections.
3.2. The Database and Web Application
The database contains information about companies: parameters such as size, age, industry, staff, IT staff, and area of market (local, national, international), which are more than the typical ones pointed out in [35,36,37,38]. It also contains information about the level of implementation of each ITIL process in a single scale from 1 to 3 [39].
Regarding the validity of the questionnaire, it has been designed in a similar way to [39], which was developed and reviewed by a panel of experts. Moreover, the questionnaire has also been reviewed by independent experts on ITIL to be sure that the questions covered all aspects of the ITIL processes as well as the information needed about the characteristics of the participant companies [40].
In terms of reliability of the questionnaire, the Cronbach test [41] can be applied. Nevertheless, we are interested in knowing the level of implementation of every ITIL process, as they are defined in the standard, no matter if they are correlated, so this test is not needed.
The data were gathered through a survey that was limited to small companies (freelances are not included). This is not a real limitation in the optimization model or in the algorithm. The only limitation concerns the fact that it will be only possible to determine the sequence for small companies (they represent more than 95% of the total companies in most of the first-world countries). In case we want to use the algorithm to obtain the sequence in big companies, we should just feed up the database with data from big companies, but the algorithm still remains the same.
In the case of small companies, in the scope of this study (Table 1), the population is around N = 1.3 million. Thus, considering a maximum error of 10% to avoid overlapping in the responses, a significance level α = 90%, and the worst case given by p = 0.5, the minimum required number of companies is calculated with the standard formula [42,43] for a normal population:
As it can be seen in Table 1, the final number of answers is near double this amount. Following [44], a simple randomized sampling will be used.
As pointed out before, the aim of the research is to present an algorithm to sequence the ITIL processes implementation in any company. The sequence obtained needs to be compared to the generic existing sequences. To do so, Spearman and Kendall tests are commonly accepted [36,45,46]. These tests will be used with the results obtained in Section 4.1.
Regarding the survey to gather the data, its specifications are included in Table 1.
Table A1 in Appendix A contains the list of questions in the survey and the possible answers. The questions of the survey were sent through a web form, and the responses were stored in the database.
The algorithm works as follows: let us assume that a company wants to get the optimal sequence to implement ITIL by defining the criteria that best fit its objectives. For example, a company could prefer to get an optimal sequence of ITIL processes considering the companies in its industry (that is, direct competitors); or, it could prefer an optimization based on taking as a reference other companies with the same size and age. The algorithm allows selecting as many criteria as the number of characteristics of companies (age, size, staff, etc.) stored in the database.
The data of the company (industry, age, staff, IT staff, etc.) and the current level of implementation of each ITIL process in the company are the input data of the algorithm. After that, the company decides the criteria that should be used to optimize the sequence (it is assumed that the company will choose the criteria that best fit its objectives: get closer to competitors, get closer to the same aged companies, maximize IT staff performance, or any other).
Finally, the algorithm will determine the best sequence of processes that satisfies the optimization criteria pointed out by the company.
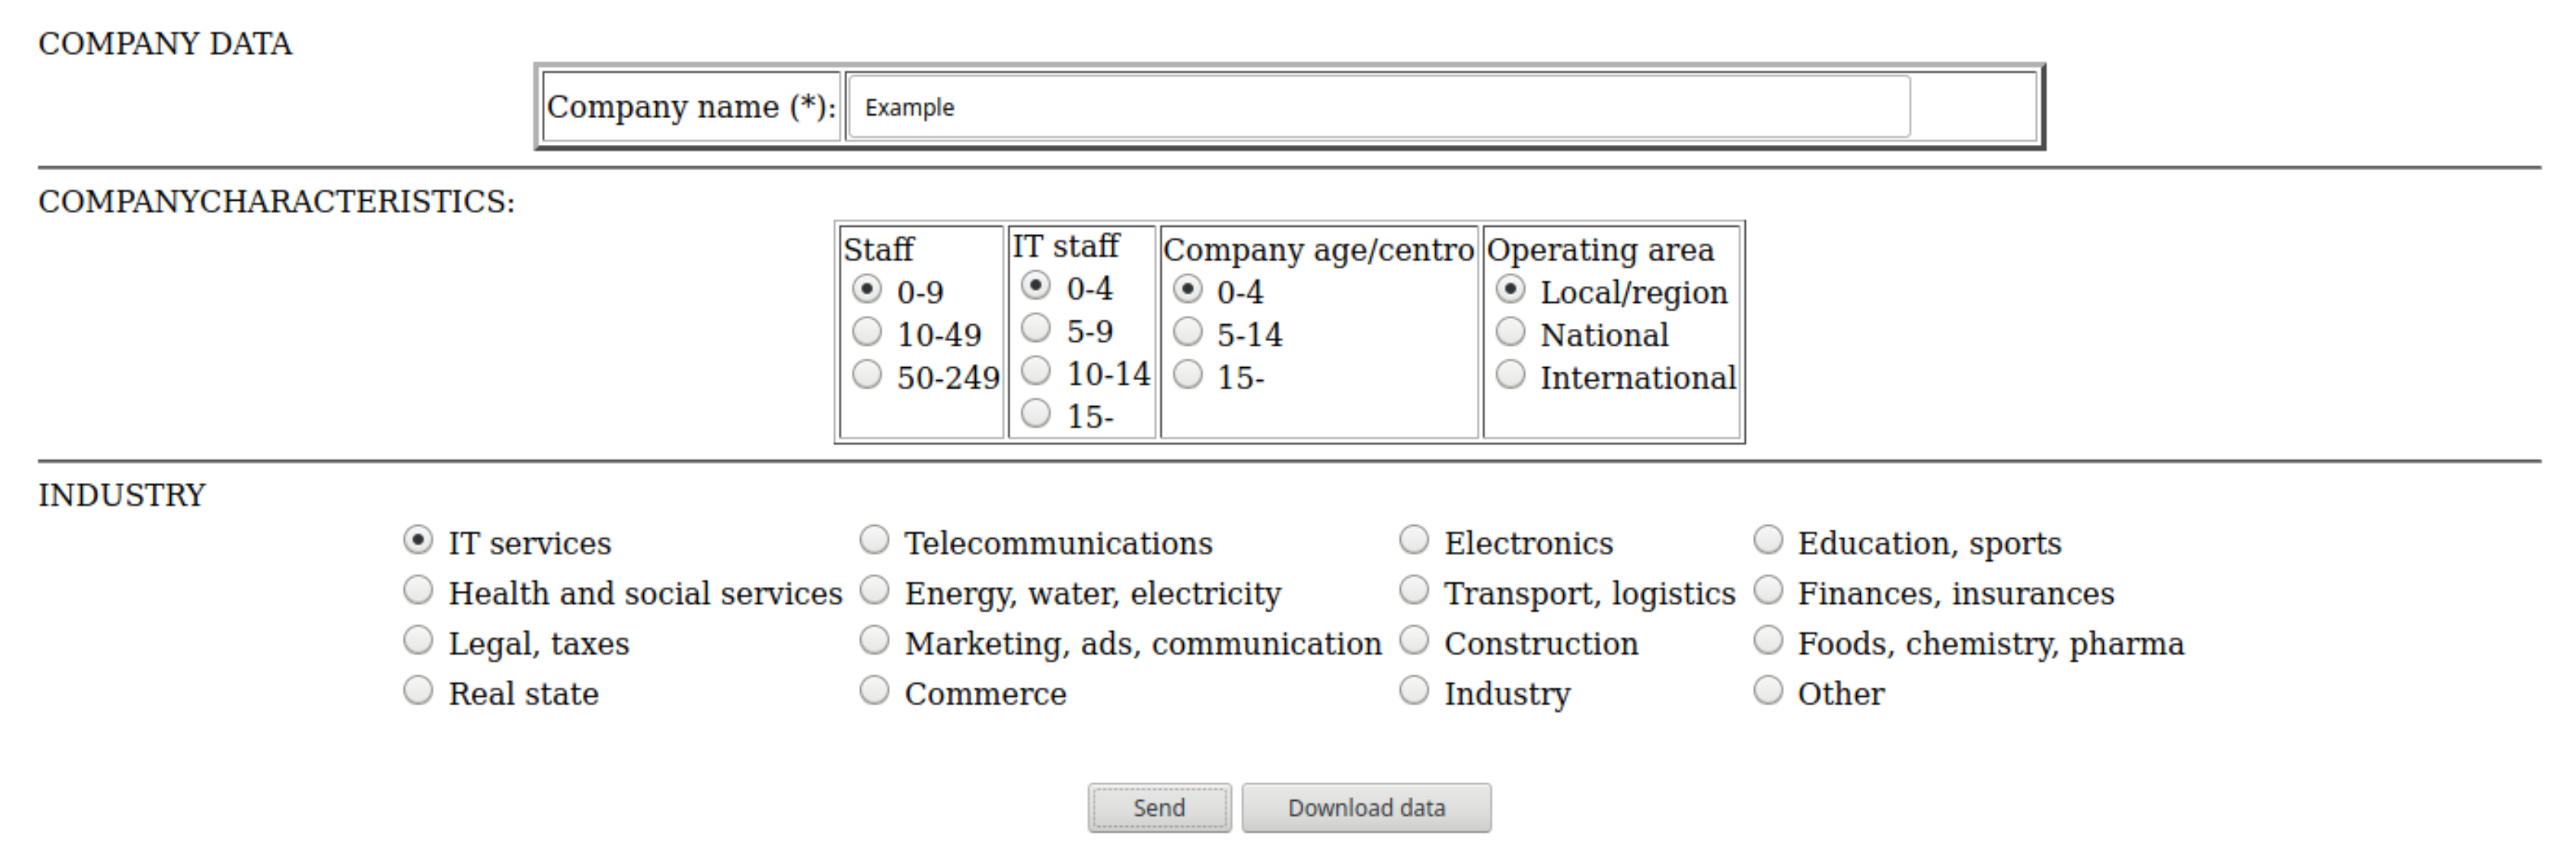
As the generation of the sequence is a computationally heavy process, an application (available in [https://doi.org/10.5281/zenodo.4587237], accessed on 31 January 2021) has been developed to support the algorithm. As an example of the available application in [https://doi.org/10.5281/zenodo.4587237], accessed on 31 January 2021, the web page to introduce data implementation is available in Figure A1. The rest of the web pages of the application can be downloaded from [https://doi.org/10.5281/zenodo.4587237], accessed on 31 January 2021.
3.3. The Algorithm: Mathematical Basis
In further considerations, we will use the following definitions and notations.
Notations:
1. Let ΦE be the set of companies φE stored in the database DB. These companies are those ones that answered the survey, so its characteristics and information about their processes are saved.
2. Let ΦITIL be the set of the pi ITIL processes that could be eventually implemented in a company; thus
where n_ITIL represents the maximum number of ITIL processes defined in the standard.
3. Let L be the function that assigns the Boolean value ‘True’ if the process p (for the company φ) has reached an implementation level lj out of the possible values [1..Vmax]. That is:
The definition of the function L requires lj to be ordered from the worst case (that is, l1 equals to zero meaning that the process is not implemented neither it will be in a future term) to the best case (lVmax equals to Vmax meaning that the process is fully implemented).
4. Let us represent the possible values for the level of implementation of every ITIL process p in a company φ through the function d(φ,p) defined as:
where p is any process in ΦITIL and φ is a company. For example, for a company φ, considering the first five ITIL processes and assuming three possible values for the level of implementation (1: not implemented; 2: ongoing; 3: already or coming soon implemented), a vector of d values is obtained:
meaning that the second and fourth processes are not implemented, the first and the fifth processes are being implemented, and the third process is already implemented.
5. Let ΦCH be the set of parameters or characteristics used to define any company. The typical parameters/characteristics used to define a company are age, size, IT size, operation region, etc. Thus:
For example:
Of course, each of these characteristics, chi, has its own domain of values. For example, the age could be defined by using three possible values; the size could be defined by using four possible values, etc. So, the domains can be expressed as pointed out by Expression (7):
It is clear that the parameter chi has mi possible values as its maximum. One example could be:
6. Let v(φ,i) be the function that assigns a value from (7) to the parameter chi for a particular company φ. Thus,
For example, given a company φ, and the third characteristic ch3, then v(φ,3) = v(φ,’industry’) = ’education’ = ch3,1 means that φ belongs to the educational industry—out from Expressions (6) and (8).
Let us denote by φNE any company that, not belonging to ΦE, wants to implement the ITIL processes.
So, denoting by Vi the difference for a specific process pi in a φNE with characteristics {ch1,k1,ch2,k2,...chch,kch } between the value assigned if the process was fully implemented and the current value of the implementation:
An example, for the second ITIL process, and assuming a maximum value Vmax = 3 and a level of implementation in the company φNE given by d(φNE,2) = 1—that is, no implementation at all, then V2 = 3 − 1 = 2. This value gives an idea about how far a process is from its total implementation in a company.
7. Now, just considering the companies in ΦE, let us denote by mijk the mean value of the implementation of the process pi for the companies that satisfy that the parameter chj equals the value chjk of the company φ:
where n represents the number of the companies in ΦE with the same chj than the company implementing ITIL and pi is each one of the processes in ΦITIL. For example, m4 5 14 is the mean of the value d for the process p4 in all the companies in the database that have the characteristic ch5 (industry—see Table A1) equal to value 14 (finance—see Table A1); so m4 5 14 is the mean of the implementation of the fourth ITIL process ‘Demand management’ (see Table A2) for the companies where industry equals ‘Finance’.
Therefore, it is possible to evaluate the difference Mijk between the maximum value for the implementation of each process pi and the mean of the implementations in ΦE given by mijk:
Definition 1.
Let NP denote the “normalized position” of the company φNE for the process pi: an indicator to evaluate the level of implementation of a process pi compared to the implementation of that process in companies that, belonging to ΦE, have the same characteristics chj than φNE.
Expression (13) is a measure of how far the implementation of the process pi in the company φNE is from the implementation of that process in the companies selected as reference. So, the sum of Expression (13) for all the processes is a global measure of the distance between φNE and the reference companies. Thus, the objective is:
The objective of the optimization is that the company φNE gets as close as possible to the reference companies (in terms of ITIL implementation). The reference companies are those that satisfy the characteristics selected by φNE (size, industry, or any others). For example, the company φNE could be a local company and could belong to the financial industry, but it could set the reference companies for the optimization as the local companies that belong to any industry. In that case, Expression (13) just works with local companies to find the process to implement that get closest to these companies. The inclusion and exclusion of characteristics (size, industry, etc.) in the optimization is done through αj and γj parameters.
In (13), αj is a parameter in (0,1] that allows us to weight the influence of every characteristic chj of the company in the final sequence of processes; and γj is a Boolean parameter that allows us to exclude a characteristic from the optimization function (that is, a value of γj = 0 avoids that the parameter chj influences in the final sequence). This is important, as this is the way to implement the restriction 3 identified in Section 2.3: the company that is implementing ITIL can choose the parameters used to generate the final sequence of processes depending on its aim. For example, let us assume that the aim of the company is getting closer to direct competitors in the same industry (for example, finance) with the same IT staff (for example, 0–4 employees). In this case, the company is interested in getting closer to competitors with the same industry (let us assume j = 2; see Table A1) and the same staff in IT (let us assume j = 5): it is enough to assign γ2 = γ5 = 1 and the rest of the values γl = 0 (to avoid them having any influence in Expression (13)). Regarding the α2 and α5 parameters, if the company considers them to have the same importance, it is enough to assign α2 = α5 = 1.
In Expression (13), the higher value Vi has, the lower result NPi is obtained. It means that if the implementation value for the process pi in the company φ is close to the minimum, then NP gets lower and vice versa. In the same way, if a low value for M is obtained, it means that the rest of companies that satisfy chj = chj,kj (that is, the companies considered in the final solution) have already implemented the process pi (or they are close to having it implemented), and this leads to a decreased NP. So, in both cases, the result is the same: NP gets lower.
Assuming that there is no more information about the number of processes that will finally be implemented (that is, the processes in the sequence should be determined one by one so Expression (14) is minimized by selecting processes one by one), the problem is reduced to select the initial process to implement.
Definition 2.
A sequence is considered optimal if the unitary benefit of the implementation of each process tends uniformly to zero. The unitary benefit of a process is given by the normalized position.
Remark.
In a real situation, it is not possible to know how many processes will be finally implemented. So, the company should decide to implement the processes on by one. Let us remember that in the literature review, one of the failure reasons was that the companies tried to implement more than one process at once.
Proposition 1.
The only optimal sequence of processes to implement is that one with an increasing value of NP.
Proof.
Let us assume without loss of generality that the processes pi are ordered by an increasing order of normalized positions NP, so:
Let us denote by Qn = {p1, p2,…, pi…, pn-1, pn} the optimal sequence of the first n processes that should be implemented.
Now, let us denote by R = {p1, p2,…, pi…, pn-1, pn+k} any other sequence of n processes where the process pn has been substituted by another one pn+k with an NP value higher than NPn corresponding to the process pn. In that case, the set of values for NP is defined by {NP1, NP2…, NPn-1, NPn+k}.
Let us assume without loss of generality that the processes from n + k to n_ITIL are incorporated to R in its correct order. In that case, R = {p1, p2,…, pi…, pn-1, pn+k, pn+k+1,…, pn_ITIL} is still an optimal sequence, but there still exists a set of processes {pn, pn+1,…, pn+k-1} with {NPn, NPn+1…, NPn+k-1} that need to be selected and incorporated into the sequence.
Let us select the case represented by pn+k-1 with NPn+k-1 to be added to R. It could have been selected any other process, but this one represents the most unfavorable case. So, it results R = {p1, p2,…, pi…, pn-1, pn+k, pn+k-1} with {NP1, NP2,…, NPn-1, NPn+k, NPn+k-1}. If R was an optimal sequence, then pn+k-1 < pn. However, given that the processes are ordered by an increasing value of NP, then pn+k-1 > pn, meaning that the final R is not an optimal sequence and so there only exists a unique optimal sequence Q. □
3.4. The Algorithm: Steps
It is possible now to define the criteria to select the best process to be implemented. Once implemented, the process that should be selected, pSEL, will most decrease the distance to the rest of companies that satisfy the characteristics chj:
This expression requires a small modification to avoid selecting a process pi already implemented in φNE.
Once the selection criteria for the processes have been exposed, it is possible to indicate the steps to generate the sequence.
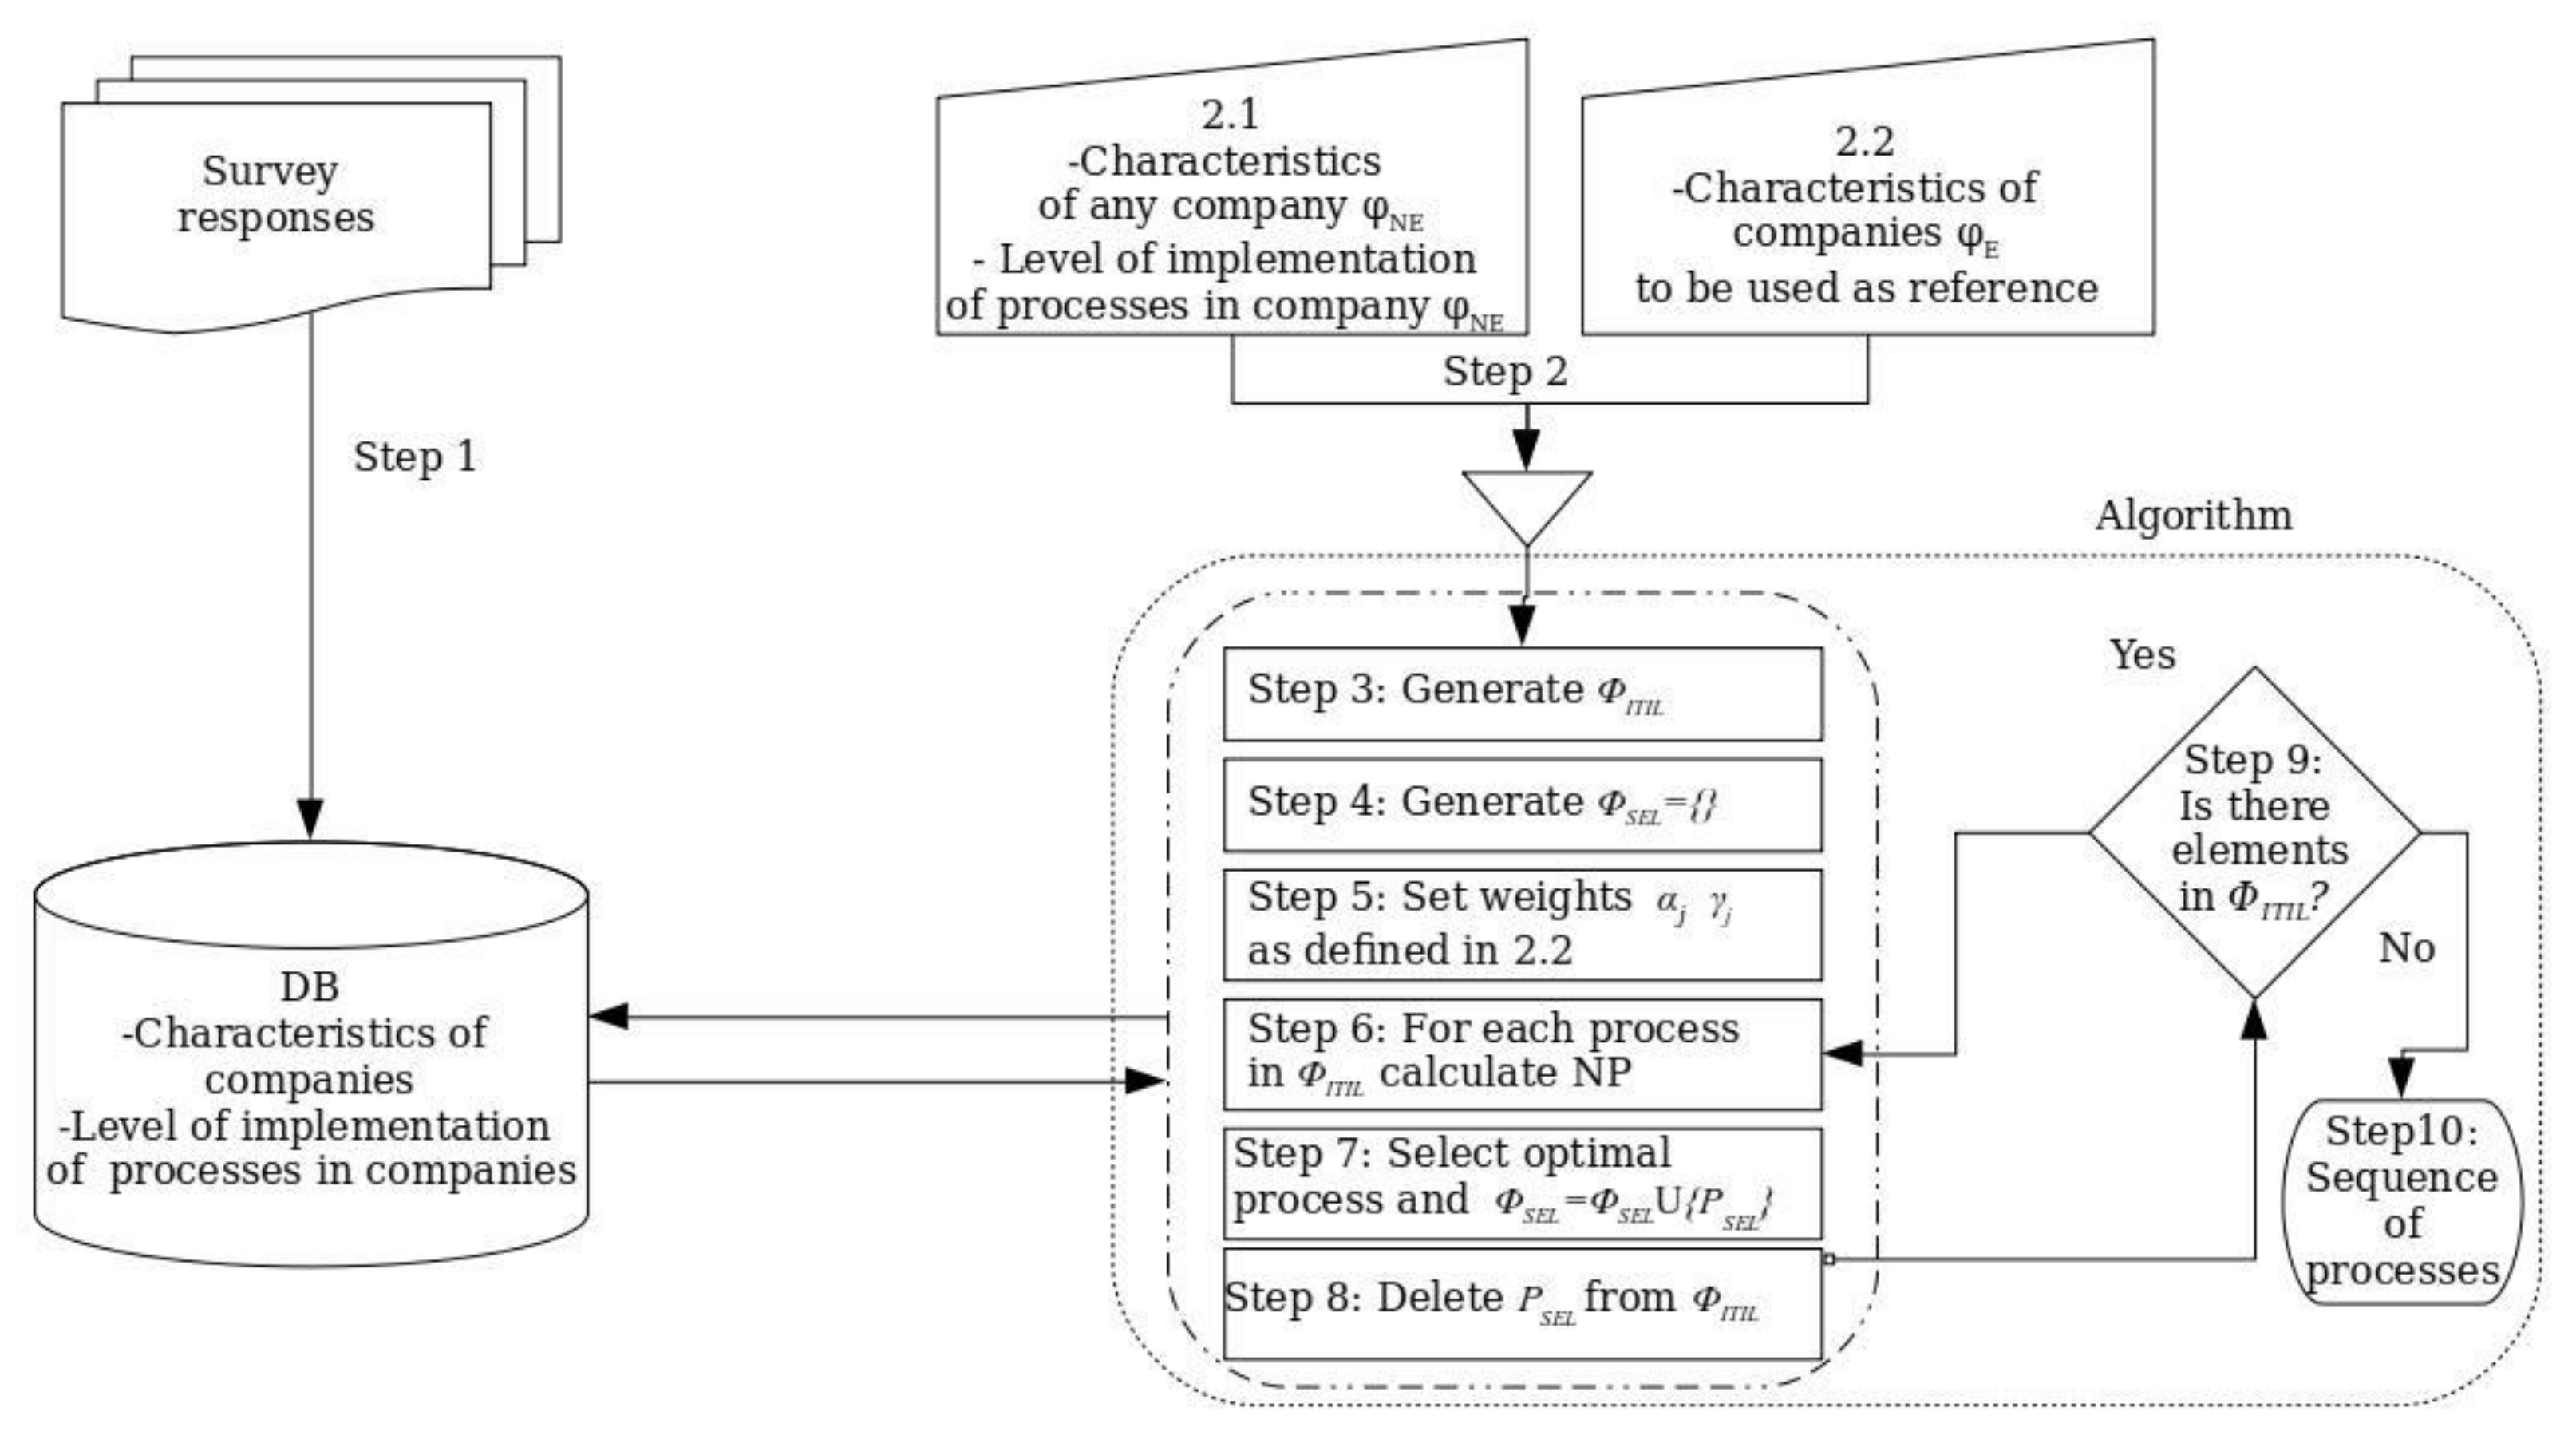
Looking at Expression (15), the sequence of processes can be obtained through a greedy algorithm that takes the best option in each iteration (see Appendix C for pseudo code).
- The first step is to fulfill the database with data: the algorithm requires data about the characteristics of the companies and data about the level of implementation of every ITIL process.
- Collect data about the company φNE interested in obtaining an ITIL sequence of processes: the same as in step 1; both the characteristics of the company and the level of implementation of ITIL processes are required.
- Generate the ΦITIL set of processes. This set of processes must not include the processes already implemented in φNE.
- Set ΦSEL = {}. This is an empty set of selected processes.
- Set the criteria for optimization, that is, the αj weights and the characteristics or parameters that will not participate in the optimization by assigning them the values γj = 0. In most cases, it is enough to assign αj = 1 for the participating characteristics (age, size, IT staff, etc.) and γj = 0 for those that do not participate in the optimization.
- Calculate NP through Expression (13) for each process in ΦITIL.
- Select the process pSEL as pointed out by (16) and include it in the set ΦSEL.
- Eliminate pSEL from the set ΦITIL.
- Repeat from step 6 until ΦITIL is empty.
- The ordered optimal sequence is obtained in ΦSEL.
These steps are represented in Figure 2.
4. Results
4.1. An Example of Application and a Comparison with Other Authors’ Sequences
The algorithm presented above has been tested in a small company using the app developed for this purpose in [https://doi.org/10.5281/zenodo.4587237], accessed on 31 January 2021. The characteristics of the company are shown is Table 2.
The company chosen for the example is a company that belongs to the leisure industry. The staff is lower than 250 employees, and the IT staff is small (5–14 employees). It operates in different countries, so it has been labeled as an international operating area. The values for the implementation of each ITIL processes are available in Table A2.
The company is interested in obtaining an ITIL sequence considering as a reference other companies with the same IT staff. That is, the company desires to have a similar level of implementation of ITIL as those companies having a similar IT staff. For simplicity reasons, the application developed just supports values 0 and 1 for αj; this means that every considered characteristic will have the same relevance for the proposed sequence. The question is which sequence of processes should follow to get close to those companies as quickly as possible.
Thus, introducing these data as input, the algorithm generates the sequence shown in Table 3.
The app developed in [https://doi.org/10.5281/zenodo.4587237] (accessed on 31 January 2021) also allows us to get a comparative with the most used sequences listed in the literature review. This comparison allows us to determine if—globally—the sequence obtained is statistically different from the ones proposed by those authors or not. To do so, two tests have been considered:
(a) Spearman test and (b) Kendall test. These typical tests allow us to determine if the sequence of processes obtained in the proof of concept is similar to those proposed by other authors. Typically, Kendall contrast is used to reinforce the result of the Spearman contrast. The sequences used for the comparison with the sequence of processes obtained by the presented algorithm are next: [2,6,25,27,32,35,36]. The sequences proposed by each of these authors are presented in Table A3.
The hypotheses established for the tests are:
Hypothesis 0 (H0).
The sequences are non-dependent.
Hypothesis 1 (H1).
The sequences are dependent.
Table 4 and Table 5 show the results of the Spearman and Kendall contrasts with a 95% confidence level. As is observed, the null hypothesis is accepted, which confirms the independence of the obtained sequence (in no case is Ho is rejected by both tests) with respect to other sequences of implementation proposed by other authors. The interpretation of these results is detailed in Section 4.2.
4.2. Interpretation of the Data and Comments about the Results
I. About the sequence obtained
The processes included in Table 3 are those that best fit for the company purposes. That is, this is the list of processes that most quickly will get the company close to those companies having the same IT staff.
The sequence obtained depends on the data contained in the database, the characteristics of the company, the initial level of implementation of ITIL, and the parameters used for the optimization. So, it is very important to have collected an adequate set of data in the survey to fill up the database. The higher quality the data, the more precise the sequence obtained.
The result depends even more on the processes that were already implemented (if any) in the company. Any change in the level of implementation in these processes will directly affect the final sequence. For example, any process already implemented will be excluded from the list of selectable processes.
However, the most sensitive element in the final sequence is the choice of the parameters to be used in the optimization. It means that there is a great difference in optimizing by taking as reference companies with the same staff, than optimizing by taking as reference companies with the same staff and the same age (for example). Different pilots tested on different small companies support a great dependency on the parameters used in the optimization.
The sequence obtained in this example could be successfully implemented in the company, at least the first ten processes. So, it can be concluded that the drawbacks of the small companies can be overcome by using the model presented. One of the most valued advantages of the model has been the absence of deadlocks in the project of processes implementation. Due to the fact that the model operates with real data from other companies (stored in the database), the results are valuable for the small company interested in implementing ITIL. It leads to no blocking processes in the sequence; that is, the implementation of a process does not require implementing a process that appears later in the sequence. Regarding the scheduling, the project of processes implementation took about nine months. The projects of ITIL implementation take usually no less than 1 year, as pointed out in the literature review.
The result obtained is optimized with respect to the parameters selected (IT staff): it means that the sequence obtained is the quickest one to have the same level of implementation than the companies with the same IT staff. The limitations in the model are imposed by the amount of characteristics or parameters that can be used for the optimization. These ones depend on the data collected in the survey; that is, they depend on the number of characteristics collected from every company during the survey. The model is a general purpose model and can be applied independently of the number of characteristics, but the limitation comes from the database itself in the sense of the number of characteristics that were collected during the requesting period.
II. About the comparison with other authors’ sequences
Regarding the comparison with other sequences, the contrasts show a great independence except in two cases: [36] and [25]. In these two cases, the independence of the result obtained is not reinforced by Kendall’s contrast. In the case of [36], the Spearman contrast rejects the null hypothesis (it is very close to the limit), but the Kendall contrast accepts it. As the Kendall contrast is used to reinforce, the null hypothesis is rejected. Nevertheless, in the case of [25], the Spearman contrast results in accepting the null hypothesis but the Kendall contrast refutes it: in this case, the null hypothesis is accepted, but it should be analyzed more carefully.
In the rest of the cases, it is observed that the sequence obtained is non-dependent with the sequences of authors presented in the literature review.
Apart from the global independence of the sequence obtained with respect to the other authors’ sequences, it is possible to get some detailed conclusions if we consider the list of processes one by one in every author’s sequence. To do so, the list of process codes (P1, P2, etc.) in Table A1 will be used to reference each process. The sequence proposed by each author is presented in Table A3. The next paragraph analyzes more deeply the alternative sequences of other authors compared to Table 3.
In the case of [32], the main differences are based on the fact that this author prioritizes the processes P7 and P21 (these are processes very close to the daily operations), but P11, P24, and P12 are relegated to the positions 14, 16, and 18, respectively. Moreover, this author does not consider the complete list of ITIL processes, which reinforces the independence of the sequence obtained with the algorithm presented in this paper (Table 3): it is common not to consider the complete list of processes when considering the opinion of experts, which represents clearly a disadvantage versus the approaches based on mathematical models and algorithms.
In the case of [36], the list of processes proposed by the author is slightly different from the list of processes obtained with the algorithm (Table 3). This is because [36] considers the opinion of experts who usually propose starting with the operation group of processes and usually propose finishing with the strategic group of processes. This originates some differences with the sequence presented in Table 3 because processes P1, P12, P3, P4, and P6 (strategic and design processes) are prioritized over the rest (let’s remember that the independence of sequences was refuted by Spearman contrast and validated by Kendall contrast, as pointed out before): in other words, the processes are in a similar position (not exactly the same), and this leads to the differences in the contrasts results.
Regarding [6], the explanation for the differences is based on the very short list of processes proposed by this author: there are not significant differences in the first positions of the processes, but the list presented by the author does not allow concluding that the sequence obtained by the algorithm (Table 3) is the same (as confirmed by Spearman and Kendall contrasts). Regarding the sequence presented by [35], the proposal is based on observations that generate a sequence aimed to replicate what the rest of companies are doing, which may not lead to satisfying the aims of the company (in the algorithm presented in Section 3, the algorithm admits a configuration to optimize the sequence according to the company interests).
Something similar can be established with [25]: even if the null hypothesis has been accepted (Kendall contrast did not reinforce the null hypothesis), the list of processes is different because its purpose is to avoid deadlocks in the implementation of the processes, while the purpose of the sequence proposed by the algorithm presented in this paper was to get close to the competitors with the same IT staff (as commented in Section 4.1). The result of [25] is a theoretical and short sequence that avoids deadlocks, but it is not unique, as it has been proven in a real case in this paper (no deadlock appeared during the implementation): as it is very short, the differences with the sequence obtained in the algorithm (Section 3) are significant even if the initial processes are in a close position in the sequence.
Regarding the sequence proposed by [2], the reasoning is very similar to [36]: due to the fact that the experts opinion is considered (in the case of [2], fuzzy logic techniques are used for translating opinions into numerical data), the conclusions are similar: the main differences are explained by the short list proposed by this author. It can be seen in Table 3 and Table A3 that the processes are proposed in similar positions in the sequence, but the list proposed by [2] is too short, which explains why it is statistically different from that obtained with the algorithm (Table 3). The sequence proposed by the author in [27] presents the same problem: it considers less than 50% of the total number of ITIL processes, which leads to being considered statistically different.
Summarizing, in five out of seven cases, the authors do not present a complete sequence of processes, which clearly represents a problem to be used for a complete implementation of ITIL processes. The reasons for presenting a short list of processes are different: for example, in [25], the authors recognize the difficulties derived from the graphical method when the number of considered processes is increased; in the case of [6], the author aims to show only the initial processes or, in the case of [2], the complexity of the procedure itself.
It is important to highlight that all these sequences are not specifically adapted to the company of the example nor do they consider the information of competitors.
5. Discussion and Future Works
5.1. Discussion
The present work is the result of research developed to help companies (mainly small companies) implement ITIL processes. Due to the existing differences among all companies, the published solutions did not fit the needs of these companies. Moreover, the published approaches consider solutions with no mathematical basis, and they need to hire experts to help in the whole implementation project.
This paper proposes a new algorithm to select the best sequence of processes specifically adapted for each company. So the answer to the question, “Is it possible to define an algorithm to generate an optimal sequence of processes to be implemented in the IT departments subject to the next restrictions?” is clearly affirmative.
Now, it will be checked if the restrictions have been satisfied:
- Restriction 1: The algorithm presented in this paper allows the companies to get a sequence to implement ITIL processes. The sequence obtained is specifically adapted for each company depending on the data entered: the characteristics of the company and the level of implementation of the ITIL processes. This represents a great advance on the existing solutions already exposed in the literature review.
- Restrictions 2 and 3: The algorithm allows considering both the information of the company and the level of ITIL processes in other companies (competitors or not) by configuring the α weights and the parameters γ.
- Restriction 4: The model and the algorithm have been implemented and tested in a real company without needing any external consultant. Every company can use the application without hiring ITIL experts, which will clearly be valued by companies (mainly small companies with few resources)
The application in a real case has been quite satisfying, and the company has achieved the initial objectives when it was decided to implement ITIL processes. The application developed has been welcome, as it supports the whole algorithm and avoids any external help.
The mathematical formulation of processes to improve the management is a key point, as more and more business are depending on technology. An adequate management of the IT department relies on better experiences for the users (internal and external), and it increases the satisfaction and the incomes of the company. It is common to use mathematical models to benefit the management of the companies, but there exists a lack of models to properly manage the IT department, as seen in the literature review. The present algorithm has been designed to fill that gap.
Nevertheless, some improvements and future works can be pointed out in the next section.
5.2. Future Works
Some future works can be addressed. In first place, the database could be fulfilled with more information about more companies (small and big) so all of them could benefit from the model. It is also possible to fulfill with information from more surveys developed in other countries so that more companies in more countries could benefit from the model. The important point is that it is not necessary to change the algorithm but just to add more information in the database, which is much easier than updating the algorithm. The database used in this paper is being populated with more data; the next step is to offer the results through ITIL-related organizations to help transfer the knowledge to companies as well as to jointly maintain the database. This will clearly help to increase the data and improve the model and also the decision process in the IT departments of the companies.
In second place, the algorithm can be improved in the case that the company was just interested in a short list of processes. The current model assumes that the sequence should contain all the processes, but this is rarely the case: most of the companies are only interested in the first ten (maybe some more) processes. In such case, the optimization function could be optimized.
In third place, it could be nice to obtain different sequences optimized using different parameters and techniques. These sequences could be combined with an artificial intelligent program to generate the final result; it is also planned to analyze the sequences using data mining techniques [47,48,49,50,51,52,53] to help in the decision process. In that sense, the strategy to follow should be similar to the one followed in this paper: determine the strategy, verify its applicability in (at least) a real case, and compare the results with other dynamic sequences of implementation, as proposed in this paper.
Regarding the application, it can be also improved by giving the option to obtain the sequence considering only specific companies (as reference) instead of all companies with determined characteristics.
Finally, in order to gain a deeper empiric approval, it is proposed to extend the application of the algorithm to a great number of companies to test the result of practical implementations.
Funding
This research received no external funding.
Institutional Review Board Statement
Not applicable.
Informed Consent Statement
Not applicable.
Data Availability Statement
https://doi.org/10.5281/zenodo.4587237, accessed on 31 January 2021.
Conflicts of Interest
The authors declare no conflict of interest.
Appendix A
The questionnaire sent to companies included a set of questions to determine (a) the characteristics of the company and (b) the current status of ITIL implementation for each process. They should assign a value from 1 (not implemented) to 3 (completely implemented).

Table A1.
Questions used to get the data of the companies.
| Questions: Characteristics of the Company | Possible Answers |
|---|---|
| Name of the company | (open) |
| Staff | (1) 1–9 (2) 10–49 (3) 50–249 |
| IT staff | (1) 0–4 (2) 5–9 (3) 10–14 (4) 15– |
| Age of the company | (1) 0–4 (2) 5–14 (3) +15 |
| Operating area | (1) Local (2) National (3) International |
| Industry | (1) IT (2) Health and social services (3) Taxes, legal (4) Real state (5) Telecommunications (6) Energy, water, electricity, gas (7) Marketing, communication (8) Commerce (9) Electronics (10) Delivery, logistics (11) Construction, maintenance (12) Industry (13) Education, sports (14) Finance, insurances, banking (15) Food, chemical, pharma (16) Others |
| Questions: Level of Implementation | Possible Answers |
| P1. Service stratagy mng. | (1) Not implemented neither it will be (2) Ongoing/Planned (3) Already implemented |
| P2. Service portfolio mng. | (1) Not implemented neither it will be (2) Ongoing/Planned (3) Already implemented |
| P3. Finance mng. | (1) Not implemented neither it will be (2) Ongoing/Planned (3) Already implemented |
| P4. Demand mng. | (1) Not implemented neither it will be (2) Ongoing/Planned (3) Already implemented |
| P5. Business relation mng. | (1) Not implemented neither it will be (2) Ongoing/Planned (3) Already implemented |
| P6. Design mng. | (1) Not implemented neither it will be (2) Ongoing/Planned (3) Already implemented |
| P7. Service catalog mng. | (1) Not implemented neither it will be (2) Ongoing/Planned (3) Already implemented |
| P8. Availability mng. | (1) Not implemented neither it will be (2) Ongoing/Planned (3) Already implemented |
| P9. Service level mng. | (1) Not implemented neither it will be (2) Ongoing/Planned (3) Already implemented |
| P10. Continuity mng. | (1) Not implemented neither it will be (2) Ongoing/Planned (3) Already implemented |
| P11. Security mng. | (1) Not implemented neither it will be (2) Ongoing/Planned (3) Already implemented |
| P12. Provider mng. | (1) Not implemented neither it will be (2) Ongoing/Planned (3) Already implemented |
| P13. Capacity mng. | (1) Not implemented neither it will be (2) Ongoing/Planned (3) Already implemented |
| P14. Transition schd. mng | (1) Not implemented neither it will be (2) Ongoing/Planned (3) Already implemented |
| P15. Change mng. | (1) Not implemented neither it will be (2) Ongoing/Planned (3) Already implemented |
| P16. Deploy and version mng. | (1) Not implemented neither it will be (2) Ongoing/Planned (3) Already implemented |
| P17. Validation and test mng. | (1) Not implemented neither it will be (2) Ongoing/Planned (3) Already implemented |
| P18. Configuration mng. | (1) Not implemented neither it will be (2) Ongoing/Planned (3) Already implemented |
| P19. Change evaluation mng | (1) Not implemented neither it will be (2) Ongoing/Planned (3) Already implemented |
| P20. Knowledge mng. | (1) Not implemented neither it will be (2) Ongoing/Planned (3) Already implemented |
| P21. Incidence mng. | (1) Not implemented neither it will be (2) Ongoing/Planned (3) Already implemented |
| P22. Problem mng | (1) Not implemented neither it will be (2) Ongoing/Planned (3) Already implemented |
| P23. Access mng. | (1) Not implemented neither it will be (2) Ongoing/Planned (3) Already implemented |
| P24. Event mng | (1) Not implemented neither it will be (2) Ongoing/Planned (3) Already implemented |
| P25. Request mng. | (1) Not implemented neither it will be (2) Ongoing/Planned (3) Already implemented |
| P26. Improvement mng. | (1) Not implemented neither it will be (2) Ongoing/Planned (3) Already implemented |
Figure A1.
Web page in [https://doi.org/10.5281/zenodo.4587237] (accessed on 31 January 2021) to introduce data of company sequencing ITIL.
Figure A1.
Web page in [https://doi.org/10.5281/zenodo.4587237] (accessed on 31 January 2021) to introduce data of company sequencing ITIL.

Appendix B
Table A2.
Answers to the survey collected from the example company.
| Question | Possible Answers | Question | Possible Answers |
|---|---|---|---|
| Service stratagy mng. | 1 | Transition schd. mng | 1 |
| Service portfolio mng. | 1 | Change mng. | 1 |
| Finance mng. | 1 | Deploy and version mng. | 2 |
| Demand mng. | 1 | Validat. and test mng. | 2 |
| Business relation mng. * | 1 | Configuration mng. | 2 |
| Design mng. | 1 | Change evaluat. mng | 1 |
| Service catalog mng. | 2 | Knowledge mng. | 2 |
| Availability mng. | 2 | Incidence mng. | 2 |
| Service level mng. | 1 | Problem mng * | 1 |
| Continuity mng. | 1 | Access mng. | 2 |
| Security mng. | 1 | Event mng | 1 |
| Provider mng. | 1 | Request mng. | 1 |
| Capacity mng. | 1 | Improvement mng. | 1 |
(*) Excluded from the initial set of ITIL processes in the pilot developed.
Table A3.
List of processes by author.
| Question | Possible Answers |
|---|---|
| [32] | P:7-21-2-9-4-15-18-3-10-25-26-13-8-22-11-16-24-22-12-23 |
| [36] | P:15-16-18-21-9-11-17-24-7-8-3-22-23-25-13-20-14-10-5-4-26-19-2-6-12-1 |
| [6] | P:21-22-18-16-15-26-24-9-23-125-20 |
| [35] | P: 21-15-22-9-18-16-10-8-13-25-3-7-11-24-23-20-17-12-2-14-26-19-4 |
| [25] | P:18-9-15-13-21-8-22-10-16-3 |
| [2] | P: 15-18-7-9-24-21-22 |
| [27] | P:3-18-21-25-16-9-13-8-12-15-22 |
Appendix C
In this section, the pseudo code of the algorithm is summarized.
First of all, it is necessary to have available a database with data from processes and the level of implementation as well as the characteristics of the companies (staff, industry, region, or other parameters we desire to include in the sequencing algorithm). There is a complete database in [https://doi.org/10.5281/zenodo.4587237] (accessed on 31 January 2021) if there is not another one available.
procedure generate_sequence ()
{
#Require data and level of ITIL implementation from the
#company φNE and calculate distance to maximum
#implementation V[i]
#
#Initially the characteristics of φNE are set
for each characteristic
require (ch[j]) #for company φNE
#For φNE , the implementation level for each process is set
for each ITIL process p_i
{
require (d[p_i]); #for company φNE
V[p_i] ← MAX_IMPLEMENTATION – d[p_i];
}
#Generate initial vector of candidate processes
Φcandidates = {}
for each ITIL process p_i
{
#exclude already fully implemented
if d[p_i] <> MAX_IMPLEMENTATION
Φcandidates = Φcandidates U {process p_i}
}
#Initialize the set ΦSEL={}. This is an empty set of
selected processes.
ΦSEL ← {}
#Generate vectors m and M from the data in database
for each ITIL process p_i in Φcandidates
{
for each characteristic ch[j]
{
for each possible value of ch[j]
{
calculate m[i][j][k]; #expression(11)
M[i][j][k]← MAX_IMPLEMENTATION-m[i][j][k];
}
}
}
#Initialize the criteria for optimization:
#γj = 0 for the characteristics will not be present in (13)
#1>=αj>0 to weight the characteristics will be in (13)
for each characteristic ch[j]
{
require (int γ[j]); # γ[j] =0 or γ[j]=1
require (float α[j]); # 1 >= α[j] >0
}
while ΦSEL <> {}
{
#Evaluate NP for each process in Φcandidates and select the
#minimum value
#
#Initially, NP_min is the first process
NP_min = NP[Φcandidates [1]];
pSEL ← 1; #Process with NP_min
for i← 2 until number of processes in Φcandidates
{
calculate NP[Φcandidates [i]]; #apply expression (13)
if NP[Φcandidates [i]] < NP_min
NP_min ← NP[Φcandidates [i]] #new minimum
pSEL ← i; # New process with new NP_min
}
#Select the process pSEL as pointed out by (15) and
#include it in the set ΦSEL.
ΦSEL ← ΦSEL U {Φcandidates [pSEL]} #include in ΦSEL list
Φcandidates ← Φcandidates - {Φcandidates [pSEL]}#delete in Φcandidates
}
#The ordered optimal sequence is obtained in ΦSEL .
display ΦSEL
}
References
- Mitev, Y.; Kirilov, L.; Using, I.T. Management Processes for Achieving Better Efficiency in the IT Service. In Proceedings of the ICEST 2014, Niš, Serbia, 25–27 June 2014; Volume 1, pp. 247–250, ISBN 978-86-6125-108-5. Available online: http://www.icestconf.org/ (accessed on 31 May 2018).
- Ravasan, A.Z.; Mansouri, T.; Mohammadi, M.M.; Rouhani, S. Supporting the Module Sequencing Decision in ITIL Solution Implementation. Int. J. Inf. Technol. Syst. Approach 2014, 7, 41–60. [Google Scholar] [CrossRef]
- Bahsani, S.; Himi, A.; Moubtakir, H.; Sema, A. Towards a poolimg of ITIL v3 and COBIT. Int. J. Comput. Sci. Issues 2011, 8, 185. [Google Scholar]
- Pérez, D.H. De la Administración al Gobierno de TI. 2008. Available online: http://52.0.140.184/typo43/fileadmin/Revista_97/7_-_tres.pdf (accessed on 31 May 2018).
- Hesch, J. COBIT in relation to other international standars. Inf. Syst. Control J. 2004, 4, 37–40. [Google Scholar]
- Lucio-Nieto, T.; González-Bañales, D.L. Exploring ITIL® Implementation Challenges in Latin American Companies. Int. J. Inf. Technol. Syst. Approach 2019, 12, 73–86. [Google Scholar] [CrossRef]
- Van Bon, J.; de Jong, A.; Kolthof, A.; Pieper, M.; Tjassing, R.; van der Veen, A.; Verheijen, T. Gestión de Servicios TI Basado en ITIL; Van Haren Publishing: Hertogenbosch, The Netherlands, 2016. [Google Scholar]
- Fry, M. ITIL Lite: A Road Map to Full or Partial ITIL Implementation; The Stationery Office: Norwich, UK, 2010; ISBN 0113312121 9780113312122. [Google Scholar]
- Müller, S.D.; De Lichtenberg, C.G. The culture of ITIL: Values and implementation challenges. Inf. Syst. Manag. 2017, 35, 49–61. [Google Scholar] [CrossRef] [Green Version]
- Cater-Steel, P.; Carol, A. Justifications, strategies and critical success factors in successful ITIL implementations in US and Australian companies: An exploratory study. Inf. Syst. Manag. 2009, 26, 164–175. [Google Scholar]
- Sharifi, M.; Ayat, M.; Rahman, A.A.; Sahibudin, S. Lessons learned in ITIL implementation failure. Int. Symp. Inf. Technol. 2008, 1, 1–4. [Google Scholar] [CrossRef]
- Website: Top 10 Reasons Why do ITSM Implementation Fails. Available online: https://www.novelvista.com/blogs/it-service-management/why-itsm-tools-implemenation-fail (accessed on 31 January 2021).
- Cater-Steel, A.; Tan, W.G. Implementation of IT Infrastructure Library (ITIL) in Australia: Progress and Success Factors. In Proceedings of the IT Governance International Conference, Auckland, New Zealand, 14–16 November 2005. [Google Scholar]
- Melendez, K.; Davila, A.; Pessoa, M. Information technology service management models applied to medium and small or-ganizations: A systematic literature review. Comput. Stand. Interfaces 2016, 47, 120–127. [Google Scholar] [CrossRef]
- Iden, J.; Eikebrokk, T.R. The impact of senior management involvement, organisational commitment and group efficacy on ITIL implementation benefits. Inf. Syst. e-Bus. Manag. 2015, 13, 527–552. [Google Scholar] [CrossRef] [Green Version]
- Ahmad, N.; Shamsudin, Z.M. Systematic Approach to Successful Implementation of ITIL. Procedia Comput. Sci. 2013, 17, 237–244. [Google Scholar] [CrossRef] [Green Version]
- Roar, T.; Iden, J. ITIL Implementation: The Role of ITIL Software and Project Quality. In Proceedings of the 2012 23rd Inter-national Workshop on Database and Expert Systems Applications, Vienna, Austria, 3–7 September 2012; IEEE Computer Society: Washington, DC, USA, 2012; pp. 60–64. [Google Scholar] [CrossRef]
- Masarat, A.; Mohammad, S.; Shamsul, S.; Sulaimi, I. Adoption Factors and Implementation Steps of ITSM in the Target. In Proceedings of the 2009 Third Asia International Conference on Modelling & Simulation, Bali, Indonesia, 25–29 May 2009; pp. 369–374. [Google Scholar]
- Shang, S.S.C.; Lin, S.-F. Barriers to Implementing ITIL-A Multi-Case Study on the Service-based Industry. Contemp. Manag. Res. 2010, 6, 53. [Google Scholar] [CrossRef]
- Khosravi, H.; Wang, J. How to Implement ITIL Successfully?: What Steps are Necessary to Implement ITIL What Factors Are Critical within Implementation Process; LAP Lambert Academic Publishing: Jonkoping, Germany, 2011; ISBN 978-3-8454-7646-9. [Google Scholar]
- Mohammed, T.A. Critical Success Factors for Information Technology Infrastructure Library Implementation in Public Service Organizations: An Exploratory Study. Int. J. Adv. Inf. Technol. 2018, 8, 1–19. [Google Scholar] [CrossRef]
- Sousa, R.; Mira, M. A Maturity Model for Implementing ITIL v3. In Proceedings of the 2010 IEEE 6th World Congress on Services, Miami, FL, USA, 5–10 July 2010. [Google Scholar]
- Binders, Z.; Romanovs, A. ITIL Self-assessment Approach for Small and Medium Digital Agencies/ ITIL pašnovērtējuma pieeja mazām un vidējām digitālām aģentūrām/ Пoдхoд самooценки ITIL для малых и средних цифрoвых агентств. Inf. Technol. Manag. Sci. 2014, 17, 138–143. [Google Scholar] [CrossRef] [Green Version]
- Ahmad, N.; Amer, N.T.; Qutaifan, F.; AlHilali, A. Technology adoption model and a road map to successful implementation of ITIL. J. Enterp. Inf. Manag. 2013, 26, 553–576. [Google Scholar] [CrossRef] [Green Version]
- Arcilla, M.; Ruiz, E.; Cerrada, C.; Gómez, G.; Calvo-Manzano, J.A.; San Feliu, T.; Sánchez, A. Una propuesta organi-zativa de los procesos de SD y SS en ITIL. REICIS Rev. Esp. Innov. Calid. Ing. Softw. 2007, 3, 6–20. [Google Scholar]
- Arcilla, M.; Calvo, J.; Cuevas, G.; Gómez, G.; Ruiz, E.; San Feliu, T. A Solution for Establishing the Information Technology Service Management Processes Implementation Sequence. In European Conference on Software Process Improvement; Springer: Berlin/Heidelberg, Germany, 2008; pp. 106–116. [Google Scholar]
- Pastuszak, J.; Czarnecki, A.; Orlowski, C. Ontologically Aided Rule Model for the Implementation of ITIL Processes. In Advances in Knowledge-Based and Intelligent Information and Engineering Systems; IOS Press: Amsterdam, The Netherlands, 2012; pp. 1428–1438. [Google Scholar]
- Lema, L.; Calvo-Manzano, J.-A.; Colomo-Palacios, R.; Arcilla, M. ITIL in small to medium-sized enterprises software companies: Towards an implementation sequence. J. Softw. Evol. Process. 2015, 27, 528–538. [Google Scholar] [CrossRef]
- Calvo-Manzano, J.A.; De Madrid, U.P.; Moreta, L.L.; Cobián, M.A.; Sánchez, J.L.R.; Distancia, U.N.D.E.A. How small and medium enterprises can begin their implementation of ITIL? Rev. Fac. Ing. Univ. Antioquia 2015, 77, 127–136. [Google Scholar] [CrossRef]
- Scalabrin, I.; Sousa, R. IT Governance for Public Universities: Developing a Model. 2015. Available online: https://repositorium.sdum.uminho.pt/handle/1822/52947 (accessed on 31 January 2021).
- Figueroa, C.E.P.; Maestre-Góngora, G.P. Plan estratégico basado en ITIL para mipymes en el departamento de Arauca-Colombia. Lámpsakos 2019, 68–84. [Google Scholar] [CrossRef]
- Lema, L. ITIL in Small to Medium-Sized Enterprises: Toward a Proposal Based on an ITIL Processes Implementation Sequence and a Profile Scheme Strategy for Implementing the First Process in the Sequence. Master’s Thesis, Lenguajes y Sistemas Informáticos e Ingeniería del Software, Universidad Politécnica de Madrid, Madrid, Spain, 2015. Available online: http://oa.upm.es/36237/ (accessed on 31 January 2021).
- Zarrazvand, H.; Shojafar, M. The Use of Fuzzy Cognitive Maps in Analyzing and Implementation of ITIL Processes. arXiv 2012, arXiv:1206.2297. [Google Scholar]
- Menken, I. ITIL V3 Implementation Quick Guide–The Art of Stress-Free IT Service Management; Emereo Pty Ltd.: London, UK, 2009. [Google Scholar]
- Marrone, M.; Gacenga, F.; Cater-Steel, A.; Kolbe, L. IT Service Management: A Cross-national Study of ITIL Adoption. Commun. Assoc. Inf. Syst. 2014, 34, 49. [Google Scholar] [CrossRef] [Green Version]
- Miller, A.C. Implementation Priority of the ITIL Framework Based on a Process Sequencing Model. Ph.D. Thesis, The George Washington University, Washington, DC, USA, 2017. Available online: https://scholarspace.library.gwu.edu/concern/gw_etds/gq67jr26z?locale=en (accessed on 31 January 2021).
- Mehravani, S.; Haghighinasan, M.; Hajjiheydari, N. ITIL Adoption Model Based on TAM. In Proceedings of the 2011 International Conference on Social Science and Humanity, Singapore, 26–28 February 2011; IACSIT Press: Singapore, 2011; Volume 5. [Google Scholar]
- Juan Luis Rubio. Available online: https://doi.org/10.5281/zenodo.4587237 (accessed on 31 January 2021).
- Institute of Singel Sciences & itSMF, 2013, itSMF Global Survey Study on IT Service Management. Available online: http%3A%2F%2Fwww.itil.co.il%2Fwp-content%2Fuploads%2F2015%2F02%2FitSMF-2013-Service-Management-Survey-Report.pdf&usg=AOvVaw3lhlDklRSg4K7IcT3f9j8X (accessed on 31 January 2021).
- Lacave, C.; Molina, A.; Fernandez, M.; Redondo, M.A. Análisis de la Fiabilidad y Validez de un Cuestionario. Revista de Investigación en Docencia Univesitaria de Informática. AEUNI, 2015. Available online: http://www.aenui.net/ojs/index.php?journal=revision&page=article&op=viewArticle&path%5B%5D=219&path%5B%5D=373 (accessed on 31 January 2021).
- Cronbach, L. Coefficient alpha and internal structure of tests. Psychometrika 1951, 16, 297–334. [Google Scholar] [CrossRef] [Green Version]
- Desu, M. Sample Size Methodology; Academyc Press: Cambridge, MA, USA, 1990; ISSN 9780323139564. [Google Scholar]
- Taherdoost, H. Determining sample size; how to calculate survey sample size. Int. J. Econ. Manag. Syst. 2017, 2, 237–239. [Google Scholar]
- Otzen, T.; Manterola, C. Técnicas de Muestreo sobre una Población a Estudio. Int. J. Morphol. 2017, 35, 227–232. [Google Scholar] [CrossRef] [Green Version]
- Siqueira, S.; Yasumasa, D.; Nakata, A.; Fujita, A. A comparative study of statistical methods used to identify dependencies between gene expression signals. Brief. Bioinform. 2014, 15, 906–918. [Google Scholar]
- Zhang, L.; Lu, D.; Wang, X. Measuring and testing interdependence among random vectors based on Spearman’s ρ and Kendall’s τ. Comput. Stat. 2020, 35, 1685–1713. [Google Scholar] [CrossRef]
- Rabcan, J.; Levashenko, V.; Zaitseva, E.; Kvassay, M.; Subbotin, S. Application of fuzzy decision tree for signal classification. IEEE Trans. Ind. Inform. 2019, 15, 5425–5434. [Google Scholar] [CrossRef]
- Barravecchia, F.; Mastrogiacomo, L.; Fiorenzo, F. Categorizing quality determinants in mining user-generated contents. Sustainability 2020, 12, 9944. [Google Scholar] [CrossRef]
- Levashenko, V.; Zaitseva, E.; Puuronen, S. Fuzzy Classifier Based on Fuzzy Decision Tree. In Proceedings of the EUROCON 2007—The Inter-national Conference on “Computer as a Tool”, Warsaw, Poland, 9–12 September 2007; pp. 823–827. [Google Scholar]
- Ramparany, F.; Chotard, L.; Benazzouz, Y.; Beaune, P. Context Data-Driven Approach for Ubiquitous Computing Applications. In Proceedings of the 4th International Conference on Digital Information Management, Ann Arbor, MI, USA, 1–4 November 2009; pp. 234–239. [Google Scholar]
- Herrera-Viedma, E.; Palomares, I.; Li, C.C.; Cabrerizo, F.J.; Dong, Y.; Chiclana, F.; Herrera, F. Revisiting Fuzzy and Linguistic Decision Making: Scenarios and Challenges for Making Wiser Decisions in a Better Way. IEEE Trans. Syst. Man Cybern. Syst. 2021, 51, 191–208. [Google Scholar] [CrossRef]
- Zhang, C.; Wu, W.; Pedrycz, A. Novel Group Decision-Making Method for Interval-Valued Intuitionistic Multiplicative Pref-erence Relations. IEEE Trans. Fuzzy Syst. 2020, 28, 1799–1814. [Google Scholar] [CrossRef]
- Wang, X.-C.; Xu, Z.; Xu, X.-J.; Zeng, W. Pedrycz, An Aspiration-Based Approach for Qualitative Decision-Making with Complex Linguistic Expressions; IEEE Access: Washington, DC, USA, 2019; Volume 7. [Google Scholar]
Figure 1.
Schema of relations: algorithm–model–database.

Figure 2.
Steps to obtain the sequence of ITIL processes.

Table 1.
Description of the survey.
| Concept | Value |
|---|---|
| Scope | Spain |
| Universe | Small companies |
| Type of survey | Web form |
| Sent | 200 |
| Received | 131 |
| Minimum to be significant | 69 |
| Confidence level | 90% |
| Error | 10% |
| Company selection | Random |
| Mode | Mono-etape |
Table 2.
Description of the company.
| Concept | Value |
|---|---|
| Staff | 50–249 |
| IT Staff | 10–14 |
| Age | +15 |
| Operating area | International |
| Industry | Leisure |
Table 3.
Processes of the sequence obtained.
| Process Order | Process | Process Order | Process |
|---|---|---|---|
| 1 | Strategic mng * | 14 | Continuity mng |
| 2 | Supply mng | 15 | Service level mng |
| 3 | Financial mng | 16 | Continuous improv. mng |
| 4 | Demand mng | 17 | Validation&test mng |
| 5 | Design mng | 18 | Versions&deploy mng |
| 6 | Design coordination | 19 | Asset&conf. mng |
| 7 | Service portfolio mng. | 20 | Availability mng |
| 8 | Requirements mng | 21 | Knowledge mng |
| 9 | Events mng | 22 | Incidences mng |
| 10 | Changes mng | 23 | Access mng |
| 11 | Changes mng | 24 | Services catalog mng |
| 12 | Transition scheduling | 25 | Problem mng |
| 13 | Capacity mng | 26 | Business relation mng |
(*) Abbreviation Mng stands for management.
Table 4.
Spearman contrast: results.
| Sequence | Spearman: ρ | Limits Level Signif.: 95% | Result |
|---|---|---|---|
| [32] | −0.04 | (−0.46, +0.46) | Accept H0 |
| [36] | −0.53 | (−0.41, +0.41) | Reject H0 |
| [6] | −0.31 | (−0.62, +0.62) | Accept H0 |
| [35] | −0.35 | (−0.43, +0.43) | Accept H0 |
| [25] | −0.20 | (−0.70, +0.70) | Accept H0 |
| [2] | 0.08 | (−0.90, +0.90) | Accept H0 |
| [27] | −0.18 | (−0.65, +0.65) | Accept H0 |
Table 5.
Kendall contrast: results.
| Sequence | Kendall: τ | Limits Level Conf.: 95% | Result |
|---|---|---|---|
| [32] | +0.06 | (+0.33, −0.33) | Accept H0 |
| [36] | −0.08 | (−0.29, +0.29) | Accept H0 |
| [6] | −0.02 | (−0.49, +0.49) | Accept H0 |
| [35] | +0.13 | (−0.30, +0.30) | Accept H0 |
| [25] | −0.72 | (−0.55, +0.55) | Reject H0 |
| [2] | +0.07 | (−0.87, +0.87) | Accept H0 |
| [27] | +0.11 | (−0.55, +0.55) | Accept H0 |
Publisher’s Note: MDPI stays neutral with regard to jurisdictional claims in published maps and institutional affiliations. |
© 2021 by the author. Licensee MDPI, Basel, Switzerland. This article is an open access article distributed under the terms and conditions of the Creative Commons Attribution (CC BY) license (https://creativecommons.org/licenses/by/4.0/).
Share and Cite
MDPI and ACS Style
Rubio Sánchez, J.L. Model to Optimize the Decision Making on Processes in IT Departments. Mathematics 2021, 9, 983. https://doi.org/10.3390/math9090983
AMA Style
Rubio Sánchez JL. Model to Optimize the Decision Making on Processes in IT Departments. Mathematics. 2021; 9(9):983. https://doi.org/10.3390/math9090983
Chicago/Turabian StyleRubio Sánchez, Juan Luis. 2021. "Model to Optimize the Decision Making on Processes in IT Departments" Mathematics 9, no. 9: 983. https://doi.org/10.3390/math9090983
Note that from the first issue of 2016, this journal uses article numbers instead of page numbers. See further details here.