Regional Disparities and Spatial Dependence of Bankruptcy in Spain
Abstract
:1. Introduction
2. Theoretical and Conceptual Framework
2.1. Bankruptcy and Turnaround
2.2. The Spanish Bankruptcy System
2.3. Spatial Autocorrelation and Bankruptcy
3. Materials and Methods
3.1. Sample and Data
3.2. Variables and Standardization of Variables
- (a)
- Outcome
- (b) The predictors or explanatory variables
- (c) Preliminary analysis
3.3. Methods
- (a)
- Moran’s Global Index and Local Indicators of Spatial Association (LISA)
- (b) Moran’s Bivariate Index and Bi Local Indicators of Spatial Association (LISA)
4. Results
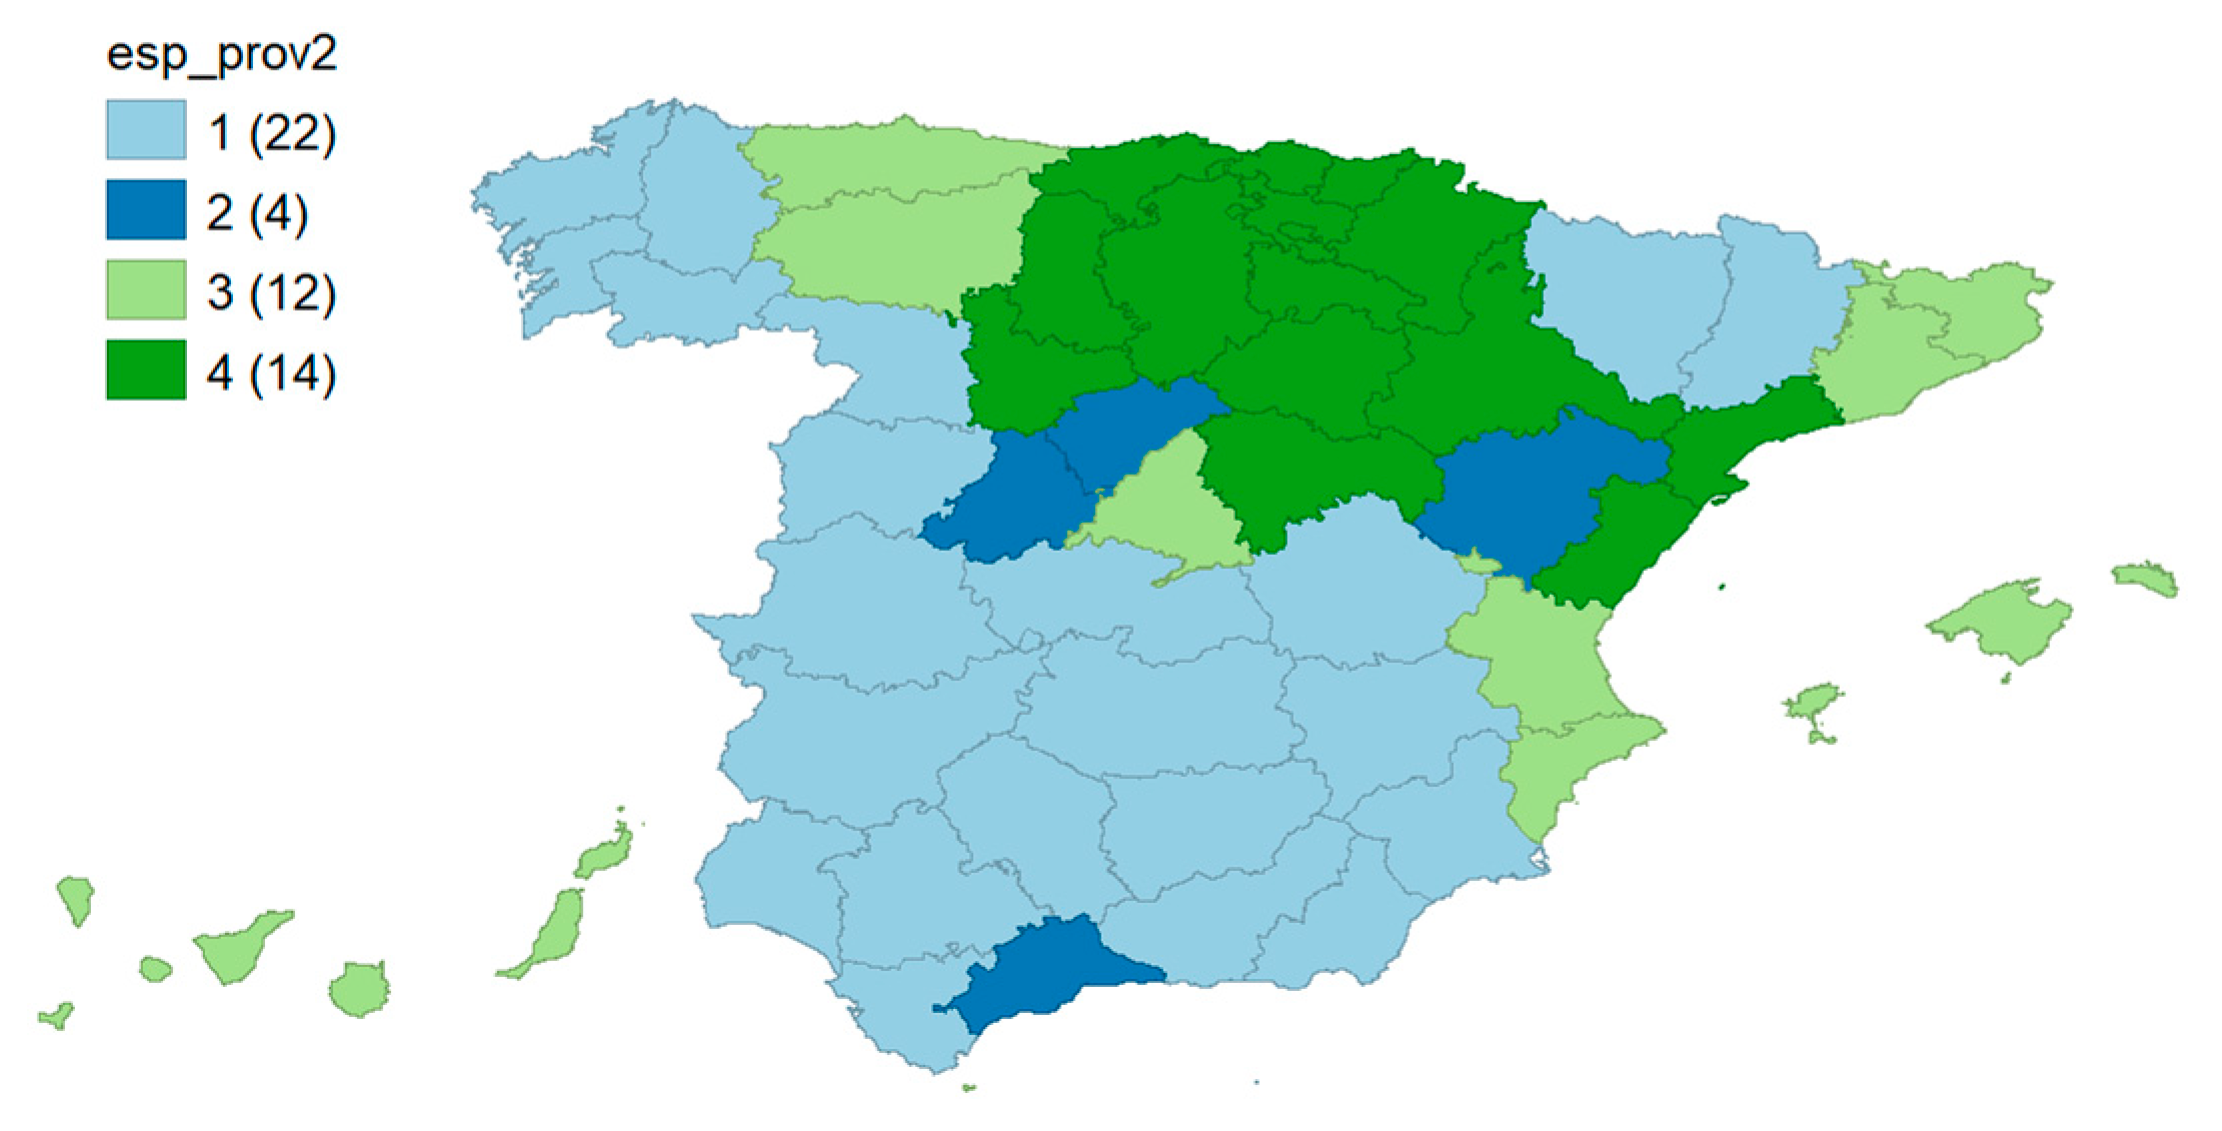
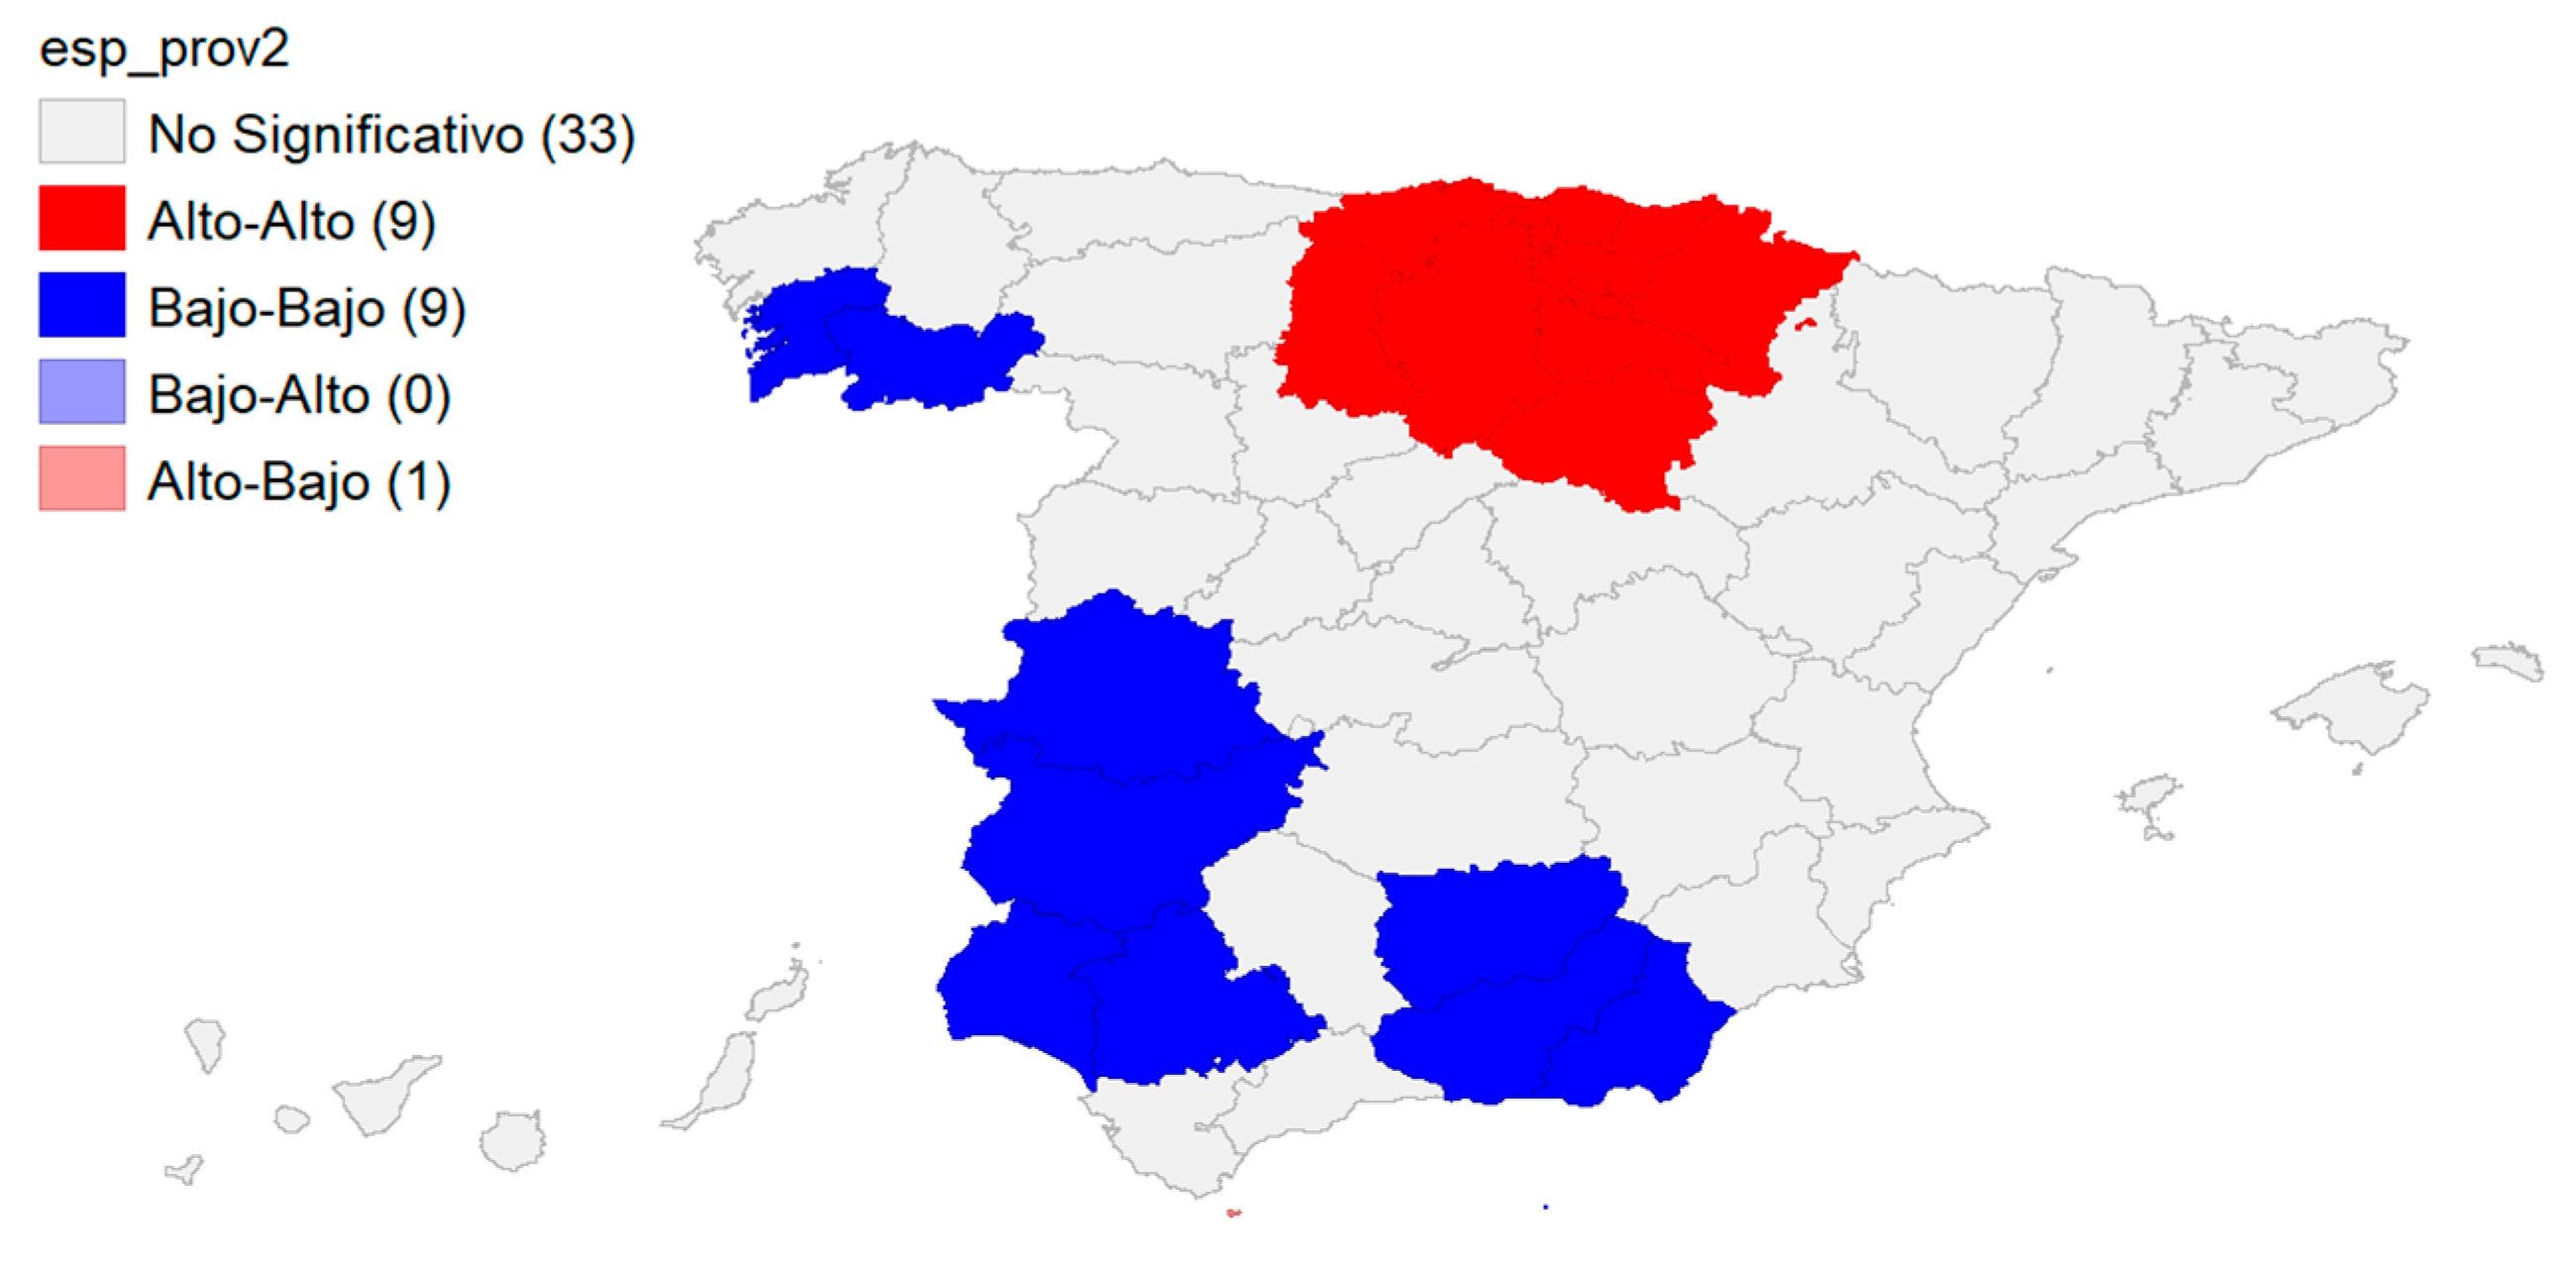
4.1. Industrial Specialization by Province and the Bankruptcy Outcome
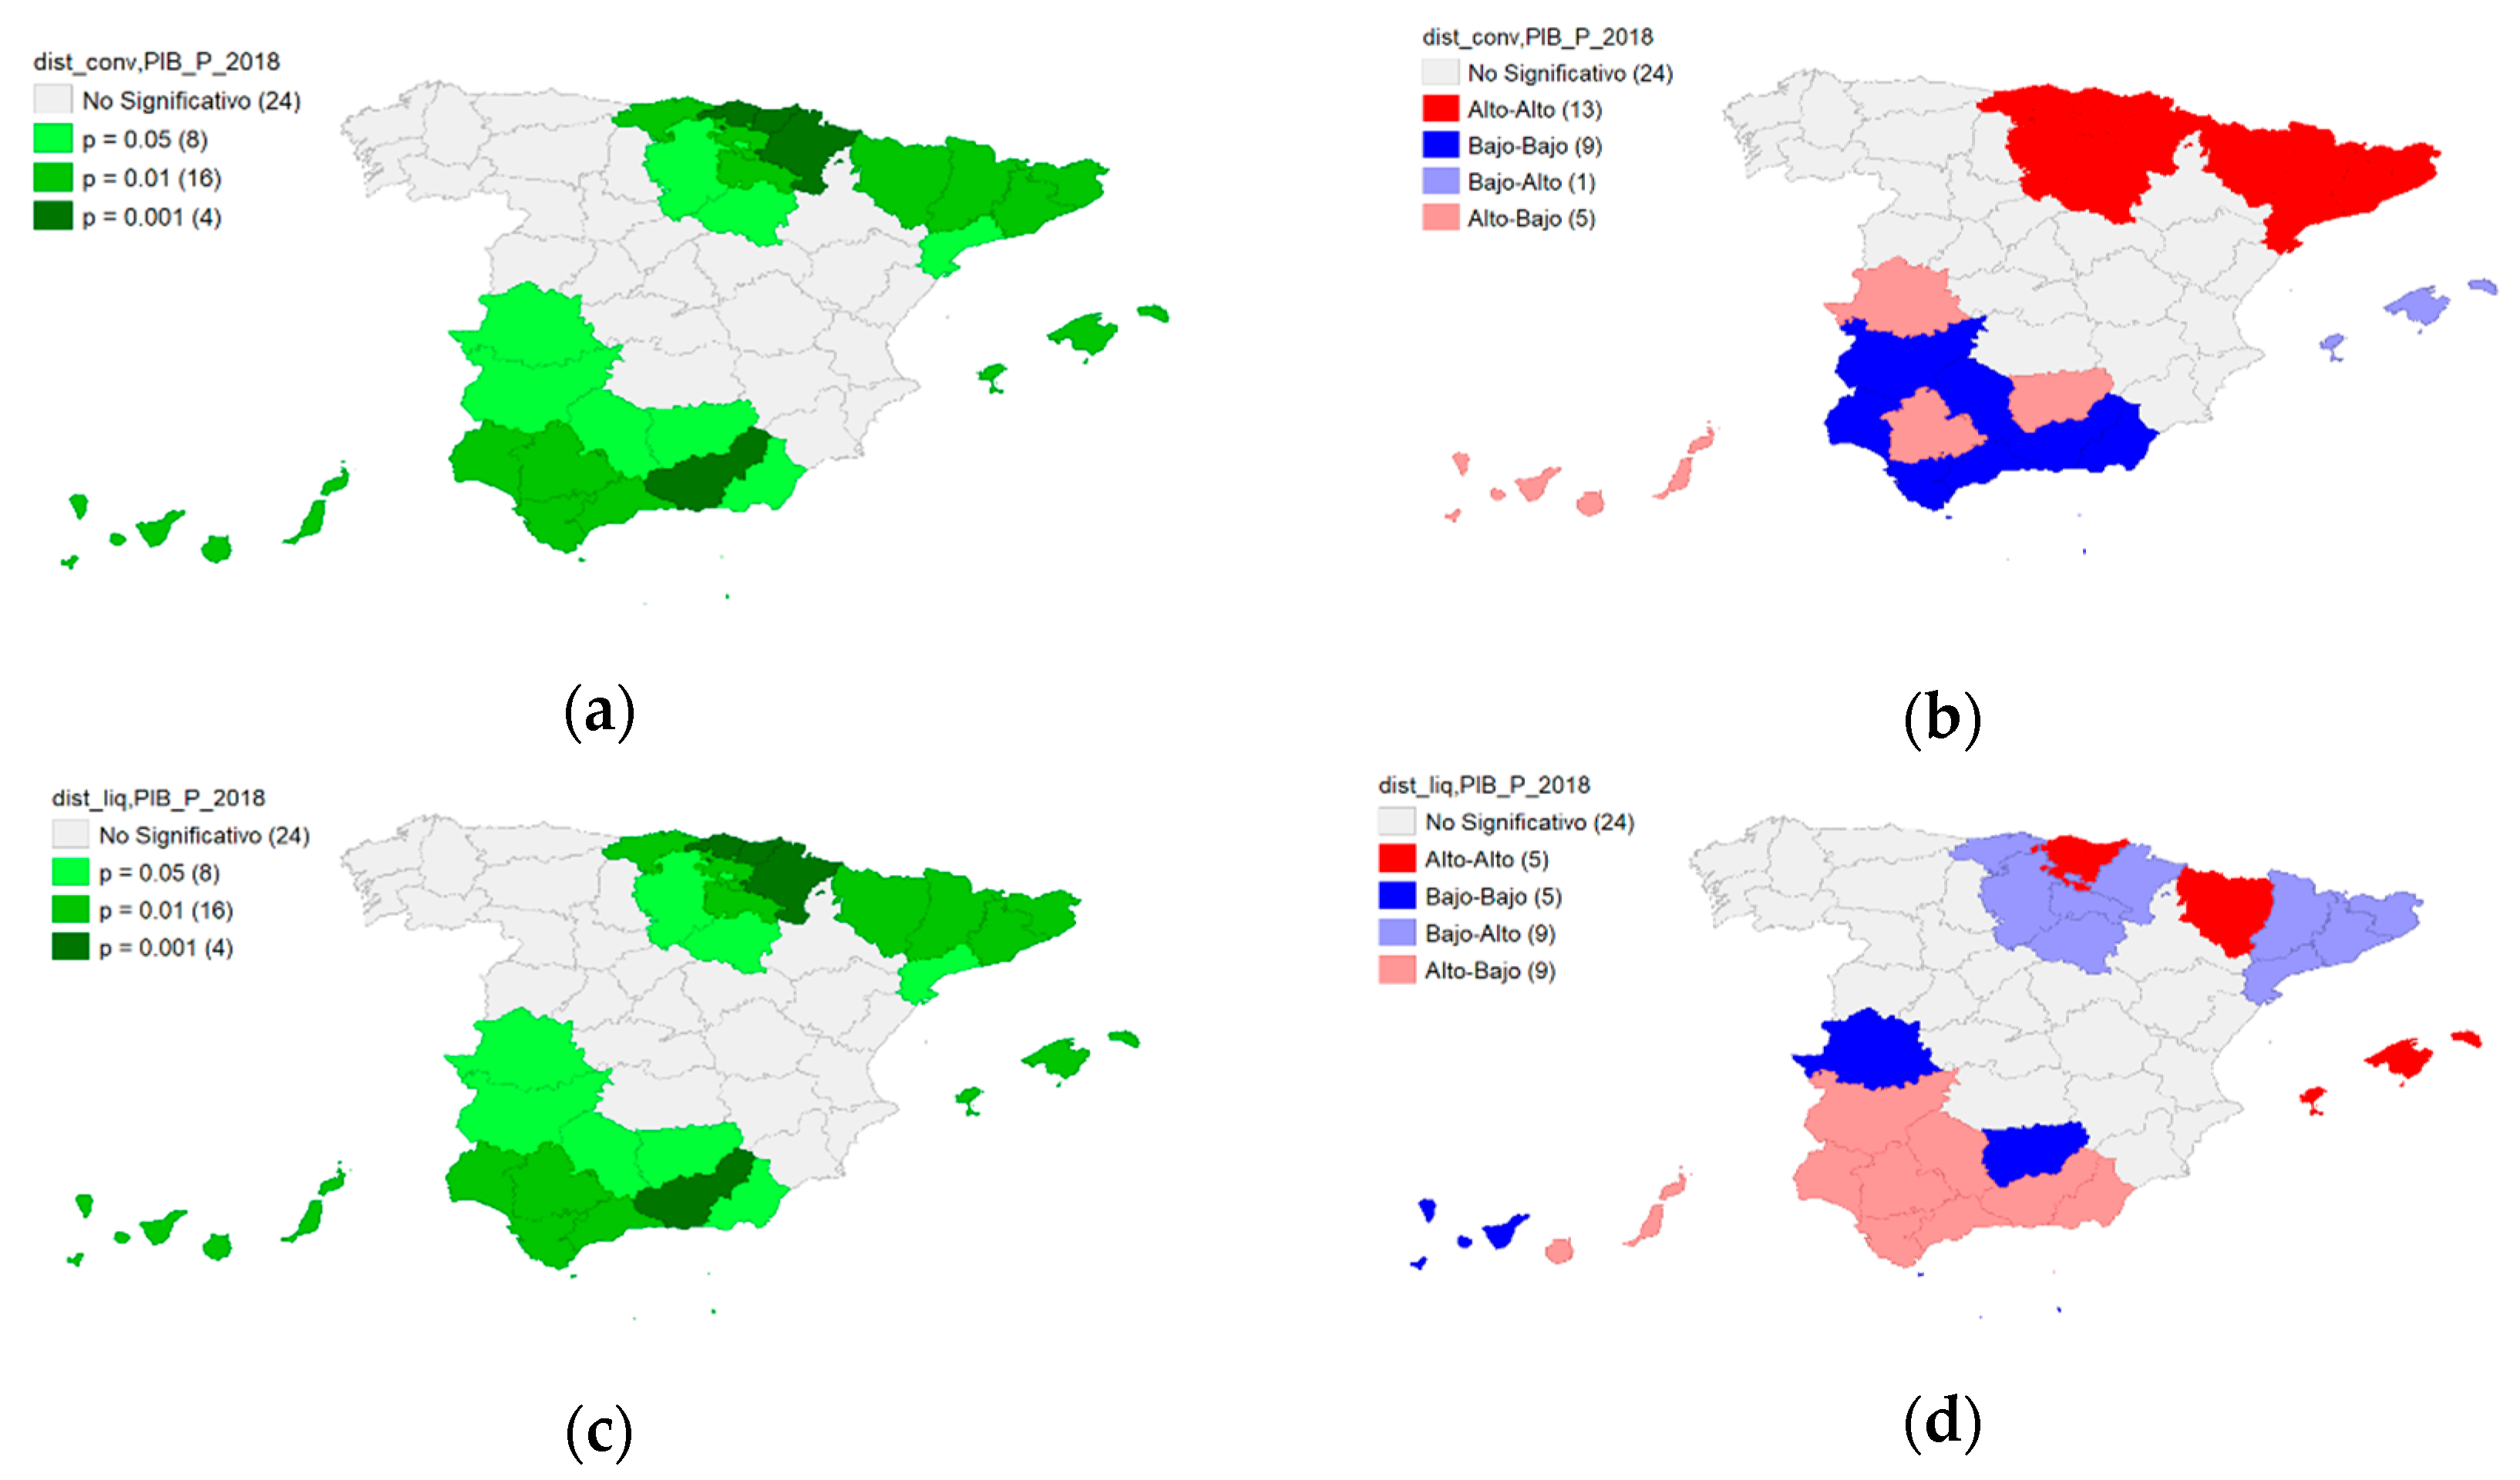
4.2. GDP Specialization by Province and the Bankruptcy Outcome
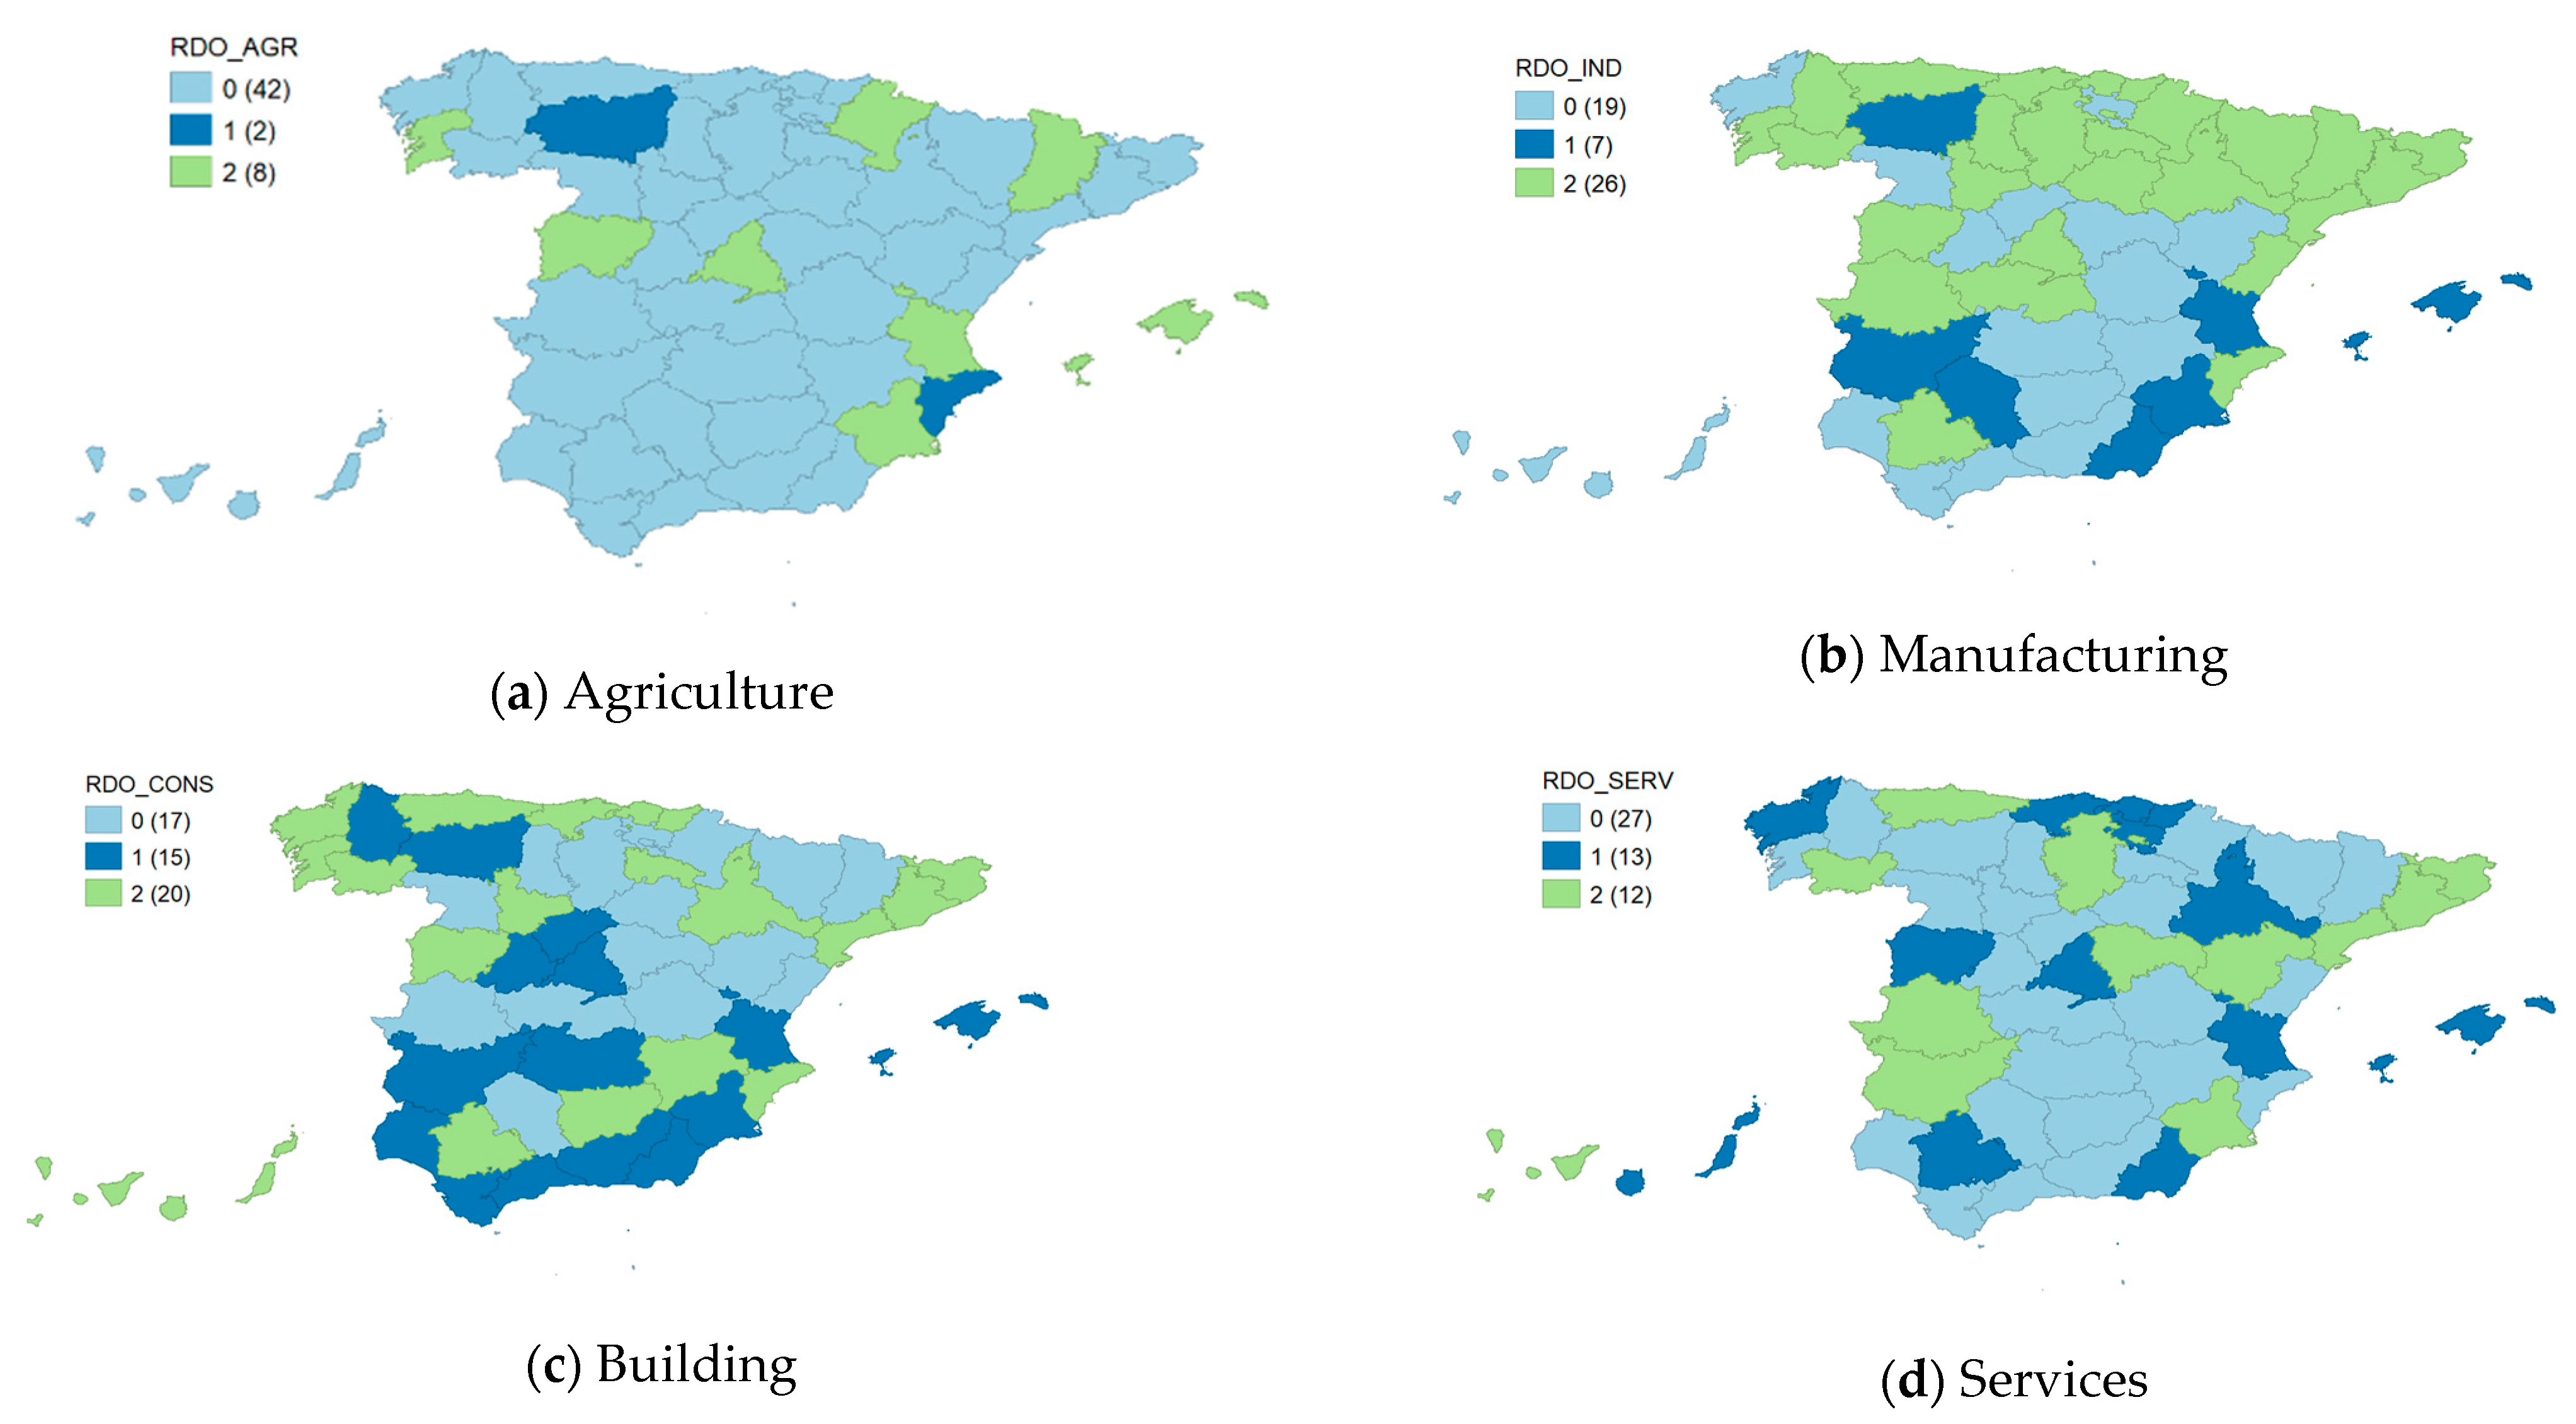
4.3. Contrasting Industry Specialization with the Bankruptcy Outcome by Province
4.4. Contrasting Business Factor (Size) with the Bankruptcy Outcome by Province
4.5. Contrasting Unemployment Levels with the Bankruptcy Outcome by Province
5. Discussion and Conclusions
Author Contributions
Funding
Institutional Review Board Statement
Informed Consent Statement
Data Availability Statement
Conflicts of Interest
References
- McKinley, W.; Latham, S.; Braun, M. Organizational decline and innovation: Turnarounds and downward spirals. Acad. Manag. Rev. 2014, 39, 88–110. [Google Scholar] [CrossRef]
- Altman, E.; Hotchkiss, E. Corporate Financial Distress and Bankruptcy; John Wiley & Sons: New Jersey, NJ, USA, 2006. [Google Scholar]
- Kliestik, T.; Misankova, M.; Valaskova, K.; Svabova, L. Bankruptcy prevention: New effort to reflect on legal and social changes. Sci. Eng. Ethics 2018, 24, 791–803. [Google Scholar] [CrossRef]
- Franks, J.R.; Sussman, O. Financial distress and bank restructuring of small to medium size UK companies. Rev. Financ. 2005, 9, 65–96. [Google Scholar] [CrossRef]
- Pandit, N.R.; Cook, G.A.S.; Chittenden, F.C. Corporate rescue: Empirical evidence on company voluntary arrangements and small firms. J. Small Bus. Enterp. Dev. 2000, 7, 241–254. [Google Scholar] [CrossRef]
- Trahms, C.A.; Ndofor, H.A.; Sirmon, D.G. Organizational decline and turnaround: A review an agenda for future research. J. Manag. 2013, 39, 1277–1307. [Google Scholar] [CrossRef]
- Wenzel, M.; Stanske, S.; Lieberman, M.B. Strategic responses to crisis. Strat. Manag. J. 2020, in press. [Google Scholar] [CrossRef] [Green Version]
- García-Marí, J.H.; Sánchez-Vidal, J.; Tomaseti-Solano, E. Fracaso empresarial y efectos contagio. Un análisis espacial para España. Trimest. Económico 2016, 83, 429–449. [Google Scholar] [CrossRef] [Green Version]
- Tobler, W.R. A computer movie simulating urban growth in the Detroit region. Econ. Geogr. 1970, 46 (Suppl. S1), 234–240. [Google Scholar] [CrossRef]
- Frenken, K.; Cefis, E.; Stam, E. Industrial dynamics and clusters: A survey. Reg. Stud. 2015, 49, 10–27. [Google Scholar] [CrossRef] [Green Version]
- Staber, U. Spatial Proximity and Firm Survival in a Declining Industrial District: The Case of Knitwear Firms in Baden-Wurttemberg. Reg. Stud. 2001, 35, 329–341. [Google Scholar] [CrossRef]
- Arogyaswamy, K.; Barker, V.L.; Yasai-Ardekani, M. Firm Turnarouns: An integrative two-stage model. J. Manag. Stud. 1995, 32, 493–525. [Google Scholar] [CrossRef]
- Robbins, D.K.; Pearce, J.A., II. Turnaround: Retrenchment and recovery. Strateg. Manag. J. 1992, 13, 287–309. [Google Scholar] [CrossRef]
- Cater, J.; Schwab, A. Turnaround strategies in established small family firms. Fam. Bus. Rev. 2008, 21, 31–50. [Google Scholar] [CrossRef]
- Lim, D.S.; Celly, N.; Morse, E.A.; Rowe, W.G. Rethinking the effectiveness of asset and cost retrenchment: The contingency effects of a firm’s rent creation mechanism. Strateg. Manag. J. 2013, 34, 42–61. [Google Scholar] [CrossRef]
- Morrow, J.L., Jr.; Johnson, R.A.; Busenitz, L.W. The effects of cost and asset retrenchment on firm performance: The overlooked role of a firm’s competitive environment. J. Manag. 2004, 30, 189–208. [Google Scholar] [CrossRef]
- Rico, M.; Pandit, N.R.; Puig, F. SME insolvency, bankruptcy, and survival: An examination of retrenchment strategies. Small Bus. Econ. 2020, 1–16. [Google Scholar] [CrossRef]
- Barbero, J.L.; Martínez, J.A.; Moreno, A.M. Should Declining Firms Be Aggressive During the Retrenchment Process? J. Manag. 2018, 46, 15. [Google Scholar] [CrossRef] [Green Version]
- Barbero, J.L.; Ramos, A.; Chiang, C. Restructuring in dynamic environments: A dynamic capabilities perspective. Ind. Corp. Chang. 2017, 26, 593–615. [Google Scholar] [CrossRef]
- Tangpong, C.; Abebe, M.; Li, Z. A temporal approach to retrenchment and successful turnaround in declining firms. J. Manag. Stud. 2015, 52, 647–677. [Google Scholar] [CrossRef]
- Porter, M.E. Clusters and the New Economics of Competition. Harv. Bus. Rev. 1998, 76, 77–90. [Google Scholar]
- Claver-Cortés, E.; Marco-Lajara, B.; Seva-Larrosa, P.; Ruiz-Fernández, L. Competitive advantage and industrial district: A review of the empirical evidence about the district effect. Compet. Rev. Int. Bus. J. 2019, 29, 211–235. [Google Scholar] [CrossRef]
- Puig, F.; García-Mora, B.; Santamaría, C. The influence of geographical concentration and structural characteristics on the survival chance of textile firms. J. Fash. Mark. Manag. Int. J. 2013, 17, 6–19. [Google Scholar] [CrossRef] [Green Version]
- Baum, J.A.; Mezias, S.J. Localized competition and organizational failure in the Manhattan hotel industry, 1898–1990. Adm. Sci. Q. 1992, 37, 580–604. [Google Scholar] [CrossRef]
- Van Hemmen, E. Estadística Concursal. Anuario 2017; Colegio de Registradores de la Propiedad, Bienes Muebles y Mercantiles de España, Ed.; Colegio de Registradores de la Propiedad, Bienes Muebles y Mercantiles de España: Madrid, Spain, 2018. [Google Scholar]
- Davydenko, S.A.; Franks, J.R. Do bankruptcy codes matter? A study of defaults in France, Germany and the U.K. J. Financ. 2008, 63, 565–608. [Google Scholar] [CrossRef]
- García-Posada, M.; Mora-Sanguinetti, J. Why do Spanish Firms Rarely Use the Bankruptcy System. The Role of Mortgage Institution; Working paper no. 1234; Bank of Spain: Madrid, Spain, 2012. [Google Scholar]
- Andreano, M.S.; Benedetti, R.; Mazzitelli, A.; Piersimoni, F. Spatial autocorrelation and clusters in modelling corporate bankruptcy of manufacturing firms. Econ. Politica Ind. 2018, 45, 475–491. [Google Scholar] [CrossRef]
- Falavigna, G.; Ippoliti, R. Industrial spatial dynamics, financial health and bankruptcy: Evidence from Italian manufacturing industry. Econ. Politica Ind. 2018, 45, 533–554. [Google Scholar] [CrossRef]
- Matheron, G. Random functions and their application in geology. In Geostatistics; Springer: Boston, MA, USA, 1970; pp. 79–87. [Google Scholar]
- García-Posada, M.; Vegas, R. Las reformas de la Ley Concursal durante la Gran Recesión; Working paper no. 1610; Bank of Spain: Madrid, Spain, 2016. [Google Scholar]
- Thornhill, S.; Amit, R. Learning about failure: Bankruptcy, firm age, and the resource-based view. Organ. Sci. 2003, 14, 497–509. [Google Scholar] [CrossRef] [Green Version]
- Jas, P.; Skelcher, C. Performance decline and turnaround in public organizations: A theoretical and empirical analysis. Br. J. Manag. 2005, 16, 195–210. [Google Scholar] [CrossRef]
- Rico, M.; Puig, F. Why do Spanish football clubs success in their insolvency proceedings? Universia Bus. Rev. 2015, 48, 52–69. [Google Scholar]
- Pozuelo, J.; Labatut, G.; Veres, E. Validez de la información financiera en los procesos de insolvencia. Un estudio de la pequeña empresa española. Cuad. Econ. Dir. Empresa 2013, 16, 29–40. [Google Scholar]
- Van Hemmen, E. Formalismo judicial, control e incentivos en el concurso de acreedores. Rev. Estab. Financ. 2009, 16, 113–144. [Google Scholar]
- Cromley, R.G.; Hanink, D.M. Focal location quotients: Specification and applications. Geogr. Anal. 2012, 44, 398–410. [Google Scholar] [CrossRef]
- Tian, Z.; Gottlieb, P.D.; Goetz, S.J. Measuring industry co-location across county borders. Spat. Econ. Anal. 2020, 15, 92–113. [Google Scholar] [CrossRef]
- Speldekamp, D.; Saka-Helmhout, A.; Knoben, J. Reconciling perspectives on clusters: An integrative review and research agenda. Int. J. Manag. Rev. 2020, 22, 75–98. [Google Scholar] [CrossRef] [Green Version]
- Belso Martínez, J.A. Equilibrium entrepreneurship rate, economic development and growth. Evidence from Spanish regions. Entrep. Reg. Dev. 2005, 17, 145–161. [Google Scholar] [CrossRef]
- Audretsch, D.B.; Keilbach, M. The localisation of entrepreneurship capital: Evidence from Germany. Pap. Reg. Sci. 2007, 86, 351–365. [Google Scholar] [CrossRef]
- Anselin, L. Local indicators of spatial association—LISA. Geogr. Anal. 1995, 27, 93–115. [Google Scholar] [CrossRef]
- Anselin, L. Exploring spatial data with GeoDaTM: A workbook. Urbana 2004, 51, 309. [Google Scholar]
- Plummer, L.A. Spatial dependence in entrepreneurship research: Challenges and methods. Organ. Res. Methods 2020, 13, 146–175. [Google Scholar] [CrossRef]
- Ponce, P.; Álvarez-García, J.; Cumbicus, M.; Rio-Rama, M.d.l.C. Spatial Externalities of Income Inequality on Security in Latin America. Mathematics 2021, 9, 245. [Google Scholar] [CrossRef]
- Cliff, A.D.; Ord, K. Spatial autocorrelation: A review of existing and new measures with applications. Econ. Geogr. 1970, 46 (Suppl. S1), 269–292. [Google Scholar] [CrossRef]
- Cantarero, S.; González-Loureiro, M.; Puig, F. Efectos de la crisis económica sobre el emprendimiento en empresas de economía social en España: Un análisis espacial. REVESCO. Rev. Estud. Coop. 2017, 125, 24–48. [Google Scholar]
- García, V.; Marqués, A.I.; Sánchez, J.S. Exploring the synergetic effects of sample types on the performance of emsembles for credit risk and corporate bankruptcy prediction. Inf. Fusion 2018, 47, 88–101. [Google Scholar] [CrossRef]
- Valaskova, K.; Durana, P.; Adamko, P.; Jaros, J. Financial compass for Slovak Enterprises: Modeling economic stability of agricultural entities. J. Risk Financ. Manag. 2020, 13, 92. [Google Scholar] [CrossRef]
- Boettcher, J.; Cavanagh, G.; Xu, M. Ethical Issues that arise in bankruptcy. Bus. Soc. Rev. 2014, 119, 473–496. [Google Scholar] [CrossRef]






| AGRI | BUIL | SERV | MANU | Iag IE | |
|---|---|---|---|---|---|
| Álava | 0.64 | 0.50 | 0.72 | 1.97 | 4 |
| Albacete | 3.31 | 0.84 | 0.84 | 0.83 | 1 |
| Alicante | 0.60 | 1.15 | 0.97 | 0.55 | 3 |
| Almería | 5.67 | 1.08 | 0.78 | 0.52 | 1 |
| Asturias | 0.39 | 1.04 | 8.68 | 1.13 | 3 |
| Ávila | 0.99 | 1.30 | 0.95 | 0.55 | 2 |
| Badajoz | 3.22 | 0.91 | 0.86 | 0.66 | 1 |
| Balears, Illes | 0.20 | 1.18 | 1.04 | 0.34 | 3 |
| Barcelona | 0.17 | 0.76 | 0.91 | 1.09 | 3 |
| Bizkaia | 0.08 | 1.30 | 0.87 | 1.08 | 4 |
| Burgos | 0.97 | 1.06 | 0.71 | 1.74 | 4 |
| Cáceres | 2.46 | 1.36 | 0.82 | 0.86 | 1 |
| Cádiz | 1.06 | 0.85 | 0.91 | 0.89 | 1 |
| Cantabria | 0.48 | 1.02 | 0.85 | 1.20 | 4 |
| Castelló | 0.79 | 0.87 | 0.70 | 1.90 | 4 |
| Ciudad Real | 3.54 | 1.07 | 0.75 | 1.09 | 1 |
| Córdoba | 3.05 | 0.89 | 0.87 | 0.68 | 1 |
| Coruña, A | 1.22 | 1.10 | 0.86 | 0.98 | 1 |
| Cuenca | 4.98 | 1.06 | 0.73 | 0.88 | 1 |
| Gipuzkoa | 0.18 | 1.01 | 0.81 | 1.44 | 4 |
| Girona | 0.87 | 1.03 | 0.89 | 0.93 | 3 |
| Granada | 2.29 | 1.00 | 0.94 | 0.45 | 1 |
| Guadalajara | 1.13 | 0.90 | 0.78 | 1.43 | 4 |
| Huelva | 2.39 | 0.97 | 0.78 | 1.20 | 1 |
| Huesca | 4.54 | 0.89 | 0.73 | 1.04 | 1 |
| Jaén | 3.72 | 0.91 | 0.84 | 0.69 | 1 |
| León | 0.86 | 0.96 | 0.93 | 0.80 | 3 |
| Lleida | 1.59 | 1.13 | 0.88 | 0.83 | 1 |
| Lugo | 2.95 | 1.19 | 0.81 | 0.88 | 1 |
| Madrid | 0.02 | 0.75 | 1.03 | 0.57 | 3 |
| Málaga | 0.96 | 1.30 | 1.01 | 0.30 | 2 |
| Murcia | 1.73 | 0.93 | 0.71 | 1.05 | 1 |
| Navarra | 1.19 | 0.87 | 0.73 | 1.69 | 4 |
| Ourense | 2.09 | 1.06 | 0.82 | 1.01 | 1 |
| Palencia | 1.00 | 0.81 | 0.73 | 1.71 | 4 |
| Palmas, Las | 0.37 | 0.81 | 1.05 | 0.39 | 3 |
| Pontevedra | 1.57 | 1.03 | 0.82 | 1.13 | 1 |
| Rioja, La | 1.84 | 0.89 | 0.74 | 1.51 | 4 |
| S. Cruz de T. | 0.66 | 1.00 | 1.04 | 0.32 | 3 |
| Salamanca | 1.46 | 0.89 | 0.94 | 0.65 | 1 |
| Segovia | 1.45 | 1.59 | 0.86 | 0.76 | 2 |
| Sevilla | 1.86 | 0.81 | 0.89 | 0.85 | 1 |
| Soria | 1.45 | 1.12 | 0.77 | 1.33 | 4 |
| Tarragona | 0.44 | 0.88 | 0.82 | 1.41 | 4 |
| Teruel | 1.87 | 1.58 | 0.80 | 0.97 | 2 |
| Toledo | 2.03 | 1.15 | 0.79 | 1.16 | 1 |
| Valencia | 0.72 | 0.94 | 0.86 | 1.15 | 3 |
| Valladolid | 0.80 | 0.73 | 0.84 | 1.32 | 4 |
| Zamora | 1.86 | 1.46 | 0.86 | 0.72 | 1 |
| Zaragoza | 1.35 | 0.85 | 0.82 | 1.24 | 4 |
| Province | AGRI | BUID | SERV | MANU |
|---|---|---|---|---|
| Álava | 0.00% | 0.00% | ||
| Albacete | 33.00% | 0.00% | ||
| Alicante | −100.00% | 33.33% | 0.00% | 100.00% |
| Almería | −100.00% | −100.00% | −33.33% | |
| Asturias | 75.00% | 100.00% | 50.00% | |
| Ávila | −100.00% | 0.00% | ||
| Badajoz | −100.00% | 100.00% | −100.00% | |
| Balears, Illes | 100.00% | −66.67% | 8.33% | −50.00% |
| Barcelona | 76.47% | 175.56% | 87.34% | |
| Bizkaia | 20.00% | 0.00% | 77.78% | |
| Burgos | 100.00% | 100.00% | ||
| Cáceres | 100.00% | 100.00% | ||
| Cádiz | −100.00% | −100.00% | 0.00% | |
| Cantabria | 100.00% | −100.00% | 33.33% | |
| Castellón | 0.00% | 0.00% | 33.33% | |
| Ciudad Real | −100.00% | 0.00% | 0.00% | |
| Córdoba | 0.00% | 0.00% | −33.33% | |
| Coruña, A | 9.09% | −93.33% | 0.00% | |
| Cuenca | n/a | n/a | n/a | n/a |
| Gipuzkoa | 100.00% | −60.00% | 33.33% | |
| Girona | 33.33% | 100.00% | 50.00% | |
| Granada | −100.00% | 0.00% | ||
| Guadalajara | 0.00% | |||
| Huelva | −100.00% | 0.00% | ||
| Huesca | 0.00% | 0.00% | 33.33% | |
| Jaén | 100.00% | −100.00% | ||
| León | −100.00% | −45.45% | −100.00% | −45.45% |
| Lleida | 100.00% | 100.00% | ||
| Lugo | −100.00% | 0.00% | 20.00% | |
| Madrid | 33.33% | −15.79% | −29.82% | 12.20% |
| Málaga | −100.00% | 100.00% | ||
| Murcia | 100.00% | −57.14% | 100.00% | −45.45% |
| Navarra | 100.00% | 100.00% | 100.00% | |
| Ourense | 100.00% | 100.00% | 100.00% | |
| Palencia | 33.33% | 33.33% | 0.00% | |
| Palmas, Las | 0.00% | 100.00% | ||
| Pontevedra | 100.00% | 100.00% | 100.00% | 100.00% |
| Rioja, La | 100.00% | −100.00% | 100.00% | |
| S. Cruz de T. | 60.00% | 133.33% | 0.00% | |
| Salamanca | 100.00% | 50.00% | −100.00% | 100.00% |
| Segovia | −33.33% | 0.00% | ||
| Sevilla | 81.82% | −133.33% | 33.33% | |
| Soria | 0.00% | 100.00% | ||
| Tarragona | 100.00% | 100.00% | 100.00% | |
| Teruel | 100.00% | |||
| Toledo | 0.00% | 100.00% | ||
| Valencia | 100.00% | −57.14% | −98.46% | −20.00% |
| Valladolid | 100.00% | 0.00% | 33.33% | |
| Zamora | n/d | n/d | n/d | n/d |
| Zaragoza | 71.43% | −66.67% | 42.86% |
Publisher’s Note: MDPI stays neutral with regard to jurisdictional claims in published maps and institutional affiliations. |
© 2021 by the authors. Licensee MDPI, Basel, Switzerland. This article is an open access article distributed under the terms and conditions of the Creative Commons Attribution (CC BY) license (https://creativecommons.org/licenses/by/4.0/).
Share and Cite
Rico, M.; Cantarero, S.; Puig, F. Regional Disparities and Spatial Dependence of Bankruptcy in Spain. Mathematics 2021, 9, 960. https://doi.org/10.3390/math9090960
Rico M, Cantarero S, Puig F. Regional Disparities and Spatial Dependence of Bankruptcy in Spain. Mathematics. 2021; 9(9):960. https://doi.org/10.3390/math9090960
Chicago/Turabian StyleRico, Manuel, Santiago Cantarero, and Francisco Puig. 2021. "Regional Disparities and Spatial Dependence of Bankruptcy in Spain" Mathematics 9, no. 9: 960. https://doi.org/10.3390/math9090960
APA StyleRico, M., Cantarero, S., & Puig, F. (2021). Regional Disparities and Spatial Dependence of Bankruptcy in Spain. Mathematics, 9(9), 960. https://doi.org/10.3390/math9090960


