Article

Regional Disparities and Spatial Dependence of Bankruptcy in Spain

Department of Management, University of Valencia, 46020 Valencia, Spain
*
Author to whom correspondence should be addressed.
Mathematics 2021, 9(9), 960; https://doi.org/10.3390/math9090960
Submission received: 23 March 2021 / Revised: 10 April 2021 / Accepted: 21 April 2021 / Published: 25 April 2021
(This article belongs to the Special Issue Spatial Statistics with Its Application)

Abstract

:
Firm survival, bankruptcy, and turnaround are of great interest nowadays. Bankruptcy is the ultimate resource for a company to survive when it is affected by a severe decline. Thus, determinants of firm turnaround and survival in the context of bankruptcy are of interest to researchers, managers, and policy-makers. Prior turnaround literature has broadly studied firm-specific factors for turnaround success. However, location-specific factors remain relatively unstudied despite their increasing relevance. Thus, this paper aims to evaluate the existence of spatial dependence on the outcome of the bankruptcy procedure. Economic geography and business literature suggest that location matters and closer companies behave similarly to further ones. For this purpose, we designed a longitudinal analysis employing spatial correlation techniques. The analyses were conducted on a sample of 862 Spanish bankrupt firms (2004–2017) at a regional level (province). For overcoming the limitations of the broadly usually logistic model employed for the turnaround context, the Moran’s Index and the Local Association Index (LISA) were applied with gvSIG and GeoDa software. The empirical results show that the predictors GDP per capita and manufacturing specialization are related to higher bankruptcy survival rates. Both characteristics tend to be present in the identified cluster of provinces with better outcomes located in the North of Spain. We suggest that location broadly impacts the likelihood of the survival of a bankrupt firm, which can condition the strategic decision of locating in one region or another. Our findings provide policy-makers, managers, and researchers with relevant contributions and future investigation lines.

1. Introduction

At least once in its life, every company experiences a decline such that its survival is threatened [1]. During this period, a turnaround situation is faced, and the company can also become insolvent, or even bankrupt, understood as a formal court proceeding [2,3] possibly being required. Turnaround outcomes can range from complete failure to success, with several intermediate outcomes. Bankruptcy and disappearance of firms is a pervasive problem for economy and society. Therefore, research on bankruptcy and survival is essential, and determinants for successful turnarounds are of interest to bankrupt firms [4,5,6,7].
However, in a bankruptcy procedure, only success or failure (liquidation) is possible, and the probability of success depends on different factors. In this study, similarly to [3], success has been defined as a firm’s survival after going through the bankruptcy procedure.
Prior studies have identified as main determinants for successful turnarounds in bankruptcy procedures firm-specific factors (size, age, ownership, among others). However, after the Great Recession and the consequent increase in firm bankruptcies, additional factors appeared to affect the outcome. Those factors are location-specific, such as the region’s industrial specialization where the firm is located or the economic wealth of the place. To our knowledge, few papers have assessed the spatial relationship between turnaround and bankruptcy [8].
As proposed by economic geography and business literature, the place where a company develops its activity is key to predicting its survival in the short and long term. The basic hypothesis is that “everything is related to everything else, but close things are more related than distant things” [9]. Geographic proximity favors commercial interactions, especially between companies related to the activity, reduces search and negotiation costs, and increases competitiveness. For this reason, companies set up, locate, and grow in territories where they can enjoy more significant external economies, creating their own competitive and institutional contexts [10]. However, in a general crisis, the higher the business density of a territory, the greater the scarcity of resources (clients, suppliers, financing), causing an increase in the rivalry between its members (cannibalization) [11]. In this context of intense competition, as pointed in the review carried out by [7], the retrenchment strategy is the most implemented by managers of companies facing a crisis; however, its effectiveness is very uneven.
Hence, this paper aims to determine the existence of spatial correlation in bankruptcy outcomes in Spain. Also, two objectives were defined: first, to map the bankruptcies in Spain and second, to explain the regional disparities in the success rates. Due to differences in the legal systems and laws, we focus on the bankrupt Spanish companies filed from 2004 through 2017. Our database (862 Spanish bankrupt firms) was obtained from different secondary sources. Data of the companies, location, activity, and status were derived from Orbis. The GDP per capita data were extracted from the INE database and the Bank of Spain. Data regarding the bankruptcy declaration and the procedure’s outcome were obtained from the Public Bankruptcy Register. We implemented the gvSIG and GeoDA programs and the methodology of the Moran’s Index and the Local Association Index (LISA).
Our results show that although the firm-specific factors and activity sector explain part of the regional disparity in failures, it is also essential to consider the regional institutional environment to predict the outcome. Notably, higher GDP per capita and manufacturing specialization proved to be related to higher success rates in bankruptcy procedures. Both characteristics tend to concentrate in Northern Spain due to structural and cultural factors. Our contributions guide politicians and managers to be more effective when facing an economic crisis, bankruptcy, and turnaround. For researchers interested in spatial analysis, we present valuable techniques to evaluate the dependence and association among variables.
The paper is structured as follows: in Section 2, the context of business turnaround and bankruptcy is exposed along with the materials and methods chosen for the analyses; Section 3 provides detailed information for the experiment and the main results. Section 4 presents the results and discussion; Section 5 exposes the main conclusions.

2. Theoretical and Conceptual Framework

2.1. Bankruptcy and Turnaround

Companies attempt a turnaround process when they suffer a decline of such intensity that their survival is under threat [12]. The decline may be rather rapid or slow, severe or slight, but always directs the company towards disappearance unless decisive actions are taken. Turnaround scholars have studied the likelihood to survive a steep performance decline through the responses adopted by declining firms [13]. Those responses have been analyzed focusing on content, retrenchment-recovery [12,13], context [14,15,16,17], intensity [18], and timing [19,20]. All of them are firm-specific factors that may consider only marginally the surrounding factors that affect firm survival and decline responses.
Nonetheless, as the Great Recession and COVID-19 crises have highlighted, location-specific factors also impact the outcome of a turnaround attempt. Due to cultural, economic, or geographical reasons present in a territory, the business density has similarly been considered a risk factor. This phenomenon is visible in the agglomerations of companies that seek and benefit from external economies derived from geographic proximity to customers and suppliers, as well as to related and unrelated sectors [21]. Examples of these concentrations are industrial parks, tourist destinations, hotels, or territories specializing in a particular activity (for example, economic clusters).
The business economics literature has recognized in the geographical agglomerations of activity and external economies derived from them (dependent on other companies’ existence and actions) a source of competitive advantages that would translate into more remarkable survival [22]. However, this relationship is neither linear nor homogeneous in all sectors of activity. For example, [23] showed the highest risk of mortality in Spanish textile regions with medium levels of geographic density, and [24] showed that among similar hotels, the higher the business density, the higher the intensity of competition the risk of failure.

2.2. The Spanish Bankruptcy System

Bankruptcy is considered the most severe form of decline in a turnaround process in [17] since the gravity of decline is such that the firm cannot repay its debts. Bankruptcy figures in Spain drastically increased during the Great Recession. The peak was reached in 2013 when GDP plummeted during a second recession. Bankrupt firms in Spain represent nearly 65 billion assets in the period 2004–2017 [25]. Bankruptcy is different from insolvency (financial status), and we assumed it as a legal procedure (Concurso de acreedores). In Spain, bankruptcy allows only two outcomes: (i) success by reaching an agreement with creditors (convenio), and (ii) liquidation and disappearance of the firm. This paper, thus, focuses on Spanish bankrupt firms during 2004–2017.
Spain was selected for this study, according to [26], given the significant influence of the institutional context on the bankruptcy system. Spain is characterized by, principally, two features. On the one hand, the bankruptcy procedure is rarely used by insolvent firms [27]. On the other hand, the bankruptcy system’s effectiveness, measured with success rates, is far inferior to that of other developed countries [8]. In consequence, in Spain, only 6% of bankruptcies succeed, while the USA Chapter 11 presents survival rates of about 24% [2]. Thus, it is crucial to examine the regional differences in this minority of Spanish firms to extend the broader majority’s findings.
Additionally, significant regional disparities were observed in bankruptcy efficiency. While assuming that firm-specific factors have been reported as relevant by prior economic literature, location-specific factors need to be considered to capture the effect of geographical impact on the turnaround outcome.

2.3. Spatial Autocorrelation and Bankruptcy

Prior studies such as [28] analyzed the spatial autocorrelation to predict bankruptcy likelihood through companies’ interconnection (economic environment) by employing decision trees. Other studies such as [29], assessed the spatial relationship between companies’ financial health and the judicial system’s efficiency (institutional environment) through logistic regression. While both studies reveal spatial dependence between location and the company’s failure, we believe that these methods partially cover this phenomenon.
Thus, to analyze whether the outcome of a bankruptcy procedure is dependent on a firm’s location or not, we based our study on the principle of regional disparity in terms of business density, industrial specialization, and temporal perspective. In contrast with prior studies, this paper uses geostatistics to apply regionalized variables [30]. Geostatistics focuses on data variability analysis looking for relationships of dependence, behavior patterns, and correlations with the spatial variable. We consider that the existing limitations when using logistic regression or decision trees can be overcome with spatial statistics. The reason is that spatial statistics classify the observations between those by discerning failure likelihood with distinguishing covariance and also takes into consideration environmental influence (neighborhood with other locations). Also, the coefficient sign allows for the determining of whether the relationship between a location and its environment is direct or inverse to the assessed fact.
This last aspect is particularly relevant. As we argued, the bankruptcy outcome is influenced far beyond by its individuality and depends on the economic and institutional context in which it develops its activity. This becomes especially true in decline and crisis contagion situations and can help predict future liquidity problems that cause pervasive chain reactions.

3. Materials and Methods

3.1. Sample and Data

The Spanish bankruptcy was enacted in 2004 [31]. Accordingly, our sample was obtained from the population of Spanish firms that became bankrupt during the period 2004–2017. The cut-off date for data collection was set at the end of 2017, given that no complete accounting data was available for those procedures that started in 2018. Consequently, the sample consisted of bankrupt firms that reached an outcome (i.e., success or liquidation) between 2004 and 2017. In this study, we define success as a firm’s survival after going through a bankruptcy procedure and liquidation as the closure and end of its activity. Firms were required to have been operating for at least five years to avoid gathering data related to failures due to liability of newness [32].
Financial data were obtained from the Sistema de Análisis de Balances Ibéricos (SABI) database. SABI captures financial information from financial statements of two million Spanish firms and half a million Portuguese firms, collected from the Public Commercial Register (Registro Mercantil). SABI allows for the distinguishing of firms that have filed for bankruptcy at some time in their business life (“incidences/current status/concurso”). This database is widely used for research focused on Spanish companies due to its broad financial-accounting information and reliability. Data regarding the bankruptcy declaration and the procedure’s outcome were collected from the Public Bankruptcy Register (Registro Público Concursal). The register covers data including the declaration, convenio approval, and/or liquidation date. Unfinished procedures due to the continuation of liquidation were not considered. In that case, the turnaround attempt would be complete (failure), but the formal procedure would continue. Firms that had instantaneously entered the bankruptcy procedure and gone into liquidation were also rejected.
We also discarded firms with particular features. On the one hand, both sports clubs and state-owned firms were excluded. State companies need a turnaround that differs substantially from privately held firms [33]. Sports clubs were discarded, given the specific features that may affect their turnaround attempt [34]. The final sample contained 862 bankrupt firms, from which 354 (41.1%) failed (were liquidated), and 508 (58.9%) succeeded (survived). Thus, the sample is biased towards bankrupt firms that succeeded (58.9% vs. 6% of the entire population of bankrupt Spanish firms). The same situation was found in similar studies of Spanish firms [35,36], taking into account the problems in obtaining data from firms that were liquidated at some point in the proceeding. Given that most bankrupt firms (around 94%) are liquidated and disappear, few data are available once they fail during bankruptcy.
Concerning industrial province distribution (main activity), GDP per capita data, business factor (size), and employment levels, they were obtained from the Instituto Nacional de Estadística (INE) database in the regional and national accounting year 2017.

3.2. Variables and Standardization of Variables

In line with most of the studies, the province is the spatial unit of analysis in [8,23,27]. The province is an administrative division that splits Spain into 50 different territories or regions. At the EU level, a province is called NUT-III. This disaggregation level has the advantage of its operationalization and a sufficient level of detail to contrast the neighborhood’s effect in the analyses.
As we focus on firm survival, we have distinguished two types of variables: a) the outcome and b) the predictors or explanatory variables (province specialization, the GDP per capita, average size of firms or business factor, and unemployment).
(a)
Outcome
In line with the objectives, the outcome is a variable that takes two values: liquidation and success in [21]. To distinguish in which provinces the companies in proceedings tend to liquidate from those who tend to succeed, we have constructed a location coefficient (LQ) (Iag) [35,36]. The LQ is an estimator that measures the spatial concentration with the advantages of easy calculation and interpretation [37]. The LQ can be used as an index to evaluate the level of presence of a characteristic (outcome or predictor) in a particular space (provincial) concerning the total (Spain).
For the LQ of the outcome proceedings, we have done two analyses, one for the liquidation and another for the success (see Equations (1) and (2)).
Iag liquidation = (number of liquidated firms in the province/number of insolvent firms in the province)/(number of liquidated firms in Spain/number of insolvent firms in Spain),
Iag success = (number of successful firms in the province/number of insolvent firms in the province)/(number of successful firms in Spain/number of insolvent firms in Spain),
When the indexes take values near or equal to 1, this indicates that this province or place has for the characteristic analyzed a similar presence in the space or country of reference (random dispersion). When it takes a value over 1, they indicate that the province has an overrepresentation, agglomeration, or concentration of this trait in the province. In this case, the variable is dispersed, forming clusters (clumped dispersion). In other words, the higher the index, the higher the relative importance of liquidation or success in that province with respect to the same indicator in relationship with Spain. On the contrary, the nearer to zero, the less relevant the liquidation or success will be.
When calculating specialization indices, it is necessary to establish categories to classify them in homogeneous ways [38]. Considering that the central value is 1, the value implies that a particular province has no specialization in one of the outcomes; three categories were established. The central one, ranging from 0.16 points over and under 1, determines a similar behavior to the country’s rest. The higher interval, over 1.16, indicates the existence of specialization, and the lower one, under 0.84, reveals no specialization.
Figure 1 shows maps representing the specialization indexes for success and liquidation according to the three defined intervals. These indexes can be interpreted as indicators of a territory’s business density in a given activity [23,39]. Both maps show in green the provinces with a particular specialization in liquidation (left) or success (right) and the clusters of provinces characterized for one or other tendencies. Clear blue shows those provinces with no specialization, while dark blue represents the provinces with similar rates as the rest of the country. At first sight, northern provinces tend to specialize in the success outcome (on the right figure, green colors).
In contrast, southern provinces show higher liquidation rates (on the left figure, green colors). This first mapping shows a north/south trend, with mortality being lower in the regions in the north than in the south of Spain. This evidence requires a deeper study of the reasons behind such regional disparities in bankruptcy outcomes.
  • (b) The predictors or explanatory variables
Province specialization measures the main activity of the territory. Given Spain’s economic structure, we have distinguished four types of activity (agriculture, building, services, and manufacturing). Expression (3) describes the LQ or levels of specialization of this variable in Spain. Table 1 shows the values.
Iag IE (industry specialization) = (value of the industry in the province/total GDP of the province)/(value of the industry in Spain/total GDP in Spain),
Table 1 has six columns. The first one has the list of the 50 Spanish provinces; the following four capture the index value for each industry by province (Equation (3)). The last column informs the industry in which the particular province is specialized. To operate the variable (Iag IE), the results were categorized into three levels (near to 1, under 0.84, and over 1.16). Code 1 was assigned to agriculture, 2 building, 3 services, and 4 manufacturing. For instance, considering Álava, we observe that the highest index was obtained for manufacturing (1.97), so code 4 was assigned.
Suppose we map at a province-level the spatial distribution of the activity in Spain (Figure 2). In that case, it can be said that its distribution is not homogeneous among the country, given that there are provinces with higher rates of specialization in manufacturing (for example, Alava or Burgos, 1.97 and 1.94, respectively, coded as 4 in Table 2, and dark green on the figure) that are located in the North and form a cluster. For other activities, this tendency is also observed, especially in the one specialized in agriculture (light blue).
Another explanatory variable in the analysis is the GDP per capita, which captures each province’s wealth level in [7]. It is a continuous variable that takes values from 18.050 euros (Cadiz) to 36.404 (Álava).
Similarly, to contrast the “business factor,” we have used the average size of companies in the region as an indicator [40]. It has been operating as in Expression (4)
Iag SS (size specialization) = (number business medium + large in the province/total number business in the province)/(number business medium + large in Spain/total number business in Spain),
Lastly, unemployment is used as an indicator of the economic development in each analyzed province [41]. As for the GDP, As for the GDP, the unemployment variable is continuous and it takes values from 7.1% (Gipuzkoa) to 24.4% (Jaén).
  • (c) Preliminary analysis
Finally, intending to assess in an explorative way whether the companies dedicated to a given province’s sector mark a trend towards success or liquidation, we made a preliminary analysis. According to the company sector, the variable “result of proceeding” was operational considering companies’ aggregate results in the same industry and province. The results are depicted in Table 2. Positive figures show that companies of that industry and province had a successful bankruptcy, while negative ones show those that ended in liquidation. Empty cells of Table 2 indicate that there are no bankrupt companies for the particular province. For instance, Alicante has a value of −100% in agriculture. This value represents that all the companies in that industry ended in liquidation. On the contrary, also for Alicante, manufacture has a value of 100%, meaning that all manufacturing companies succeeded. In the case of building, there is a probability of 33% that building companies reach success rather than liquidation.

3.3. Methods

To study the territory and evaluate whether different behaviors depended on the firm’s location, the free software GeoDa was used (v1.16 October 2020). We follow the recommendations and suggestions of [42,43] and also present in GeoDa Center for Analysis and Computation (http://GeoDacenter.asu.edu (accessed on 30 June 2020)). This software allows us to under-take spatial studies and reports their results in graphics and maps, making their interpretation easier.
To better interpret the results, two indexes were applied: (1) the Moran’s Global Index and (2) Local Indicators of Spatial Association (LISA) with contiguity or neighborhood type 1. The choice of these statistical techniques is due to two main methodological reasons. On the one hand, it allows for measuring the spatial correlation between two variables, one of them being location and others being general variables of the companies, such as size, industry, or economic environment variables, as GDP per capita or employment levels. On the other hand, it identifies those variables that explain statistically more significant robustness in the bankruptcy outcome in that spatial context [44,45].
It is important to note that this research method has advantages and disadvantages. It allows for the correlation of variables vis-a-vis considering the location. This means that the methods show the spatial distribution of variables as well as their correlation. This circumstance permits making comparisons both by provinces and during the time. However, derived from the correlation studies’ nature, the number of variables included is only two. This fact allows for the correlation of several combinations of variables and extraction of conclusions from those correlations.
(a)
Moran’s Global Index and Local Indicators of Spatial Association (LISA)
To calculate these indices, it is necessary to define the neighborhood structure of the considered spatial units. In this paper, the neighborhood structure used is Queen, which means that the standardized connectivity matrix is W with ωij = 1/ni, if j shares a border with i, where ni is the total number of neighbors. Besides, ωii = 0 means no spatial unit is considered a neighbor of itself [46].
Once both indexes are obtained, a Moran bivariate analysis is done by correlating the variables Aggregation Index and GDP per capita with the variable territory [41].
This tool of spatial correlation must be interpreted in the context of the null hypothesis. When the Moran’s Index takes a value of 0, the outcome distribution is random. On the contrary, when the value is different to 0, a significant spatial correlation exists. To contrast the null hypothesis (value of 0), the z- statistic is obtained; if z is out of the interval [−1.96, 1.96], then we can assume a spatial correlation. The index (1) has the following expression:
I = n i = 1 n j = 1 n w Ji i = 1 n j = 1 n w Ji ( x i   x ¯ ) ( x j   x ¯ ) i = 1 n ( x i   x ¯ ) 2
where n is the number of spatial units, and xi is the corresponding value of the studied variable X and its average   x ¯ .
Expression (5) is used to determine whether the bankruptcy outcome presents diverse behaviors depending on the territory.
Spatial positive autocorrelation is evidenced when Ii> 0. In these cases, the neighboring provinces tend to be similar and indicate a spatial grouping of similar values (either high HH or low LL) around the spatial unit (province). When Ii <0 it means that the province and its neighboring are dissimilar indicating outliers (either HL or LH). Finally, it is noteworthy that when Ii = 0 indicates randomness of the data, so there is no spatial correlation.
Index (6), LISA, is useful to determine the existence of local groups or clusters, the establishment of relationships of a neighborhood of a cluster with surrounding territories, and the kind of relationship. The mathematic expression is proposed by [41], which is as follows:
I i = ( x i   x ¯ ) i = 1 n ( x i   x ¯ ) 2 j = 1 n ω ij ( x j   x ¯ )   for   i j
Autocorrelation may take positive values when other groups surround the territory with positive or high values. It also establishes a correlation when the values are negative or low.
  • (b) Moran’s Bivariate Index and Bi Local Indicators of Spatial Association (LISA)
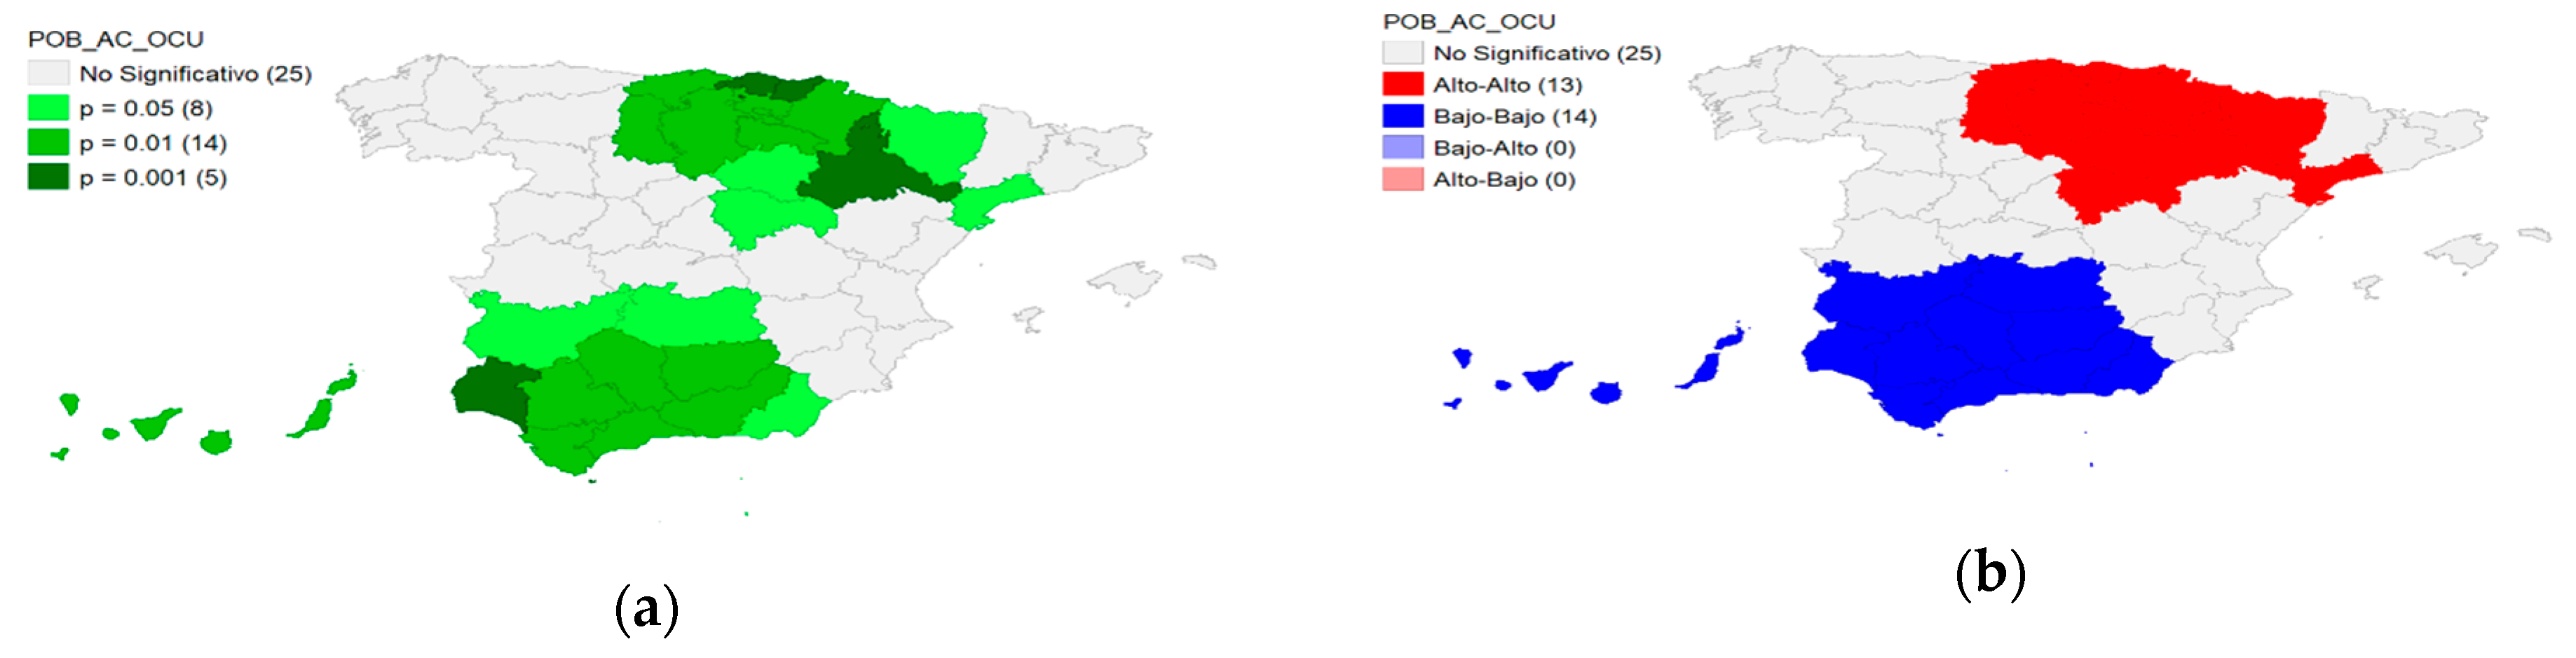
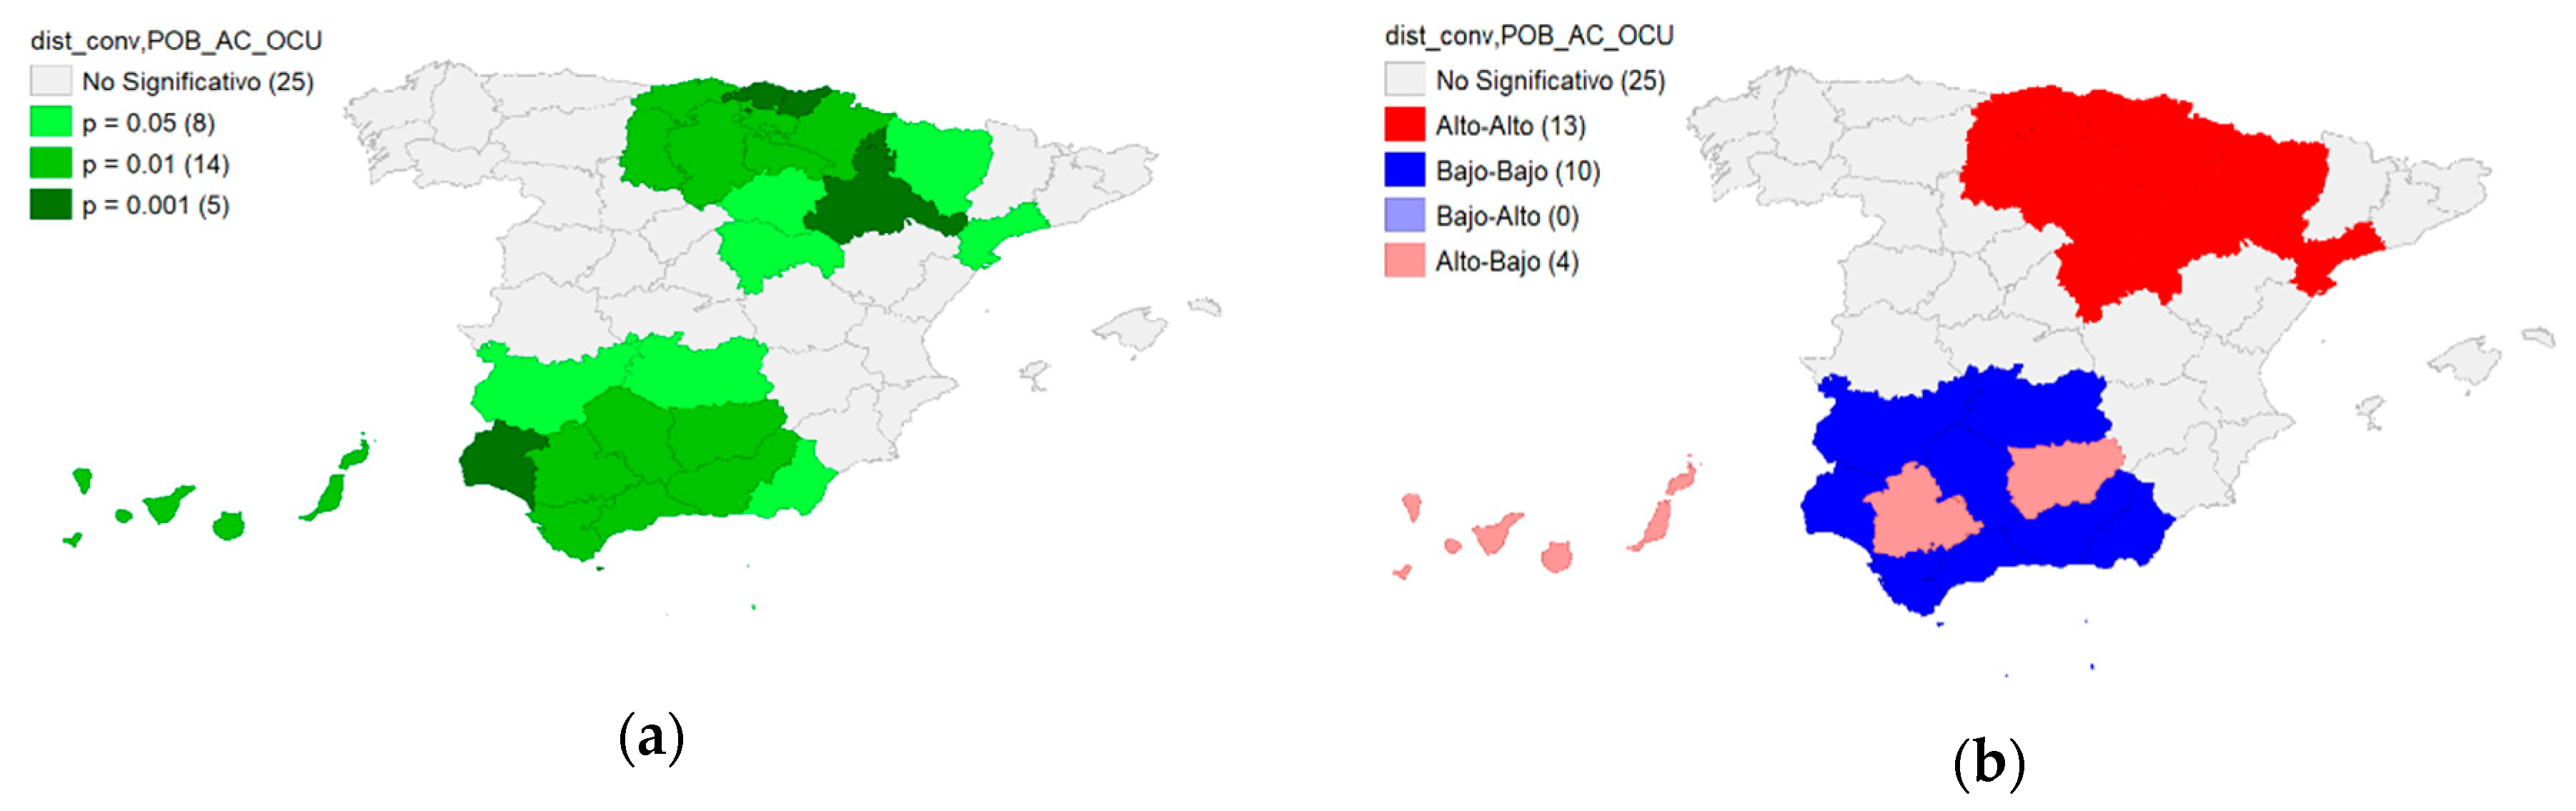
Moran’s Bivariate Index measures the degree to which a variable x in a particular location is correlated with its neighbors with a different variable y, and values the effect produced in a central location. This is used to measure the neighborhood effect and the influences to establish the relationship between both variables. It is a complementary analysis that allows knowing how a phenomenon can vary through geographical space (the spatial dependence of the bankruptcy) considering the effects that this phenomenon presents due to changes of second variables, such as per capita income, size, sector of activity, or level of occupation in [38,40,41]. In this way, it is intended to see how the result of the creditors’ bankruptcy was modulated by considering other variables (in our case industry, GDP per capita, business factor, or employment) and assessing provincial clusters’ existence based on the result and the indicated variables. It seeks to evaluate whether there is a repetition of clusters with different variables and establish the geographic variable as one more explanatory variable of the bankruptcy result.
This index is expressed as follows:
I = n W i = 1 n j = 1 n w iJ ( X i   X ¯ ) ( y j   y ¯ ) Σ ( x i   x ˜ ) ( y i   y ¯ ) 2 2
where x is variable 1, y is variable 2, and W=∑ij wij.
Thus, it allows us to know how the phenomenon evolves along with space, in our case, the bankruptcy outcome, but considers the effect of other variables, such as GDP per capita, size, industry, or employment.

4. Results

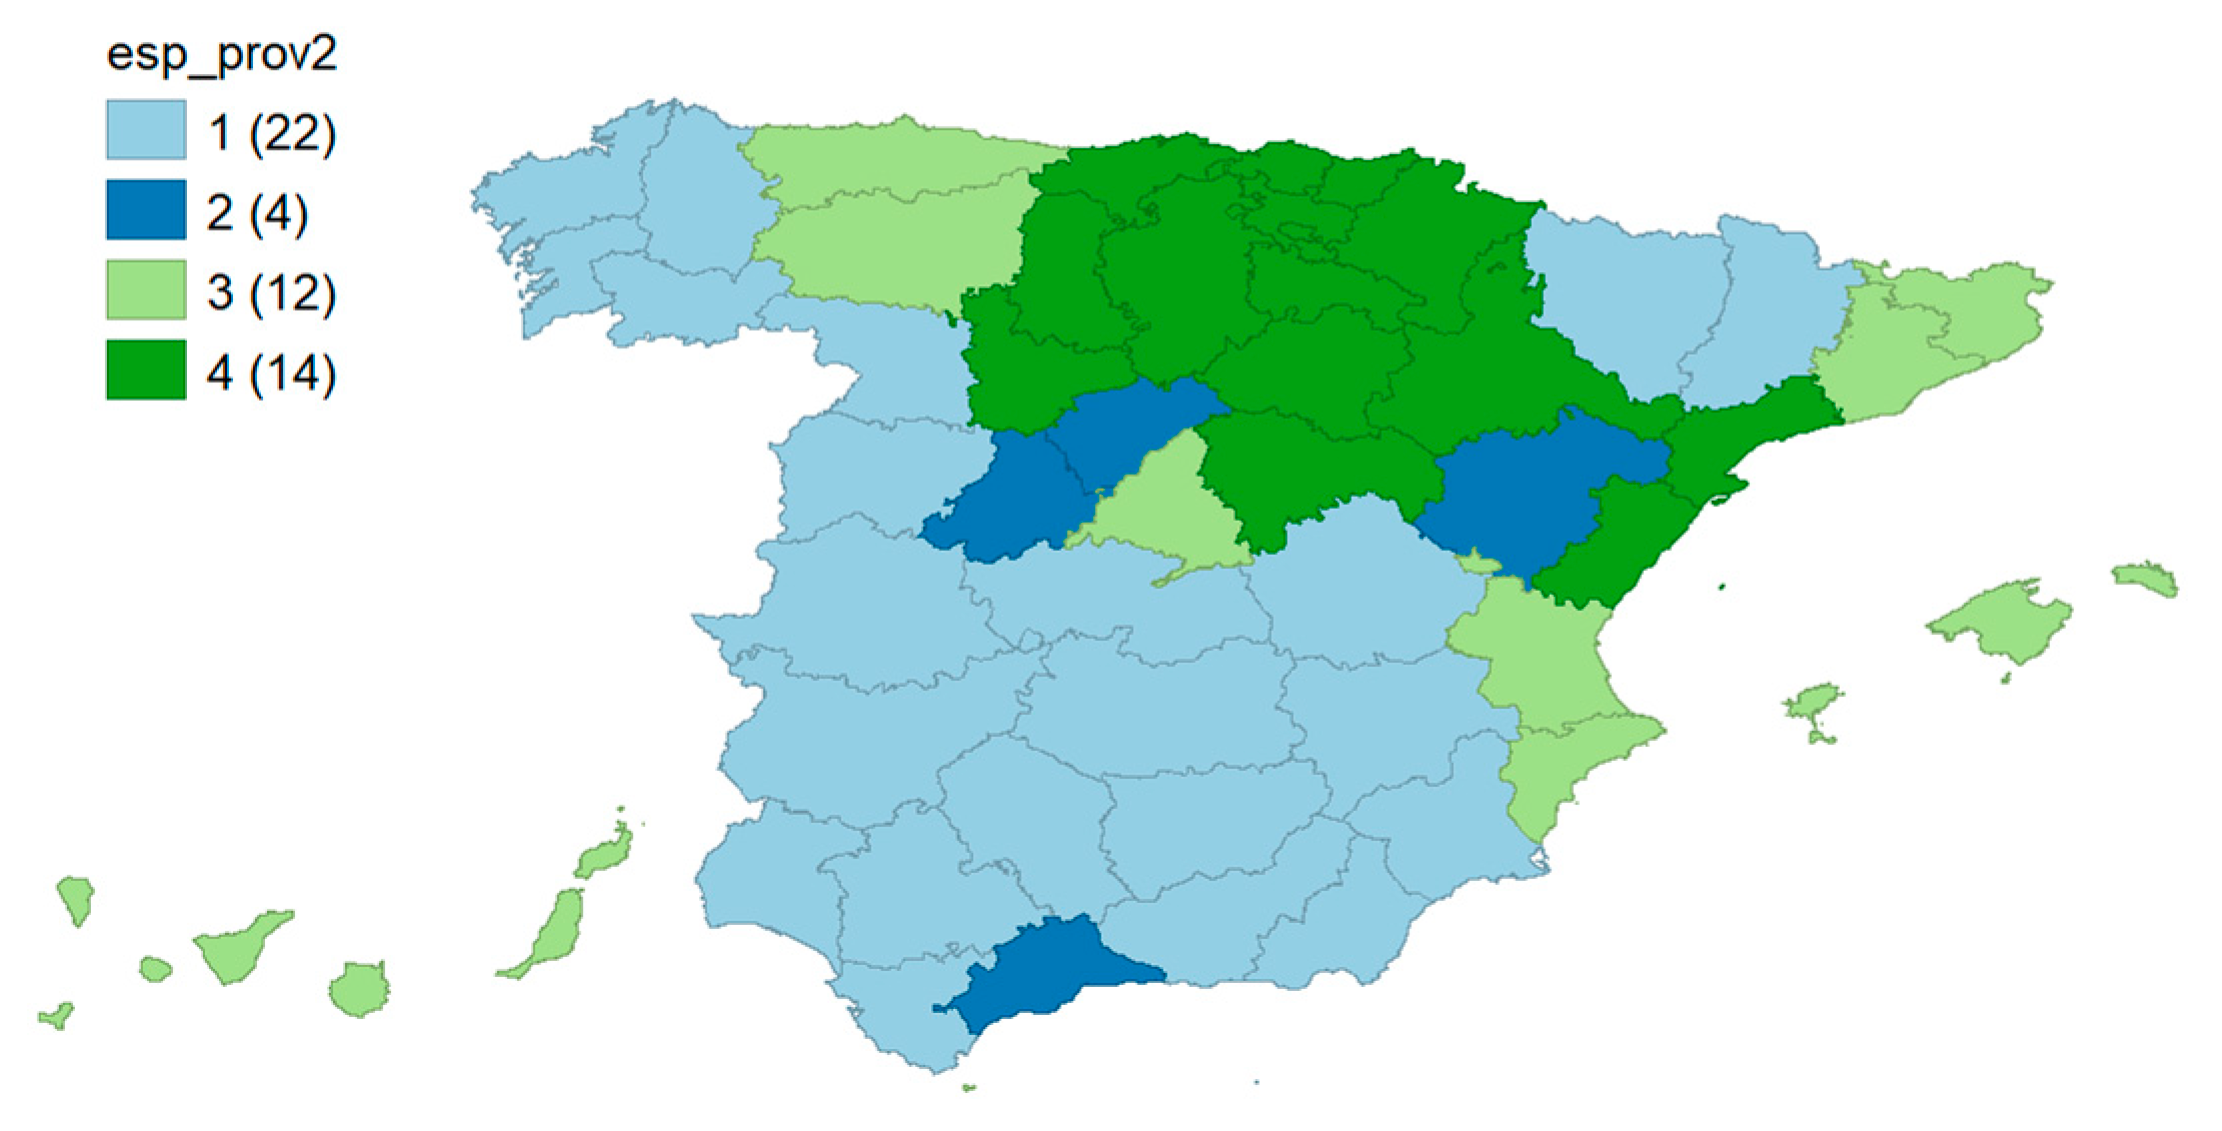
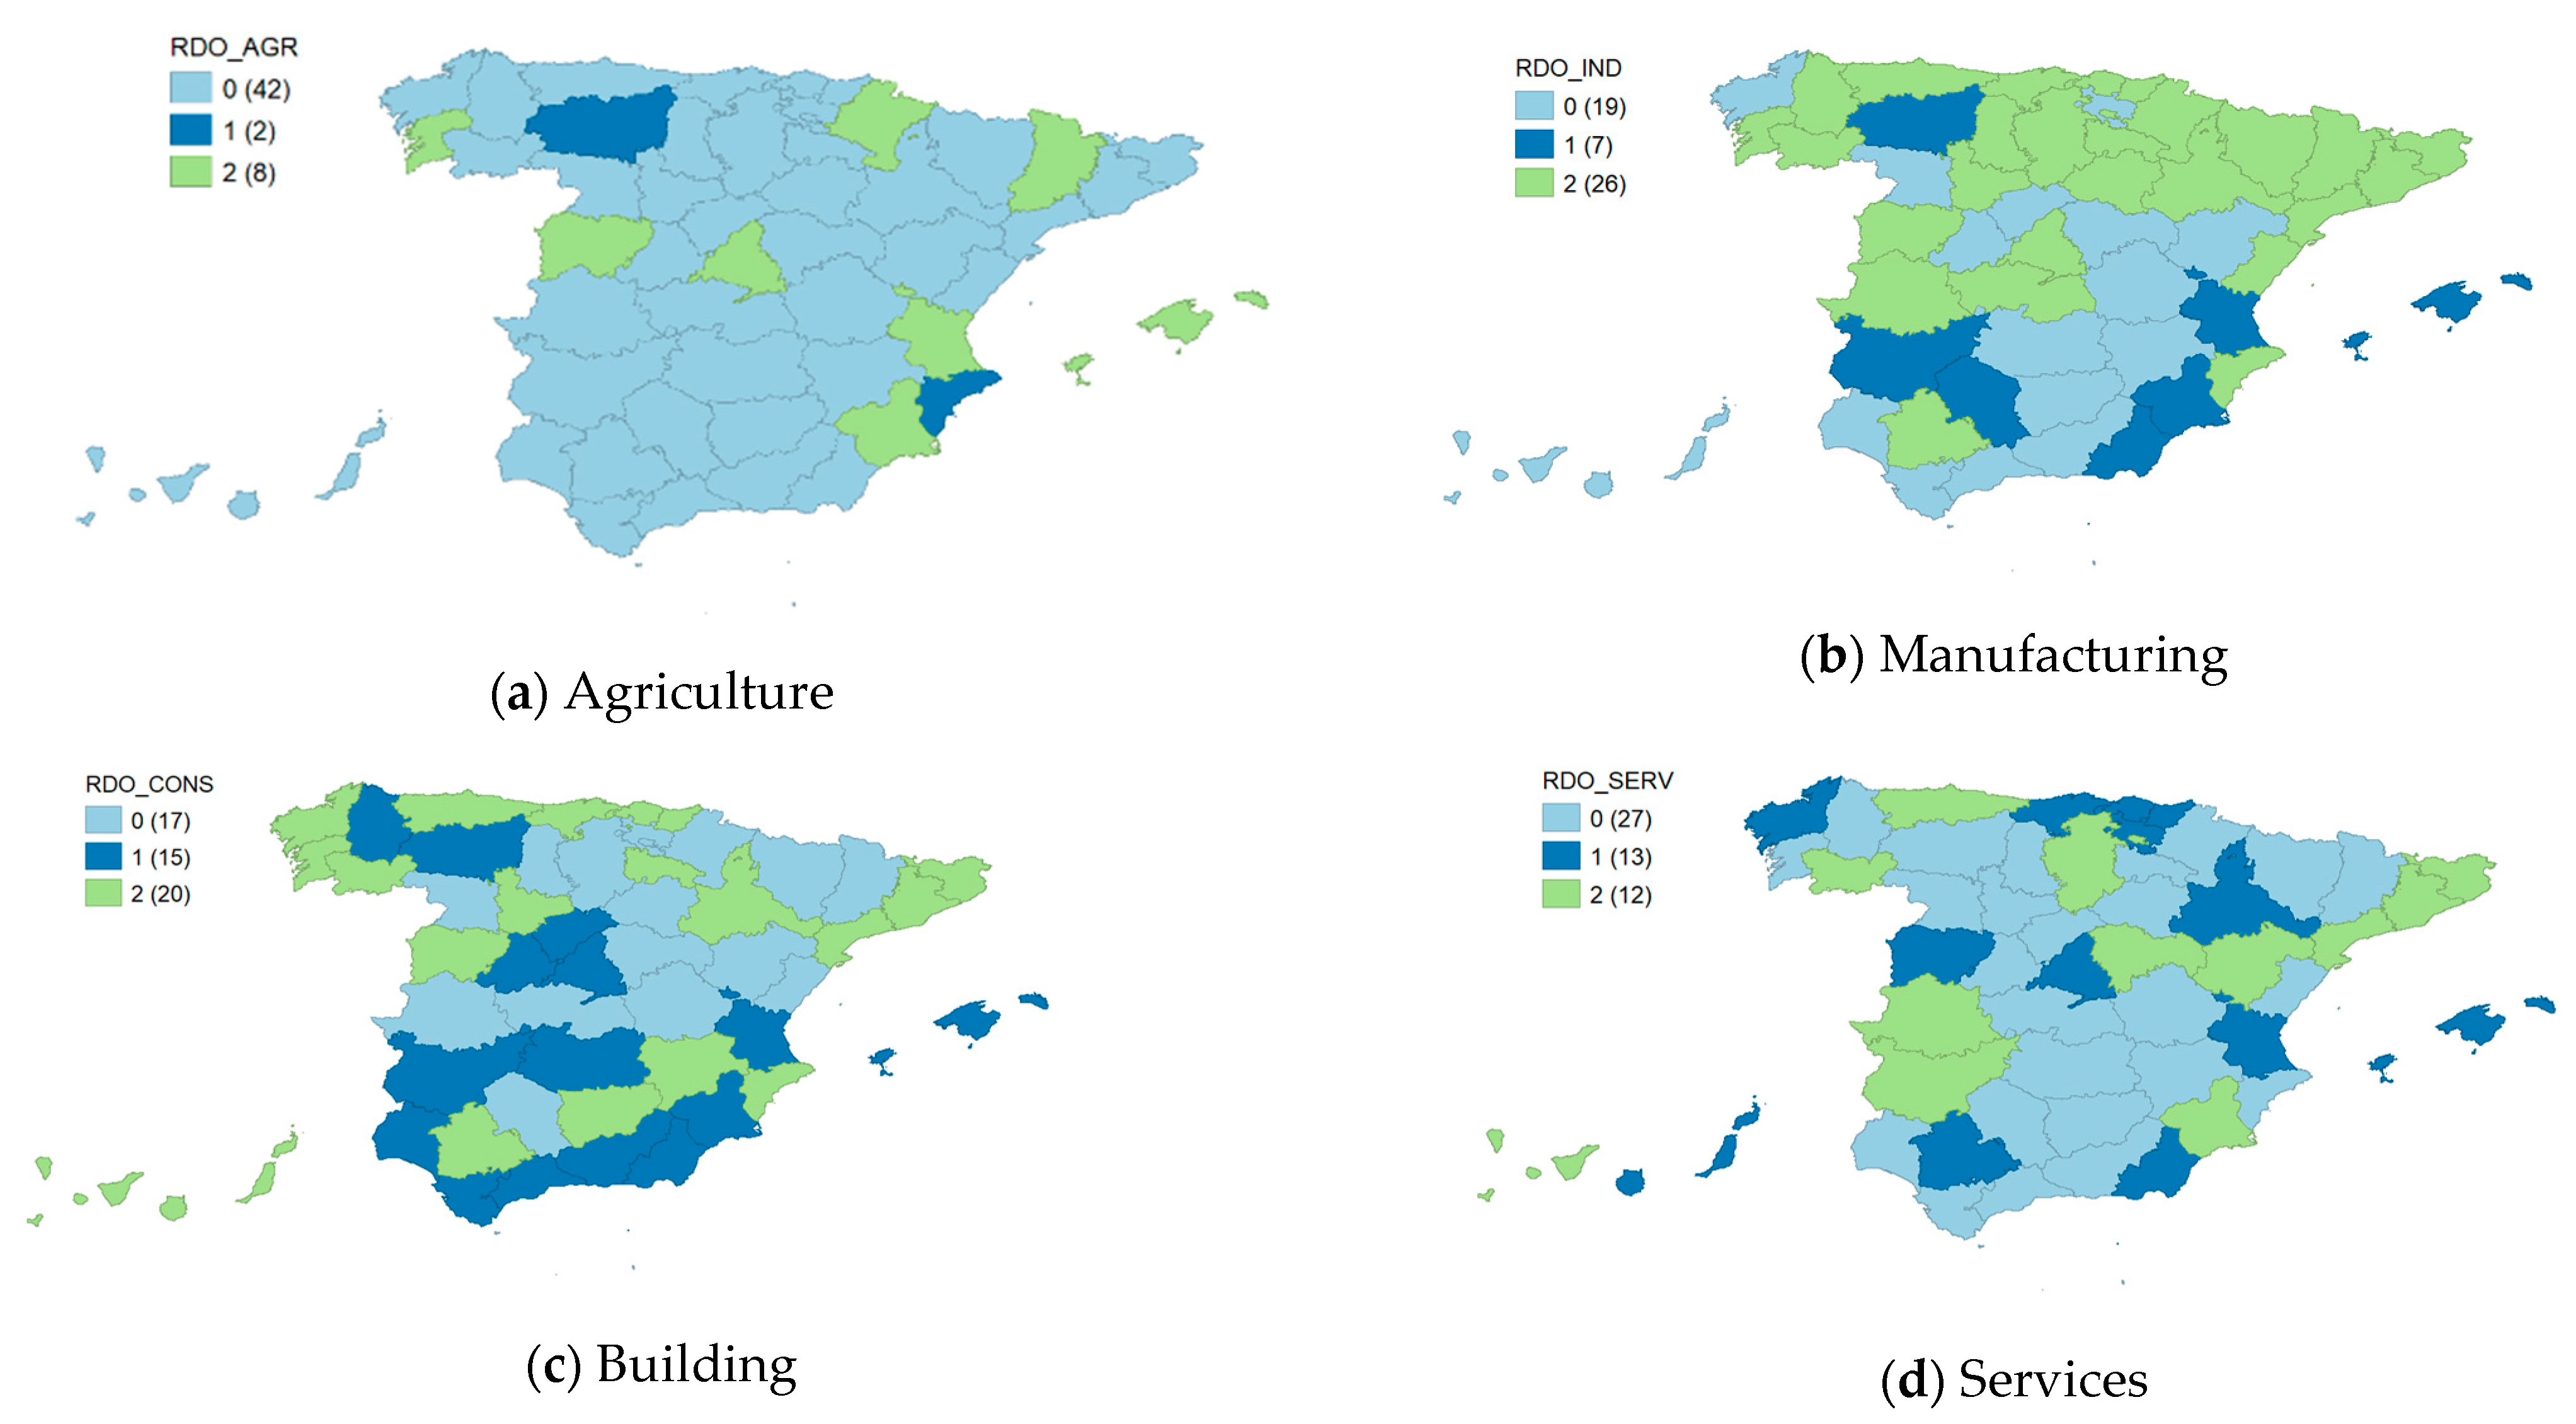
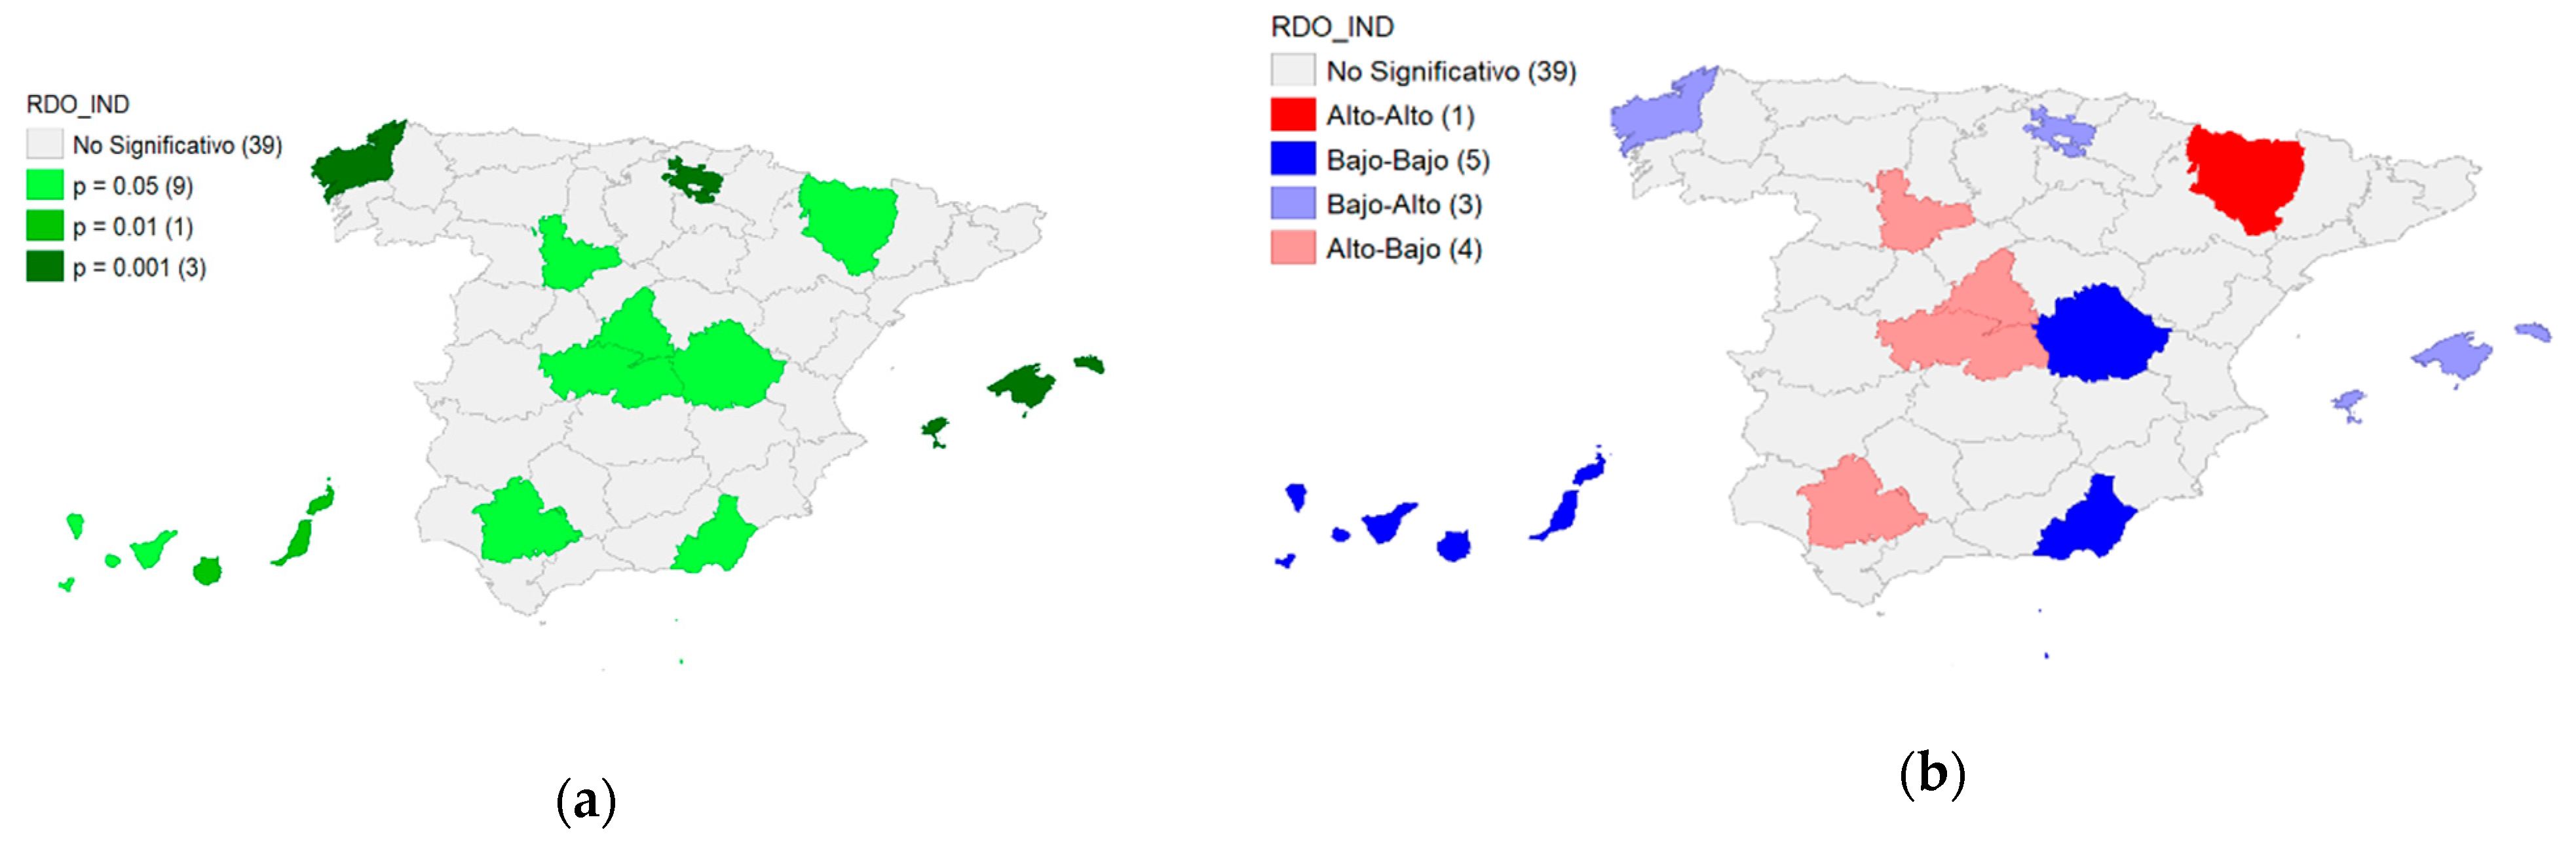
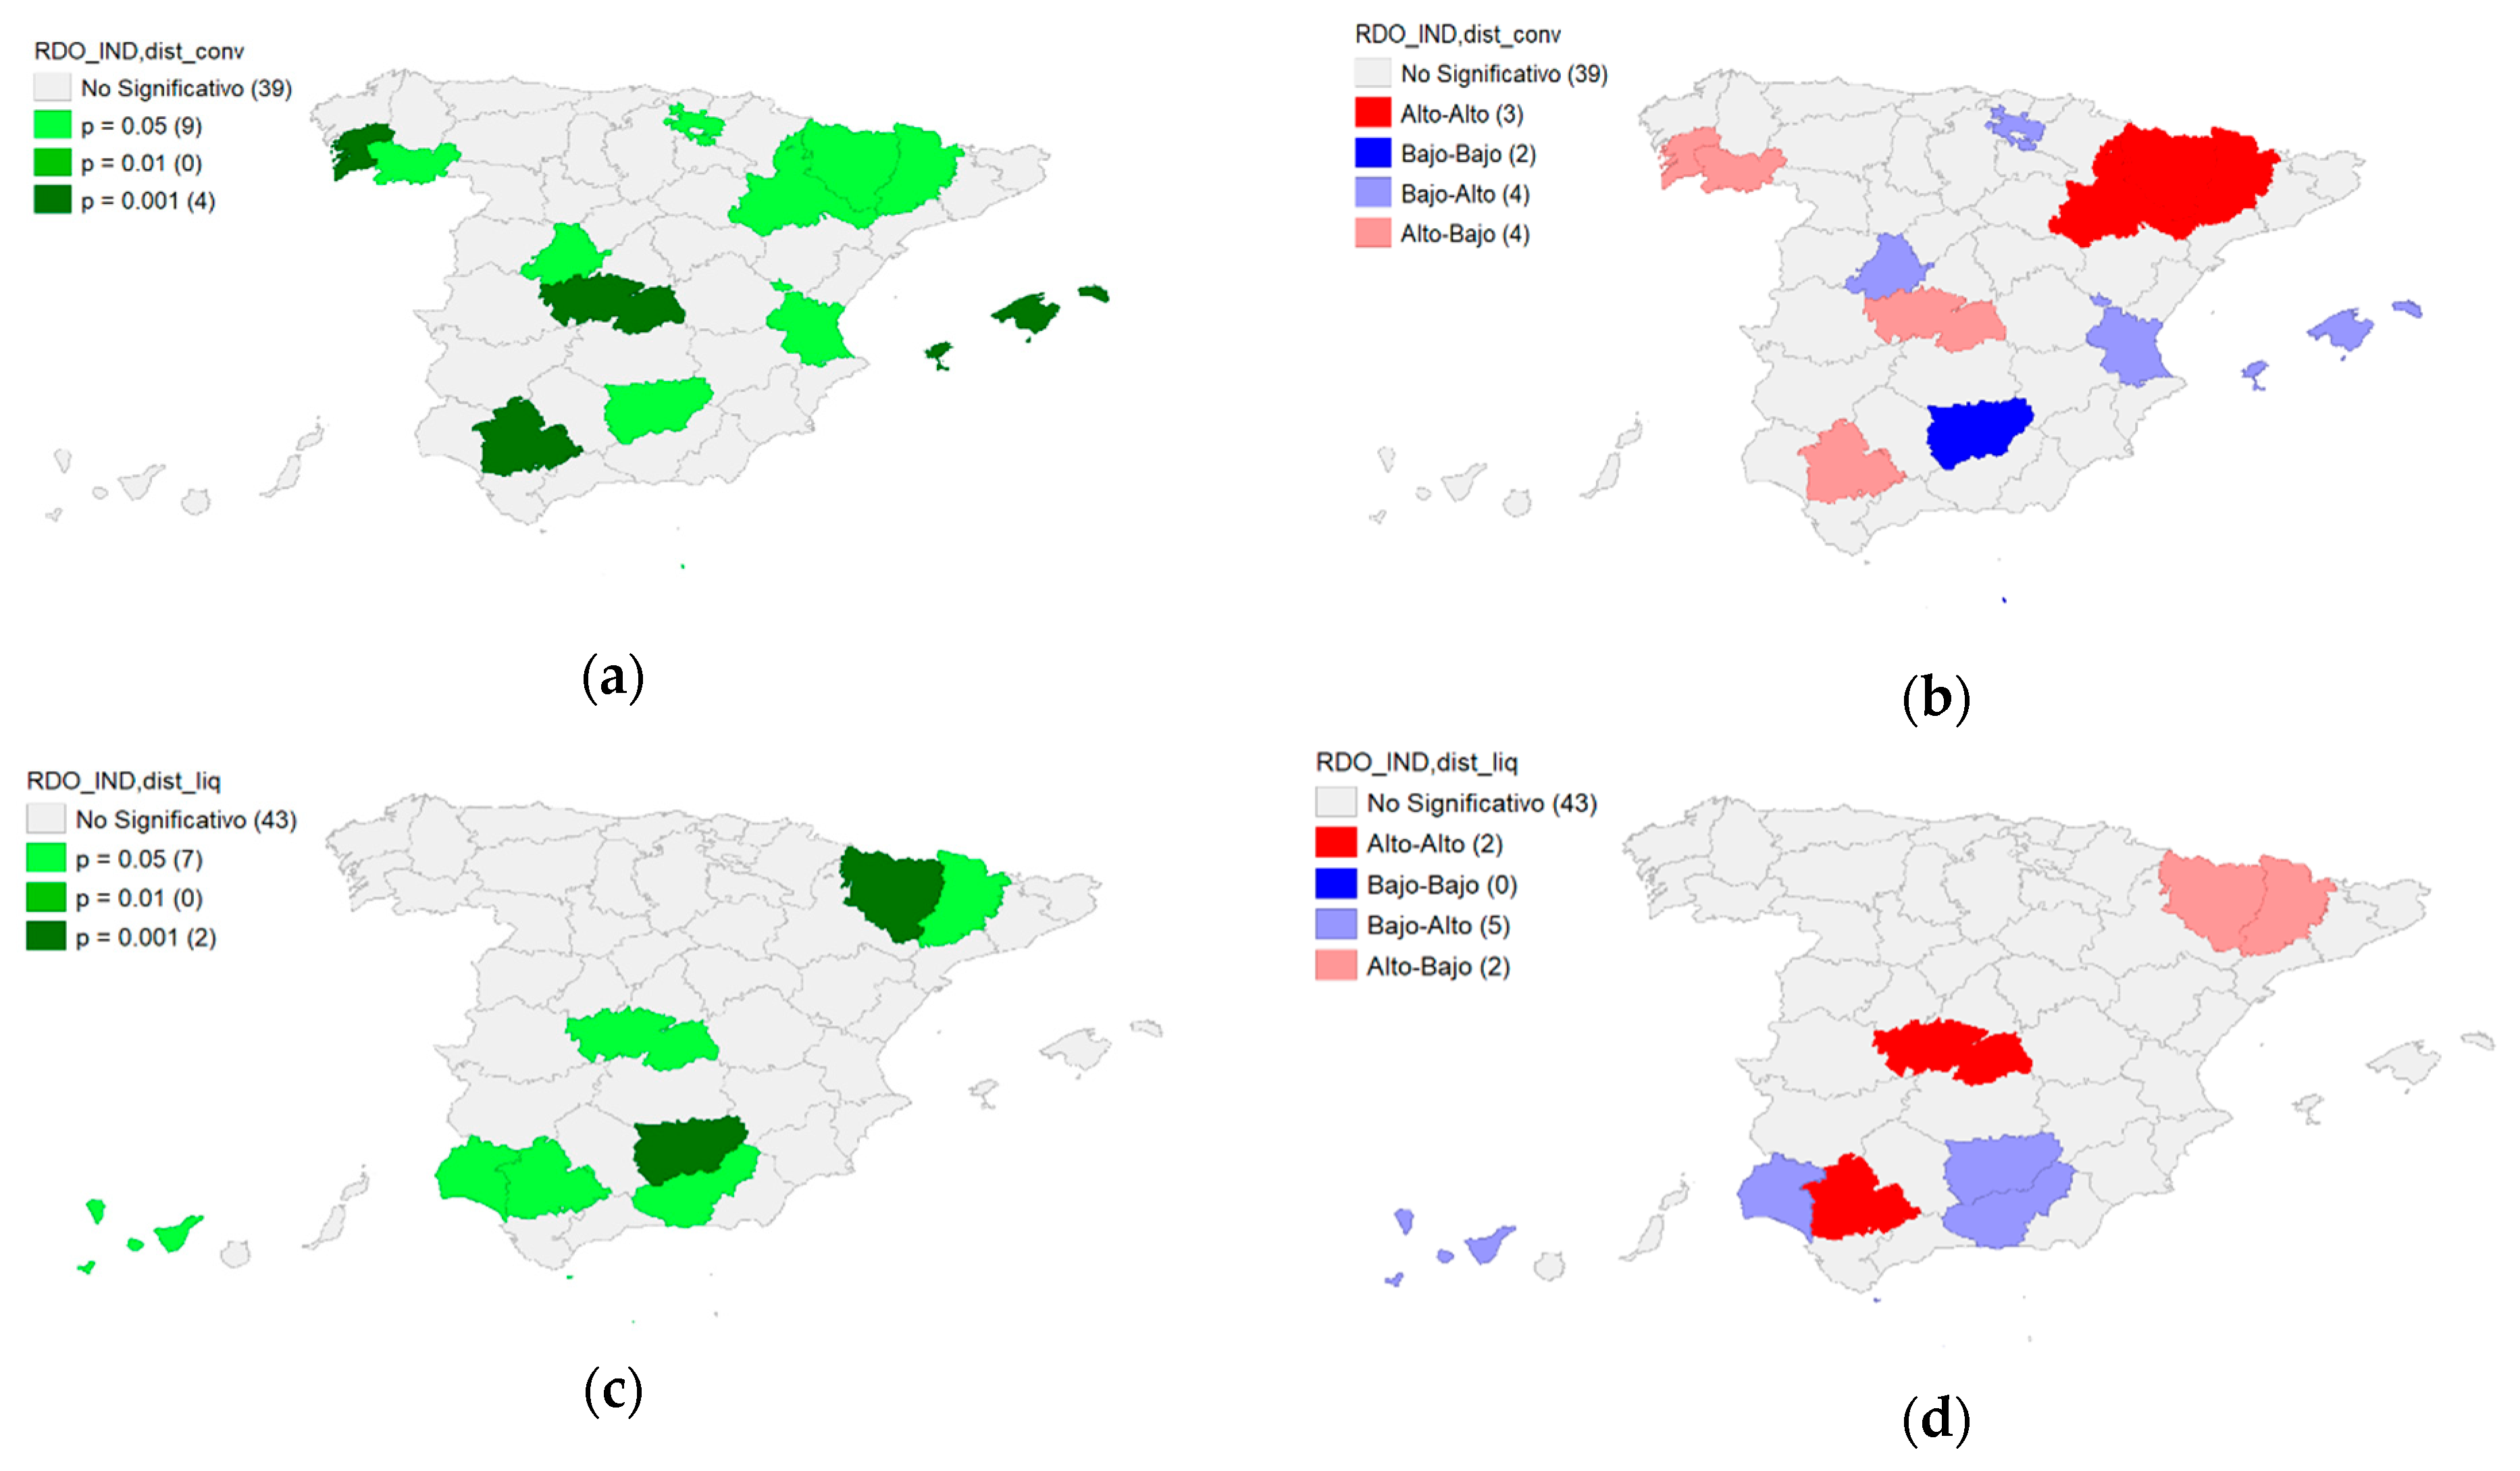
4.1. Industrial Specialization by Province and the Bankruptcy Outcome

To assess the value and provincial clusters’ existence, the Moran’s Index is analyzed and mapped (see Figure 3). Moran’s index shows a value of 0.555, with a z of 6.432, so clusters’ existence is well established. These results complement and are in line with those obtained previously (see Figure 2) and show Spain’s spatial specialization. Specifically, the northern provinces take high values (4 = manufacturing), and the second one in the southern province shows low values (1 = agriculture) and is significantly higher than 95%.
At this point, the question of if there are spatial correlations with the success or liquidation of the bankruptcies emerges. The variables Iag success and Iag liquidation are related to Iag industrial specialization. Moran’s Local Bivariate Index was applied to analyze this situation. The result is that the spatial dependence does exist, given that the obtained value is higher than 1, with z = 4.615 (see Figure 4).
The maps show that when the variable Iag success takes a high value (higher than 1) and simultaneously the variable Iag industry specialization too, a correlation is detected, so a relationship can be established between convenio and manufacturing in these provinces. The maps show (red color) the provinces, the northern ones, specialized in manufacturing activities that have a higher likelihood of a successful bankruptcy procedure outcome.
The same exercise was done for Iag liquidation and Iag industry specialization. In this case, a Moran’s Local Bivariant Index was obtained with a value of −0.201 and z = 3.0209, so spatial dependence exists as well as provincial clusters (see Figure 5). These results complement those obtained and shown in Figure 4. An apparent disparity is shown between the northern and southern provinces.
Results of the first of the analyses show that spatial dependence and disparities exist. Northern provinces specialize in manufacturing activities and tend to have higher success rates in a bankruptcy procedure (convenio outcome). On the other hand, southern provinces show specialization in the primary sector (agriculture) and present higher liquidation rates. These results are in line with previous investigations that show a spatial dependence on the bankruptcy solution among countries in [26] or countries with similar systems, such as Spain and Italy in [27,28,29]. At this point, the question is what factors can explain the regional disparities in the success rate?

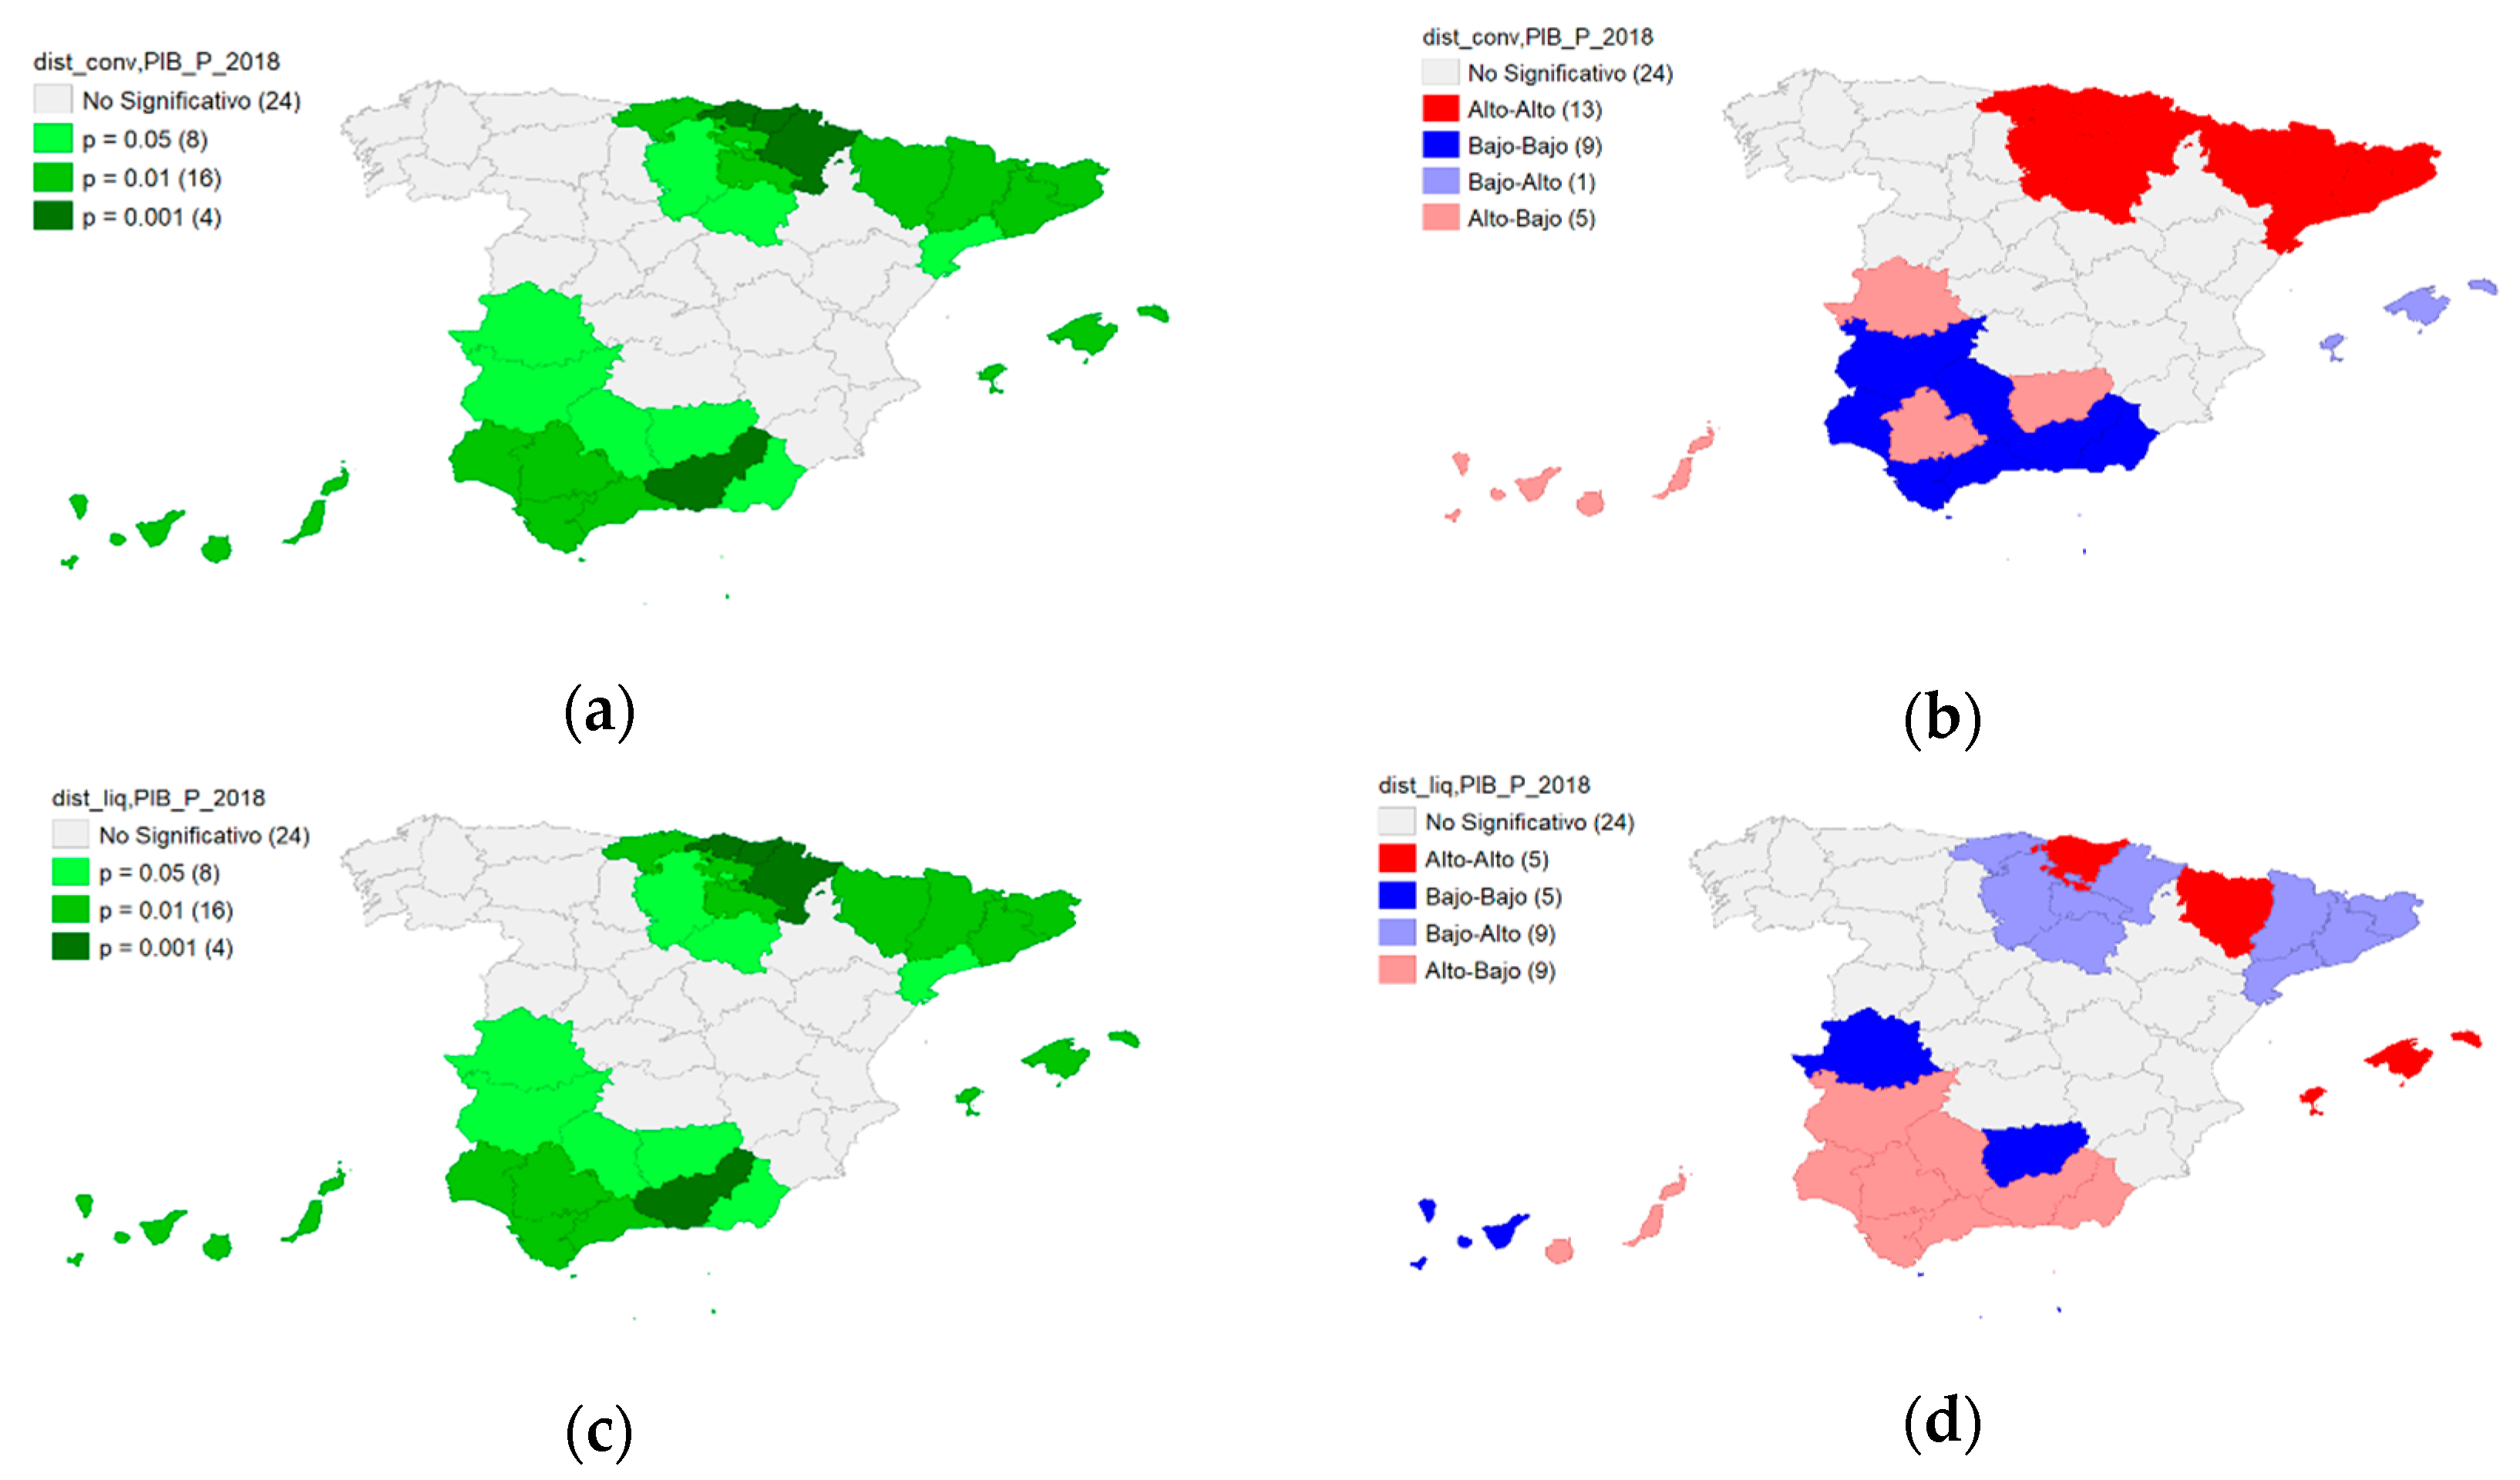
4.2. GDP Specialization by Province and the Bankruptcy Outcome

Once we had mapped the bankruptcy heterogeneity in Spain, in line with the second objective of this research, we intended to explain which factors could elucidate it as we noted (Figure 6) neither industry distribution nor GDP per capita in Spain. Northern provinces have higher GDP per capita figures than southern ones. To verify this fact, the Moran’s Index was obtained for GDP per capita (PIB_P_20182), revealing a value of 0.671 (z = 7.6828). Thus, spatial dependence exists as well as different behaviors. Figure 6 allows us to clearly distinguish those differences, showing a cluster of provinces with higher GDP per capita in the North during a cluster of lower GDP per capita in southern provinces.
The Moran’s Bivariate Local Analysis was applied to evaluate the correlation between the liquidation/success specialization, the GDP per capita, and the bankruptcy outcome. The index took a value of 0.420 (z = 6.125) for successful outcomes, while it took a value of 0.242 (z = −3.6107) for liquidation. Thus, it can be concluded that spatial dependence exists. Figure 7 shows the maps that determine the existence of province clusters associated with a type of result. Panels (a) and (b) depict success province distribution and also reveals a cluster in the north (high-high), which corresponds to provinces with higher success rates as well as high GDP per capita. Those panels also reveal that southern provinces present low success rates and low GDP per capita levels.
On the other hand, panels (c) and (d) relate to the liquidation specialization with GDP per capita and reveal the same idea. Green tones indicate the p-value. Low p-values indicate a rejection of the null hypothesis, thus concluding that clusters exist, as shown in the red and blue in panels (b) and (d).
The results again pose significant differences among provinces when relating bankruptcy outcomes with GDP per capita. It could be asserted that provinces with higher GDP per capita tend to obtain higher success rates, while those with lower GDP per capita tend to obtain higher liquidation rates. For instance, Álava, Bizcaia, Gipuzcoa, Navarra, Huesca, Lleida, Girona, Barcelona, or Tarragona (northern provinces—see Figure 7a,b) present higher GDP per capita and also higher success rates in the bankruptcy procedure. On the contrary, the provinces from Andalucía and Extremadura (Almería, Granada, Málaga Cádiz, Sevilla, Huelva, Córdoba, and Badajoz) show lower GDP per capita values and lower success rates.
Panels (c) and (b) of Figure 7 show the clusters formed for the liquidation outcome and also show similar results to panels (a) and (b).
At this point, a new question emerges related to if there is a spuria relationship between provincial wealth (measured by GDP) and proceeding success, or if it is an explicative cause. For this reason, we develop a complementary analysis that can serve to explain more robustly the logic of this spatial dependence and can serve as a basis to start the discussion. This analysis is formed of three levels: (a) industry specialization vs. outcome, (b) business factor vs. outcome, (c) unemployment vs. outcome.

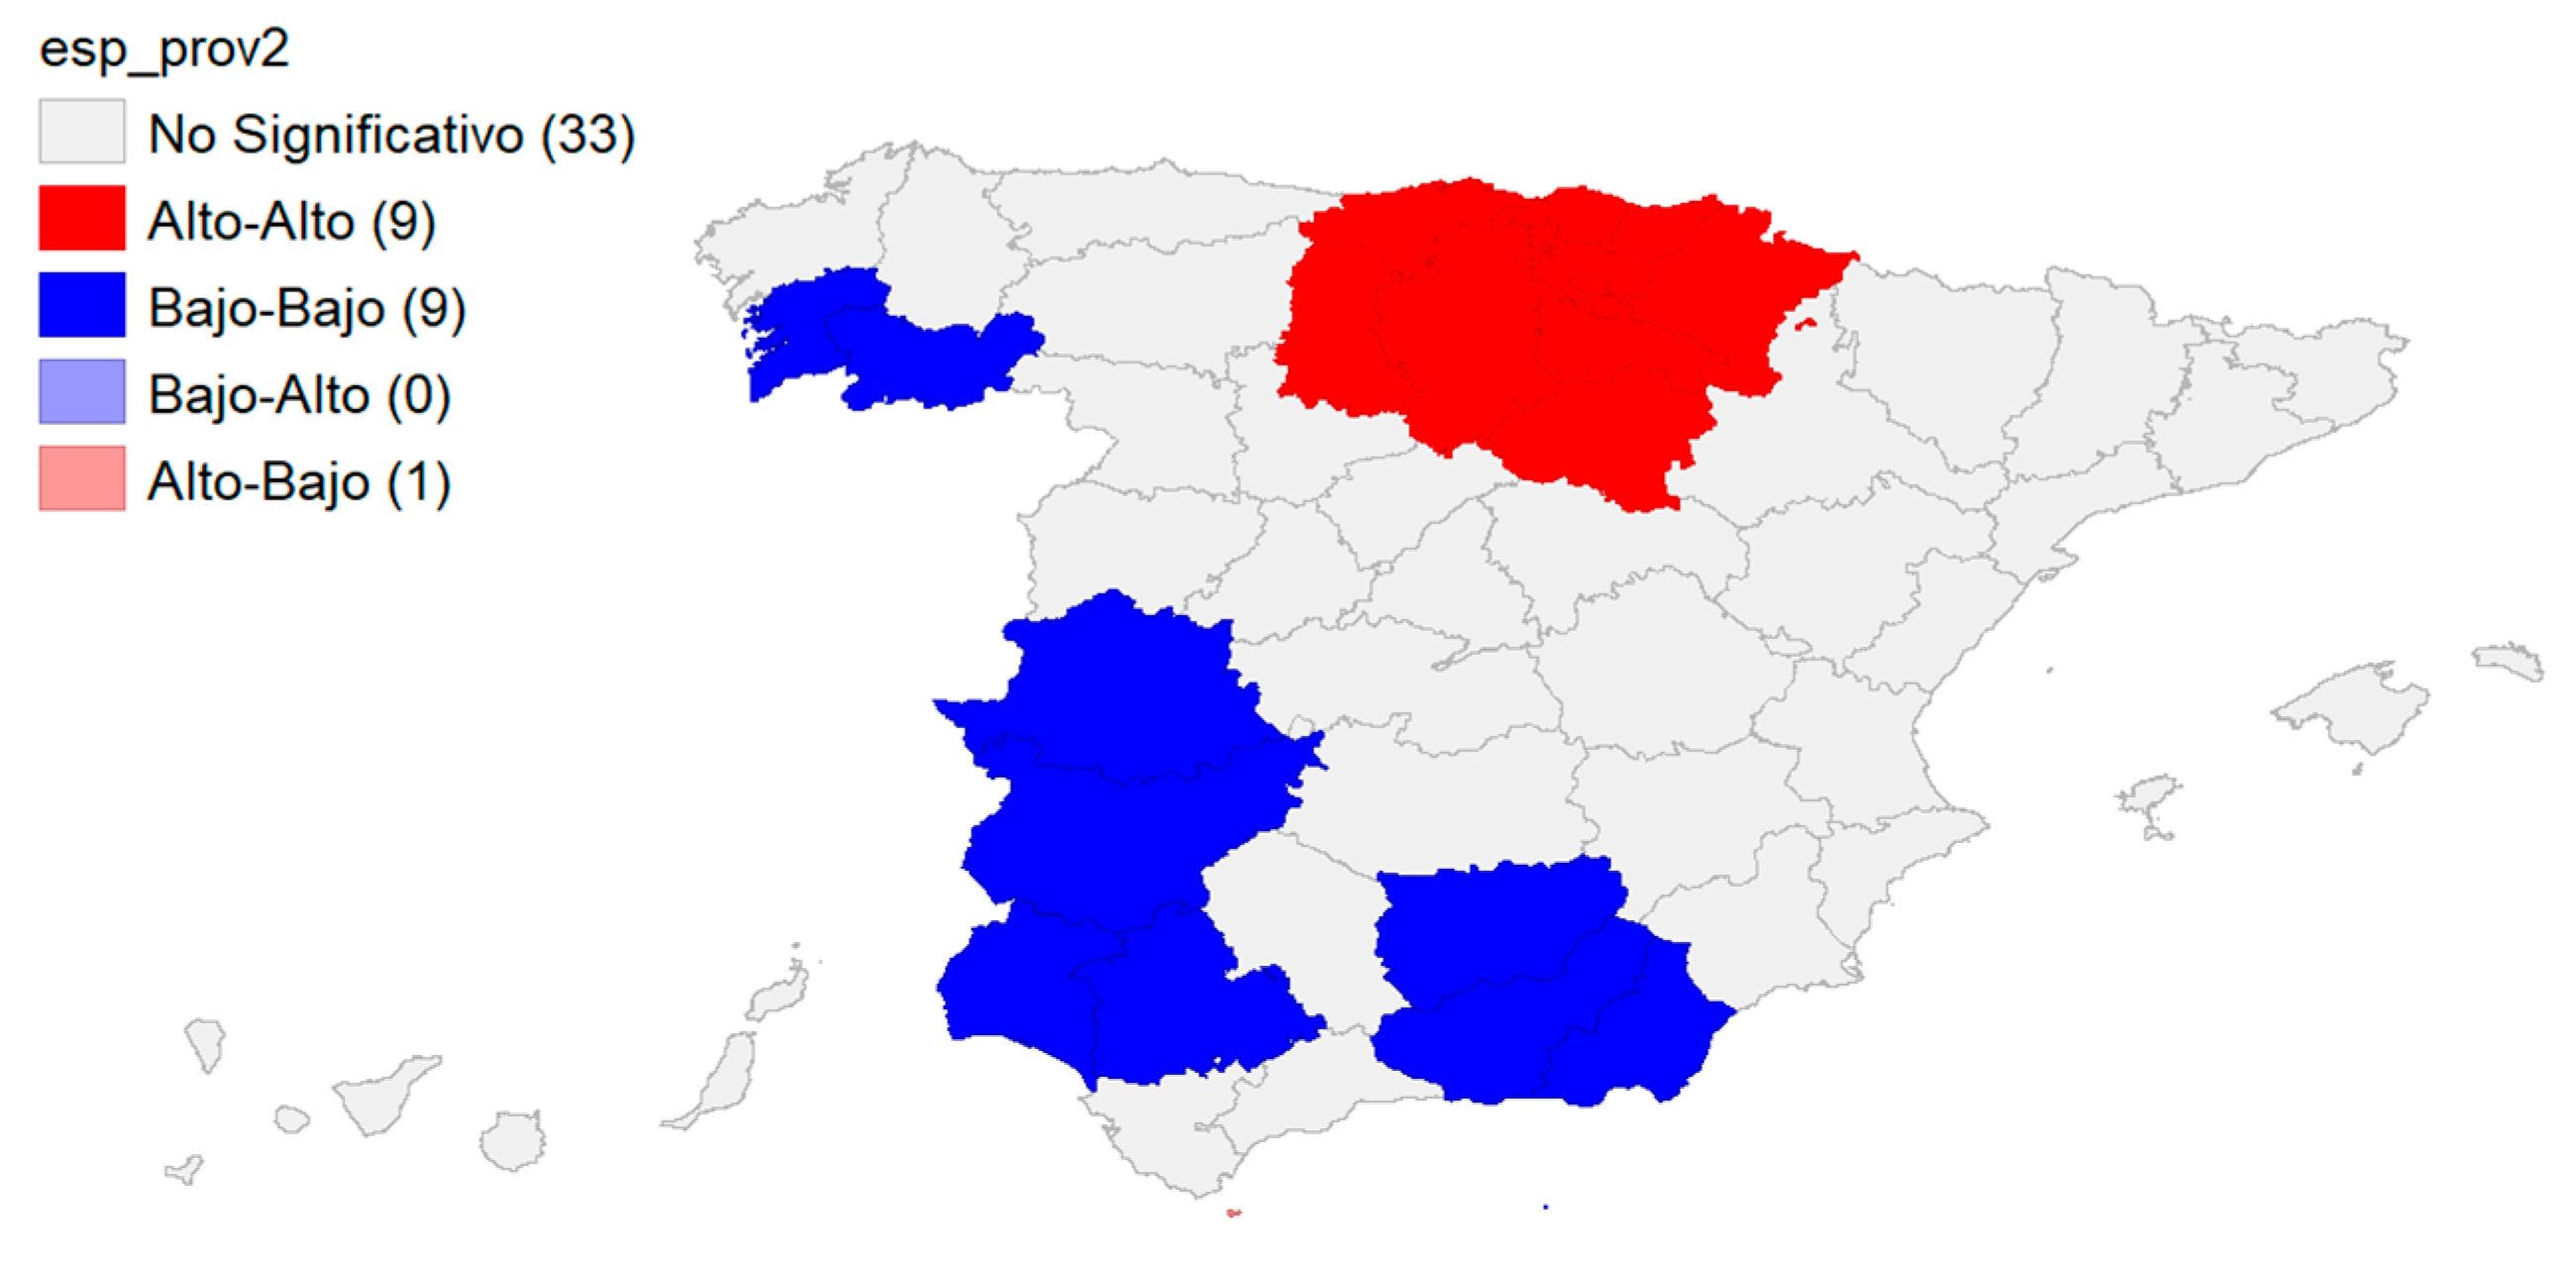
4.3. Contrasting Industry Specialization with the Bankruptcy Outcome by Province

We mapped the distribution by industries as shown in Figure 8, subfigures a–d. Green provinces are those with higher success rates, while blue shows those with liquidation predominance. Clear blue provinces are those with no specialization or who do not have data.
When calculating the Moran’s Index, spatial dependence is revealed only for manufacturing firms, with a value of 0.183 (z = 2.4461) (details at a province are shown in Figure 9b). In Figure 9b (right), provinces in red show high-high values, which means, high concentration of manufacturing firms and high success rates of the bankruptcy procedure. Also, those provinces are surrounded by provinces with similar results. On the contrary, blue provinces have manufacturing specialization, but provinces with similar results also surround low success rates in the bankruptcy procedure.
To deepen in the causes that produce higher success rates in manufacturing companies, the manufacturing specialization variable was related to success/liquidation specialization. Figure 10 depicts the maps of these correlations, which show a Moran’s Index of 0.252 (z = −3.4562) for success and −0.143 (z = −2.2607) for liquidation, so both results are significant.
The maps in Figure 10 (panels a and b) reveal that companies in the northern provinces (Lleida, Huesca, Navarra, and Zaragoza) have higher success rates (red), while southern (Ciudad Real and Sevilla) and northwest provinces (Pontevedra and Orense) (pink) show a higher manufacturing specialization and also lower success rates. In these latter areas, manufacturing firms usually end in liquidation. From the perspective of liquidation, panels (c) and (d) of Figure 10 show, particularly those in red, manufacturing firms that tend to end in liquidation. In those provinces, both variables (liquidation and manufacturing specialization) take high values.
In light of these results, there exists a substantial difference between the northern and southern provinces related to the bankruptcy outcome for manufacturing companies. Thus, the bankruptcy outcome does not seem to be related only to industrial activity, but it also seems to be influenced by location. This result is in line with studies of [23].

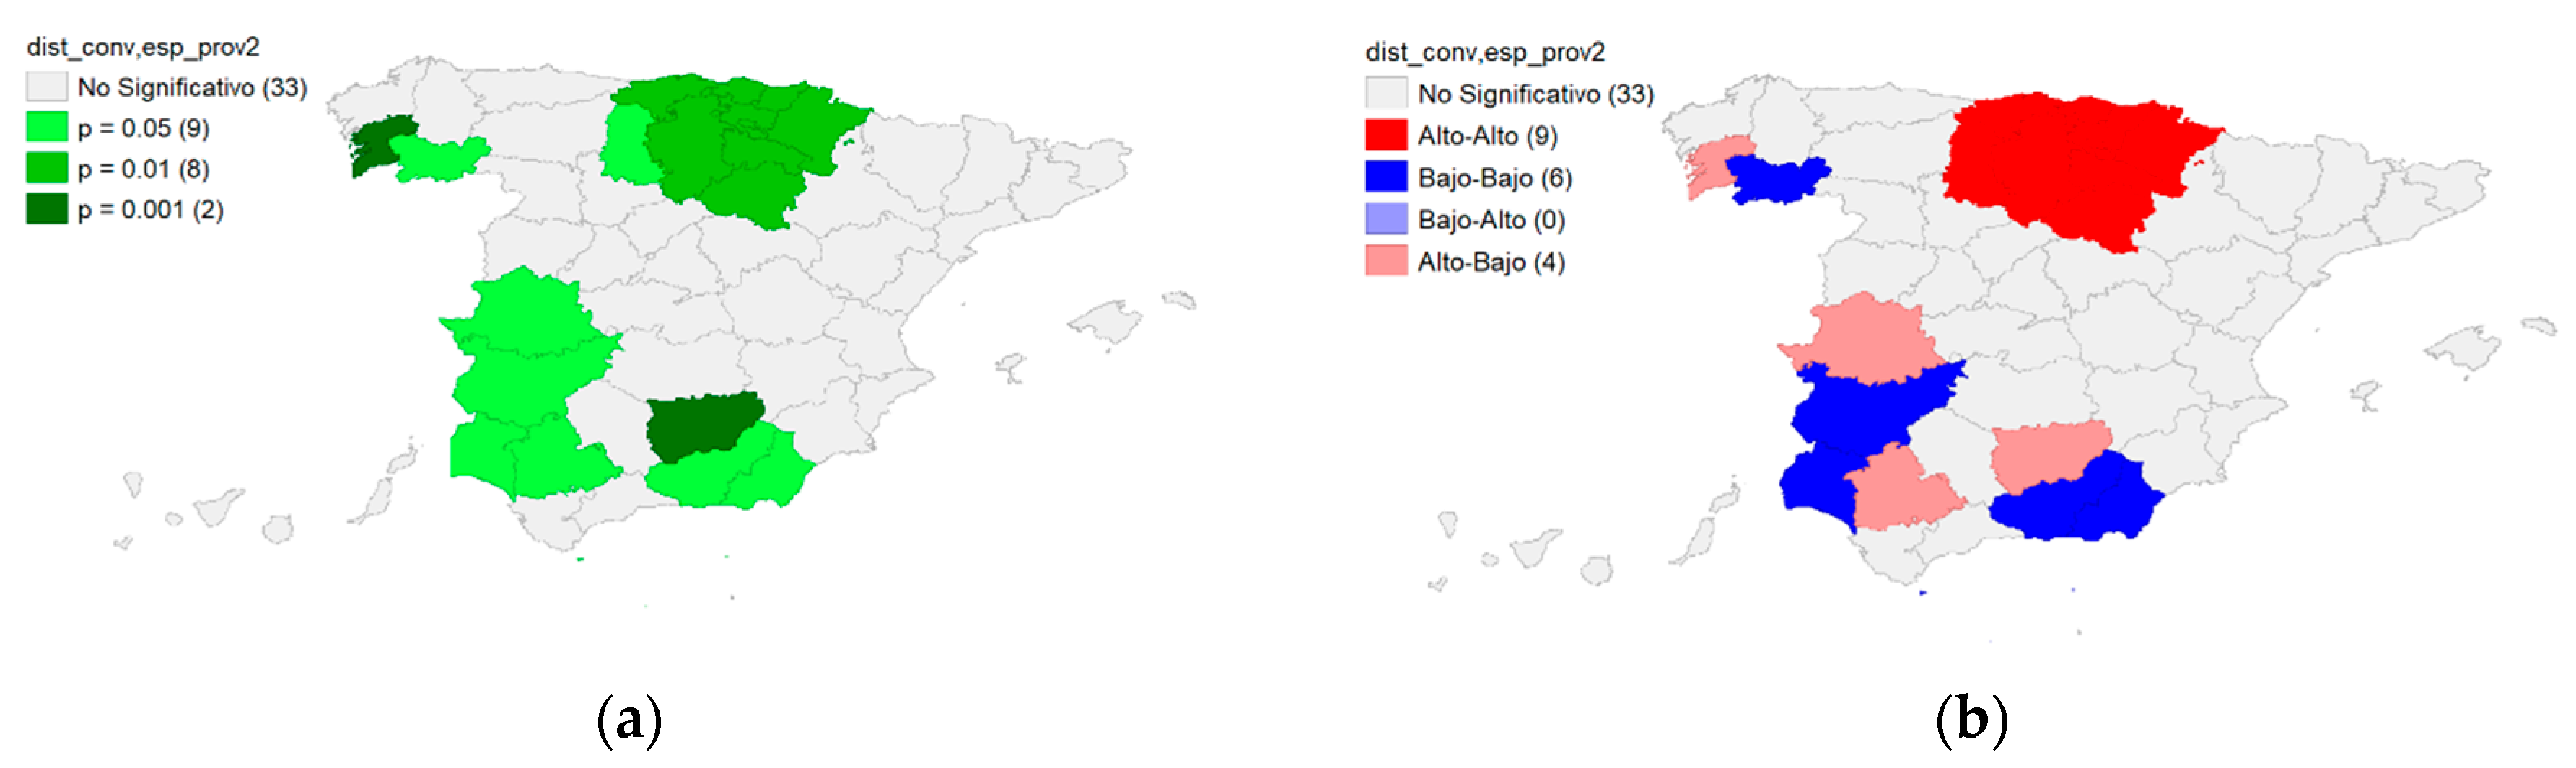
4.4. Contrasting Business Factor (Size) with the Bankruptcy Outcome by Province

Size has also been suggested as the main determinant for firm survival and bankruptcy success [14,23,40]. As shown by the data, the proportion of small, medium, or large companies across provinces is not homogeneous, so it would not be expected that the bankruptcy outcome is homogeneous as well.
When mapping the clusters for business size, the results show as expected. Northern provinces have a higher proportion of medium and large companies than the rest of the country. Moran’s index for this variable (I_MED_GRND) has a value of 0.350 (z = 4.0799), while Moran’s Index for small companies is 0.348 (z = 4.0721). Therefore, in both cases, spatial dependence is revealed (see Figure 11), and maps are complementary between them.
When applying Moran’s Bivariate Index to the variable medium and large companies with respect to the success specialization, it results in a value of 0.237 (z = 3.4742). This result, which again reveals spatial dependence and the existence of a cluster with a higher proportion of medium and large companies than the rest of the country, and also in which these firms tend to have higher success rates. When this index is applied to liquidation, the value of z is under 1.96, so no spatial dependence is shown.
When calculating the index for small companies, a cluster is detected in the north, which presents a low proportion of small companies and high success rates. There are companies with high success rates in the west of the country and a high proportion of small companies, with an index of −0.234 (z = −3.4336).
Therefore, size is also a significant variable to predict the bankruptcy outcome discerning by location. In this case, larger companies tend to have higher success rates than smaller ones. The resource-based theory supports this conclusion in [32].

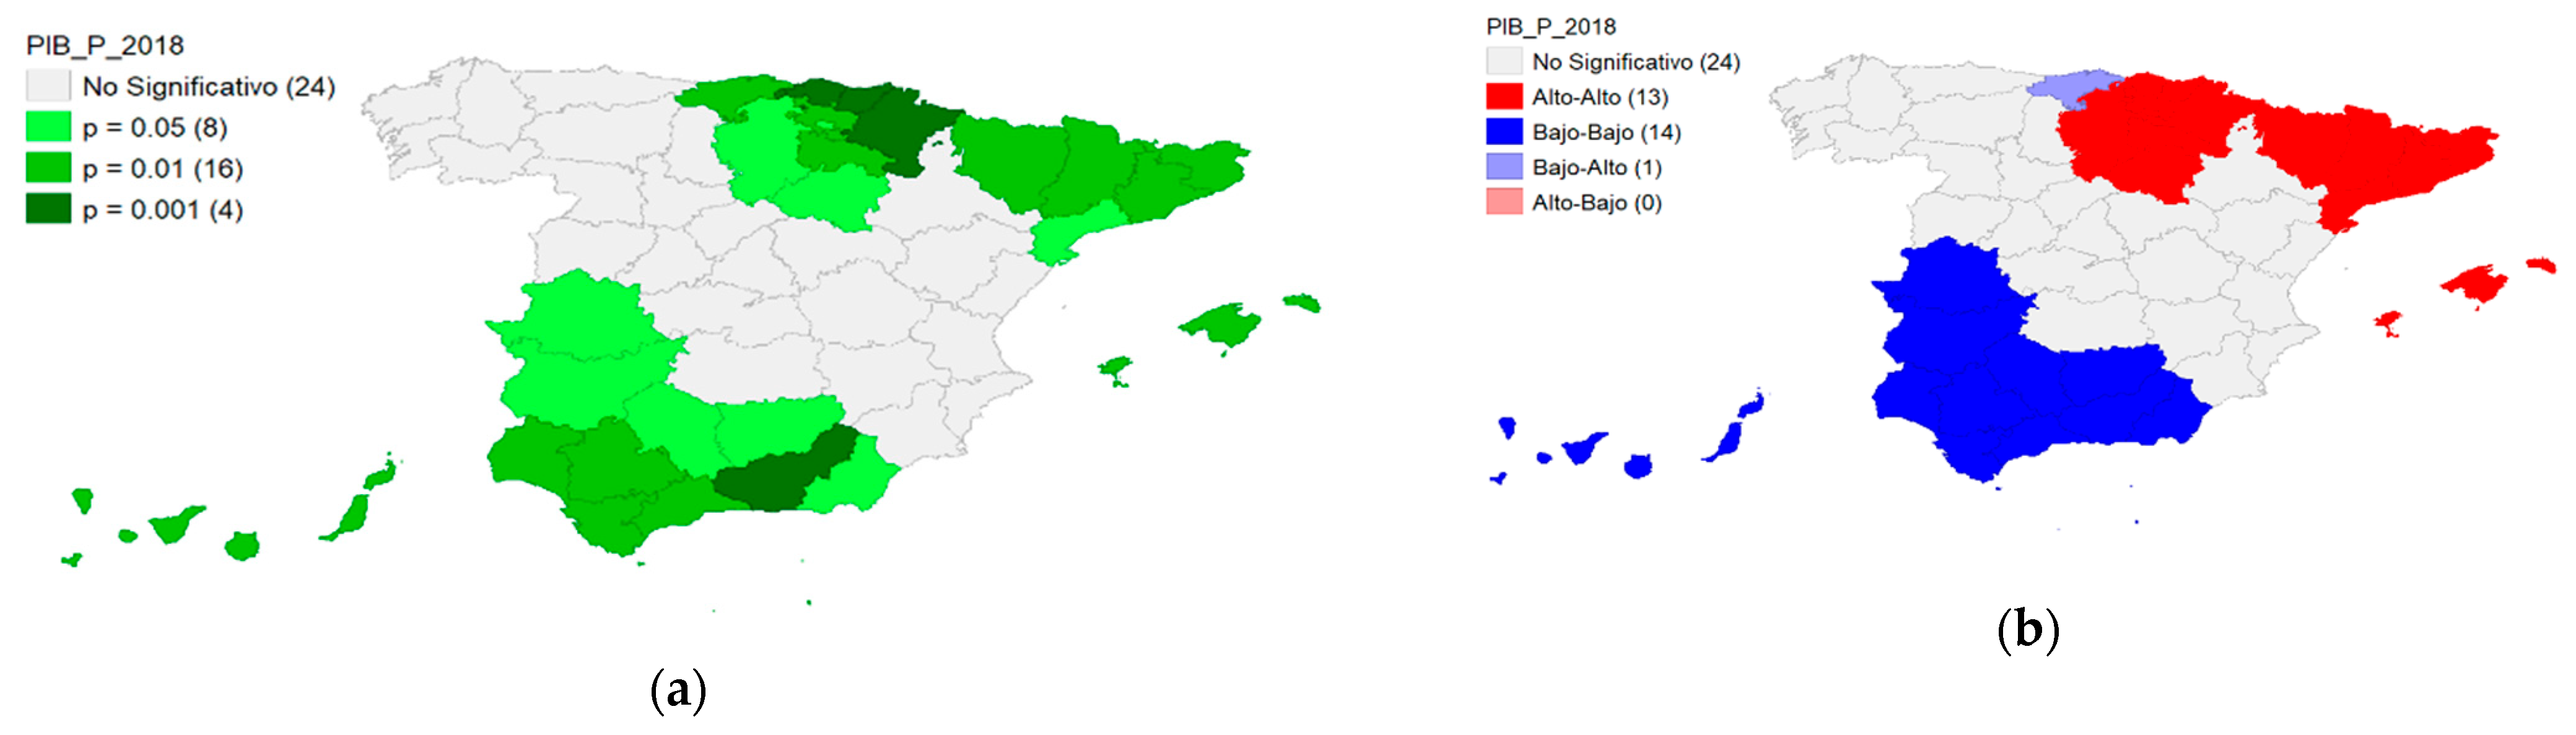
4.5. Contrasting Unemployment Levels with the Bankruptcy Outcome by Province

The provinces’ employment levels were also suggested as a possible determinant for bankruptcy success in a particular territory due to the positive association between the competitiveness of a region and its occupancy level [21,41]. We applied the Moran’s Index and mapped the results as shown in Figure 12. Employment levels do not have a homogeneous distribution across provinces, as revealed by the spatial distribution of Figure 12. The Moran’s Index presents a value of 0.821 (z = 9.2937), so the spatial dependence is revealed for this variable.
Northern provinces show higher employment rates than southern ones, revealing behavior and dichotomy that is also observed in the rest of the variables studied. We correlated this variable with success and liquidation specialization through Moran’s Bivariant Index, and the results are depicted in Figure 13.
Figure 13 shows where provincial clusters are located. Provinces with higher employment and success rates are depicted in red (north), while provinces with low employment and success rates are depicted in blue (south). The Moran’s Bivariate Index takes a value of 0.402 (z = 5.7862), so spatial dependence is revealed. When correlating liquidation and employment rates, the results are similar and complementary to the ones of success. In this case, Moran’s Bivariate Index is −0.263 (z = 3.9138), and the hypothesis of spatial dependence is accepted. In short, employment rates also explain when a company will have a higher likelihood of success in a bankruptcy procedure. These results on the relationship between unemployment and business survival in Spain are similar to the research carried out in [8,47].

5. Discussion and Conclusions

This work presents a longitudinal analysis of the regional disparities in bankruptcy proceedings via a spatial approach. The work aims to contribute to research dealing with business turnaround and location in the context of bankruptcy, using as a spatial unit of analysis the provinces, and predicting the provinces’ business activity and economic characteristics. The analyses were conducted on a sample of 862 Spanish bankrupt firms (2004–2017). Employing the Moran’s Index and the Local Association Index (LISA), we can overcome the limitations of the extensively used logistic model in most previous studies.
The central conclusion of this analysis is that spatial dependence exists when a turnaround is attempted in the context of bankruptcy, exemplifying Tobler’s First Law of Geography. Specifically, northern provinces showed higher success rates while southern ones tend to liquidate bankrupt companies. Moreover, we have confirmed a marked north–south pattern in the outcome of the bankruptcy procedure for the whole period of 2004–2017.
What are the reasons for these regional disparities and spatial dependence of bankruptcy in Spain? In our research, we have contrasted the association of default and location, in a first step with the province’s industry specialization, and later with economic indicators such as GDP, the average size of the firms at a provincial level, and unemployment. The results confirm that the effectiveness of the bankruptcy system is spatially dependent, particularly in the manufacturing industry. In other words, for a given manufacturing firm, the chance to complete a bankruptcy proceeding successfully is higher in the north than in the south of Spain. The reasons behind these results could be structural (economic) and cultural. Northern Spanish provinces have a heterogeneous tradition of manufacturing industries since the beginnings of industrialization. Also, entrepreneurship is deeply rooted in its culture, and failure is assumed as a natural outcome of the business.
The main implication is that the context matters for business’ survival, both economically and institutionally. This could help to overcome the common assumption that there is certain homogeneity within national borders when studying a phenomenon such as bankruptcy. Contagion effects and provincial clusters are also present to determine the bankruptcy outcome. Companies within a close distance can suffer from the financial sickness of another, given their proximity, interrelations, and commercial dependence. This aspect could be relevant to predict future outcomes in the mapped Spanish central area characterized by heterogeneous results.
We can highlight that firms located in particular provinces will have a higher likelihood of survival. Hence, locating in a specific place can be considered as a strategy for firms facing decline and turnaround. This has been represented in the recent case of Abengoa, which planned to relocate its headquarters from Sevilla to Valencia to obtain more substantial public support proving the increasing importance that stakeholders’ support has in turnaround [4,34]. This phenomenon has been observed within the EU borders [3,48,49] when firms decided to become bankrupt in one country rather than their country-of-origin, given the new location’s advantages. Our work’s particularity and contribution are that divergent outcomes were observed within Spanish borders; whose legal regime is almost equal across provinces.
Our study is not exempt from limitations. Firstly, data are limited to secondary sources, which, despite being valid and broadly used in the bankruptcy context, do not contain information about the causes of success or liquidation. This remains a common limitation in prior turnaround studies. Those causes could be partially inferred from the firm’s industry or environment, but a deeper analysis would be needed to overcome this limitation. The methodology employed based on correlations could be improved by creating indexes from the combination of the variables and spatiotemporal analysis.
All in all, this work can constitute the base to detect the critical variables for more complex studies based on multivariate regressions. As future research lines, we propose to consider the inclusion of court resources and court efficiency. The commercial court (Juzgado de lo Mercantil) is responsible for the formal procedure, and both agility and efficiency are desirable [50]. We suggest combining firm-specific and location-specific factors when studying turnaround attempts, either in or out of the bankruptcy context. Firm survival is irremediably linked to location, and this factor must be taken into account in future studies.

Author Contributions

Conceptualization, M.R., S.C. and F.P.; methodology, S.C.; software, S.C.; validation, S.C. and F.P.; formal analysis, S.C.; investigation, M.R. and S.C.; resources, M.R. and S.C.; data curation, S.C.; writing—original draft preparation, M.R.; writing—review and editing, M.R. and F.P.; visualization, S.C.; supervision, F.P.; project administration, F.P.; funding acquisition, F.P. All authors have read and agreed to the published version of the manuscript.

Funding

This research has been funded by the Research Project UV-INV-AE19-1206484 of the University of Valencia (Spain).

Institutional Review Board Statement

Not applicable.

Informed Consent Statement

Not applicable.

Data Availability Statement

Not applicable.

Conflicts of Interest

The authors declare no conflict of interest.

References

  1. McKinley, W.; Latham, S.; Braun, M. Organizational decline and innovation: Turnarounds and downward spirals. Acad. Manag. Rev. 2014, 39, 88–110. [Google Scholar] [CrossRef]
  2. Altman, E.; Hotchkiss, E. Corporate Financial Distress and Bankruptcy; John Wiley & Sons: New Jersey, NJ, USA, 2006. [Google Scholar]
  3. Kliestik, T.; Misankova, M.; Valaskova, K.; Svabova, L. Bankruptcy prevention: New effort to reflect on legal and social changes. Sci. Eng. Ethics 2018, 24, 791–803. [Google Scholar] [CrossRef]
  4. Franks, J.R.; Sussman, O. Financial distress and bank restructuring of small to medium size UK companies. Rev. Financ. 2005, 9, 65–96. [Google Scholar] [CrossRef]
  5. Pandit, N.R.; Cook, G.A.S.; Chittenden, F.C. Corporate rescue: Empirical evidence on company voluntary arrangements and small firms. J. Small Bus. Enterp. Dev. 2000, 7, 241–254. [Google Scholar] [CrossRef]
  6. Trahms, C.A.; Ndofor, H.A.; Sirmon, D.G. Organizational decline and turnaround: A review an agenda for future research. J. Manag. 2013, 39, 1277–1307. [Google Scholar] [CrossRef]
  7. Wenzel, M.; Stanske, S.; Lieberman, M.B. Strategic responses to crisis. Strat. Manag. J. 2020, in press. [Google Scholar] [CrossRef] [Green Version]
  8. García-Marí, J.H.; Sánchez-Vidal, J.; Tomaseti-Solano, E. Fracaso empresarial y efectos contagio. Un análisis espacial para España. Trimest. Económico 2016, 83, 429–449. [Google Scholar] [CrossRef] [Green Version]
  9. Tobler, W.R. A computer movie simulating urban growth in the Detroit region. Econ. Geogr. 1970, 46 (Suppl. S1), 234–240. [Google Scholar] [CrossRef]
  10. Frenken, K.; Cefis, E.; Stam, E. Industrial dynamics and clusters: A survey. Reg. Stud. 2015, 49, 10–27. [Google Scholar] [CrossRef] [Green Version]
  11. Staber, U. Spatial Proximity and Firm Survival in a Declining Industrial District: The Case of Knitwear Firms in Baden-Wurttemberg. Reg. Stud. 2001, 35, 329–341. [Google Scholar] [CrossRef]
  12. Arogyaswamy, K.; Barker, V.L.; Yasai-Ardekani, M. Firm Turnarouns: An integrative two-stage model. J. Manag. Stud. 1995, 32, 493–525. [Google Scholar] [CrossRef]
  13. Robbins, D.K.; Pearce, J.A., II. Turnaround: Retrenchment and recovery. Strateg. Manag. J. 1992, 13, 287–309. [Google Scholar] [CrossRef]
  14. Cater, J.; Schwab, A. Turnaround strategies in established small family firms. Fam. Bus. Rev. 2008, 21, 31–50. [Google Scholar] [CrossRef]
  15. Lim, D.S.; Celly, N.; Morse, E.A.; Rowe, W.G. Rethinking the effectiveness of asset and cost retrenchment: The contingency effects of a firm’s rent creation mechanism. Strateg. Manag. J. 2013, 34, 42–61. [Google Scholar] [CrossRef]
  16. Morrow, J.L., Jr.; Johnson, R.A.; Busenitz, L.W. The effects of cost and asset retrenchment on firm performance: The overlooked role of a firm’s competitive environment. J. Manag. 2004, 30, 189–208. [Google Scholar] [CrossRef]
  17. Rico, M.; Pandit, N.R.; Puig, F. SME insolvency, bankruptcy, and survival: An examination of retrenchment strategies. Small Bus. Econ. 2020, 1–16. [Google Scholar] [CrossRef]
  18. Barbero, J.L.; Martínez, J.A.; Moreno, A.M. Should Declining Firms Be Aggressive During the Retrenchment Process? J. Manag. 2018, 46, 15. [Google Scholar] [CrossRef] [Green Version]
  19. Barbero, J.L.; Ramos, A.; Chiang, C. Restructuring in dynamic environments: A dynamic capabilities perspective. Ind. Corp. Chang. 2017, 26, 593–615. [Google Scholar] [CrossRef]
  20. Tangpong, C.; Abebe, M.; Li, Z. A temporal approach to retrenchment and successful turnaround in declining firms. J. Manag. Stud. 2015, 52, 647–677. [Google Scholar] [CrossRef]
  21. Porter, M.E. Clusters and the New Economics of Competition. Harv. Bus. Rev. 1998, 76, 77–90. [Google Scholar]
  22. Claver-Cortés, E.; Marco-Lajara, B.; Seva-Larrosa, P.; Ruiz-Fernández, L. Competitive advantage and industrial district: A review of the empirical evidence about the district effect. Compet. Rev. Int. Bus. J. 2019, 29, 211–235. [Google Scholar] [CrossRef]
  23. Puig, F.; García-Mora, B.; Santamaría, C. The influence of geographical concentration and structural characteristics on the survival chance of textile firms. J. Fash. Mark. Manag. Int. J. 2013, 17, 6–19. [Google Scholar] [CrossRef] [Green Version]
  24. Baum, J.A.; Mezias, S.J. Localized competition and organizational failure in the Manhattan hotel industry, 1898–1990. Adm. Sci. Q. 1992, 37, 580–604. [Google Scholar] [CrossRef]
  25. Van Hemmen, E. Estadística Concursal. Anuario 2017; Colegio de Registradores de la Propiedad, Bienes Muebles y Mercantiles de España, Ed.; Colegio de Registradores de la Propiedad, Bienes Muebles y Mercantiles de España: Madrid, Spain, 2018. [Google Scholar]
  26. Davydenko, S.A.; Franks, J.R. Do bankruptcy codes matter? A study of defaults in France, Germany and the U.K. J. Financ. 2008, 63, 565–608. [Google Scholar] [CrossRef]
  27. García-Posada, M.; Mora-Sanguinetti, J. Why do Spanish Firms Rarely Use the Bankruptcy System. The Role of Mortgage Institution; Working paper no. 1234; Bank of Spain: Madrid, Spain, 2012. [Google Scholar]
  28. Andreano, M.S.; Benedetti, R.; Mazzitelli, A.; Piersimoni, F. Spatial autocorrelation and clusters in modelling corporate bankruptcy of manufacturing firms. Econ. Politica Ind. 2018, 45, 475–491. [Google Scholar] [CrossRef]
  29. Falavigna, G.; Ippoliti, R. Industrial spatial dynamics, financial health and bankruptcy: Evidence from Italian manufacturing industry. Econ. Politica Ind. 2018, 45, 533–554. [Google Scholar] [CrossRef]
  30. Matheron, G. Random functions and their application in geology. In Geostatistics; Springer: Boston, MA, USA, 1970; pp. 79–87. [Google Scholar]
  31. García-Posada, M.; Vegas, R. Las reformas de la Ley Concursal durante la Gran Recesión; Working paper no. 1610; Bank of Spain: Madrid, Spain, 2016. [Google Scholar]
  32. Thornhill, S.; Amit, R. Learning about failure: Bankruptcy, firm age, and the resource-based view. Organ. Sci. 2003, 14, 497–509. [Google Scholar] [CrossRef] [Green Version]
  33. Jas, P.; Skelcher, C. Performance decline and turnaround in public organizations: A theoretical and empirical analysis. Br. J. Manag. 2005, 16, 195–210. [Google Scholar] [CrossRef]
  34. Rico, M.; Puig, F. Why do Spanish football clubs success in their insolvency proceedings? Universia Bus. Rev. 2015, 48, 52–69. [Google Scholar]
  35. Pozuelo, J.; Labatut, G.; Veres, E. Validez de la información financiera en los procesos de insolvencia. Un estudio de la pequeña empresa española. Cuad. Econ. Dir. Empresa 2013, 16, 29–40. [Google Scholar]
  36. Van Hemmen, E. Formalismo judicial, control e incentivos en el concurso de acreedores. Rev. Estab. Financ. 2009, 16, 113–144. [Google Scholar]
  37. Cromley, R.G.; Hanink, D.M. Focal location quotients: Specification and applications. Geogr. Anal. 2012, 44, 398–410. [Google Scholar] [CrossRef]
  38. Tian, Z.; Gottlieb, P.D.; Goetz, S.J. Measuring industry co-location across county borders. Spat. Econ. Anal. 2020, 15, 92–113. [Google Scholar] [CrossRef]
  39. Speldekamp, D.; Saka-Helmhout, A.; Knoben, J. Reconciling perspectives on clusters: An integrative review and research agenda. Int. J. Manag. Rev. 2020, 22, 75–98. [Google Scholar] [CrossRef] [Green Version]
  40. Belso Martínez, J.A. Equilibrium entrepreneurship rate, economic development and growth. Evidence from Spanish regions. Entrep. Reg. Dev. 2005, 17, 145–161. [Google Scholar] [CrossRef]
  41. Audretsch, D.B.; Keilbach, M. The localisation of entrepreneurship capital: Evidence from Germany. Pap. Reg. Sci. 2007, 86, 351–365. [Google Scholar] [CrossRef]
  42. Anselin, L. Local indicators of spatial association—LISA. Geogr. Anal. 1995, 27, 93–115. [Google Scholar] [CrossRef]
  43. Anselin, L. Exploring spatial data with GeoDaTM: A workbook. Urbana 2004, 51, 309. [Google Scholar]
  44. Plummer, L.A. Spatial dependence in entrepreneurship research: Challenges and methods. Organ. Res. Methods 2020, 13, 146–175. [Google Scholar] [CrossRef]
  45. Ponce, P.; Álvarez-García, J.; Cumbicus, M.; Rio-Rama, M.d.l.C. Spatial Externalities of Income Inequality on Security in Latin America. Mathematics 2021, 9, 245. [Google Scholar] [CrossRef]
  46. Cliff, A.D.; Ord, K. Spatial autocorrelation: A review of existing and new measures with applications. Econ. Geogr. 1970, 46 (Suppl. S1), 269–292. [Google Scholar] [CrossRef]
  47. Cantarero, S.; González-Loureiro, M.; Puig, F. Efectos de la crisis económica sobre el emprendimiento en empresas de economía social en España: Un análisis espacial. REVESCO. Rev. Estud. Coop. 2017, 125, 24–48. [Google Scholar]
  48. García, V.; Marqués, A.I.; Sánchez, J.S. Exploring the synergetic effects of sample types on the performance of emsembles for credit risk and corporate bankruptcy prediction. Inf. Fusion 2018, 47, 88–101. [Google Scholar] [CrossRef]
  49. Valaskova, K.; Durana, P.; Adamko, P.; Jaros, J. Financial compass for Slovak Enterprises: Modeling economic stability of agricultural entities. J. Risk Financ. Manag. 2020, 13, 92. [Google Scholar] [CrossRef]
  50. Boettcher, J.; Cavanagh, G.; Xu, M. Ethical Issues that arise in bankruptcy. Bus. Soc. Rev. 2014, 119, 473–496. [Google Scholar] [CrossRef]
Figure 1. Spatial distribution of specialization indexes of convenio and liquidation by provinces.
Mathematics 09 00960 g001
Figure 2. Spatial specialization of activities in Spain by provinces.
Mathematics 09 00960 g002
Figure 3. Clusters map for province specialization.
Mathematics 09 00960 g003
Figure 4. Significance map (a) and cluster map (b) for Moran’s Local Bivariate Index for success and industrial specialization.
Mathematics 09 00960 g004
Figure 5. Significance map (a) and cluster map (b) for Moran’s Local Bivariate Index for liquidation and industrial specialization.
Mathematics 09 00960 g005
Figure 6. Significance map (a) and clusters map (b) for GDP per capita.
Mathematics 09 00960 g006
Figure 7. Significance and clusters maps for Moran’s Bivariant Index with Iag convenio and GDP per capita (a,b) and significance and clusters maps for Moran’s Bivariant Index with Iag liquidation and GDP per capita (c,d).
Mathematics 09 00960 g007
Figure 8. Industry distribution of bankruptcy outcomes.
Mathematics 09 00960 g008
Figure 9. Significance map (a) and cluster map (b) for manufacturing firms.
Mathematics 09 00960 g009
Figure 10. Maps of significance and clusters with Iag success for manufacturing firms (a,b) and maps of significance and clusters with Iag liquidation for manufacturing firms (c,d).
Mathematics 09 00960 g010
Figure 11. Significance and clusters maps for the variable business size large-medium (a,b) and significance and clusters maps for the variable business size small (c,d).
Mathematics 09 00960 g011
Figure 12. Significance map (a) and clusters map (b) for the variable employment level.
Mathematics 09 00960 g012
Figure 13. Significance map (a) and clusters map (b) for the variables Iag success and employment level.
Mathematics 09 00960 g013
Table 1. Specialization indexes by industry and province.
AGRIBUILSERVMANUIag IE
Álava0.640.500.721.974
Albacete3.310.840.840.831
Alicante0.601.150.970.553
Almería5.671.080.780.521
Asturias0.391.048.681.133
Ávila0.991.300.950.552
Badajoz3.220.910.860.661
Balears, Illes0.201.181.040.343
Barcelona0.170.760.911.093
Bizkaia0.081.300.871.084
Burgos0.971.060.711.744
Cáceres2.461.360.820.861
Cádiz1.060.850.910.891
Cantabria0.481.020.851.204
Castelló0.790.870.701.904
Ciudad Real3.541.070.751.091
Córdoba3.050.890.870.681
Coruña, A1.221.100.860.981
Cuenca4.981.060.730.881
Gipuzkoa0.181.010.811.444
Girona0.871.030.890.933
Granada2.291.000.940.451
Guadalajara1.130.900.781.434
Huelva2.390.970.781.201
Huesca4.540.890.731.041
Jaén3.720.910.840.691
León0.860.960.930.803
Lleida1.591.130.880.831
Lugo2.951.190.810.881
Madrid0.020.751.030.573
Málaga0.961.301.010.302
Murcia1.730.930.711.051
Navarra1.190.870.731.694
Ourense2.091.060.821.011
Palencia1.000.810.731.714
Palmas, Las0.370.811.050.393
Pontevedra1.571.030.821.131
Rioja, La1.840.890.741.514
S. Cruz de T.0.661.001.040.323
Salamanca1.460.890.940.651
Segovia1.451.590.860.762
Sevilla1.860.810.890.851
Soria1.451.120.771.334
Tarragona0.440.880.821.414
Teruel1.871.580.800.972
Toledo2.031.150.791.161
Valencia0.720.940.861.153
Valladolid0.800.730.841.324
Zamora1.861.460.860.721
Zaragoza1.350.850.821.244
Table 2. Bankruptcy outcome by province and industry.
Province AGRIBUIDSERVMANU
Álava 0.00%0.00%
Albacete 33.00%0.00%
Alicante−100.00%33.33%0.00%100.00%
Almería −100.00%−100.00%−33.33%
Asturias 75.00%100.00%50.00%
Ávila −100.00%0.00%
Badajoz −100.00%100.00%−100.00%
Balears, Illes100.00%−66.67%8.33%−50.00%
Barcelona 76.47%175.56%87.34%
Bizkaia 20.00%0.00%77.78%
Burgos 100.00%100.00%
Cáceres 100.00%100.00%
Cádiz −100.00%−100.00%0.00%
Cantabria 100.00%−100.00%33.33%
Castellón 0.00%0.00%33.33%
Ciudad Real −100.00%0.00%0.00%
Córdoba 0.00%0.00%−33.33%
Coruña, A 9.09%−93.33%0.00%
Cuencan/an/an/an/a
Gipuzkoa 100.00%−60.00%33.33%
Girona 33.33%100.00%50.00%
Granada −100.00%0.00%
Guadalajara 0.00%
Huelva −100.00%0.00%
Huesca 0.00%0.00%33.33%
Jaén 100.00%−100.00%
León−100.00%−45.45%−100.00%−45.45%
Lleida100.00% 100.00%
Lugo −100.00%0.00%20.00%
Madrid33.33%−15.79%−29.82%12.20%
Málaga −100.00%100.00%
Murcia100.00%−57.14%100.00%−45.45%
Navarra100.00% 100.00%100.00%
Ourense 100.00%100.00%100.00%
Palencia 33.33%33.33%0.00%
Palmas, Las 0.00%100.00%
Pontevedra100.00%100.00%100.00%100.00%
Rioja, La 100.00%−100.00%100.00%
S. Cruz de T. 60.00%133.33%0.00%
Salamanca100.00%50.00%−100.00%100.00%
Segovia −33.33%0.00%
Sevilla 81.82%−133.33%33.33%
Soria 0.00%100.00%
Tarragona 100.00%100.00%100.00%
Teruel 100.00%
Toledo 0.00%100.00%
Valencia100.00%−57.14%−98.46%−20.00%
Valladolid 100.00%0.00%33.33%
Zamoran/dn/dn/dn/d
Zaragoza 71.43%−66.67%42.86%
Publisher’s Note: MDPI stays neutral with regard to jurisdictional claims in published maps and institutional affiliations.

