Article

Emerging Economies’ Institutional Quality and International Competitiveness: A PLS-SEM Approach

by
Ricardo E. Buitrago R.
1,2,*,
María Inés Barbosa Camargo
3 and
Favio Cala Vitery
1
1
Facultad de Ciencias Naturales e Ingeniería, Universidad Jorge Tadeo Lozano, Bogotá 11001, Colombia
2
Escuela de Administración, Universidad del Rosario, Bogotá 11001, Colombia
3
Facultad de Ciencias Económicas y Sociales, Universidad de La Salle, Bogotá 11001, Colombia
*
Author to whom correspondence should be addressed.
Mathematics 2021, 9(9), 928; https://doi.org/10.3390/math9090928
Submission received: 28 February 2021 / Revised: 4 April 2021 / Accepted: 7 April 2021 / Published: 22 April 2021

Abstract

:
The home country’s institutional framework determines the capacity to compete in the global arena. This paper discusses the linkage between institutional quality (IQ) and international competitiveness (IC). We measured institutions’ quality in emerging economies through the use of selected indicators between 2007–2017. To evaluate the proposed IQ constructs and their relationship with IC, we applied partial least squares – structural equation modeling (PLS-SEM) analysis. The model outcomes suggest that political and lack of systemic conditions have a significant and negative effect on international competitiveness, while science, technology, engineering and mathematics (STEM) resource conditions have a significant and positive effect.

1. Introduction

This study is aimed to empirically explore the role of home country institutional quality on international competitiveness [1,2,3,4,5,6]. Past studies have used traditional econometric models and variables to measure institutions’ effect on international competitiveness [2]. To fill in gaps and expand previous studies, this paper analyzes the influence of different institutional conditions on emerging economies’ competitiveness. This paper selects several quantitative proxies to determine the institutional quality and its relationships in the process of international competition. We follow the partial least squares-structural equation modeling (PLS-SEM) method to conduct this analysis.
There are various measures of the concept of International Competitiveness. One is proposed by Sachs, focused on macro indicators defined as “the set of institutions and economic policies supportive of high rates of economic growth in the medium term.” Another, proposed by Porter, focused on microeconomic indicators to measure the “set of institutions, market structures, and economic policies supportive of high current levels of prosperity” [7]. A third approach looks at “the capability of firms engaged in value-added activities in a specific industry in a particular country to sustain this value-added over long periods in spite of international competition” [8] (p. 139). The last approach, proposed by the OECD (Organization for Economic Cooperation and Development), argues that “competitiveness is the degree to which a nation can, under free trade and fair market conditions, produce goods and services, which meet the test of international markets, while simultaneously maintaining and expanding the real income of its people over the long-term” [9].
Over the last decade, authors, reviewers, and editors have universally accepted PLS-SEM as a multivariate analysis method. A search in specialized data bases for the term “partial least squares path modeling” reveals that it has assisted researchers in empirically validating their theoretical project developments in various disciplines, such as accounting, family business, management information systems, operations management, supply chain, and many others [10,11,12,13,14].
According to the literature review, our paper is the first approach to study the interplay between institutional quality and international competitiveness in emerging economies using PLS-SEM. It also extends the use of PLS-SEM to the field of international business and international political economy by the use and combination of alternative data sources to explain the proposed constructs [2,15,16].
This paper is structured as follows. Section 2 briefly describes the literature review and hypothesis development. Section 3 details the methodological structure. Section 4 presents the results and discussion. Section 5 and Section 6 present the conclusions, contributions, limitations, and future research directions.

2. Literature Review and Hypothesis Development on Institutional Quality and International Competitiveness

The modern economy institutions must be taken into account when thinking about economic growth and prosperity. North [15] argues that consistent, dependable institutions are necessary for the modern economic system’s overall functioning. Institutions provide a defined legal system, a structured judicial system to enforce property rights and settle disputes, and a contracting and trading system that reduces firms’ transaction costs [15,16].
While some institutions are more mature than others, the majority of them are underdeveloped in emerging economies. Lack of institutional development in the country has been examined in the literature to be a cause of macroeconomic volatility and can be accounted for by the adverse effects on economic growth and prosperity [17,18,19,20,21].
North’s work [22] has been the basis for further studies that has influenced literature in growth, internationalization, and competitiveness. Another noteworthy contribution was the origin of the “institutional framework” construct that emerged in literature featured in the works of Acemoglu [17,18,19,23,24,25], which is understood to be the basis of economic transformation.
The institutional framework is determined by the quality of the institutions, both inclusive and extractive. Inclusive economic institutions create inclusive markets, while “extractive economic institutions are designed to extract incomes and wealth from one subset of society to benefit a different subset” [19].
On the other hand, the academic debate on international competitiveness focuses on the lack of a generally accepted theory on the roots of international competitiveness [26]. Summarizing the academic approaches to competitiveness:
-
Technology and production capacity are more important for economic growth than cost competitiveness [27].
-
International competitiveness boils down to the discussion on international trade [28].
-
International competitiveness is a matter of export performance with technological capacities [8,29,30,31,32,33,34,35].
-
International competitiveness is based on regulations and policy frameworks [36,37,38,39,40,41,42,43].
Graham and Naim [44] identified three types of institutional functions. The first is the development of rules and laws. Institutions that fall into this category are legislative, ministries, municipal councils, and related agencies. The second category of the institutional role is the application and award of rules and laws. The institutions involved here are tribunals, boards, control, and regulatory bodies. The third institutional role is the supply of public services. These are the institutions that guarantee the provision of different types of public goods and services.
There are many explanations for institutional quality that could be classified into three categories for analysis [44]:
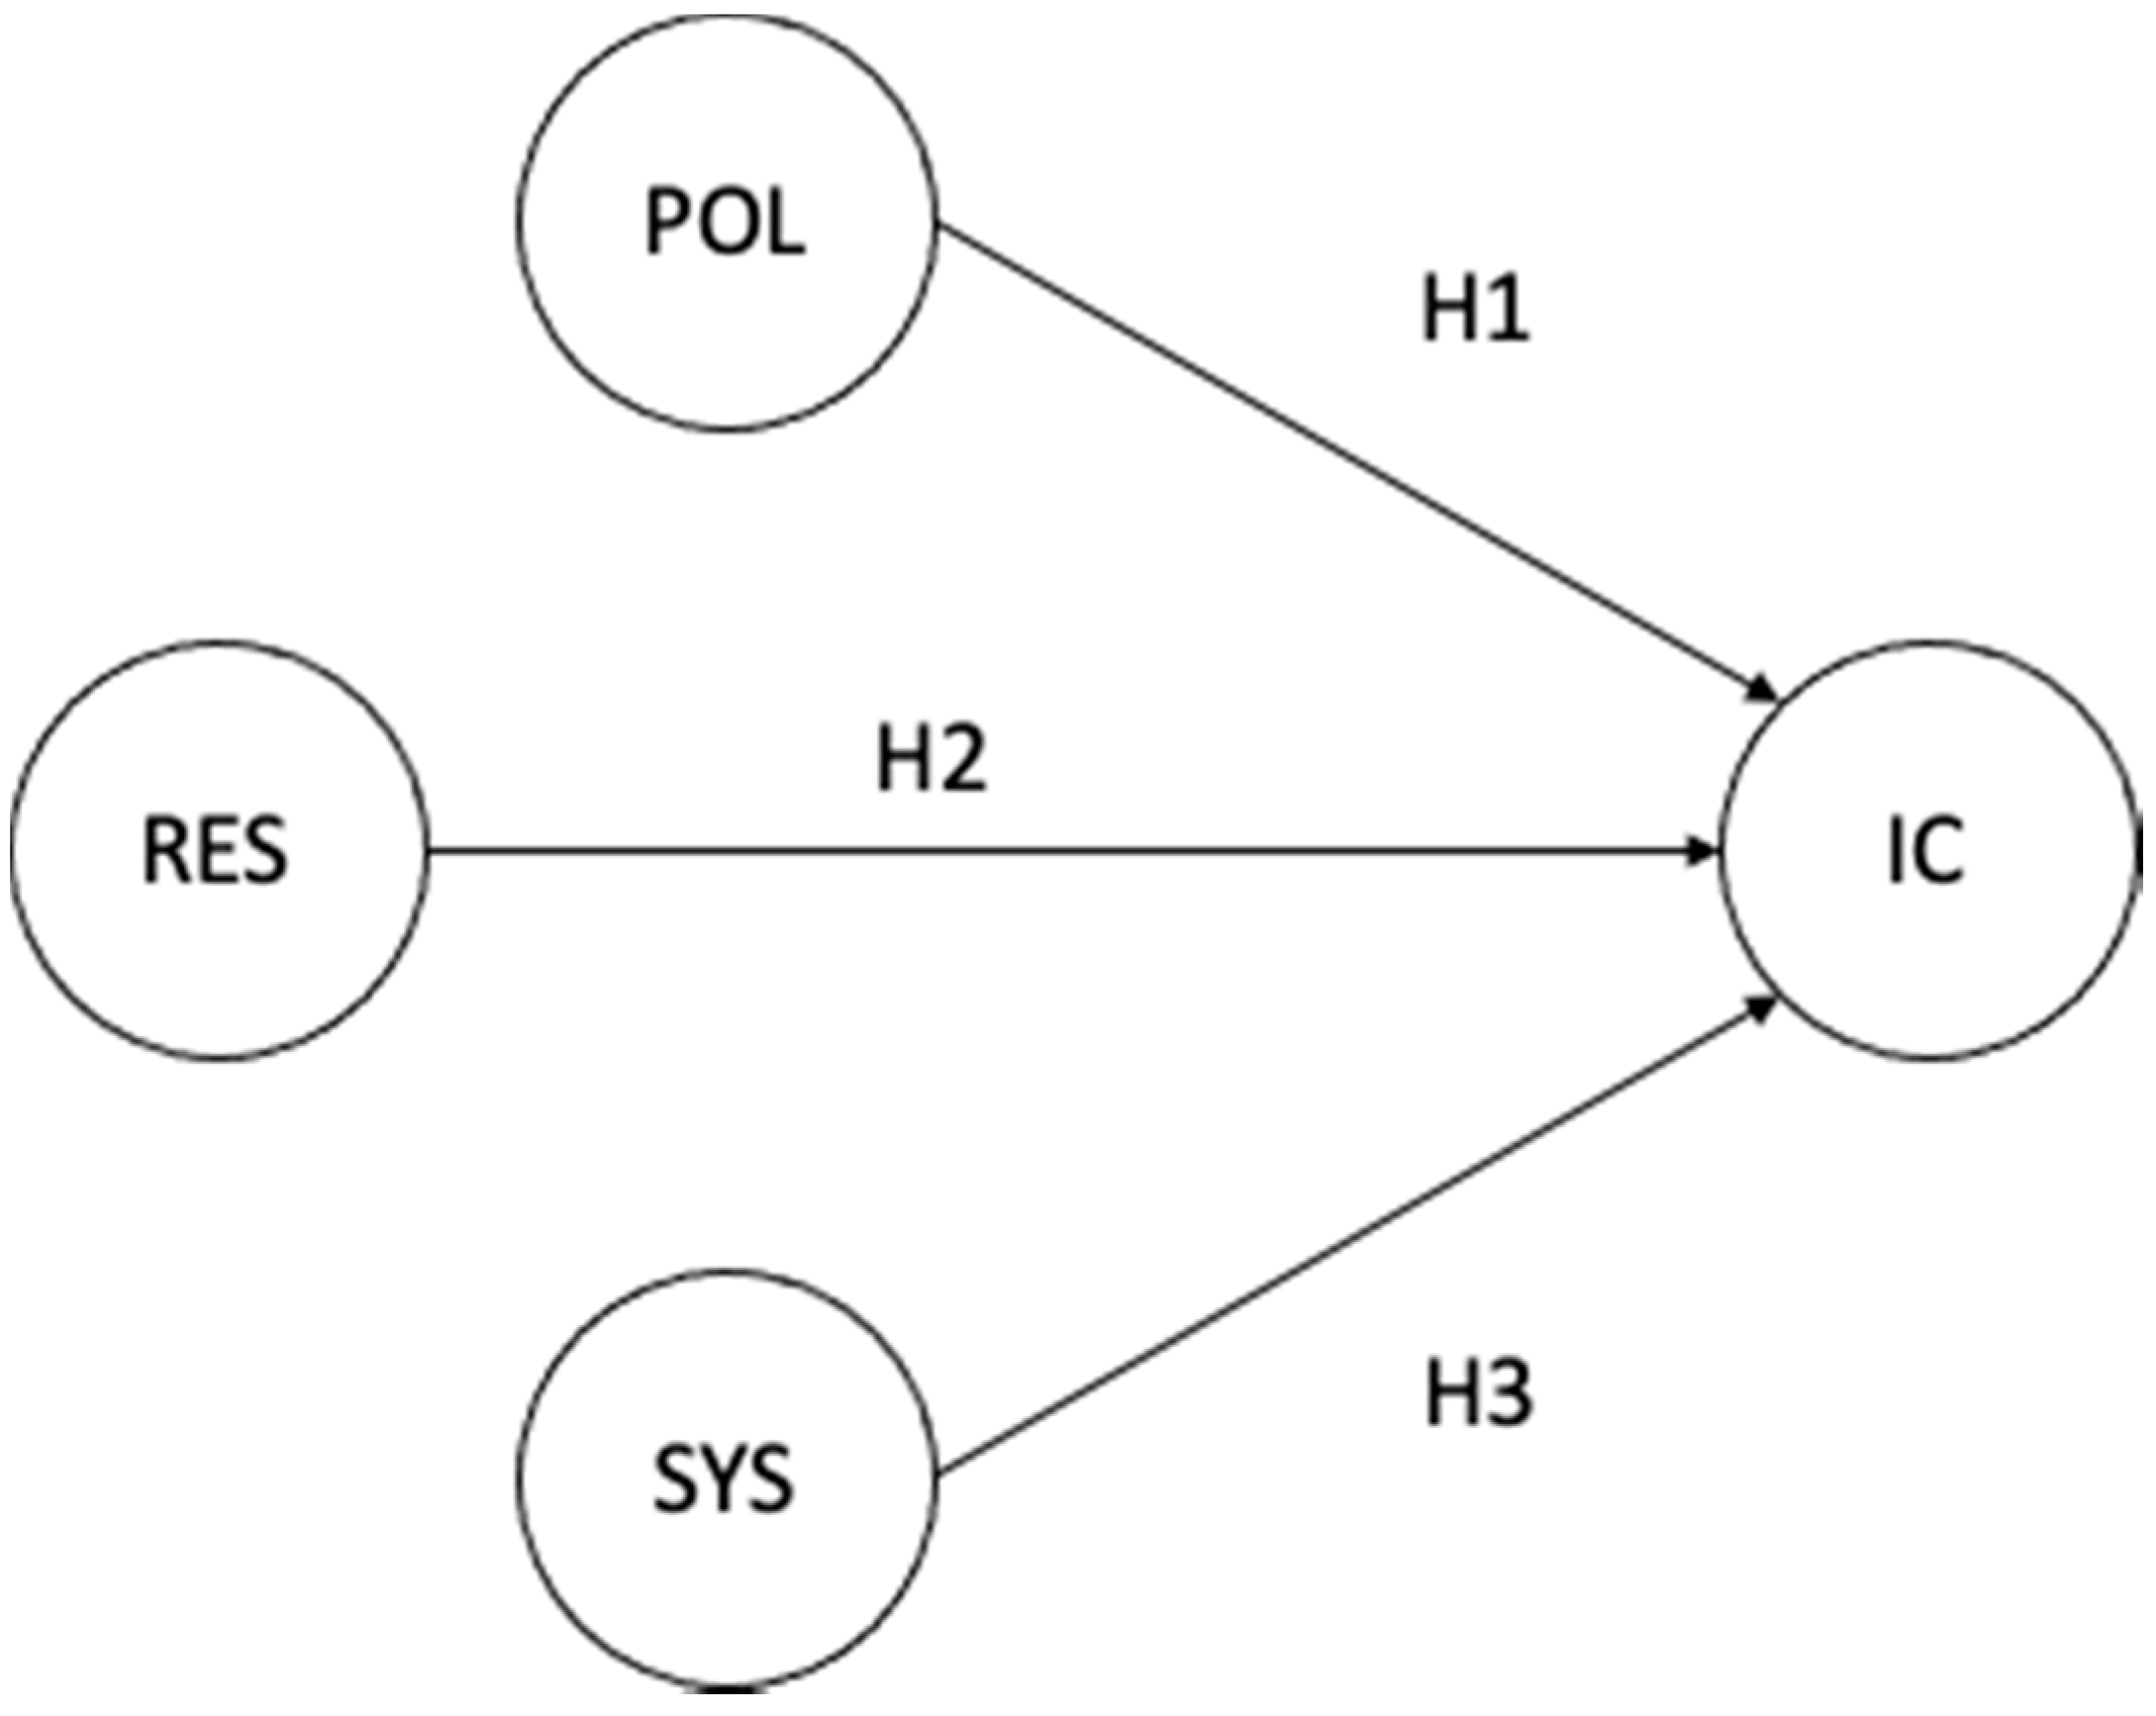
  • Resource conditions: related to the quantity, quality, and allocation of available resources.
  • Political conditions: related to co-optation, corruption, and politicization in the allocation of resources.
  • Systemic conditions: related to the clarity in setting long-term goals, the concentration of power in economic agents, and external state intervention.
Thus, we wanted to understand what the various institutional quality dimensions encourage international competitiveness and deter it. Due to the firm’s interaction with a wide range of stakeholders, including political and social actors, they are dependent on the institutional environment in which they operate. Regulatory and normative pressures exist in a business environment, which causes firms’ particular behavior [45,46]. Factors like government stability, political parties, predictability of the legal system, and contractual enforcement determine economic outcomes and internationalization [47,48,49,50,51]. The above arguments lead to our first hypothesis.
Hypothesis 1 (H1).
A lower degree of political conditions has a negative effect on international competitiveness.
Porter [41] identifies the nation’s competitive advantage due to the quality of endogenous variables like demand conditions, complementary industries, strategy, structure, and rivalry. The country’s competitiveness is determined by resource allocation, including human capital, that helps create economic development.
The pace of economic growth is highly dependent on innovation [52]. Economic progress is made possible through technological innovation and development. New or improved technology can be developed through invention and innovation and foreign technology absorption. Allowing for such technological advances requires adequate institutions and policies to support them. It means that an economy’s competitiveness relies on how well government policy can support it [53]. The nature and pace of economic growth depend on the degree of institutions and systemic factors that support technological advancements [54,55].
Technology and human capital are interdependent, inseparable, and essential. A large part of technological progress is a result of investing in human capital. In the absence of skilled workers, machines, tools, scientific instruments, the legal system, financial system, and most modern society would not function. To develop more technology, it is necessary to create and maintain skilled employees. To better utilize technology and human capital, society needs technical and business skills [56,57]. Hence, we propose the next hypothesis.
Hypothesis 1 (H2).
Science, technology, engineering, and mathematics (STEM) resources enhance international competitiveness.
Individual property rights and property-based capitalism are vital elements to entrepreneurship. As private property becomes less prevalent or concentrated in a small elite’s hands, it becomes more extractive and undermines broader economic growth [17,58]. Political restraint leads to a pattern of captured democracy in which the game’s rules favor the elite [59].
A country’s legal infrastructure’s capacity to resolve disputes and enforce contracts motivates firms to rely on it [60]. For Kramer [61], rules are based on the ability to predict institutional action. “At the country-level, trust in country’s laws is reflected in confidence in their country’s legal system” [62,63]. Based on the specific application, rule-based trust is expected to reduce transaction costs and guide organizational strategic choices [64,65]. We, thus, hypothesize that:
Hypothesis 1 (H3).
Lack of structural systemic conditions have a negative effect on international competitiveness.

3. Methodology

The problem intended to analyze is the institutional framework and how it affects international competitiveness. International competitiveness is affected when a country’s “rules of the game” generate present and future uncertainty and question the economy’s perceived potential productive capacity.
The aim is to analyze the period of 2007–2017 in 48 emerging economies given the changes in these regions’ institutional conditions during that period (see Table 1). The selected countries are classified as emerging economies because they are moving from an informal institutional system to a more formal structure with rules of the game that are transparent and apply equally to all participants in the market. Besides, they often experience faster economic growth as measured by gross domestic product (GDP) and improvement in infrastructure and market conditions. However, there is still a higher risk due to political instability, domestic infrastructure problems, currency volatility, and limited equity opportunities.
We propose three latent variables: political (POL), resources (RES), and systemic conditions (SYS), to measure institutional quality and its impact in a fourth latent variable named international competitiveness (IC). Figure 1 shows the basic model.

3.1. Sources and Measures

To test the proposed hypotheses, alternative reliable secondary data sources were utilized [2]. We collected indicators from the Fragile States Index (FSI) [66], from the Global Competitiveness Index (GCI) [67], from the International Country Risk Guide (ICRG) [68], and from the Index of Economic Freedom (IEF) [69]. Table 2 summarizes the structure and scales of each source.
A country’s productive structure results from its level of social capital and the quality of its institutions. Research has shown that the complexity and the diversity of products a nation exports are a reliable indicator of the resources available in the economy. Complex products require a great deal of tacit knowledge and entail more distributed knowledge than those produced with a product based on resource richness or low labor costs [31,70,71,72]. In a world where economic power is indicative of political power, economies characterized by narrow resource endowment are more susceptible to capture due to economic and political corruption. Hence, we selected the economic complexity index (ECI) (http://atlas.cid.harvard.edu, accessed on 12 January 2021), developed by Hausmann and Hidalgo [73] as the proxy to measure international competitiveness (IC).

3.2. Constructs and Indicators

From the mentioned sources, we selected specific indicators related to the meaning of the proposed constructs. In Table 3, we describe each construct’s composition. Table A1 shows the descriptions of the indicators.

3.3. Method

The study opted for structural equation modeling (SEM) because of its ability to model all paths at once. We choose Partial Least Square (PLS-SEM) instead of covariance-based (CB-SEM) for the following reasons: (1) PLS has minimal restrictions on measurement scales, sample size, and residual distributions, (2) PLS analysis does not assume that the variables are truly independent, leading to more reliable results, and (3) PLS is robust against data skewness and omitting an independent variable [11,74,75,76,77,78,79,80,81].
The literature regarding international business research shows the increasing complexity in the research problems and models observed due to the contemporary interaction between established theories and data availability [82,83,84]. PLS-SEM is regarded as one of the most innovative approaches in international fields that are very difficult to understand. The method proves particularly valuable for exploratory purposes and is considered proper to explain intricate relationships, like those arising from institutions and global competition [85,86].
Data were assessed using SmartPLS [87] to help determine the relationship between the latent variables POL, RES, and SYS as indicators of institutional quality and their impact on international competitiveness (IC).
Variables have been modeled as reflective constructs since the indicators are expected to covary with each other. The indicators share the same theme in the reflective model. Therefore, indicators must have the same antecedents and consequences [88,89].

Model Specification

Our model consists of 16 indicators (X1, X2, X3, …, X16) and four latent variables (Y1, Y2, Y3, Y4). Latent variables Y1, Y2, Y3 influence Y4, and the measurement model is specified as follows:
X 1 = Y 1 C 1 + ε 1
X 2 = Y 1 C 2 + ε 2
X 3 = Y 1 C 3 + ε 3
X 4 = Y 1 C 4 + ε 4
X 5 = Y 1 C 5 + ε 5
X 6 = Y 2 C 6 + ε 6
X 7 = Y 2 C 7 + ε 7
X 8 = Y 2 C 8 + ε 8
X 9 = Y 2 C 9 + ε 9
X 10 = Y 2 C 10 + ε 10
X 11 = Y 2 C 11 + ε 11
X 12 = Y 3 C 12 + ε 12
X 13 = Y 3 C 13 + ε 13
X 14 = Y 3 C 13 + ε 13
X 15 = Y 3 C 15 + ε 15
X 16 = Y 4 C 16 + ε 16
In our model, X’s are the indicators, Y’s are the latent variables, C’s are the loadings that relate latent variables to indicators, and ε’s are the residuals of indicators that are unexplained. All indicators are considered reflective in our measurement model because each is assumed to affect the corresponding latent variable. As a result, all endogenous variables are observed.
The measurement model can be generally written as follows:
X = CY + ε
In the measurement (outer) model, X is a J by 1 vector of all indicators, Y is a P by 1 vector of all latent variables, C is a P by the J matrix of loadings relating P latent variables to J indicators, and ε is a J by 1 vector of the residuals of all indicators. In our model, J and P are equal to 16 (indicators) and 4 (latent variables), respectively.
The proposed structural (inner) model expresses the relationships among latent variables and can be expressed as follows:
Y 4 = Y 1 β 1 + Y 2 β 2 + Y 3 B 3 + ζ 4
where β ’s are path coefficients relating a latent variable to other latent variables and ζ ’s are the residuals of the latent variable left unexplained by the corresponding exogenous latent variables. In the model, Y1, Y2, and Y3 are exogenous, whereas Y4 is endogenous.
The above model can be expressed as:
Y = B Y + ζ
In the structural model, B is a P-by-P matrix of path coefficients relating P latent variables among themselves, and ζ is a P by 1 vector of the residuals of all latent variables.
The weighted relation for the proposed model is as follows:
Y 1 = X 1 w 1 + X 2 w 2 + X 3 w 3 + X 4 w 4 + X 5 w 5
Y 2 = X 6 w 6 + X 7 w 7 + X 8 w 8 + X 9 w 9 + X 10 w 10 + X 11 w 11
Y 3 = X 12 w 12 + X 13 w 13 + X 14 w 14 + X 15 w 15
Y 4 = X 16 w 16
In the weighted relation model, W is a J by the P matrix of weights assigned to J indicators, which, in turn, lead to P latent variables. This can be rewritten compactly as:
Y = WX
In sum, generalized, structured component analysis involves three sub-models taking the general forms as follows:
Measurement model   X = CY + ε
Structural model    Y = B′Y + ζ
Weighted model   Y = WX
where:
  • X is a J by 1 vector of indicators
  • Y is a P by 1 vector of latent variables
  • C is a P by J matrix of loadings
  • B is a P by P matrix of path coefficients
  • W is a J by P matrix of component weights
  • ε is a J by 1 vector of the residuals of indicators
  • ζ is a P by 1 vector of the residuals of latent variables

3.4. Assessment of the Measurement Model

PLS bootstrapping with 10,000 samples [11,12,85] was used to assess the statistical significance of the model. The results of the PLS-SEM analysis are shown in Figure 2. The model tested their reliability and validity and measured the level of consistency of their scores. The indicators are all highly correlated with their intended constructs. The construct indicators were nearly all above the cutoff score of 0.708, proving that all of them represented the construct [77,79,80,81,89].
To assess internal consistency, Cronbach’s alpha and Heterotrait-Monotrait Ratio (HTMT) composite reliability were used [90]. Cronbach’s Alpha coefficients ranged from 0.838 to 1.000. All scores were greater than the minimum score of 0.7. The Rho A also exceeded that value. The composite reliability was over 0.7 and passed a minimum level of adequacy. This has shown that there is consistency within the data. Results of average variance extracted (AVEs) were greater than the suggested minimum of 0.5 (see Table 4) [11,74,75,76,77,79,80,81].
We also examined the discriminatory validity of the constructs using the Heterotrait-Monotrait Ratio (HTMT). The values were below 0.85, which shows adequate discriminatory validity [90,91] (see Table 5).
Complementary information about the measurement model is shown in Table A1: Indicators descriptive statistics, Table A2: Mean, STDEV (Standard Deviation), T-Values, p-Values, confidence intervals, Table A3: Outer Loadings-Mean, STDEV, T-Values, p-Values, Confidence Intervals, and Table A4: Outer VIF Values.

3.5. Assessment of the Structural Model

For the structural model, inner VIF (Variance Inflation Factor) values are examined. The results are below the recommended threshold of 3.3 [92,93]. Additionally, path coefficients are statistically significant at 95%.
Regarding the predictive accuracy, coefficient of determination (R2), the exogenous constructs (POL, RES, SYS) explain 41% of the endogenous construct (IC), which is considered a moderated effect [94,95]. Q2 statistics are used to measure the PLS path model’s quality. This criterion recommends that the conceptual model predicts the endogenous latent constructs. In our model, the value for IC is 0.404. The values greater than zero for a particular endogenous latent construct are considered relevant [75]. Assessing the effect sizes (f2) shows that the effect size of POL (0.019) is small, RES (0.144) is moderate, and SYS (0.284), as shown in Table 5, is substantial [75,96].

4. Discussion of Findings

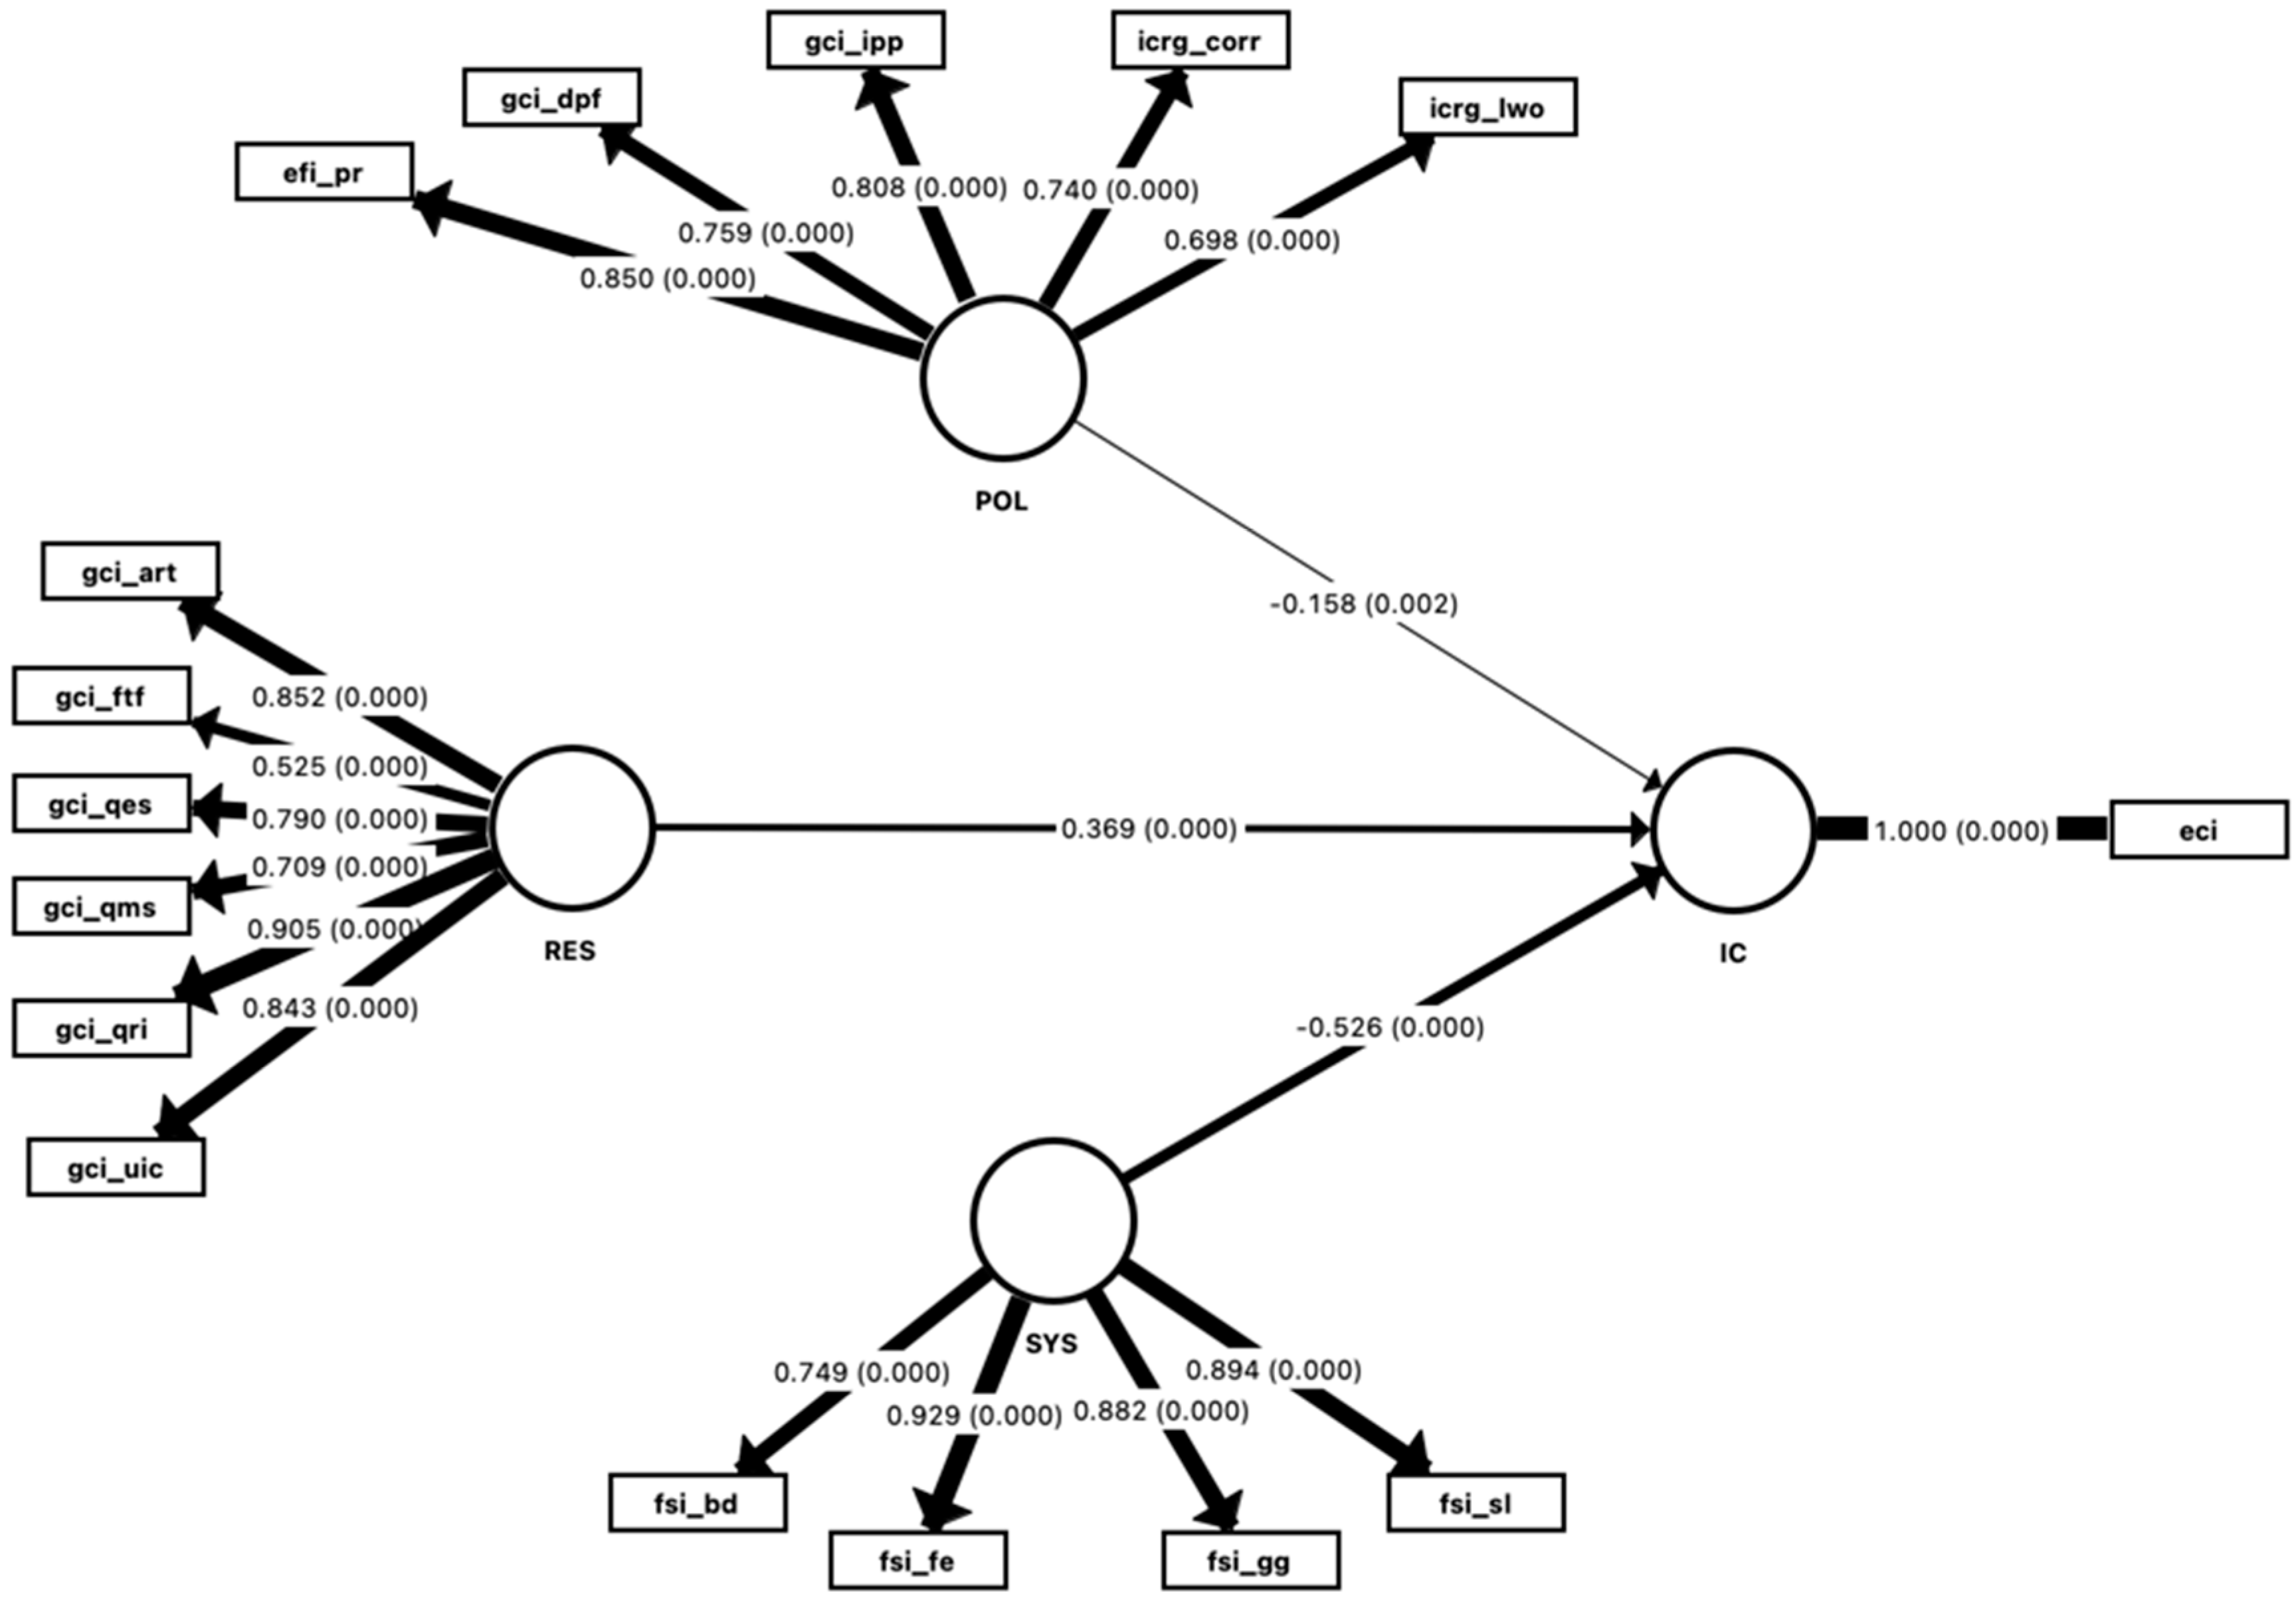
To evaluate the paths’ importance, the validity of the measures was assessed based on the path coefficients and the significance of the path coefficients, and the significance level. The resulting p-values were obtained using SmartPLS by using a bootstrapping process and calculating the p-value of different paths. Path coefficients and significance levels have been determined by randomly sampling 10.000 instances into the model. The results are shown in Table 6 and are supported by Figure 3.
Figure 3 shows the results of the outer model in factor loadings and p-values, and the inner model in path coefficients and p-values. The size of the arrows represents the absolute value of each path. As mentioned before, indicators are significant for each construct. In Table 5, we summarize the results for each proposed hypothesis.
Our findings are in line with the evidence from the literature that suggests that political conditions (POL) may harm the way countries compete in the international arena [19,97,98,99,100,101,102,103]. In the case of the analyzed emerging economies, property rights, diversion of public funds, intellectual property protection, corruption, and law and order negatively affect international competitiveness. All the indicators measured are relevant, but the higher loads are in those related to property rights and corruption. Our analysis also shows that an adequate scientific and technological framework (RES) enhances the emerging economies’ international competitiveness [104,105,106,107]. The endowment of research and training services, FDI, and technology transfer, quality of the education system, quality of STEM education, quality of research and scientific institutions, and university-industry collaboration are essential factors to compete internationally. In this case, the more relevant indicators are the quality of research and scientific institutions, availability of research and training services, and university-industry collaboration.
Systemic conditions deter international competitiveness. Structural extractive frameworks impede the development of conditions required for an adequate global competition insertion [108,109,110,111]. Emerging economies are constrained by brain drain, groups of grievance, factionalized elites, and state legitimacy, as shown in this study’s results. The loadings in this construct show the relevance of factionalized elites and state legitimacy in the structural systemic conditions to compete.

5. Conclusions

Research in this field is challenging because the frequent changes in the research context and the significant shifts in formal and informal institutional environments in emerging economies require alternative analysis methods. PLS-SEM exploratory modeling can handle complex models and relaxes the demands on data and relationships’ specification, making it very useful for this study.
The proposed model using SEM-PLS to estimate and evaluate the correlation between selected indicators and the proposed constructs to measure institutional quality shows that the independent latent variables explain a significant proportion of the dependent construct’s variability.
The analysis shows that political conditions could harm emerging economies’ ability to compete with complex products in the international market. As shown in Table A1, the median value of the proposed indicators is slightly inclined to low performance, which allows us to infer that a lower quality of political conditions harms the ability to compete internationally with complex products. The indicator that has the most negative effect is property rights, which is coherent. If the firms’ knowledge is not protected, innovation and productive transformation are not encouraged. In the same path, the indicator with a less adverse effect is the diversion of public funds because it affects the competitive environment.
It is also evident that the STEM resources have slightly good performance, which confirms that an adequate infrastructure for science, technology, engineering, and mathematics fosters the countries’ ability to develop more complex products. In this construct, the quality of the education system somewhat contributes to the economic complexity. The quality of research institutions is the most critical indicator of the economic complexity to compete internationally.
Finally, extractive systemic conditions, which means the state’s capture by elites and delegitimization of the state, are critical impediments to compete for global markets. In this construct, state legitimacy has the worst impact. If the market cannot believe in the state, it will not be possible to transform the productive structure. Although the group of grievance indicator has a lesser negative effect, it is also a condition that harms the effective transformation required for more economic complexity.
The model results, analyzed employing the PLS-SEM method, confirm the literature findings regarding the institutional framework’s role, measured by political, resources, and systemic conditions. This paper demonstrates the importance of institutions in fostering the competitive economic strength of emerging economies.
A way of action could be the strengthening of regulations to increase the property rights protection and control of the investment of public funds. This could lead to a better perception of the state’s legitimacy, which would promote the research and development through the participation of different stakeholders, including academia, civil society, and research institutions.

6. Contributions and Limitations of This Study

This study contributes in various ways to the existing literature. First, it sheds light on the importance of analyzing the political conditions in emerging economies to compete in the global markets. Second, it highlights the negative effect of extractive systemic conditions on international competitiveness. Third, it confirms the importance of STEM resources to generate complex products to compete internationally. Finally, it shows the deployment of an alternative method to evaluate the intricate relationships between institutional quality and international competitiveness. PLS-SEM allowed us to explore emerging economies’ conditions even under the limitations described below.
A limitation of the current study is the small number of observations (528) divided into five distinct regions. Another limitation of the research is that it only focused on a few selected indicators according to the literature reviewed. This research’s limitations could be overlooked in the future by adding more constructs, variables, and observations. The paper can be enriched by adding intra-regional and inter-regional approaches to control by the occurrence of particular circumstances (i.e., informal institutions or economic development).

Author Contributions

Conceptualization, R.E.B.R. Methodology, R.E.B.R. Software, R.E.B.R. Validation M.I.B.C. and F.C.V. Formal analysis, R.E.B.R. and M.I.B.C. Writing—original draft preparation, R.E.B.R. Writing—review and editing, R.E.B.R., M.I.B.C., and F.C.V. Supervision, M.I.B.C. and F.C.V. All authors have read and agreed to the published version of the manuscript.

Funding

This research received no external funding.

Institutional Review Board Statement

Not applicable.

Informed Consent Statement

Not applicable.

Data Availability Statement

Restrictions apply to the availability of these data.

Conflicts of Interest

The authors declare no conflict of interest.

Appendix A

Table A1. Indicators descriptive statistics.
MeanMedianMinMaxStandard DeviationExcess KurtosisSkewnessNumber of Observations
eci0.1130.124−2.7641.6950.7500.312−0.298528
efi_pr44.06840.0005.00090.00017.4680.1350.388528
fsi_bd5.3785.2002.1008.5001.541−0.9420.126528
fsi_fe6.1086.5001.10010.0002.169−0.846−0.286528
fsi_gg6.3616.3003.00010.0001.785−0.9590.111528
fsi_sl6.3026.5001.6009.5001.742−0.737−0.399528
gci_art4.1514.1492.3406.0840.5830.705−0.150528
gci_dpf3.2993.1571.2196.6030.9381.2391.000528
gci_ftf4.6984.7542.4776.0920.5870.203−0.393528
gci_ipp3.6313.6001.6296.1600.8330.2560.503528
gci_qes3.6093.5542.0925.8810.7250.2670.509528
gci_qms3.9864.1251.8766.0820.891−0.798−0.252528
gci_qri3.9013.8772.1785.9340.647−0.0070.310528
gci_uic3.5603.4792.0725.4720.6140.2610.462528
icrg_corr2.4372.5000.5004.5000.6681.0520.469528
icrg_lwo3.5354.0001.0005.0001.039−0.857−0.382528
Source: Results from SmartPLS software 3.3.3.
Table A2. Mean, STDEV, T-Values, p-Values, confidence intervals.
Original Sample (O)Sample Mean (M)Standard Deviation (STDEV)T Statistics (|O/STDEV|)p ValuesCI 2.5%CI 97.5%
LowerUpper
POL- > IC−0.158−0.1540.0523.0350.002−0.257−0.054
RES- > IC0.3690.3680.0477.8580.0000.2750.459
SYS- > IC−0.526−0.5240.03913.6220.000−0.600−0.448
Source: Results from SmartPLS software 3.3.3.
Table A3. Outer Loadings: Mean, STDEV, T-Values, p-Values, confidence intervals.
Original Sample (O)Sample Mean (M)Standard Deviation T Statisticsp ValuesCI 2.5%CI 97.5%
LowerUpper
eci < -IC110 11
efi_pr < -POL0.850.850.01460.12200.8210.877
fsi_bd < -SYS0.7490.7490.01938.82500.710.784
fsi_fe < -SYS0.9290.9290.008121.24500.9120.942
fsi_gg < -SYS0.8820.8820.01176.92700.8570.902
fsi_sl < -SYS0.8940.8940.008105.73800.8760.909
gci_art < -RES0.8520.8510.01363.76700.8230.875
gci_dpf < -POL0.7590.7550.03621.2900.6770.816
gci_ftf < -RES0.5250.5240.04212.52300.4350.6
gci_ipp < -POL0.8080.8060.02630.72100.7470.849
gci_qes < -RES0.790.7870.02532.21700.7350.831
gci_qms < -RES0.7090.7080.02824.92400.6490.761
gci_qri < -RES0.9050.9050.008119.8900.8890.918
gci_uic < -RES0.8430.8430.01556.11300.8110.87
icrg_corr < -POL0.740.7380.03223.27100.670.794
icrg_lwo < -POL0.6980.6970.02923.85500.6360.75
Source: Results from SmartPLS software 3.3.3.
Table A4. Outer VIF values.
VIF
eci1.000
efi_pr1.995
fsi_bd1.464
fsi_fe7.036
fsi_gg4.096
fsi_sl3.700
gci_art2.674
gci_dpf2.690
gci_ftf1.317
gci_ipp2.857
gci_qes3.226
gci_qms2.751
gci_qri3.460
gci_uic3.419
icrg_corr1.715
icrg_lwo1.475
Source: Results from SmartPLS software 3.3.3.

References

  1. Mihailova, I.; Panibratov, A.; Latukha, M. Dismantling institutional complexity behind international competitiveness of emerging market firms. Thunderbird Int. Bus. Rev. 2020, 62, 77–92. [Google Scholar] [CrossRef]
  2. Buitrago R., R.E.; Barbosa Camargo, M.I. Institutions, institutional quality, and international competitiveness: Review and examination of future research directions. J. Bus. Res. 2021, 128, 423–435. [Google Scholar] [CrossRef]
  3. Buitrago R., R.E.; Barbosa Camargo, M.I. Home country institutions and outward fdi: An exploratory analysis in emerging economies. Sustainability 2020, 12, 10010. [Google Scholar] [CrossRef]
  4. Xu, K.; Hitt, M.A.; Brock, D.; Pisano, V.; Huang, L.S.R. Country institutional environments and international strategy: A review and analysis of the research. J. Int. Manag. 2021, 27, 100811. [Google Scholar] [CrossRef]
  5. Zhu, H.; Ma, X.; Sauerwald, S.; Peng, M.W. Home Country Institutions behind Cross-Border Acquisition Performance. J. Manag. 2019, 45, 1315–1342. [Google Scholar] [CrossRef]
  6. Sun, S.L.; Peng, M.W.; Lee, R.P.; Tan, W. Institutional open access at home and outward internationalization. J. World Bus. 2015, 50, 234–246. [Google Scholar] [CrossRef] [Green Version]
  7. Porter, M.E.; Sachs, J.D.; Schwab, K. Global Competitiveness Report 2001–2002; Oxford University Press: Oxford, UK, 2002; ISBN 019521837X. [Google Scholar]
  8. Moon, H.C.; Rugman, A.M.; Verbeke, A. A generalized double diamond approach to the global competitiveness of Korea and Singapore. Int. Bus. Rev. 1998, 7, 135–150. [Google Scholar] [CrossRef]
  9. OECD. Technology and the Economy: The Key Relationships; OECD: Paris, France, 1992. [Google Scholar]
  10. Lee, L.; Petter, S.; Fayard, D.; Robinson, S. On the use of partial least squares path modeling in accounting research. Int. J. Account. Inf. Syst. 2011, 12, 305–328. [Google Scholar] [CrossRef]
  11. Hair, J.; Sarstedt, M.; Pieper, T.M.; Ringle, C.M. The Use of Partial Least Squares Structural Equation Modeling in Strategic Management Research: A Review of Past Practices and Recommendations for Future Applications. Long Range Plan. 2012, 45, 320–340. [Google Scholar] [CrossRef]
  12. Hair, J.F.; Astrachan, C.B.; Moisescu, O.I.; Radomir, L.; Sarstedt, M.; Vaithilingam, S.; Ringle, C.M. Executing and interpreting applications of PLS-SEM: Updates for family business researchers. J. Fam. Bus. Strateg. 2020. [Google Scholar] [CrossRef]
  13. Peng, D.X.; Lai, F. Using partial least squares in operations management research: A practical guideline and summary of past research. J. Oper. Manag. 2012, 30, 467–480. [Google Scholar] [CrossRef]
  14. Kaufmann, L.; Gaeckler, J. A structured review of partial least squares in supply chain management research. J. Purch. Supply Manag. 2015, 21, 259–272. [Google Scholar] [CrossRef]
  15. North, D.C. The New Institutional Economics. J. Inst. Theor. Econ. 1986, 142, 230–237. [Google Scholar]
  16. North, D.C. Institutional Change: A Framework of Analysis. In Institutional Change: Theory and Empirical Findings; Routledge: London, UK, 1993; pp. 35–46. [Google Scholar]
  17. Acemoglu, D.; Johnson, S.; Robinson, J.A. The Colonial Origins of Comparative Development: An Empirical Investigation. Am. Econ. Rev. 2001, 91. [Google Scholar] [CrossRef]
  18. Acemoglu, D.; Johnson, S.; Robinson, J.A. Institutions and economic development. Financ. Dev. 2003, 3, 2301–2370. [Google Scholar]
  19. Acemoglu, D.; Robinson, J.A. Why Nations Fail: The Origins of Power, Prosperity and Poverty; Crown Publishers: New York, NY, USA, 2012. [Google Scholar]
  20. Hnatkovska, V.; Loayza, N. Volatility and Growth. In Managing Economic Volatility and Crises: A Practitioner’s Guide; Aizenman, J., Pinto, B., Eds.; Cambridge University Press: Cambridge, UK, 2005; pp. 65–100. ISBN 9780511510755. [Google Scholar]
  21. Ramey, G.; Ramey, V.A. Cross-Country Evidence on the Link between Volatility and Growth. Am. Econ. Rev. 1995, 85, 1138–1151. [Google Scholar]
  22. North, D.C. Institutions, Institutional Change and Economic Performance; Cambridge University Press: Cambridge, UK, 1990; ISBN 9780521397346. [Google Scholar]
  23. Acemoglu, D.; Johnson, S.; Robinson, J.A. Reversal of fortune: Geography and institutions in the making of the modern world income distribution. Q. J. Econ. 2002, 117, 1231–1294. [Google Scholar] [CrossRef] [Green Version]
  24. Acemoglu, D.; Johnson, S.; Robinson, J.A. Chapter 6 Institutions as a Fundamental Cause of Long-Run Growth. In Handbook of Economic Growth; Elsevier: Amsterdam, The Netherlands, 2005; Volume 1, pp. 385–472. ISBN 9780444520418. [Google Scholar]
  25. Acemoglu, D.; Johnson, S. Unbundling Institutions. J. Political Econ. 2005, 113, 949–995. [Google Scholar] [CrossRef] [Green Version]
  26. Anca, H.D.B. Literature review of the evolution of competitiveness concept. Ann. Univ. Oradea Econ. Sci. 2012, 21, 41–46. [Google Scholar]
  27. Fagerberg, J. International competitiveness. Econ. J. 1988, 98, 355–374. [Google Scholar] [CrossRef]
  28. Krugman, P.R. Competitiveness: A Dangerous Obsession. Foreign Aff. 1994, 73, 28. [Google Scholar] [CrossRef]
  29. Balassa, B. Trade Liberalisation and “Revealed” Comparative Advantage. Manch. Sch. 1965. [Google Scholar] [CrossRef]
  30. Ito, K.; Pucik, V. R&D spending, domestic competition, and export performance of Japanese manufacturing firms. Strateg. Manag. J. 1993, 14, 61–75. [Google Scholar] [CrossRef]
  31. Hausmann, R.; Hwang, J.; Rodrik, D. What You Export Matters. J. Econ. Growth 2007, 12, 1–25. [Google Scholar] [CrossRef]
  32. Costantini, V.; Mazzanti, M. On the green and innovative side of trade competitiveness? The impact of environmental policies and innovation on EU exports. Res. Policy 2012, 41, 132–153. [Google Scholar] [CrossRef]
  33. Freeman, C. Technological infrastructure and international competitiveness. Ind. Corp. Chang. 2004, 13, 541–569. [Google Scholar] [CrossRef]
  34. Amable, B.; Verspagen, B. The role of technology in market shares dynamics. Appl. Econ. 1995. [Google Scholar] [CrossRef]
  35. Amendola, G.; Dosi, G.; Papagni, E. The dynamics of international competitiveness. Weltwirtsch. Arch. 1993. [Google Scholar] [CrossRef]
  36. Ervits, I.; Zmuda, M. A cross-country comparison of the effects of institutions on internationally oriented innovation. J. Int. Entrep. 2018, 16, 486–503. [Google Scholar] [CrossRef]
  37. Guerrieri, P.; Meliciani, V. International Competitiveness in Producer Services. 2004. Available online: https://papers.ssrn.com/sol3/papers.cfm?abstract_id=521445 (accessed on 12 January 2021).
  38. Hollingsworth, J.R. Doing institutional analysis: Implications for the study of innovations. Rev. Int. Political Econ. 2000, 7, 595–644. [Google Scholar] [CrossRef]
  39. Ingram, P.; Silverman, B.S. Introduction: The new institutionalism in strategic management. In The New Institutionalism in Strategic Management; Emerald (MCB UP): Bingley, UK, 2002; Volume 19, pp. 1–30. ISBN 978-0-7623-0903-0. [Google Scholar]
  40. Peng, M.W.; Wang, D.Y.L.L.; Jiang, Y. An institution-based view of international business strategy: A focus on emerging economies. J. Int. Bus. Stud. 2008, 39, 920–936. [Google Scholar] [CrossRef] [Green Version]
  41. Porter, M.E. Competitive Strategy; Free Press: New York, NY, USA, 1990; ISBN 0029253608. [Google Scholar]
  42. Porter, M.E.; Van der Linde, C. Toward a new conception of the environment-competitiveness relationship. J. Econ. Perspect. 1995, 9, 97–118. [Google Scholar] [CrossRef]
  43. Wan, W.P.; Hoskisson, R.E. Home country environments, corporate diversification strategies, and firm performance. Acad. Manag. J. 2003, 46, 27–45. [Google Scholar] [CrossRef]
  44. Graham, C.; Naim, M. The political economy of institutional reform in Latin America. In Beyond Tradeoffs: Market Reforms and Equitable Growth in Latin America; Birdsall, N., Graham, C., Sabot, R.H., Eds.; Brookings Institution Press: Washington, DC, USA, 1998; p. 376. [Google Scholar]
  45. North, D.C. A transaction cost theory of politics. J. Theor. Polit. 1990, 2, 355–367. [Google Scholar] [CrossRef]
  46. Peng, M.W.; Heath, P.S. The growth of the firm in planned economies in transition: Institutions, organizations, and strategic choice. Acad. Manag. Rev. 1996. [Google Scholar] [CrossRef] [Green Version]
  47. Rodrik, D. Democracies pay higher wages. Q. J. Econ. 1999. [Google Scholar] [CrossRef]
  48. Blume, L.; Müller, J.; Voigt, S.; Wolf, C. The economic effects of constitutions: Replicating-and extending-persson and tabellini. Public Choice 2009. [Google Scholar] [CrossRef] [Green Version]
  49. Besley, T.; Persson, T.; Sturm, D.M. Political competition, policy and growth: Theory and evidence from the US. Rev. Econ. Stud. 2010. [Google Scholar] [CrossRef] [Green Version]
  50. Cuervo-Cazurra, A.; Alfonso Dau, L. Multinationalization in Response to Reforms; Academy of Management: Briarcliff Manor, NY, USA, 2009. [Google Scholar]
  51. Cuervo-Cazurra, A. Corruption in international business. J. World Bus. 2016, 51, 35–49. [Google Scholar] [CrossRef]
  52. Gordon, R.J. Five Puzzles in the Behavior of Productivity, Investments and Innovation; National Bureau of Economic Research: Cambridge, MA, USA, 2004. [Google Scholar]
  53. Lim, W.H.; Moon, J.T. Korea as a Knowledge Economy: Assessment and Lessons. In Designing New Economic Framework; Korea Development Institute (KDI): Yeongi-gun, Korea, 2004. [Google Scholar]
  54. OECD. The Source of Economic Growth in OECD Countries; OECD: Paris, France, 2003. [Google Scholar]
  55. OECD. The New Economy: Beyond the Hype; OECD: Paris, France, 2001. [Google Scholar]
  56. Warhuus, J.P.; Basaiawmoit, R.V. Entrepreneurship education at Nordic technical higher education institutions: Comparing and contrasting program designs and content. Int. J. Manag. Educ. 2014. [Google Scholar] [CrossRef] [Green Version]
  57. Winkler, C.; Troudt, E.; Schweikert, C.; Schulman, S. Infusing Business and Entrepreneurship Education into a Computer Science Curriculum—A Case Study of the Stem Virtual Enterprise. J. Bus. Entrep. 2015, 27, 1–21. [Google Scholar]
  58. Acemoglu, D.; Johnson, S. Institutions, Corporate Governance. Corp. Gov. Cap. Flows Glob. Econ. 2003, 1, 327. [Google Scholar]
  59. Acemoglu, D.; Robinson, J.A. Persistence of Power, Elites, and Institutions. Am. Econ. Rev. 2008, 98, 267–293. [Google Scholar] [CrossRef] [Green Version]
  60. Li, S. Managing International Business in Relation-Based versus Rule-Based Countries; Business Expert Press: New York, NY, USA, 2009. [Google Scholar]
  61. Kramer, R.M. Trust and distrust in organizations: Emerging perspectives, enduring questions. Annu. Rev. Psychol. 1999, 50, 569–598. [Google Scholar] [CrossRef] [Green Version]
  62. Lin, X.; Wang, C.L. Enforcement and performance: The role of ownership, legalism and trust in international joint ventures. J. World Bus. 2008. [Google Scholar] [CrossRef]
  63. Muethel, M.; Bond, M.H. National context and individual employees’ trust of the out-group: The role of societal trust. J. Int. Bus. Stud. 2013. [Google Scholar] [CrossRef]
  64. Li, J.; Moy, J.; Lam, K.; Chris Chu, W.L. Institutional pillars and corruption at the societal level. J. Bus. Ethics 2008. [Google Scholar] [CrossRef]
  65. Meyer, K.E. Institutions, Transaction Costs, and Entry Mode Choice in Eastern Europe. J. Int. Bus. Stud. 2001, 32, 357–367. [Google Scholar] [CrossRef] [Green Version]
  66. The Fund for Peace Fragile States Index. Available online: https://fragilestatesindex.org/ (accessed on 12 January 2021).
  67. World Economic Forum Global Competitiveness Index. Available online: https://www.weforum.org/reports/ (accessed on 12 January 2021).
  68. The PRS Group International Country Risk Guide (ICRG). Available online: https://www.prsgroup.com/explore-our-products/international-country-risk-guide (accessed on 12 January 2021).
  69. The Heritage Foundation Index of Economic Freedom. Available online: https://www.heritage.org/index/ (accessed on 12 January 2021).
  70. Hidalgo, C.A.; Hausmann, R. The building blocks of economic complexity. Proc. Natl. Acad. Sci. USA 2009, 106, 10570–10575. [Google Scholar] [CrossRef] [Green Version]
  71. Sheng, L.; Yang, D.T. Expanding export variety: The role of institutional reforms in developing countries. J. Dev. Econ. 2016, 118, 45–58. [Google Scholar] [CrossRef] [Green Version]
  72. Zhu, S.; Fu, X. Drivers of Export Upgrading. World Dev. 2013, 51, 221–233. [Google Scholar] [CrossRef] [Green Version]
  73. Hausmann, R.; Hidalgo, C.A. The Atlas of Economic Complexity; The MIT Press: Cambridge, MA, USA, 2011; ISBN 9780615546629. [Google Scholar]
  74. Hair, J.; Risher, J.J.; Sarstedt, M.; Ringle, C.M. When to use and how to report the results of PLS-SEM. Eur. Bus. Rev. 2019, 31, 2–24. [Google Scholar] [CrossRef]
  75. Hair, J.; Hult, G.T.; Ringle, C.; Sarstedt, M. A Primer on Partial Least Squares Structural Equation Modeling (PLS-SEM); Sage Publications: Thousand Oaks, CA, USA, 2016; ISBN 9781483377445. [Google Scholar]
  76. Kock, N. Factor-based structural equation modeling with WarpPLS. Australas. Mark. J. 2019. [Google Scholar] [CrossRef]
  77. Monecke, A.; Leisch, F. SemPLS: Structural equation modeling using partial least squares. J. Stat. Softw. 2012, 48. [Google Scholar] [CrossRef] [Green Version]
  78. Kock, N. Non-normality propagation among latent variables and indicators in PLS-SEM simulations. J. Mod. Appl. Stat. Methods 2016, 15, 299–315. [Google Scholar] [CrossRef]
  79. Busu, C.; Busu, M. Research on the factors of competition in the green procurement processes: A case study for the conditions of romania using pls-sem methodology. Mathematics 2021, 9, 16. [Google Scholar] [CrossRef]
  80. Chung, K.C.; Liang, S.W.J. Understanding factors affecting innovation resistance of mobile payments in Taiwan: An integrative perspective. Mathematics 2020, 8, 1841. [Google Scholar] [CrossRef]
  81. Palos-Sanchez, P.; Saura, J.R.; Ayestaran, R. An Exploratory Approach to the Adoption Process of Bitcoin by Business Executives. Mathematics 2021, 9, 355. [Google Scholar] [CrossRef]
  82. Dunning, J.H. A new Zeitgeist for international business activity and scholarship. Eur. J. Int. Manag. 2007, 1, 278–301. [Google Scholar] [CrossRef]
  83. Dunning, J.H. New directions in international-business research: A personal viewpoint. Res. Glob. Strateg. Manag. 2008, 14, 247–257. [Google Scholar]
  84. Aharoni, Y.; Brock, D.M. International business research: Looking back and looking forward. J. Int. Manag. 2010, 16, 5–15. [Google Scholar] [CrossRef]
  85. Hair, J.F.; Sarstedt, M.; Ringle, C.M.; Mena, J.A. An assessment of the use of partial least squares structural equation modeling in marketing research. J. Acad. Mark. Sci. 2012, 40, 414–433. [Google Scholar] [CrossRef]
  86. Richter, N.F.; Sinkovics, R.R.; Ringle, C.M.; Schlägel, C. A critical look at the use of SEM in international business research. Int. Mark. Rev. 2016, 33, 376–404. [Google Scholar] [CrossRef]
  87. Ringle, C.M.; Wende, S.; Becker, J.-M. SmartPLS 3; SmartPLS GmbH: Bönningstedt, Germany, 2015. [Google Scholar]
  88. Jarvis, C.B.; Mackenzie, S.B.; Podsakoff, P.M.; Giliatt, N.; Mee, J.F. A Critical Review of Construct Indicators and Measurement Model Misspecification in Marketing and Consumer Research. J. Consum. Res. 2003, 30, 199–218. [Google Scholar] [CrossRef]
  89. Coltman, T.; Devinney, T.M.; Midgley, D.F.; Venaik, S. Formative versus reflective measurement models: Two applications of formative measurement. J. Bus. Res. 2008, 61, 1250–1262. [Google Scholar] [CrossRef] [Green Version]
  90. Henseler, J.; Ringle, C.M.; Sarstedt, M. A new criterion for assessing discriminant validity in variance-based structural equation modeling. J. Acad. Mark. Sci. 2015, 43, 115–135. [Google Scholar] [CrossRef] [Green Version]
  91. Kline, R.B. Principles and Practice of Structural Equation Modeling; The Guilford Press: New York, NY, USA, 2011; Volume 20, ISBN 9781606238776. [Google Scholar]
  92. Hair, J.F.; Sarstedt, M.; Ringle, C.M.; Gudergan, S.P. Advanced Issues in Partial Least Squares Structural Equation Modeling; Sage Publications, Inc.: Thousand Oaks, CA, USA, 2018; ISBN 9781626239777. [Google Scholar]
  93. Hair, J.F.; Howard, M.C.; Nitzl, C. Assessing measurement model quality in PLS-SEM using confirmatory composite analysis. J. Bus. Res. 2020, 109, 101–110. [Google Scholar] [CrossRef]
  94. Chin, W.W. The partial least squares approach to structural equation modeling. In Modern Methods for Business Research; Marcoulides, G.A., Ed.; Lawrence Erlbaum Associates: Mahwah, NJ, USA, 1998; pp. 295–336. [Google Scholar]
  95. Henseler, J.; Sarstedt, M. Goodness-of-fit indices for partial least squares path modeling. Comput. Stat. 2013, 28, 565–580. [Google Scholar] [CrossRef] [Green Version]
  96. Chin, W.W.; Dibbern, J. An Introduction to a Permutation Based Procedure for Multi-Group PLS Analysis: Results of Tests of Differences on Simulated Data and a Cross Cultural Analysis of the Sourcing of Information System Services Between Germany and the USA. In Handbook of Partial Least Squares; Springer: Berlin/Heidelberg, Germany, 2010; pp. 171–193. [Google Scholar]
  97. Downing, J.A. Dimensions of Competitive Advantage. J. New Bus. Ideas Trends 2018, 16, 1–8. [Google Scholar]
  98. Gedefaw Birhanu, A.; Wezel, F.C. The competitive advantage of affiliation with business groups in the political environment: Evidence from the Arab Spring. Strateg. Organ. 2020, 1–23. [Google Scholar] [CrossRef]
  99. Yasar, M.; Paul, C.J.M.; Ward, M.R. Property Rights Institutions and Firm Performance: A Cross-Country Analysis. World Dev. 2011, 39, 648–661. [Google Scholar] [CrossRef]
  100. Miles, M.P.; Darroch, J. Competitive Advantage. In Wiley Encyclopedia of Management; John Wiley & Sons, Ltd.: Chichester, UK, 2015; pp. 1–7. [Google Scholar]
  101. Useche, A.J.; Reyes, G.E. Corruption, competitiveness and economic growth: Evidence from Latin American and Caribbean countries 2004–2017. J. Glob. Compet. Gov. 2019, 14, 95–115. [Google Scholar] [CrossRef]
  102. Ulman, S.-R. The Impact of the National Competitiveness on the Perception of Corruption. Procedia Econ. Financ. 2014, 15, 1002–1009. [Google Scholar] [CrossRef] [Green Version]
  103. Hegemann, P.; Berumen, S.A. A neoschumpeterian review of the impact of corruption on competitiveness and foreign direct investmentUna revisión neoschumpeteriana del impacto de la corrupción sobre la competitividad y la inversión extranjera directa. Papeles Eur. 2011, 22, 39–60. [Google Scholar] [CrossRef] [Green Version]
  104. Takala, J.; Koskinen, J.; Liu, Y.; Tas, M.S.; Muhos, M. Validating knowledge and technology effects to operative sustainable competitive advantage. Manag. Prod. Eng. Rev. 2013, 4, 45–54. [Google Scholar] [CrossRef]
  105. Argote, L.; Ingram, P. Knowledge transfer: A basis for competitive advantage in firms. Organ. Behav. Hum. Decis. Process. 2000, 82, 150–169. [Google Scholar] [CrossRef] [Green Version]
  106. Bilgihan, A.; Wang, Y. Technology induced competitive advantage: A case of US lodging industry. J. Hosp. Tour. Technol. 2016, 7, 37–59. [Google Scholar] [CrossRef]
  107. Bhatt, G.D.; Grover, V. Types of information technology capabilities and their role in competitive advantage: An empirical study. J. Manag. Inf. Syst. 2005, 22, 253–277. [Google Scholar] [CrossRef]
  108. Tadei, F. Measuring Extractive Institutions: Colonial Trade and Price Gaps in French Africa. Eur. Rev. Econ. Hist. 2017. [Google Scholar] [CrossRef]
  109. Mizuno, N.; Naito, K.; Okazawa, R. Inequality, extractive institutions, and growth in nondemocratic regimes. Public Choice 2016, 170, 115–142. [Google Scholar] [CrossRef] [Green Version]
  110. Vanino, E.; Lee, S. Extractive institutions in non-tradeable industries. Econ. Lett. 2018, 170, 10–13. [Google Scholar] [CrossRef] [Green Version]
  111. Bowness, J. Foreign Direct Investment and Extractive Institutions Lessons from Latin America. Potentia J. Int. Aff. 2019, 10, 36–49. [Google Scholar] [CrossRef]
Figure 1. Institutional Quality and International Competitiveness-Basic Model. Source: Author’s elaboration.
Mathematics 09 00928 g001
Figure 2. Indicator loadings. Source: Results from SmartPLS software 3.3.3.
Mathematics 09 00928 g002
Figure 3. Model results. Source: Results from SmartPLS software 3.3.3.
Mathematics 09 00928 g003
Table 1. Countries included in the study.
RegionCountries
Latin America and the CaribbeanArgentina, Brazil, Chile, Colombia, Jamaica, Mexico, Peru, and Venezuela
EuropeBulgaria, Croatia, Czech Republic, Estonia, Greece, Hungary, Latvia, Lithuania, Poland, Romania, Slovenia, Serbia, and Ukraine
AsiaBangladesh, China, India, Indonesia, Kazakhstan, Malaysia, Pakistan, the Philippines, Russia, Sri Lanka, Thailand, and Vietnam
AfricaKenya, Nigeria, Namibia, South Africa, Uganda, and Zambia
MENAEgypt, Jordan, Kuwait, Morocco, Qatar, Tunisia, Turkey, and the United Arab Emirates
Source: Author’s elaboration.
Table 2. Data sources and scales.
IndexCategories/PillarsIndicatorsScale
HighLow
GCIBasic requirements Institutions, infrastructure, macroeconomic environment, and health and primary education. 71
Efficiency enhancers Goods, labor, and financial markets, higher education and training, and technological readiness. 71
Innovation and sophistication Business sophistication and innovation.71
FSICohesionSecurity apparatus, factionalized elites, and group grievance.110
EconomicEconomic decline, uneven economic development, and human flight and brain drain.110
PoliticalState legitimacy, public services, and human rights and rule of law110
Social and cross-cutting indicators Demographic pressures, refugees and IDPs (Internal Displaced People), and external intervention110
EFIRule of law Property rights, government integrity, judicial effectiveness1000
Government SizeGovernment spending, tax burden, fiscal health1000
Regulatory efficiency Business freedom, labor freedom, monetary freedom1000
Open marketsTrade freedom, investment freedom, financial freedom1000
ICRGGovernment stabilityGovernment unity, legislative strength, popular support120
Socioeconomic conditionsUnemployment, consumer confidence, poverty120
Investment profileContract viability/expropriation, profits repatriation, payment delays120
Internal conflictCivil war/coup threat, terrorism/political violence, civil disorder120
External conflictWar, cross-border conflict, foreign pressures120
CorruptionSpecial payments and bribes60
Military in politicsDomination of society and/or governance by military forces60
Religious tensionsDomination of society and/or governance by a single religious group60
Law and orderStrength and impartiality of the legal system, observance of the law60
Ethnic tensionsTension within a country attributable to racial, nationality, or language divisions60
Democratic accountabilityGovernment’s responsiveness to its people60
Bureaucracy qualityInstitutional strength to govern without drastic changes in policy or interruptions in government services60
Source: Author’s elaboration based on the respective source.
Table 3. Indicators and constructs.
IndicatorDescriptionConstructSource
efi_pr X1Property rightsPOL Y1Index of Economic Freedom
gci_dpf X2Diversion of public fundsGlobal Competitiveness Index
gci_ipp X3Intellectual property protectionGlobal Competitiveness Index
icrg_corr X4CorruptionInternational Country Risk Guide
icrg_lwo X5Law and orderInternational Country Risk Guide
gci_art X6Availability of research and training servicesRES Y2Global Competitiveness Index
gci_ftf X7FDI (Foreign Direct Investment) and technology transferGlobal Competitiveness Index
gci_qes X8Quality of the education systemGlobal Competitiveness Index
gci_qms X9Quality of math and science educationGlobal Competitiveness Index
gci_qri X10Quality of scientific research institutionsGlobal Competitiveness Index
gci_uic X11University-industry collaboration in R&DGlobal Competitiveness Index
fsi_bd X12Human flight and brain drainSYS Y3Fragile States Index
fsi_fe X13Factionalized elitesFragile States Index
fsi_gg X14Group grievanceFragile States Index
fsi_sl X15State legitimacyFragile States Index
eci X16Economic complexityIC Y4Economic Complexity Index
Source: Author’s elaboration.
Table 4. Construct validity and reliability.
Cronbach’s Alpharho_AComposite ReliabilityAverage Variance Extracted (AVE)
POL0.8380.8850.8810.597
RES0.8810.9280.9040.581
SYS0.8870.8880.9230.751
Source: Results from SmartPLS software 3.3.3.
Table 5. Discriminant validity-HTMT.
ICPOLRES
POL0.386
RES0.4670.739
SYS0.6010.6910.398
Source: Results from SmartPLS software 3.3.3.
Table 6. Hypothesis results.
HypothesisCoefficientStandard DeviationT Statisticsp ValuesVIFf SquareCI 2.5%CI 97.5%
LowerUpper
H1POL- > IC−0.1580.0523.0610.0022.2600.019−0.257−0.054
H2RES- > IC0.3690.0448.3160.0001.6110.1440.2750.459
H3SYS- > IC−0.5260.04013.0520.0001.6550.284−0.600−0.448
Source: Results from SmartPLS software 3.3.3.
Publisher’s Note: MDPI stays neutral with regard to jurisdictional claims in published maps and institutional affiliations.

