Abstract
We extend the classical compartmental frameworks for susceptible-infected-susceptible () and susceptible-infected-recovered () systems to include an exposed/latent class or a chronic class of infection. Using a suite of stochastic continuous-time Markov chain models we examine the impact of latent and chronic infection on the mean time to extinction of the infection. Our findings indicate that the mean time to pathogen extinction is increased for infectious diseases which cause exposed/latent infection prior to full infection and that the extinction time is increased further if these exposed individuals are also capable of transmitting the infection. A chronic infection stage can decrease or increase the mean time to pathogen extinction and in particular this depends on whether chronically infected individuals incur disease-induced mortality and whether they are able to transmit the infection. We relate our findings to specific infectious diseases that exhibit latent and chronic infectious stages and argue that infectious diseases with these characteristics may be more difficult to manage and control.
1. Introduction
Mathematical models of infectious disease are key tools for understanding the epidemiological dynamics and persistence of infections in humans and animals [1,2]. Model systems have been used to determine the expected persistence time of infection [3,4,5], and thereby provide insight into ways of reducing the impact and spread of pathogens and inform policy for infectious disease management [6,7].
Following an outbreak, an infection may fade-out due to random fluctuations in the number of infected individuals. This can lead to epidemic fade-out where, after a major outbreak, the population is depleted to a level where the number of infected individuals is low and pathogen extinction (zero sources of infection) occurs due to stochasticity or endemic fade-out where pathogen extinction occurs due to stochasticity from a relatively stable endemic state [1,4]. Analysis of endemic fade-out focuses on the expected time to pathogen extinction, , beginning from the quasi-stationary distribution of the number of susceptible and infectious individuals. The expected pathogen extinction time increases as the population size increases while also depending on the relative timescales of infection and demographic processes [4,8]. The analysis of an epidemic fade-out is more complicated and arises when population numbers drop to low levels following an epidemic outbreak which can temporarily limit transmission. Persistence through the outbreak depends on the replenishment of susceptible individuals and the tail of infecteds following the outbreak [4,8].
The mean time to pathogen extinction has been calculated for (susceptible-infected-susceptible) and (susceptible-infected-recovered) model frameworks that assume density-dependent transmission and a constant population size (and therefore omit the impact of disease-induced mortality on regulating host density). For an framework, where the basic reproductive number of the infection (defined as the number of secondary cases when a single infected individual is introduced into a disease-free population), , is greater than unity, the mean time to pathogen extinction is given by , where the coefficients A and C depend on model parameters but are independent of the total population, N, [9,10]. The expression also holds for model frameworks but with A computed numerically and indicates that recovery from infection to immunity reduces the persistence time of infection compared to dynamics where recovery replenishes the susceptible pool [11,12]. These model studies emphasize the importance of the infection processes in determining the persistence of a pathogen.
The infectious disease dynamics for many real-world systems are more complex than the SIS and SIR frameworks. For example, immunity to infection may be temporary [12], the infection may have a significant latent period in which an individual has been exposed to the pathogen but is asymptomatic and non-infectious [13] (such as with rabies [14]), asymptomatic individuals may be infectious (as with Epstein Barr virus infections [15] and COVID-19 coronavirus disease [16]) and following infection there may be a prolonged chronic stage of disease in which individuals can still transmit the infection or can revert to the infectious state (as has been suggested for African swine fever [17,18]). Of particular relevance is the inclusion of disease-induced mortality as it may lead to a large drop in population size following an infectious outbreak and this has an impact on pathogen persistence [19]. Since disease-induced mortality leads to a non-constant population size it is also important to consider different forms of transmission, where, for example, density-dependent transmission can promote an initial infectious outbreak and frequency-dependent transmission can aid persistence of infection at low population levels [20].
In this study, we develop and assess a range of infectious disease model frameworks to explore and understand how the inclusion of more complex epidemiological processes will affect the persistence of infection. In all model frameworks we include disease-induced mortality and a combination of density-dependent and frequency-dependent transmission. We extend classical infectious disease frameworks without immunity (susceptible-infected-susceptible, ) and with immunity (susceptible-infected-recovered/immune, ) to include an exposed/latent class, E and a chronically infected class, C. For this mathematical study we define E as the stage prior to full infection, I. In this exposed class, E, individuals do not incur disease-induced mortality (which individuals in the infected class do incur) but may transmit the infection. The exposed class therefore approximates asymptomatic or presymptomatic individuals that may or may not be infectious. We examine the impact of the exposed class on pathogen persistence by comparing systems without immunity, and , and those with immunity and . In a similar manner we define the chronically infected class, C, as the stage that follows full infection, I. Individuals in this class may suffer disease-induced mortality and may be able to transmit the infection but at a reduced rate compared to the infected class. We examine the impact of the chronically infected class on pathogen persistence by comparing systems without immunity, and , and those with immunity, and . We estimate the persistence time of the infection numerically using a suite of stochastic continuous-time Markov chain models [21,22] and our aim is to understand the importance of exposed/latent and chronic infection on pathogen persistence. Although the definitions of exposed/latent and chronic infection we employ are common in the theoretical literature [1,2,7,17], we acknowledge that their definitions may not match the precise characteristics of a specific infectious disease. Notwithstanding, our model framework allows the effect of exposed/latent and chronic infection on the mean time to extinction of an infection to be isolated and allows us to infer and discuss the impact of these processes on the persistence and management of specific infectious diseases.
2. Methods
We will first outline the model frameworks in the absence of immunity. For the framework we describe the deterministic model framework and then the corresponding stochastic (continuous-time Markov chain) model [22,23]. The deterministic model is based on classical, compartmental infectious disease modelling frameworks [2,24] and is represented by the following system of equations:
Here, S represents the susceptible population density, I the infected density and the total population density. The maximum birth rate is given by b, which is modified due to intra-specific competition through the parameter, , where K denotes the carrying capacity of the population (the stable population level in the absence of infection). The natural death rate is given by d. For the infection dynamics we denote to be the frequency-dependent transmission rate, the density-dependent transmission coefficient, the recovery rate and the disease-induced mortality incurred by infected individuals. The equivalent stochastic model is a continuous-time Markov chain [22,23], with transition rates given in Table 1.

Table 1.
Possible events and their respective state transitions and transition rates for the stochastic representation of an SIS model framework. Model parameters are defined in the main text. Note, the transition rate for the birth of a susceptible is set to zero if .
In the stochastic model of the framework the susceptible class, S, and infected class, I, are integer values that represent the population number. Individual simulations can be undertaken using a Gillespie algorithm [21,25] that describes the dynamics for a single realization. We run 100 realizations of the stochastic model and determine the mean time to extinction of the infection, , (pathogen extinction occurs when no sources of infection remain in the population) and the confidence interval for the mean for each distinct model framework and set of parameters. We only consider simulations in which an initial infectious outbreak occurs, which we define as a drop in the susceptible population number below of the pre-infection population size prior to pathogen extinction. For all simulations we choose a carrying capacity of and use the initial conditions: .
We choose a baseline set of parameters as defined in Table 2. These are chosen such that the basic reproductive number of the infection, , is greater than unity and so pathogen persistence will depend on epidemic or endemic fade-out. The for the framework and the other model frameworks considered in this study can be found in supplementary information (Equations (S4)–(S6)). We compare results for a low, medium and high level of disease-induced mortality (see Table 2) and undertake a sensitivity analysis on other key parameters to understand their impact on pathogen persistence. The model is then extended to an or framework with the inclusion of an exposed/latent class, E, (referred to as the exposed class for the remainder of the methods and results section) or a chronic class, C, respectively. The deterministic versions of these model frameworks are shown in Equations (2) and (3).
Table 2.
Baseline parameter values and their biological meaning.
In the model (Equation (2)) susceptible individuals progress to the exposed class, E, following transmission and subsequently progress from the exposed class to the infected class at rate . An exposed individual does not incur disease-induced mortality but could be infectious and transmit the pathogen at a proportion of that of an infected, I, individual. Our default (Table 2) is to assume and we consider as part of a parameter sensitivity analysis. Following infection an individual progresses back to the susceptible class at rate . All other parameters are as described for the model. The deterministic model is as follows:
In the model (Equation (3)) susceptible individuals progress to the infected class, I, following transmission and then progress to the chronically infected class, C, at rate . A chronically infected individual can progress back to the susceptible class at rate and may incur disease-induced mortality at a proportion, c, of that of an infected individual. In a similar manner to the model above we assume that a chronically infected individual may also be infectious (at a proportion of that of an infected individual). We consider two baseline cases, one where chronically infected individuals incur disease-induced mortality but cannot transmit the infection and one where they do not incur disease-induced mortality but can transmit the infection. All other parameters are described for the model. The deterministic model is as follows:
For both the and model the exposed and chronically infected population are not infectious when . Note, in the limit of both models converge back to the original model. The proportional level of pathogen transmission, , of exposed and chronic individuals, the rate of progression, , from the exposed and chronic class and the proportional level of disease-induced mortality incurred by the chronic class, c, will be varied to understand their effect on the persistence of infection.
We adapt the methods described above to include immunity by considering , and model frameworks. In these frameworks individuals enter a recovered and immune class R following recovery from the infected class, I, or chronically infected class, C, as appropriate. These model frameworks are detailed in full in the Supplementary Information (Equations (S1)–(S3)).
3. Results
Model simulations showing the population dynamics for the deterministic model and for 100 realizations of the stochastic model, for baseline parameters and low, medium and high values of disease-induced mortality are shown in Figure 1. Numerical solutions of the deterministic model were produced using Matlab R2019a, ode15s. For the stochastic models considered in this manuscript we developed our own implementation of the Gillespie algorithm for simulation of continuous-time Markov chains in Matlab R2019a. In the deterministic model the infection persists for all scenarios with a decrease in infected density as the disease-induced mortality increases. For the stochastic version of the model the infection persists (for the timescale tested) in all model realizations at low levels of disease-induced mortality (Figure 1B(i)). At medium levels of disease-induced mortality the stochastic model typically exhibits endemic fade-out with the population settling to endemic levels prior to infection fade-out and a return to disease-free population levels (Figure 1B(ii)). At high levels of disease-induced mortality the stochastic model typically exhibits epidemic fade-out where the population crash and rapid turnover of infected individuals reduces the force of infection to levels that cannot support the infection (Figure 1B(iii)). This highlights the different possible outcomes of deterministic and stochastic frameworks and the need to consider stochastic models to determine the extinction time of infections.
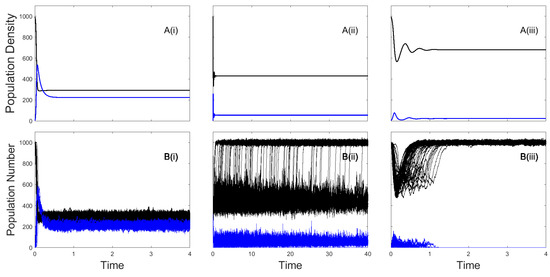
Figure 1.
Population densities for the deterministic (Equation (1)) model framework (A) and population numbers for the stochastic (Table 1) model framework (B) with susceptible densities/numbers (black) and infected densities/numbers (blue). For the stochastic model the results of 100 individual realizations are shown. Results are shown for three values of the disease-induced mortality rate (i) , (ii) and (iii) , representing a low, medium and high mortality rate, respectively. Baseline parameter values (see Section 2) were used for other parameters.
3.1. The Impacts of Exposed/Latent Infection on the Mean Time to Pathogen Extinction
Figure 2, Figure 3 and Figure 4 explore the impact of exposed/latent infection on pathogen persistence by comparing the and and the and model frameworks. A key result is that the inclusion of an exposed class leads to a pronounced increase in the mean time to pathogen extinction. Here, exposed individuals promote pathogen persistence since they delay progression to the infected class, which in itself extends the mean time to extinction of the infection, but also reduces the severity of the population crash in the initial outbreak and thereby reduces the chance of epidemic fade-out. It is also clear that the mean time to pathogen extinction is lower in models that include recovery to immunity.
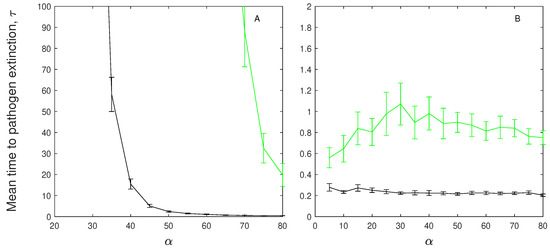
Figure 2.
The mean time to pathogen extinction (with confidence intervals) plotted against disease-induced mortality rate for (A) models without immunity: (black) and (green), and (B) models with immunity: (black) and (green). Also note the difference in vertical axis scale between A and B. When not changed in the figure baseline parameter values were used (see Table 2).
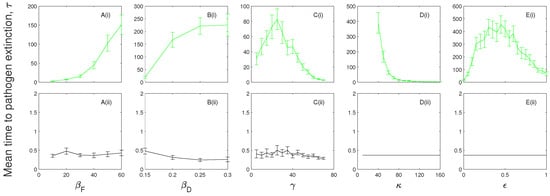
Figure 3.
A parameter sensitivity analysis for (i) the (black) and (ii) the (green) model frameworks with . The mean time to pathogen extinction (with confidence intervals) is plotted against (A) the frequency-dependent transmission rate, ; (B) the density-dependent transmission coefficient, ; (C) the infected recovery rate, ; (D) the exposed progression rate, ; and (E) the exposed infectiousness, . When not changed in the figure baseline parameter values were used (see Table 2). Note, at low, , and medium, levels of disease-induced mortality the mean extinction time of the infection for the model exceeds our simulation time scale and so results are not shown. Results for the model at are shown in Figure 5 and Figure 6.
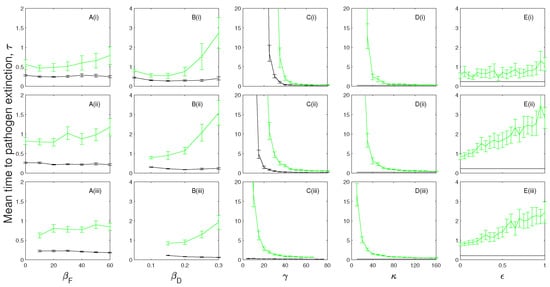
Figure 4.
A parameter sensitivity analysis for the (black) and (green) model frameworks and where in (i) , (ii) and (iii) . The mean time to pathogen extinction (with confidence intervals) is plotted against (A) the frequency-dependent transmission rate, ; (B) the density-dependent transmission coefficient, ; (C) the infected recovery rate, ; (D) the exposed rate, ; and (E) the exposed infectiousness, . When not changed in the figure baseline parameter values were used (see Table 2).
To validate the simulation method that we employ to calculate the mean time to extinction of the infection, , we compare our results for the system with those that use continuous-time Markov chain theory on a finite set of states [26]. Details of this comparison are shown in the Supplementary Information (Section S2) and indicate that our method of determining from simulations is a close fit with the Markov chain theory for the framework. Note, the Markov chain theory method becomes too computationally intensive for higher-dimensional models.
A parameter sensitivity analysis for the models indicates that in the absence of immunity the mean extinction time of the infection decreases as disease-induced mortality increases (Figure 2A). When immunity is included the mean time to extinction of the infection remains relatively constant (Figure 2B).
There is little change in the mean time to pathogen extinction for changes in the infection transmission terms in models without the exposed class (Figure 3A,B and Figure 4A,B) and extinction is rapid. When an exposed class is included the mean extinction time of the infection increases as frequency-dependent and density-dependent transmission increases since this leads to an increase in exposed individuals which contribute to the persistence of the infection.
In the absence of immunity pathogen persistence is maximized at an intermediate level of the infected recovery rate, (Figure 3C). When the recovery rate is low, the time to pathogen extinction is short as there is a buildup of individuals in the infected class which increases the force of infection, leads to a large population crash and subsequent epidemic fade-out of the infection. At intermediate rates of recovery the time spent in the infected class is reduced but is sufficient to support infection without causing a severe crash in the population, and so leads to an increase in the time to extinction of the pathogen. If the rate of recovery is increased further then the time spent in the infected class is reduced to levels where infected numbers and consequently the force of infection is low leading to a reduced extinction time of the infection. When immunity is included the mean time to pathogen extinction decreases as the recovery rate increases (Figure 4C) since with no opportunity to progress back to a susceptible class pathogen persistence is prolonged by a low recovery rate, and thereby increased duration, in the infected class.
The mean time to extinction of the infection increases as the rate of progression from the exposed class decreases since exposed individuals do not incur additional mortality but do act as a source of future infected individuals. When the progression rate from the exposed class, , is high (and with ) the length of time in the exposed class is short and the and models converge to and models respectively and therefore so do the mean extinction times (Figure 3D and Figure 4D).
Increasing the proportional level of infectiousness of the exposed class, by increasing , increases the average time to pathogen extinction (compared to when ) (Figure 3E and Figure 4E) since here the exposed class provides an additional transmission route without the cost of disease-induced mortality. However, in the absence of immunity the mean extinction time of the infection is maximized at intermediate levels of (Figure 3E) as higher levels of transmission from exposed individuals increases the force of infection which reduces the pool of susceptible individuals.
3.2. The Impacts of Chronic Infection on the Mean Time to Pathogen Extinction
Figure 5, Figure 6 and Figure 7 explore the impact of chronic infection on pathogen persistence by comparing the and and the and model frameworks. A key characteristic of chronic infection is that individuals may incur disease-induced mortality (albeit at a reduced rate compared to infected individuals) and/or may be able to transmit infection.
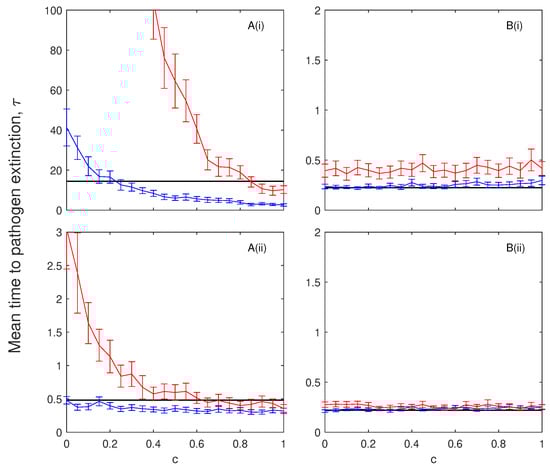
Figure 5.
The mean time to pathogen extinction (with confidence intervals) plotted against the proportion of disease-induced mortality incurred by chronically infected individuals compared to infected individuals. The results are shown for models with no immunity (A), with (black), and (blue) and and (red) and for models with immunity (B), with (black), and (blue) and and (red). In (i) and (ii) . When not changed in the figure baseline parameter values were used (see Table 2). Note, at low levels of disease-induced mortality, , the mean time to pathogen extinction for the models without immunity exceeds our simulation time scale and so results are not shown.
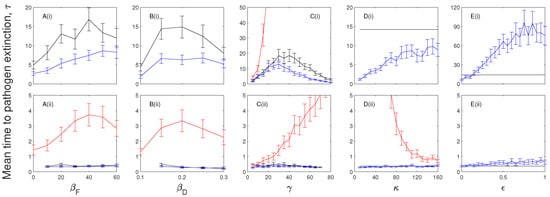
Figure 6.
A parameter sensitivity analysis for the (black) and model frameworks with a chronically infected class that exhibits disease-induced mortality (, blue) and a chronically infected class that can transmit the infection (, red) for (i) and (ii) . The mean time to pathogen extinction (with confidence intervals) is plotted against (A) the frequency-dependent transmission rate, ; (B) the density-dependent transmission coefficient, ; (C) the infected recovery rate, ; (D) the chronically infected progression rate, ; and (E) the chronically infected infectiousness, . When not changed in the figure baseline parameter values were used (see Table 2). Note, at low levels of disease-induced mortality, , the mean time to pathogen extinction exceeds our simulation time scale and so results are not shown. Red lines are not shown in figure (A(i)), (B(i)), and (D(i)) as here exceeds our simulation time scale. Red lines are not shown in (E(i)) and (E(ii)) as this scenario assumes chronic individuals are infectious.
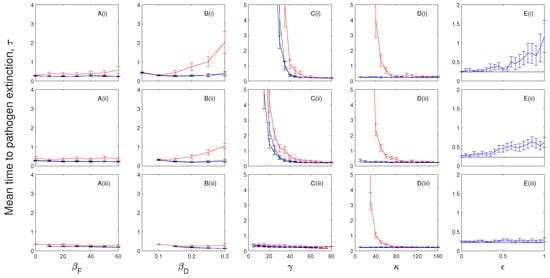
Figure 7.
A parameter sensitivity analysis for the (black) and model frameworks with a chronically infected class that exhibits disease-induced mortality (, blue) and a chronically infected class that can transmit the infection (, red) for (i) , (ii) and (iii) . The mean time to pathogen extinction (with confidence intervals) is plotted against (A) the frequency-dependent transmission rate, ; (B) the density-dependent transmission coefficient, ; (C) the infected recovery rate, ; (D) the chronically infected progression rate, ; and (E) the chronically infected infectiousness, . When not changed in the figure baseline parameter values were used (see Table 2). Red lines are not shown in (E(i)) and (E(ii)) as this scenario assumes chronic individuals are infectious.
In the absence of immunity, the mean time to pathogen extinction decreases as the proportional rate of disease-induced mortality of chronically infected individuals, c, increases (Figure 5A). A threshold exists for c below which the presence of a chronic class increases the mean time to extinction of the infection. When chronically infected individuals suffer high levels of disease-induced mortality they reduce the supply of susceptible individuals following recovery. When immunity is included, rapid epidemic fade-out is seen and the mean time to extinction of the infection remains relatively constant to changes in the level of disease-induced mortality incurred by chronically infected individuals. A key result is that the characteristics of chronic infection are critical to whether the mean extinction time of the infection is increased or decreased.
We undertake a parameter sensitivity analysis for models that include a chronically infected class for the following two set-ups: (i) chronically infected individuals incur disease-induced mortality but do not transmit the infection (the blue line in Figure 5, Figure 6 and Figure 7) and (ii) chronically infected individuals can transmit the infection but do not incur disease-induced mortality (the red line in Figure 5, Figure 6 and Figure 7).
The mean time to extinction of the infection initially increases as frequency-dependent and density-dependent transmission increases (Figure 6A,B and Figure 7A,B). However, further increases in transmission can reduce the mean time to pathogen extinction as the high rate of transmission leads to a more severe population crash and epidemic fade-out of the infection.
In the absence of immunity, the mean time to extinction of the infection is maximized at intermediate levels of recovery when chronic infection incurs disease-induced mortality (Figure 6C) in a similar manner to that described for models that include exposed infection. When chronically infected individuals transmit the infection but do not incur additional mortality an increase in the recovery rate (from the infected to chronic class) increases the mean extinction time of the infection. When immunity is included the mean time to extinction of the infection decreases as the recovery rate increases in the same way as models with exposed infection (Figure 7C).
In the absence of immunity and where chronically infected individuals do not transmit the infection an increase in the progression rate from the chronic class (to the susceptible class) increases the mean time to pathogen extinction (Figure 6D) since a more rapid transition from the chronic class (which incurs additional mortality) provides a source of susceptible individuals. In the case where chronically infected individuals can transmit the infection (but do not incur disease-induced mortality) pathogen persistence is promoted by remaining in the chronic class (Figure 6D). Both scenarios tend towards the model framework as the progression rate increases. In models with immunity the mean time to pathogen extinction for the model framework without an infectious chronic class is short and shows little variation as the rate of leaving the chronic class varies (Figure 7D). When the chronic class can transmit the infection, we see a decline in mean time to pathogen extinction as progression from the chronic class increases for the same reasons as explained for the case without immunity.
The mean time to extinction of the infection increases as the proportional rate of transmission from the chronic class increases in all scenarios (Figure 6E and Figure 7E). Here, the additional source of infection from a class with reduced disease-induced mortality, compared to the infected class, promotes pathogen persistence.
4. Discussion
Both deterministic and stochastic modelling approaches are key tools for understanding the epidemiological dynamics and persistence of infectious disease. Deterministic models have advantages of analytical tractability, where for example, determining the endemic level of infection becomes more straightforward. However, real systems are subject to random fluctuations and stochastic models developed to capture this randomness indicate that an infection can become extinct even when [27]. In this study we examine classical infectious disease model frameworks to consider the role of exposed/latent and chronic infection in systems with and without recovery to immunity and the role of epidemiological parameters on the mean time to extinction of an infection.
Our study confirms previous findings that compare and frameworks and indicate that the inclusion of immunity reduces the time to extinction of the infection and therefore the likelihood of pathogen persistence [11,12]. We also show that an increase in disease-induced mortality reduces the mean time to pathogen extinction for models that do not include immunity. Our work therefore extends previous findings for focused stochastic models that examine the impact of disease-induced mortality and infection induced reduction in fecundity in SI frameworks [19]. For models that include immunity the relationship between disease-induced mortality and mean time to pathogen extinction is less clear. For a wide range of parameters the persistence time of the infection is short and has low sensitivity to changes in disease-induced mortality. However, at lower rates of recovery from infection there is evidence of a reduction in the mean time to pathogen extinction as disease-induced mortality increases. Here, the increase in the force of infection that arises from a longer duration in the infected class is offset as the level of disease-induced mortality increases. Reduced pathogen persistence for acute disease has been shown in spatial models [28] where the rapid turnover of infected individuals can lead to the loss of infection before it can be transmitted to neighboring areas.
A key model assessment that we have undertaken in this study determines the impact of latent/exposed and chronic infection on the persistence of infection. Our model findings indicate that the mean time to pathogen extinction is increased when there is an exposed/latent period prior to infection. The extinction time of the infection is further increased if individuals in the exposed class are capable of transmission. Wildlife diseases have been represented by models that include an exposed class [7], including those for infections that incur high levels of disease-induced mortality, such as rabies [14] and Tasmanian devil facial tumor disease [29]. Furthermore, animal tuberculosis (TB) in wild boar [30,31,32] has an infection process where initial infection does not cause high levels of mortality and infected individuals have low rates of transmission (similar to the exposed class in our model where exposed individuals can transmit the infection at a reduced rate). Infected wild boar progress to generalized infection in which they incur increased mortality and have high rates of transmission (similar to the infected class in our model - with a low recovery rate, , since individuals do not recover from TB). Under these conditions our model framework indicates that the ‘exposed’ class plays a significant role in pathogen persistence as it provides a future source of infected individuals. Theoretical assessments of the COVID-19 epidemic use model frameworks to account for the incubation period of the virus [33,34], and a further key aspect of COVID-19 epidemiology is that asymptomatic individuals can transmit the infection. Although this latter process does not precisely fit one of our defined model frameworks, since for COVID-19 asymptomatic individuals that transmit the infection may progress directly to the immune stage, our model results do allow us to infer that infection from exposed individuals may be a key process in promoting persistence of this infection.
The impact of chronic infection on pathogen persistence depends on the characteristics of chronic infection. If chronically infected individuals incur disease-induced mortality but cannot transmit the infection then chronic infection can reduce the mean extinction time of the infection in models without immunity. Here, the chronic stage acts to delay the recovery while incurring the costs of disease-induced mortality. If chronically infected individuals can transmit the infection but incur low levels of disease-induced mortality then the mean persistence time of the infection is increased. The role of a chronic stage (named survivors in Stahl, et al. [18]) has been implicated in the persistence of African swine fever where the infection persists in the long-term even though the disease is highly virulent and leads to significant losses at the population level [17,18]. In particular, two types of survivor are discussed [18]. Type I survivors continue to shed the virus following infection, but they are also likely to incur additional levels of mortality compared to healthy individuals. Here, our model results indicate that the balance between transmission of infection and the level of increased mortality is a key determinant of whether pathogen persistence is enhanced. Type II survivors can revert to the infectious stage from the chronic stage and could therefore be represented by a SICI model framework. A comparison between an SI and SICI framework (see Figure S2) indicates that the chronic stage here can lead to an increase in the mean time to extinction of the infection. Therefore, our study suggests that a chronic stage of infection could aid pathogen persistence, make the infection more difficult to eradicate and could be a mechanism that promotes the observed persistence of African swine fever following an outbreak [17].
Our strategic model study has considered the importance of different epidemiological processes on the persistence of infectious disease. We have confirmed and extended the findings that indicate that pathogen persistence is reduced for infections that lead to immunity. We have also shown that a latent or chronic stage of infection can increase the persistence time of an infection which may make infectious diseases with these characteristics more difficult to manage and control.
Supplementary Materials
The following are available online at https://www.mdpi.com/article/10.3390/math9091007/s1.
Author Contributions
Conceptualization, X.O., A.W., D.C., F.R.-F. and C.G.; Formal analysis, X.O. and A.W.; Methodology, X.O., A.W. and D.C.; Writing—original draft, X.O. and A.W.; Writing—review & editing, X.O., A.W., D.C., F.R.-F. and C.G. All authors have read and agreed to the published version of the manuscript.
Funding
X.O. was supported by The Maxwell Institute Graduate School in Analysis and its Applications, a Centre for Doctoral Training funded by the UK Engineering and Physical Sciences Research Council (grant EP/L016508/01), the Scottish Funding Council, Heriot-Watt University and the University of Edinburgh. A.W. was supported in part by a BBSRC EEID research grant BB/V00378X/1. This work is a contribution to the MCIU project CGL2017-89866 WildDriver.
Institutional Review Board Statement
Not applicable.
Informed Consent Statement
Not applicable.
Data Availability Statement
Not applicable.
Conflicts of Interest
The authors declare no conflict of interest.
Abbreviations
The following abbreviations are used in this manuscript:
| ASF | African swine fever |
| TB | Tuberculosis |
References
- Anderson, R.; May, R. Infectious Diseases of Humans: Dynamics and Control; Oxford University Press: Oxford, UK, 1992. [Google Scholar]
- Keeling, M.; Rohani, P. Modelling Infectious Diseases in Humans and Animals; Princeton Unviersity Press: Princeton, IL, USA, 2008. [Google Scholar]
- Aliee, M.; Rock, K.; Keeling, M.J. Estimating the distribution of time to extinction of infectious diseases in mean-field approaches. J. R. Soc. Interface 2020, 17, 1–7. [Google Scholar] [CrossRef]
- Lloyd-Smith, J.; Cross, P.; Briggs, C.; Daugherty, M.; Getz, W.; Latto, J.; Sanchez, M.; Smith, A.; Swei, A. Should we expect population thresholds for wildlife disease? Trends Ecol. Evol. 2005, 20, 511–519. [Google Scholar] [CrossRef]
- Nåsell, I. A new look at the critical community size for childhood infections. J. Theor. Popul. Biol. 2005, 67, 203–216. [Google Scholar] [CrossRef] [PubMed]
- Garnett, G.; Cousens, S.; Hallet, T.; Steketee, R.; Walker, N. Mathematical models in the evaluation of health programmes. Lancet 2011, 378, 515–525. [Google Scholar] [CrossRef]
- McCallum, H. Models for managing wildlife disease. Parasitology 2016, 143, 805–820. [Google Scholar] [CrossRef] [PubMed]
- Nåsell, I. On the time to extinction in recurrent epidemics. J. R. Stat. Soc. 1999, 61, 309–330. [Google Scholar] [CrossRef]
- Andersson, H.; Djehiche, B. A Threshold Limit Theorem for the Stochastic Logistic Epidemic. J. Appl. Probab. 1998, 35, 662–670. [Google Scholar] [CrossRef]
- Ball, F.; Britton, T.; Neal, P. On Expected Durations of Birth-Death Processes with Applications to Branching Processes and SIS Epidemics. J. Appl. Probab. 2016, 53, 203–215. [Google Scholar] [CrossRef]
- Allen, L.; Burgin, A. Comparison of deterministic and stochastic SIS and SIR models in discrete time. Math. Biosci. 2000, 163, 1–33. [Google Scholar] [CrossRef]
- Clancy, D.; Mendy, S. The effect of waning immunity on long-term behaviour of stochastic models for the spread of infection. J. Math. Biol. 2010, 61, 527–544. [Google Scholar] [CrossRef]
- Brauer, F.; Castillo-Chavez, C. Mathematical Models in Population Biology and Epidemiology; Texts in Applied Mathematics; Springer: New York, NY, USA, 2012; Volume 2. [Google Scholar]
- George, D.; Webb, C.; Farnsworth, M.; O’Shea, T.; Bowen, R.; Smith, D.; Stanley, T.; Ellison, L.; Rupprecht, C. Host and viral ecology determine bat rabies seasonality and maintenance. Proc. Natl. Acad. Sci. USA 2011, 108, 10208–10213. [Google Scholar] [CrossRef]
- Balfour, H.; Dunmire, S.; Hogquist, K. Infectious mononucleosis. Clin. Transl. Immunol. 2015, 4, e33. [Google Scholar] [CrossRef] [PubMed]
- World Health Organisation. Coronavirus Disease 2019 (COVID-19): Situation Report, 73; Technical Documents; World Health Organisation: Geneva, Switzerland, 2020. [Google Scholar]
- O’Neill, X.; White, A.; Ruiz-Fons, F.; Gortázar, C. Modelling the transmission and persistence of African swine fever in wild boar in contrasting European scenarios. Sci. Rep. 2020, 10, 10. [Google Scholar] [CrossRef] [PubMed]
- Ståhl, K.; Sternberg-Lewerin, S.; Blome, S.; Viltrop, A.; Penrith, M.; Chenais, E. Lack of evidence for long term carriers of African swine fever virus—A systematic review. Virus Res. 2019, 272, 197725. [Google Scholar] [CrossRef] [PubMed]
- Ebert, D.; Lipsitch, M.; Mangin, K. The Effect of parasites on host population density and extinction: Experimental epidemiology with Daphnia and six microparasites. Am. Nat. 2000, 156, 459–477. [Google Scholar] [CrossRef]
- Ryder, J.; Miller, M.; White, A.; Knell, R.; Boots, M. Host-parasite population dynamics under combined frequency- and density-dependent transmission. Oikos 2007, 116, 2017–2026. [Google Scholar] [CrossRef]
- Gillespie, D. Exact stochastic simulation of coupled chemical reactions. J. Phys. Chem. 1977, 81, 2340–2361. [Google Scholar] [CrossRef]
- Kamina, K.; Mwalili, S.; Wanjoya, A. The Modeling of a Stochastic SIR Model for HIV/AIDS Epidemic Using Gillespie’s Algorithm. Int. J. Data Sci. Anal. 2019, 5, 117–122. [Google Scholar] [CrossRef]
- White, A.; Bell, S.; Lurz, P.; Boots, M. Conservation management within strongholds in the face of disease-mediated invasions: Red and grey squirrels as a case study. J. Appl. Ecol. 2014, 51, 1631–1642. [Google Scholar] [CrossRef]
- Anderson, R.; May, R. The population dynamics of microparasites and their invertebrate hosts. Phil. Trans. R. Soc. Lond. B 1981, 291, 451–524. [Google Scholar] [CrossRef]
- Renshaw, E. Modelling Biological Populations in Space and Time; Cambridge University Press: Cambridge, UK, 1991. [Google Scholar] [CrossRef]
- Norris, J. Markov Chains; Cambridge University Press: Cambridge, UK, 1997; Chapter 3. [Google Scholar]
- Bailey, N. The Mathematical Theory of Infectious Diseases; Charles Griffin & Company Ltd.: Glasgow, UK, 1975. [Google Scholar]
- Cross, P.; Lloyd-Smith, J.; Johnson, P.; Getz, W. Duelling timescales of host movement and disease recovery determine invasion of disease in structured populations. Ecol. Lett. 2005, 8, 587–595. [Google Scholar] [CrossRef]
- McCallum, H.; Jones, M.; Hawkins, C.; Hamede, R.; Lachish, S.; Sinn, D.; Beeton, N.; Lazenby, B. Transmission dynamics of Tasmanian devil facial tumor disease may lead to disease-induced extinction. Ecology 2009, 90, 3379–3392. [Google Scholar] [CrossRef] [PubMed]
- Gortázar, C.; Che Amat, A.; O’Brien, D. Open questions and recent advances in the control of a multi-host infectious disease: Animal tuberculosis. Mamm. Rev. 2015, 45, 160–175. [Google Scholar] [CrossRef]
- Díez-Delgado, I.; Sevilla, I.; Romero, B.; Tanner, E.; Barasona, J.; White, A.; Lurz, P.; Boots, M.; de la Fuente, J.; Dominguez, L.; et al. Impact of piglet oral vaccination against tuberculosis in endemic free-ranging wild boar populations. Prev. Vet. Med. 2018, 155, 11–20. [Google Scholar] [CrossRef]
- Tanner, E.; White, A.; Lurz, P.; Gortázar, C.; Díez-Delgado, I.; Boots, M. The critical role of infectious disease in compensatory population growth in response to culling. Am. Nat. 2019, 194, E1–E12. [Google Scholar] [CrossRef]
- Peng, L.; Yang, W.; Zhang, D.; Zhuge, C.; Hong, L. Epidemic analysis of COVID-19 in China by dynamical modeling. MedRxiv 2020. [Google Scholar] [CrossRef]
- Yang, Z.; Zeng, Z.; Wang, K.; Wong, S.; Liang, W.; Zanin, M.; Liu, P.; Cao, X.; Gao, Z.; Mai, Z.; et al. Modified SEIR and AI prediction of the epidemics trend of COVID-19 in China under public health interventions. J. Thorac. Dis. 2020, 12, 165–174. [Google Scholar] [CrossRef]


Publisher’s Note: MDPI stays neutral with regard to jurisdictional claims in published maps and institutional affiliations. |
© 2021 by the authors. Licensee MDPI, Basel, Switzerland. This article is an open access article distributed under the terms and conditions of the Creative Commons Attribution (CC BY) license (https://creativecommons.org/licenses/by/4.0/).