Article

Frequent Itemset Mining and Multi-Layer Network-Based Analysis of RDF Databases

MTA-PE Complex Systems Monitoring Research Group, University of Pannonia, 8200 Veszprem, Hungary
*
Author to whom correspondence should be addressed.
These authors contributed equally to this work.
Mathematics 2021, 9(4), 450; https://doi.org/10.3390/math9040450
Submission received: 15 January 2021 / Revised: 12 February 2021 / Accepted: 16 February 2021 / Published: 23 February 2021
(This article belongs to the Special Issue Information Systems Modeling Based on Graph Theory)

Abstract

:
Triplestores or resource description framework (RDF) stores are purpose-built databases used to organise, store and share data with context. Knowledge extraction from a large amount of interconnected data requires effective tools and methods to address the complexity and the underlying structure of semantic information. We propose a method that generates an interpretable multilayered network from an RDF database. The method utilises frequent itemset mining (FIM) of the subjects, predicates and the objects of the RDF data, and automatically extracts informative subsets of the database for the analysis. The results are used to form layers in an analysable multidimensional network. The methodology enables a consistent, transparent, multi-aspect-oriented knowledge extraction from the linked dataset. To demonstrate the usability and effectiveness of the methodology, we analyse how the science of sustainability and climate change are structured using the Microsoft Academic Knowledge Graph. In the case study, the FIM forms networks of disciplines to reveal the significant interdisciplinary science communities in sustainability and climate change. The constructed multilayer network then enables an analysis of the significant disciplines and interdisciplinary scientific areas. To demonstrate the proposed knowledge extraction process, we search for interdisciplinary science communities and then measure and rank their multidisciplinary effects. The analysis identifies discipline similarities, pinpointing the similarity between atmospheric science and meteorology as well as between geomorphology and oceanography. The results confirm that frequent itemset mining provides an informative sampled subsets of RDF databases which can be simultaneously analysed as layers of a multilayer network.

Graphical Abstract

1. Introduction

Linked data (LD) represent an essential tool used to organise, store and share data with context [1]. Datasets that are published as LD form the Semantic Web. The part of the Sematic Web which is freely accessible is called the linked open data cloud (LODC). The driver of LD is the resource description framework (RDF) data model [2], which is standardised by the World Wide Web Consortium (W3C). Databases following the RDF standard are called triplestores or RDF stores, the naming is very intuitive; thus, the atomic form of the RDF is an RDF triplet in the form “subject–predicate–object” (s,p,o), which states that “an object o has a relationship p with subject s” [3]. There is little work on formalisation of the RDF besides the official documents of the W3C, particularly RDF Concepts and Abstract Syntax [4] and RDF Semantics [5], due its flexibility and extensibility [6]. There are formalisations towards special representations and formalisation, like the bipartite graphs as intermediate model for RDF [7]. The main concepts of the RDF are self-descriptive data, data about data [4], machine readability [8] and extendibility [9]. LOD offers large quantities of freely available, interconnected, statistical (linked open statistical data (LOSD)) [10], governmental [11], scientific [12,13] and other annotated data [14]. The collection of such databases forms the Linked Open Data Cloud (LODC) [15], which consists of 2973 datasets with 149.5 billion triplets.
In knowledge discovery and extraction, context is critical [16]. LD-based ontologies provide a facilitating toolset for knowledge sharing [17]. Our goal is to extract potentially useful knowledge, considering the flexible nature and multi-aspect potential of LD, in an automated, easy-to-understand and validated way. We chose the toolset of network theory because it has a compelling perspective on these interconnected, information-dense, complex systems [18]. RDF supports the network-based perspective, as it can be interpreted as a directed labelled network [19]. When network analysis was first incorporated into the analysis of LD, classical measures such as degree distributions, small-world properties [20] and centrality-based rankings of entities [21] were measured. Topic-oriented analysis and LD-based social network analysis also arose [22]. With the introduction of special types of graphs on LD, such as labelled networks [2], hypergraphs [23] and tagged networks [24], deeper analysis was enabled. Most techniques focus on information discovery, such as tag-based clustering [25], hierarchical tag analysis [26], semantic distance measures [27], keyword clusters [28] and similarity-based rankings [29].
The main disadvantage of using multilayered, multidimensional networks for knowledge extraction is that layer aggregation and cross-layer analysis are often difficult to keep track of when dealing with many layers because of the different overlaps [30,31].
In the proposed methodology, aggregation and cross-layer analysis are performed with a logical description originating from an ontology, increasing the understandability of layer aggregation and analysis.
Figure 1 presents the most critical steps of network transformation in order. The first step is the discovery of the knowledge base and transformation of an LD dataset into a multidimensional network. In this step, the goal is to interpret the dataset by identifying entities and distinguishing between attributes and dimensions, which is important to keep the analysis transparent, without losing information. The second step enumerates the reachable properties in the network. Algorithmic tools such as RDF chain search [32] and querying property paths over distributed RDF datasets (QPPDs) [33] can be used in this step. In the methodology section, we describe a more efficient, network-focused method, developed specifically according to the nature of RDF datasets. Scanning and sampling an RDF dataset and performing analysis are often difficult tasks [34]. In addition to its large number of factors, such as different resources that may have different sets of properties, the properties themselves can be multi-valued (i.e., there can be triples in which the subject and predicate are the same but the objects are different); resources that may or may not have types [35] complicate the process even more, not to mention that the task is highly dependent on the platform, algorithm, dataset and underlying hardware. LD has its own toolsets for scanning and sampling tasks such as partitioning [36] and multi-indexing [37]. The more context-driven approaches to sampling and scanning are pattern recognition and statistics.
Frequent itemset mining (FIM) is also an option for statistical scanning, and it has been successfully carried out for synonymous property exploration [38], text extraction [32] and entity identification [39].
The frequent itemset mining can be performed based on the local database of the RDF triplets, which is the standard preprocessing and analysis procedure of LD [40], or the FIM can be performed in the cloud with the help of RDF Query Language (SPARQL)-based automatically generated queries [41].
Optional but important steps, layer selection and data enrichment, will be discussed in the next sections, as they are more subjective and situation dependent. They indicate the selection of layers for the multidimensional network based on sampling and the enrichment of the selected layers by other sources of information, respectively.
The final step represented in Figure 1—building the final, analysable, multidimensional network according to the previous sampling and decisions—is also carried out in the cloud by multiple systematic SPARQL queries. This step can be seen as a series of bipartite projections but is described in more detail in the next section.
The overall final step is ranking in the multilayer network, as ranking can be considered a translation of highly complex phenomena into short, simple messages that can be easily digested [42]. Ranking, however, not only describes, but also prescribes [43]; therefore, a very careful criteria selection method must be used. Ranking interconnections in the network has also been investigated for finding relevant relationships [44]. Network-based techniques are very understandable; according to a ranking [45] and with the inclusion of the statistically relevant layers, the relevant relationships are guaranteed. The aim of a complex knowledge exploration method in the LODC that takes into account the known hierarchies of the data (e.g., ontologies and taxonomies) as well as their interconnections is thereby achievable. Ultimately, the knowledge extraction performed in this way is a multicriteria, multi-objective ranking system, in contrast to single aspect rankings and ranking only by analysing the structure.
To test and demonstrate the applicability of our methodology, we use the Microsoft Academic Knowledge Graph (MAKG) [46] to investigate the scientific realms of climate change and sustainability. The discovery process also includes a ranking of authors and institutes. The multi-aspect ranking also includes the layer similarities, determining the similarities among research fields and their combinations, which act as the dimensions of the network. The MAKG describes research fields hierarchically. The specialisation of a layer can be determined by incrementing the number of elements in the itemset, interconnecting more disciplines or stepping downwards in the hierarchy tree. The incrementation of the specification yields a lower entity count and increased density and modularity. We inspect both layers and both types of community similarity to reveal and explore overlaps and gain insight into the specifics of climate change and sustainability.
According to the main contributions, the paper is organised as follows.
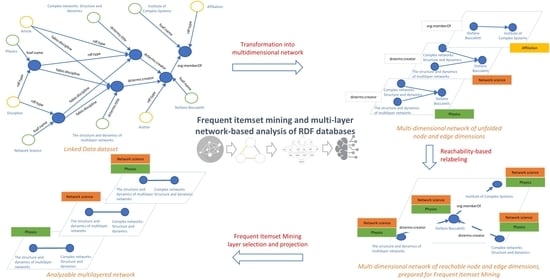
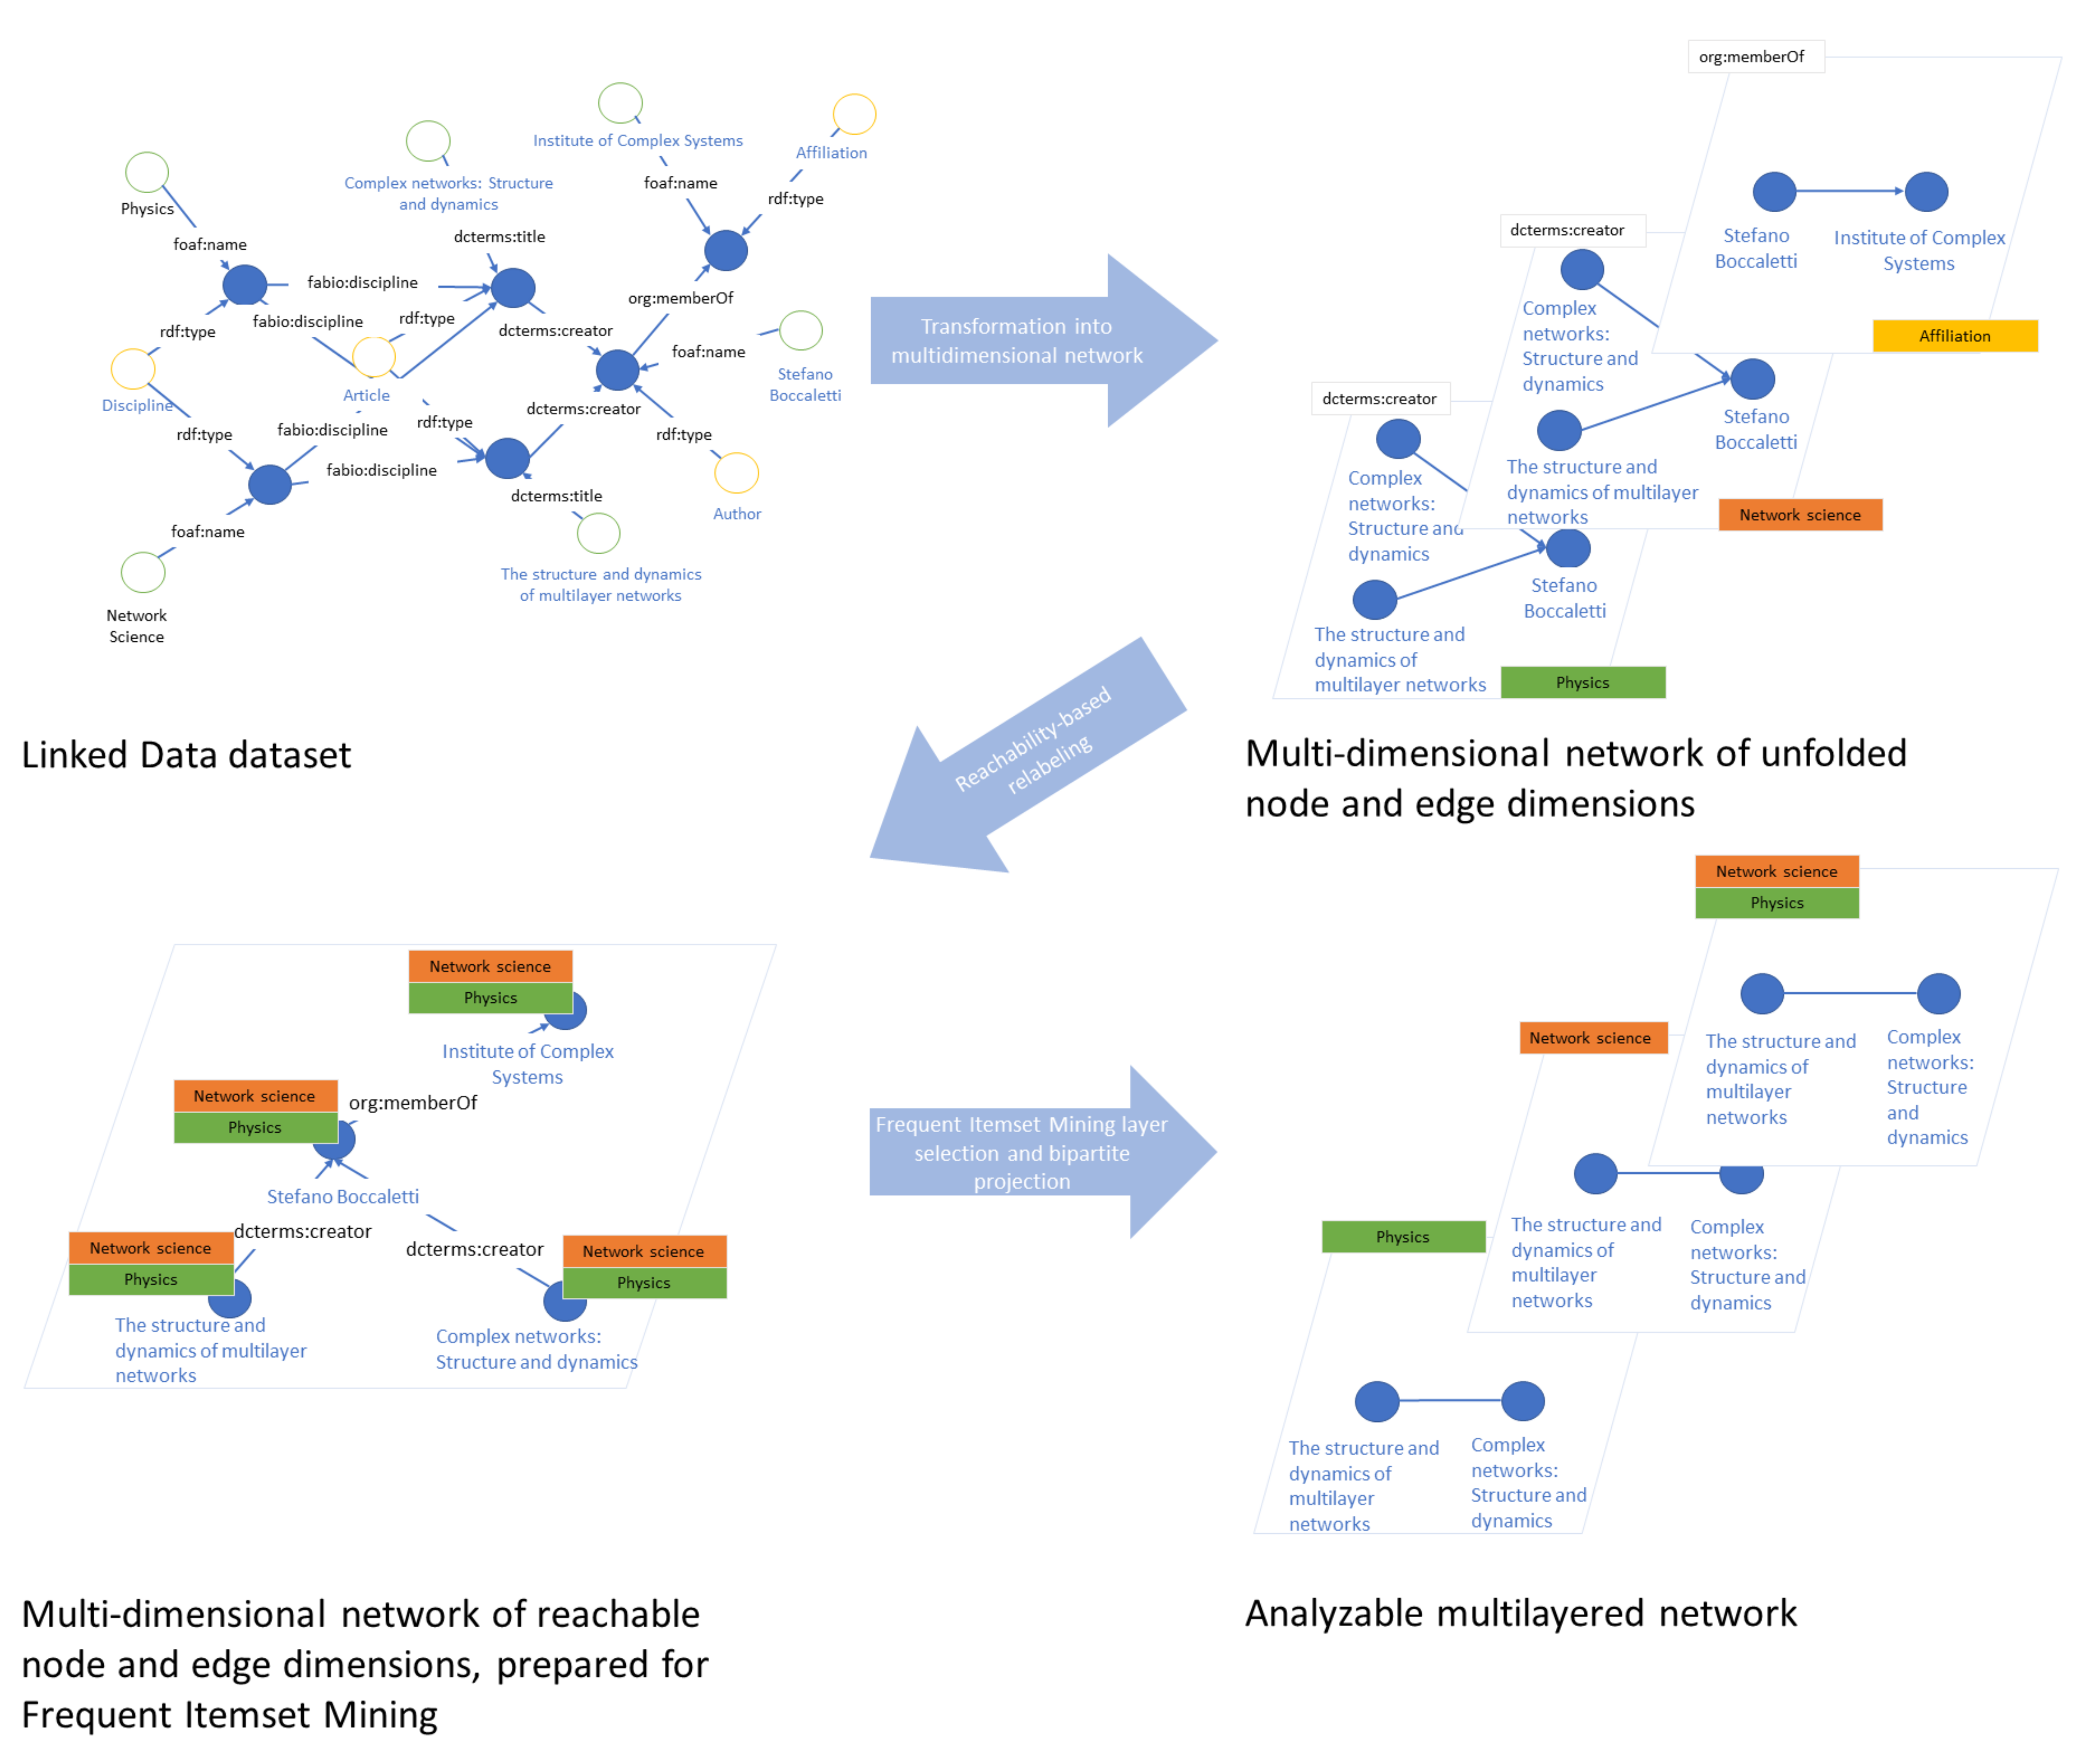
  • The RDF databases are represented as multidimensional networks in Section 2.
  • We propose a frequent itemset mining-based method to extract information from the multidimensional network in Section 3.
  • The resultant frequent itemsets of multidimensional networks can be represented as a multi-layer network that can be analysed by metrics presented in Section 4.
  • We present the methodology through an example in which we uncover the scientific realms of climate change and sustainability, including an alternative co-author, co-organisational network ranking used to measure the impact of authors in multiple disciplines in Section 5.

2. Multidimensional Network-Based Representation of RDF Databases

Linked Data can be seen as multiple interconnected datasets in RDF format. The atomic form of an LD dataset or an RDF dataset is the RDF triplet; “an object o has a relationship p with subject s”, can be seen as a single edge in a network that connects entities, nodes s and o, with a labelled attribute p. A good example is that Isaac Asimov (s) wrote (p) The Foundation (o).
The classic multi-dimensional networks are edge-labelled multi-graphs, which are described as G = ( V , E , D ) , where V represents the set of nodes, E the set of edges and D the set of dimensions. The set of edges can be described as connections between nodes (u and v) along a dimension (d). The set can be written as E = { ( u , v , d ) , u , v V , d D } .
The nodes in LD are often enriched by properties and descriptions. In the example, Isaac Asimov is both a person and a writer, and “The Foundation” is a fiction novel. These properties, such as “The Foundation” is “fiction”, are also described by triplets. These triplets can be merged into a simple node or skipped if they contain irrelevant pieces of information. These ontological properties often act as dimensions. Therefore, to simplify the ideas, the notation and ultimately the analysis, we extend the description of a dimension with two sets, the dimension of the nodes ( D V ) and the dimension of the edges ( D E ). The union of the sets results in the dimension set ( D V D U = D ). Then, the notation of the edges is described as E = { ( u , d u , v , d v , d e ) ; d e D E , d u , d v D V } , where u and v are the nodes as before and d u and d v are their dimensions, respectively; d e represents the dimension of the edge.
A multidimensional edge is represented as E = { ( u , v , D α ) ; D α D } , where D α refers to the simultaneously matching dimensions of both the node and edge dimensions D α = D α , V D α , E . This selection is a direct reference to a layer in a multiplex network G = { G α ; α { 1 , , M } } where G α = ( V α , E α , D α ) . The network G α is a network with α dimension selection, where the nodes V α and edges E α take the dimension nodes and edges of the selected dimensions D α , respectively. M corresponds to the number of created layers.
A multiplex network is a particular multidimensional network in which every layer contains every node and the cross-layer edges are identifier edges, which refer to the same cross-layer node. We use this notation, with the addition that not every layer will include every node; therefore, an activity check in a multiplex network—checking whether a node is connected or disconnected in a layer—will effectively be an existence check. Extending the multiplex notation with simultaneous dimension selection, we build the edges as E α = { ( u , v ) V × V ; ( u , v , D α ) E and D α | d u D α , u , d v D α , v , d e D α , e } , where D α , u , D α , v , and D α , e refer to simultaneously matching node and edge dimensions, respectively. Returning to the example of Asimov, dimension selection would work for the network of books with the simultaneous matching attributes “fiction” and “robots”. The expected result would be a network of books containing every book from the Elijah series, “The Caves of Steel” and “Robots and Empire” with the levels and dimensions of the important layer and non-layer constructing properties, such as the author “Isaac Asimov” and the main protagonist “R. Daneel Olivaw”. This means that the created network is explainable by the writer or the protagonist and of course the layer constructing properties “fiction” and “robots”.
The number of layers of a fully defined multilayer network is large if we consider n e = | D E | as the number of all edge dimensions and n v = | D V | as the number of node dimensions. Then, the number of possible dimensions is k = 1 n k n e k j = 1 n v n v j . However, the selection of significant layers is the key to reducing the space of the analysis. The previously introduced variable M as the number of layers refers to the number of selected layers.
The transactions can be extended with the environment and the reachable labels and properties in the RDF. The right side of Figure 2, G α ( 2 ) , takes the reachable tags into account.
The reachability states also enumerate all node attributes, and they take the neighbour attributes into account. Beyond the simple mapping of the dataset, they can also be used to extract information. In the example below, this means that Stefano inherits all attributes of the paper and his institute.
To examine the significant layer selection, we have to understand the reachability concept in the dataset.
To visualise reachability, Figure 2 represents the core idea. In Figure 2, G α represents an RDF dataset. It can be translated as stating that “The structure and dynamics of multilayer networks” ( v 1 ), which is a review article ( d v 1 ) in network science ( d v 2 ), is written by ( d e 1 ) Stefano Boccaletti ( v 2 ), who is a physicist ( d v 3 ). Stefano is affiliated with ( d e 2 ) the Institute for Complex Systems in Florence ( v 3 ), which is a research institution ( d v 5 ).
The presented procedure creates multi-links as well as networks for a given set of attributes. The procedure is similar to multidimensional network-based analysis methods, where RDF databases were analysed in thematic dimensions [47]. The bipartite network-based analysis of RDF datasets has also been proven useful [7]. Bipartite networks are excellent to study the connections of two sets of objects. However, for multi-objective analysis, a more complex model representation is needed, which motivates the development of our method that forms sets of layers of networks where the layers represent significant subsets of the dimensions of the RDF model. According to this, the next step of the proposed method is selecting these significant sets of dimensions, which will be presented in the following section.

3. Frequent Itemset Mining in Multidimensional Networks

Frequent itemset mining (FIM) is a mining technique used to uncover frequent correlations in transactional datasets [48]. We can consider the itemset I = { I 1 , , I n e + n v } in the case of the FIM representing the products; in the LD, the itemset represents the dimensions D = { d 1 , d 2 , , d n e + n v } , or more specifically, the labels of the RDF. A transaction is defined as τ = ( t i d , X ) , where t i d is the transaction identifier and X is a set of items over I ( X I ). The database is the set of all transactions P = { τ 1 , τ 2 , , τ n } . The support of an itemset is equal to the count of the constellation of dimensions.
As stated before, we are interested in significant layers. We measure significance with the support of the itemsets. The set F = [ α , , M ] holds the frequent itemsets. The support of an itemset is s u p p ( F α ) = | { τ i | F α τ i , τ i P } | ; the support of a layer ( G α ) is equal to its edge count s u p p ( G α ) = | E α | . G α is frequent if s u p p ( G α ) m i n s u p p , where minsupp is a chosen threshold. Summarising G α is frequent if s u p p ( G α ) m i n s u p p . F α is called a closed or frequent closed itemset if there exists no proper superset of it that cannot be extended by any dimensional data without losing support. Table 1 shows the technique and its multidimensional counterpart.
An effective representation of the layer selection in a multidimensional network is the multi-link. Multi-link m is an enumeration of the selected layers: m = [ m α , m β , , m M ] T . We can now introduce the multi-adjacency matrix ( A m ), with elements a i j m that are equal to 1 if there is a link between node i and node j, and zero otherwise [31].
a i j m = α = 1 M [ a i j α m α + ( 1 a i j α ) ( 1 m α ) ]
Thus, multi-adjacency matrices satisfy the condition m a i j m = 1 . The enumeration of the layers where nodes are active can serve as the input to most of the frequent itemset algorithms, as they effectively represent the itemsets. The methodology works with any FIM algorithm, including CHARM [49], FPclose [50] and FP-Growth [51]; for an exhaustive list, see the work of Chee, which also studies the scalability of FIM algorithms [52].

4. Analysis of the Resulted Multilayer Network

The union—the logical aggregation of layers—can be best expressed by the overlapping edges [31] ( O α , β ).
G γ = G α G β , O α , β = s u p p ( G γ ) O α β = i < j a i j α a i j β ,
where G γ is the layer formed by combining G α and G β , and where a i j α expresses a simple edge in layer α connecting the nodes i and j. The count of the overlapping edges corresponds to the support of the combined layer. The aggregated layers are also frequent, as every subset of a frequent itemset is frequent [48]. Logically aggregating the layers is also an efficient technique in data discovery.
In the upcoming example of author networks, authors interact on the layer of climatology, on the layers of climatology and meteorology, and in every other layer. In this case, it is difficult to keep track of all the different types of multi-links. Therefore, we can calculate the multiplicity of the overlap v i j between nodes i and j, which indicates the total number of layers in which the two nodes are connected.
v i j = α = 1 M a i j α = α = 1 M m i j α ,
where the nodes i and j are linked by the multi-link m = m i j . In weighted multidimensional networks, the weights might be correlated with the structure in a nontrivial way. To study the weights, there are two new measures: the multi-strength ( s i , α m ) and the inverse multi-participation ratio ( Y i , α m ) [53],
s i , α m = j = 1 N a i j α a i j m ,
Y i , α m = j = 1 N a i j α a i j m r a i r α a i r m 2 .
The multi-strength ( s i , α m ) measures the total weight of the links incident to node i in layer α that form a multi-link. The inverse multi-participation ratio ( Y i , α m ) is a measure of the inhomogeneity of the weights of the nodes that are incident to node i in layer α and are also part of the corresponding multi-link. Thus far, we have covered some indicators for multidimensional activities, which are very useful for dealing with many layers. The final step of knowledge extraction is ranking. Before turning to the ranking, we recall that the density, modularity and other structural measures are very different from layer to layer.
Therefore, for each node, we can write an N x M activity matrix ( B ) of elements b i , α , indicating whether node n i is present in layer α :
b i , α = n i G α .
In this way, we can measure the number of layers where i is present and active [30] as
b i = α = 1 M b i , α .
Additionally, the number of nodes present and active in a layer can be given by N α :
N α = i = 1 N b i , α .
The correlation between layers can be given by Q α , β , quantifying the fraction of nodes that are present in layer α as well as in layer β .
Q α , β = 1 N i = 1 N b i , α b i , β .
A straightforward ranking in a network is obtained by calculating the centralities of the nodes, reflecting their importance from different viewpoints. In multidimensional networks, the most common centrality measure is to calculate the centralities of each layer and finally aggregate them according to certain weights [31]. Both the aggregation (maximum selection, minimum selection, summation, etc.) and the centrality measure used depend on the interpretation
θ i = α M w α θ i α ,
where θ i α is the calculated centrality measure of node i in layer α and w α indicates the importance of layer α .
Now that the methodology has been described, the next section demonstrates the applicability of the methodology.

5. Results

The programs of the following case study are available at the github (https://github.com/abonyilab/aprioriSPARQL (accessed on 15 January 2021)) and the raw dataset is available on the Microsoft Academic Knowledge Graph homepage (http://ma-graph.org/rdf-dumps/ (accessed on 15 January 2021)) as well as the SPARQL endpoint (http://ma-graph.org/sparql (accessed on 15 January 2021)). The goal of this demonstration is to showcase knowledge extraction from vast linked data. Therefore, we selected the LOD catalogue for scientific publications from Microsoft, the MAKG [46]. The MAKG itself contains definitions for 209,792,741 papers and 253,641,783 authors, in RDF terms, more than eight billion triplets. The papers are categorised into 229,716 fields of studies. For the relevant results, we selected the date range 2010 to 2017; the catalogue was last updated in late 2018 [46]. Our aim was to study the realms of sustainability and climate change based on the MAKG dataset, and on the other hand to showcase the importance of the proper focus to not get lost at scale, the applied frequent itemset mining pinpoints and keeps understandable the important areas of the data.
The first test on the dataset is reachability, to discover how to treat the dataset, which is better formulated as, what are the dimensions that we can analyse? For example, in the catalogue, the authors can be connected to universities, research organisations and industrial laboratories. Therefore, the dataset describes the connections from rdf:type Article to rdf:type FieldOfStudy through the connection of fabio:hasDiscipline. The previously mentioned article connects to an rdf:type Author through the connection of dcterms:creator. Reaching the rdf:type Affiliation, an org:memberOf connection is needed.
An rdf:type Affiliation can be connected to an external data source, the Global Research Identifier Database (GRID), to extend the affiliations with the geo-coordinates, regions, establishment dates, etc. Therefore, regional and institutional categorisation could be one aspect of the data. Another, more straightforward analysis is the analysis of the author network. The articles are sorted into multiple categories (rdf:type FieldOfStudy) according to the hierarchical ontology created by the MAKG. The ontology contains five levels of depth: the top level—level zero—is the major category (e.g., mathematics, medicine, engineering, chemistry, etc.), and the next levels are their descendants, the more specialised categories (e.g., nuclear medicine, applied mathematics, etc.). We take the ontology elements and the constellation of the ontology elements as the layers or dimensions of the network. Going downwards in the ontology, increasing the specification of a layer also increases the density of the layer. Not every paper is categorised into as many matching ontology elements as possible. Therefore, the lower levels—three, four and five—are ignored, and the density does not increase. However, it is true that the more specialised a layer is, the denser it becomes, even for horizontal extensions of layers, meaning the extension of an element to another element that is on the same ontological level.
In this paper, we focus on sustainability science and climate change. Therefore, we choose the ontological element “Climatology” as the starting point for our analysis to observe the advancements and analyse the social background of humanity’s major problem, climate change. We also restrict ourselves to analysing only the author and organisation networks within the second ontological level, which is easy to understand and sophisticated enough to investigate. Now that we have a rough idea about what we want to do, we execute FIM on the dataset to sample it from multiple angles. With this technique, we want to uncover significant dimensions for the analysis and common constellations of disciplines that go hand-in-hand with the previously selected ontology element, “Climatology”. For discovery, we propose to load and execute FIM on the whole data space, as the linked data are large on average.
In this study, the a priori FIM algorithm was used on the offline dump of the RDF database and SPARQL-based queries were utilised for the validation of the results.
FIM was executed on a low setting, with a minimum support of five, to probe the dataset, which means the selected timescale (2010–2018), in order to have slightly less than one article per year in the given frequent constellation of the field of studies. Figure 3 shows the FIM results. The results also show the optimal minimum support of 10, which is also selected for the next steps, where is a significant drop in small itemsets, but not as significant as in the longer itemsets. The lack of longer itemsets is due to the categorisation of the field of study in the dataset, as an article is categorised into 1.52 fields of study, on average, in the second ontological level. The other ontological levels have much the same statistics: 1.01 on the first (top) level, 3.18 on the third, 1.75 on the fourth, 1.32 on the fifth and 1.31 on the sixth.
A length of one for the itemset indicates that climatology can be connected with another ontology element; two indicates that it can be connected with two other elements, and three with three, while still reaching the minimum support. No more extensions than three reach the minimum support. The choice could be made here to set the minimum support to a lower position, less than five, or we could be satisfied with the choice and the count of networks, in this case, 665. This is quite a manageable size of networks, and it is also worth mentioning that the edge count of the networks is approximately 5000.
The next step is the network creation of authors and organisations on the layers. If the layers do not have enough nodes, then they significantly influence the ranking; therefore, our selection requirement for a layer is at least 40 different contributors, and that for edge formation is at least two contributions between organisations and one for authors where prescribed, based on the correlation measures between the layers (Equation (9)). Figure 4 shows the similarities between the layers using the edge overlap metric.
In Figure 4, the darker a region is, the more similar the layers are. The dendrograms on the edge of the figure show the distances between the networks. We see that the extensions of the layers are clustered together as well as similar studies. The top left segment of the figure, including meteorology, atmospheric sciences, hydrology, oceanography, ecology and geomorphology, shows the starting points for the extensions. Those are the closest fields to climatology, which also have the most substantial support from FIM. We can also observe different views; for example, the cluster in the middle, containing agroforestry, environmental planning, economics, soil science and environmental engineering, is formed around the economic side of climatology. The cluster in the bottom right, including remote sensing combined with meteorology, artificial intelligence and mathematical optimisation, is formed around computer-based observations and modelling. A natural question about these clusters is, why are there not more extensions? Remote sensing and artificial intelligence would be a perfect match. There are such extensions, but their support is below the minimum support. The support of artificial intelligence itself is small, 482. Artificial intelligence and remote sensing together have the support of 44 papers from 2010 to 2018; however, their node count is below the selected minimum node count (10 for country networks; 40 for organisation and author networks). The other combinations show the same phenomena.
Table 2 shows the important metrics of the significant institutional layers: the number of nodes, number of edges, density, modularity and average clustering coefficient. The average clustering coefficient represents the likelihood that two neighbours of a node are connected, while modularity informs us about the community structure of the network. The higher the modularity is, the more community-centred the graph. We see here that the more specific a layer is, the more community-centred, and the higher its modularity. This can be seen in atmospheric sciences by extending it with geophysics. The modularity of atmospheric sciences is 0.2989, while the extended layer modularity is 0.9436. The same phenomena can be found in all other layers and their extensions, which means that more specific layers and disciplines are owned by more interconnected communities.
Figure 5 shows the multilayer visualisation of (1) atmospheric sciences, (2) meteorology and (3) their interconnection, giving insight into the data. For this visualisation, enrichment of the data was needed to locate the research institutions on the map. The enrichment was performed with the GRID. Not every research institution could be mapped into the GRID, and therefore the unmapped research institutions are not counted in the country-level aggregation; however, this does not influence the overall ranking. With enrichment, we can easily observe the clusters both inside a country and across countries. For example, the USA, Canada, China and Austria are strong clusters. In layer (1), atmospheric sciences, the USA contributes 84,201 papers, with 3400 co-contributions with Canada, 2444 with Australia and 1952 with China. Layer (2), meteorology, shows the same trend of the USA dominating the discipline with 43,981 papers; however, for the co-contributions, Canada is third with 582 papers, there are 688 China–USA contributions and in first place, there are 1086 Australian–USA contributions. The greatest contribution to the interconnected layer is (3), atmospheric sciences and meteorology: the USA has 10,183 contributions, and China is second with a total of 809 contributions. The USA mostly contributes to the discipline with Canada, with 200 individual papers. The rest of the contributions are with Australia, 118, and China, 86, and there are very small amounts with Chile, Japan, Taiwan and Norway.
The following rankings are based on these insights into the data. The multilayer representation clearly shows that the more specialised a topic is, the fewer contributors there are, but the more connected they are. The aggregated networks are denser with a higher modularity, as observed previously. The next artefact of knowledge extraction is the ranking. For the ranking, we calculate the importance of a country, institution and author with the multilayer eigenvector centrality (Equation (10)).
The ranking mostly depends on the layers in which an entity (country, organisation or author) takes part. This is why a strong minimum support and minimum node count are needed for the analysis; otherwise, the very specialised layers will dominate, with very few nodes, which have a very high rank. Therefore, we can use weightings according to the correlations of the layers and the nodes, as described in the methodology section, or other subjective criteria to balance the sparseness of the very specific layers. The top list is represented in Table 3. Next to the ordering in the table, the most important layer column shows where the organisation or author obtained the highest rank, and the “Agg. eigen. centr.” column shows the aggregated eigenvalue centrality of the entity. With the aid of this toolset, we can observe specific connections between research areas and pinpoint research constellations describing sectors. The multi-aspect ranking provides the flexibility to take significant topics into account and refine the ranking. The different metrics are the searchlights of importance and focus.
Table 4 compares the publication count-based ranks in sustainability science and climate change with the multidimensional network-based ranking. The selected topics are the subset of the FIM-selected topics presented in Table 2. The Chinese Academy of Sciences has the most publications in sustainability science and climate change, has the most publications in most of the layers and it is also highly cooperative, and therefore it occupies the first place for the Academy. In the comparison, we see that interestingly the National Oceanic and Atmospheric Administration is very highly ranked; however, the publication count in the shown layers predicts it otherwise. The Administration is highly embedded into the any Oceanic (e.g., Fishery) and Atmospheric sciences (e.g., Remote Sensing and Geophysics), as the name would predict. Thanks to the substantial co-operations of the institute, this organisation plays a central role in sustainability science and climate change, which would not be highlighted in classical analysis techniques.

6. Discussion and Conclusions

Our work contributes to the knowledge extraction of linked data. It also contributes to the notation of multidimensional networks by extending the nodes with dimensions, in contrast to the formal labelled network notation. This extension is useful in high-dimensional data analysis, such as for linked open data, as the nodes are often extended with hierarchical properties and ontologies. The extraction of useful data is validated with on-demand, online, iterative SPARQL-based sampling of the dataset with frequent itemset mining.
We demonstrated the applicability of the methodology through an interesting scientometric example, co-author and co-organisation rankings in sustainability and climate change. The source of the analysis was the linked open database of the Microsoft Academic Knowledge Graph. We discovered multidisciplinary science boards using the proposed multidimensional network-based approach. We showed similarities between disciplines and the layers of the network. We also discovered that the aggregation of the layers in a multidimensional network does not always result in the loss of information, and in contrast, the aggregation of the layers results in denser, more modular information. Finally, we ranked authors and organisations with multidimensional centrality rankings and showed where sustainability and climate change are major research topics and who and which organisations are the main contributors.
The proposed methodology generates a compact and interpretable multilayered network from a linked dataset or another multidimensional network. The methodology is applicable when there are a large number of edge and node labels, with the current reference to eight billion triplets, the dataset of the Microsoft Academic Knowledge Graph. The scalability of the methodology is not limited, however, it is more an engineering challenge, than a research objective. The most time- and memory-consuming operation is the Frequent Itemset Mining, where serious advancement were already made by GPU acceleration [54], Hadoop-based partitioning [55] and Spark-based parallelism [56]. The endpoint capabilities limit the scalability of the FIM against the SPARQL endpoint; as it can be seen, for an Application Programming Interface communication its parallelism and effective scalability have already been proven by all modern web browsers.
With the aid of the proposed methodology and toolset, we can observe, select and analyse particular connections between entities in linked data, taking ontological dimensions and specific properties into account. The multi-aspect ranking provides the flexibility to refine the ranking, while the other proposed tools act as searchlights of focus to interpret a whole set of linked data, with all its extensions and possible enrichments.

Author Contributions

Conceptualisation, G.H. and J.A.; methodology, G.H. and J.A.; software, G.H. and J.A.; validation, G.H. and J.A.; formal analysis, G.H. and J.A.; investigation, G.H. and J.A.; resources, G.H. and J.A.; data curation, G.H. and J.A.; writing—original draft preparation, G.H. and J.A.; writing—review and editing, G.H. and J.A.; visualisation, G.H. and J.A.; supervision, J.A.; project administration, J.A.; funding acquisition, J.A. All authors have read and agreed to the published version of the manuscript.

Funding

This research was funded by the National Laboratory for Climate Change (NKFIH-872 project) and supported by the TKP2020-NKA-10 project financed under the 2020-4.1.1-TKP2020 Thematic Excellence Programme by the National Research, Development and Innovation Fund of Hungary.

Institutional Review Board Statement

Not applicable.

Informed Consent Statement

Not applicable.

Data Availability Statement

Publicly available datasets were analyzed in this study. This data can be found here: http://ma-graph.org/rdf-dumps/ (accessed on 15 January 2021).

Conflicts of Interest

The authors declare no conflict of interest.

References

  1. Musto, C.; Narducci, F.; Lops, P.; de Gemmis, M.; Semeraro, G. Linked open data-based explanations for transparent recommender systems. Int. J. Hum. Comput. Stud. 2019, 121, 93–107. [Google Scholar] [CrossRef]
  2. Gayo, J.E.L.; Jeuring, J.; Rodríguez, J.M.Á. Inductive representations of RDF graphs. Sci. Comput. Program. 2014, 95, 135–146. [Google Scholar] [CrossRef]
  3. Elzein, N.M.; Majid, M.A.; Hashem, I.A.T.; Yaqoob, I.; Alaba, F.A.; Imran, M. Managing big RDF data in clouds: Challenges, opportunities, and solutions. Sustain. Cities Soc. 2018, 39, 375–386. [Google Scholar] [CrossRef]
  4. Klyne, G.; Carroll, J.J.; McBride, B. RDF 1.1 Concepts and Abstract Syntax. 2014. Available online: https://www.w3.org/TR/rdf11-concepts (accessed on 25 February 2014).
  5. Hayes, J.; Patel-Schneider, P.F. RDF 1.1 Semantics. Available online: https://www.w3.org/TR/rdf11-mt (accessed on 25 February 2014).
  6. Papadaki, M.E.; Spyratos, N.; Tzitzikas, Y. Towards Interactive Analytics over RDF Graphs. Algorithms 2021, 14, 34. [Google Scholar] [CrossRef]
  7. Hayes, J.; Gutierrez, C. Bipartite graphs as intermediate model for RDF. In Proceedings of the International Semantic Web Conference, Hiroshima, Japan, 7–11 November 2004; Springer: Berlin/Heidelberg, Germany, 2004; pp. 47–61. [Google Scholar]
  8. Shadbolt, N.; Berners Lee, T.; Hall, W. The semantic web revisited. IEEE Intell. Syst. 2006, 21, 96–101. [Google Scholar] [CrossRef] [Green Version]
  9. Decker, S.; Melnik, S.; Van Harmelen, F.; Fensel, D.; Klein, M.; Broekstra, J.; Erdmann, M.; Horrocks, I. The semantic web: The roles of XML and RDF. IEEE Internet Comput. 2000, 4, 63–73. [Google Scholar] [CrossRef]
  10. Kalampokis, E.; Zeginis, D.; Tarabanis, K. On modeling linked open statistical data. J. Web Semant. 2019, 55, 56–68. [Google Scholar] [CrossRef]
  11. Shadbolt, N.; O’Hara, K. Linked data in government. IEEE Internet Comput. 2013, 17, 72–77. [Google Scholar] [CrossRef] [Green Version]
  12. Callahan, A.; Cruz-Toledo, J.; Ansell, P.; Dumontier, M. Bio2RDF release 2: Improved coverage, interoperability and provenance of life science linked data. In Proceedings of the Extended Semantic Web Conference, Montpellier, France, 26–30 May 2013; Springer: Berlin/Heidelberg, Germany, 2013; pp. 200–212. [Google Scholar]
  13. Jentzsch, A.; Zhao, J.; Hassanzadeh, O.; Cheung, K.H.; Samwald, M.; Andersson, B. Linking Open Drug Data. In Proceedings of the I-Semantics, the 5th International Conference on Semantic Systems, Graz, Austria, 2–4 September 2009; pp. 1–4. [Google Scholar]
  14. Cimiano, P.; Chiarcos, C.; McCrae, J.P.; Gracia, J. Representing Annotated Texts as RDF. In Linguistic Linked Data; Springer: Berlin/Heidelberg, Germany, 2020; pp. 61–87. [Google Scholar]
  15. Ermilov, I.; Martin, M.; Lehmann, J.; Auer, S. Linked open data statistics: Collection and exploitation. In Proceedings of the International Conference on Knowledge Engineering and the Semantic Web, St. Petersburg, Russia, 7–9 October 2013; Springer: Berlin/Heidelberg, Germany, 2013; pp. 242–249. [Google Scholar]
  16. Marie, N.; Gandon, F. Survey of linked data based exploration systems. In Proceedings of the IESD 2014—Intelligent Exploitation of Semantic Data, Riva del Garda, Italy, 20 October 2014; pp. 1–13. [Google Scholar]
  17. Fensel, D.; Van Harmelen, F.; Horrocks, I.; McGuinness, D.L.; Patel-Schneider, P.F. OIL: An ontology infrastructure for the semantic web. IEEE Intell. Syst. 2001, 16, 38–45. [Google Scholar] [CrossRef]
  18. Barabasi, A.l.; Frangos, J. Linked: The New Science of Networks; American Association of Physics Teachers: College Park, MD, USA, 2002. [Google Scholar]
  19. Zou, L.; Özsu, M.T. Graph-based RDF data management. Data Sci. Eng. 2017, 2, 56–70. [Google Scholar] [CrossRef] [Green Version]
  20. Gil, R.; García, R.; Delgado, J. Measuring the semantic web. AIS SIGSEMIS Bull. 2004, 1, 69–72. [Google Scholar]
  21. Bellomi, F.; Bonato, R. Network analysis for Wikipedia. In Proceedings of the Wikimania, Frankfurt am Main, Germany, 4–8 August 2005. [Google Scholar]
  22. Mika, P. Flink: Semantic web technology for the extraction and analysis of social networks. Web Semant. Sci. Serv. Agents World Wide Web 2005, 3, 211–223. [Google Scholar] [CrossRef] [Green Version]
  23. Soriano-Morales, E.P.; Ah-Pine, J.; Loudcher, S. Hypergraph Modelization of a Syntactically Annotated English Wikipedia Dump. In Proceedings of the International Conference on Language Resources and Evaluation (LREC 2016), Portoroz, Slovenia, 23–28 May 2016. [Google Scholar]
  24. Palla, G.; Farkas, I.J.; Pollner, P.; Derényi, I.; Vicsek, T. Fundamental statistical features and self-similar properties of tagged networks. New J. Phys. 2008, 10, 123026. [Google Scholar] [CrossRef]
  25. Pollner, P.; Palla, G.; Vicsek, T. Clustering of tag-induced subgraphs in complex networks. Phys. A Stat. Mech. Its Appl. 2010, 389, 5887–5894. [Google Scholar] [CrossRef] [Green Version]
  26. Palla, G.; Tibély, G.; Mones, E.; Pollner, P.; Vicsek, T. Hierarchical networks of scientific journals. Palgrave Commun. 2015, 1, 15016. [Google Scholar] [CrossRef] [Green Version]
  27. Passant, A. Measuring Semantic Distance on Linking Data and Using it for Resources Recommendations. In Proceedings of the AAAI spring symposium: Linked Data Meets Artificial Intelligence, Stanford, CA, USA, 22–24 March 2010; Volume 77, p. 123. [Google Scholar]
  28. Sadasivam, G.S.; Saranya, K.; Karrthik, K. Hypergraph-based Wikipedia search with semantics. Int. J. Web Sci. 2013, 2, 66–79. [Google Scholar] [CrossRef]
  29. Mirizzi, R.; Ragone, A.; Di Noia, T.; Di Sciascio, E. Ranking the Linked Data: The Case of DBpedia. In Proceedings of the International Conference on Web Engineering, Vienna, Austria, 5–9 July 2010; Springer: Berlin/Heidelberg, Germany, 2010; pp. 337–354. [Google Scholar]
  30. Nicosia, V.; Latora, V. Measuring and modeling correlations in multiplex networks. Phys. Rev. E 2015, 92, 032805. [Google Scholar] [CrossRef] [Green Version]
  31. Boccaletti, S.; Bianconi, G.; Criado, R.; Del Genio, C.I.; Gómez-Gardenes, J.; Romance, M.; Sendina-Nadal, I.; Wang, Z.; Zanin, M. The structure and dynamics of multilayer networks. Phys. Rep. 2014, 544, 1–122. [Google Scholar] [CrossRef] [Green Version]
  32. Huang, Z.; Chen, H.; Yu, T.; Sheng, H.; Luo, Z.; Mao, Y. Semantic text mining with linked data. In Proceedings of the 2009 Fifth International Joint Conference on INC, IMS and IDC, Seoul, Korea, 25–27 August 2009; pp. 338–343. [Google Scholar]
  33. Mehmood, Q.; Saleem, M.; Sahay, R.; Ngomo, A.C.N.; D’Aquin, M. QPPDs: Querying Property Paths Over Distributed RDF Datasets. IEEE Access 2019, 7, 101031–101045. [Google Scholar] [CrossRef]
  34. Iosup, A.; Hegeman, T.; Ngai, W.L.; Heldens, S.; Prat-Pérez, A.; Manhardto, T.; Chafio, H.; Capotă, M.; Sundaram, N.; Anderson, M.; et al. LDBC Graphalytics: A benchmark for large-scale graph analysis on parallel and distributed platforms. Proc. VLDB Endow. 2016, 9, 1317–1328. [Google Scholar] [CrossRef] [Green Version]
  35. Papadaki, M.E.; Tzitzikas, Y.; Spyratos, N. Analytics over RDF Graphs. Commun. Comput. Inf. Sci. 2020, 1197, 37–52. [Google Scholar]
  36. Zheng, Z.Y.; Wang, C.Y.; Ding, Y.; Li, L.; Li, D. Research on partitioning algorithm based on RDF graph. Concurr. Comput. Pract. Exp. 2019, 5600–5612. [Google Scholar] [CrossRef]
  37. Mailis, T.; Kotidis, Y.; Nikolopoulos, V.; Kharlamov, E.; Horrocks, I.; Ioannidis, Y. An efficient index for RDF query containment. In Proceedings of the 2019 International Conference on Management of Data, Amsterdam, The Netherlands, 30 June–5 July 2019; pp. 1499–1516. [Google Scholar]
  38. Morzy, M.; Ławrynowicz, A.; Zozuliński, M. Using substitutive itemset mining framework for finding synonymous properties in linked data. In Lecture Notes in Computer Science (Including Subseries Lecture Notes in Artificial Intelligence and Lecture Notes in Bioinformatics); Springer: Berlin/Heidelberg, Germany, 2015; Volume 9202, pp. 422–430. [Google Scholar]
  39. Boytcheva, S.; Angelova, G.; Angelov, Z.; Tcharaktchiev, D.; Vodenicharov, V. Enrichment of EHR with linked open data for risk factors identification. In Proceedings of the 20th International Conference on Computer Systems and Technologies (CompSysTech’19), Ruse, Bulgaria, 21–22 June 2019; pp. 84–90. [Google Scholar]
  40. Harth, A.; Hose, K.; Karnstedt, M.; Polleres, A.; Sattler, K.U.; Umbrich, J. Data Summaries for On-Demand Queries over Linked Data. In Proceedings of the 19th International Conference on World Wide Web, Raleigh, NC, USA, 26–30 April 2010; pp. 411–420. [Google Scholar]
  41. WSW Group. SPARQL 1.1 Overview. 2013. Available online: https://www.w3.org/TR/sparql11-overview (accessed on 21 March 2013).
  42. Hertig, H.P. Universities, Rankings and the Dynamics of Global Higher Education. Perspectives from Asia, Europe and North America; Springer: Berlin/Heidelberg, Germany, 2016. [Google Scholar] [CrossRef]
  43. Erkkila, T.; Piironen, O. Rankings and Global Knowledge Governance: Higher Education, Innovation and Competitiveness; Springer: Berlin/Heidelberg, Germany, 2018. [Google Scholar]
  44. Aleman-Meza, B.; Halaschek-Weiner, C.; Arpinar, I.B.; Ramakrishnan, C.; Sheth, A.P. Ranking complex relationships on the semantic web. IEEE Internet Comput. 2005, 9, 37–44. [Google Scholar] [CrossRef] [Green Version]
  45. Park, J.; Barabási, A.L. Distribution of node characteristics in complex networks. Proc. Natl. Acad. Sci. USA 2007, 104, 17916–17920. [Google Scholar] [CrossRef] [Green Version]
  46. Färber, M. The Microsoft Academic Knowledge Graph: A Linked Data Source with 8 Billion Triples of Scholarly Data. In Proceedings of the International Semantic Web Conference, Auckland, New Zealand, 26–30 October 2019; Springer: Berlin/Heidelberg, Germany, 2019; pp. 113–129. [Google Scholar]
  47. Ferrara, A.; Genta, L.; Montanelli, S.; Castano, S. Dimensional clustering of linked data: Techniques and applications. In Transactions on Large-Scale Data-and Knowledge-Centered Systems XIX; Springer: Berlin/Heidelberg, Germany, 2015; pp. 55–86. [Google Scholar]
  48. Agrawal, R.; Srikant, R. Fast Algorithms for Mining Association Rules. In Proceedings of the 20th International Conference Very Large Data Bases (VLDB), Santiago de Chile, Chile, 12–15 September 1994; Volume 1215, pp. 487–499. [Google Scholar]
  49. Zaki, M.J.; Hsiao, C.J. CHARM: An Efficient Algorithm for Closed Itemset Mining. In Proceedings of the 2002 SIAM International Conference on Data Mining (SIAM), Arlington, VA, USA, 11–13 April 2002; pp. 457–473. [Google Scholar]
  50. Grahne, G.; Zhu, J. Fast algorithms for frequent itemset mining using FP-Trees. IEEE Trans. Knowl. Data Eng. 2005, 17, 1347–1362. [Google Scholar] [CrossRef]
  51. Han, J.; Pei, J.; Yin, Y.; Mao, R. Mining Frequent Patterns without Candidate Generation: A Frequent-Pattern Tree Approach. Data Min. Knowl. Discov. 2004, 8, 53–87. [Google Scholar] [CrossRef]
  52. Chee, C.H.; Jaafar, J.; Aziz, I.A.; Hasan, M.H.; Yeoh, W. Algorithms for frequent itemset mining: A literature review. Artif. Intell. Rev. 2019, 52, 2603–2621. [Google Scholar] [CrossRef] [Green Version]
  53. Menichetti, G.; Remondini, D.; Panzarasa, P.; Mondragón, R.J.; Bianconi, G. Weighted multiplex networks. PLoS ONE 2014, 9, e97857. [Google Scholar] [CrossRef] [Green Version]
  54. Zhang, F.; Zhang, Y.; Bakos, J. Gpapriori: Gpu-accelerated frequent itemset mining. In Proceedings of the 2011 IEEE International Conference on Cluster Computing, Austin, TX, USA, 26–30 September 2011; pp. 590–594. [Google Scholar]
  55. Xun, Y.; Zhang, J.; Qin, X.; Zhao, X. FiDoop-DP: Data Partitioning in Frequent Itemset Mining on Hadoop Clusters. IEEE Trans. Parallel Distrib. Syst. 2017, 28, 101–114. [Google Scholar] [CrossRef]
  56. Joy, R.; Sherly, K.K. Parallel frequent itemset mining with spark RDD framework for disease prediction. In Proceedings of the 2016 International Conference on Circuit, Power and Computing Technologies (ICCPCT), Nagercoil, India, 18–19 March 2016; pp. 1–5. [Google Scholar] [CrossRef]
Figure 1. Workflow of the proposed network transformation steps towards an analysable multidimensional network from a linked data dataset.
Mathematics 09 00450 g001
Figure 2. Example of frequent slicing and an application of reachability. G α is the starting network in a non-directed format. G α ( 2 ) is the set of attributes reachable from G α .
Mathematics 09 00450 g002
Figure 3. Counts of frequent itemsets by length and minimum support.
Mathematics 09 00450 g003
Figure 4. Organisational cluster map in the realm of climatology, showing how similar the disciplines are according to their networks of organisations.
Mathematics 09 00450 g004
Figure 5. Multilayer institutional network aggregated at the country level from the atmospheric sciences and meteorology layers and the extension of them, atmospheric sciences—meteorology.
Mathematics 09 00450 g005
Table 1. Summary of the frequent itemset mining (FIM) technique notation and its multidimensional counterpart.
Frequent Itemset MiningMulti-Dimensional Network
Items I = { I 1 , , I n e + n v }
The products, in traditional FIM
D = { d 1 , d 2 , , d n e + n v }
The labels of the RDF
Transactions τ i = { t i d , X }
Set of items
A node with extended reachable tags
Database P = { τ 1 , τ 2 , , τ m }
all transactions
The enriched dataset
SupportNumber of itemset occurrences s u p p ( F α ) = | { τ i | F α τ i , τ i P } |
Frequent itemset F α τ i if s u p p ( F α ) m i n s u p p s u p p ( F α ) m i n s u p p
Table 2. Layer metrics of the institutional network.
Network_Layer_ResolverNo.NodesNo.EdgesDensityNo.ClustersModularityAvg.Clustering_Coefficient
Agroforestry2082510.01171740.95920.0011
Agronomy891200.0306700.92780.0029
Algorithm501180.0963330.72310.0582
Artificial intelligence55580.0391530.97380.0063
Atmospheric sciences128514,2170.01723600.29580.0011
Atmospheric sciences|Geophysics1682130.01521300.94310.0016
Atmospheric sciences|Meteorology63823320.01152480.60230.0034
Atmospheric sciences|Oceanography45480.0485420.96790.0000
Atmospheric sciences|Remote sensing44560.0592350.86160.0056
Botany67720.0326630.97800.0029
Cartography47520.0481420.96080.0000
Ecology99943700.00884360.50010.0020
Ecology|Fishery58610.0369550.97660.0000
Ecology|Geomorphology66720.0336600.97760.0000
Ecology|Oceanography2394010.01411400.86440.0064
Econometrics1261410.01791120.98500.0032
Environmental chemistry78920.0306660.96980.0077
Environmental engineering2082310.01071860.98840.0005
Environmental planning1842000.01191690.98930.0011
Environmental protection861230.0337770.86060.0308
Environmental resource management2012600.01291670.92910.0047
Fishery2483850.01261710.90850.0061
Fishery|Oceanography71960.0386560.90150.0132
Forestry991070.0221910.98230.0000
Genetics971170.0251820.96540.0110
Geodesy71800.0322620.97530.0000
Geomorphology114858500.00893680.48770.0010
Geomorphology|Geophysics55630.0424470.94990.0000
Geomorphology|Hydrology2543630.01131860.93750.0020
Geomorphology|Oceanography2915110.01211600.86140.0080
Geomorphology|Paleontology781010.0336600.95560.0256
Geophysics50310130.00802860.77330.0030
Geophysics|Oceanography42460.0534380.96310.0000
Hydrology112828930.00465370.70270.0008
Hydrology|Meteorology3094110.00862320.95480.0023
Mathematical optimisation60620.0350580.98070.0000
Meteorology190492990.00517880.50960.0005
Meteorology|Oceanography2213200.01321680.87690.0017
Meteorology|Remote sensing75840.0303660.96910.0000
Oceanography116476170.01133700.39720.0022
Palaeontology1451790.01711190.96270.0075
Remote sensing4487390.00743040.87330.0015
Seismology891010.0258780.97560.0023
Soil science1282170.02671000.81410.0074
Statistics2753140.00832460.98130.0013
Water resource management66990.0462560.83160.0210
Table 3. Leaderboards of the top 5 institutes and authors contributing to climatology.
Organisation Leaderboard
RankNameMost Important in LayerAgg. Eigen. Centr.
1The United States of America (USA)Artificial intelligence|Pattern recognition56.0279
2China (CHN)Agroforestry|Hydrology35.6429
3Australia (AUS)Economy33.0746
4Canada (CAN)Thermodynamics24.4631
5United Kingdom of Great Britain (GBR)Environmental protection23.2615
Organisation Leaderboard
RankNameMost Important in LayerAgg. Eigen. Centr.
1Chinese Academy of SciencesGeodesy24.1449
2National Oceanic and Atmospheric AdministrationMeteorology|Remote sensing5.0147
3National Center for Atmospheric ResearchEconometrics3.3779
4French National Centre for Scientific ResearchEcology|Oceanography2.9609
5Alfred Wegener Institute for Polar and Marine ResearchGeomorphology|Oceanography2.0770
Individual Leaderboard
RankNameMost Important in LayerAgg. Eigen. Centr.
1Vijay P. SinghHydrology1.4517
2Hai ChengGeomorphology1.2189
3R. Lawrence EdwardsGeomorphology1.0049
4Colin SchultzMeteorology|Oceanography1.0005
5Qiang ZhangGeomorphology|Hydrology0.8854
Table 4. Comparison between the ranks based on the publication count in sustainability science and climate change and the multi-objective rank created by the multidimensional network.
Publication Count Based Ranks
OrganizationMulti-Objective RankGlobal RankHydrologyEcologyPaleontologyGeophysics
Chinese Academy of Sciences1111310
National Oceanic and Atmospheric Administration276755157339
National Center for Atmospheric Research3177133840255828
French National Centre for Scientific Research424322
Alfred Wegener Institute for Polar and Marine Research519729187166135
Russian Academy of Sciences6942644
Potsdam Institute for Climate Impact Research7132340710613521921
California Institute of Technology837715713073
Goddard Space Flight Center971147827652637551
Wageningen University and Research Centre10441624560835
Beijing Normal University11227182411083684
Lamont-Doherty Earth Observatory1240939666731035
Ocean University of China13380345399617326
United States Forest Service1411133107181084
International Institute for Applied Systems Analysis1593953784732403085
Publisher’s Note: MDPI stays neutral with regard to jurisdictional claims in published maps and institutional affiliations.

