
Reliable Learning with PDE-Based CNNs and DenseNets for Detecting COVID-19, Pneumonia, and Tuberculosis from Chest X-Ray Images

 , ,
, ,  , , , and
Abstract
1. Introduction
2. Materials and Methods
2.1. Theoretical Aspects for PDE Inspired Neural Networks
2.2. Compiling the Dataset
2.2.1. Collecting COVID-19 X-Rays
- Patients in evolution. Especially for the cases extracted from Radiopaedia, there are several X-rays done for the same patient in different stages of the disease: from the moment when they were admitted into the hospital to the moment when the symptoms improved. On one hand, this is quite useful in order to see whether the learned model could also predict the disease severity. On the other hand, all the X-rays are annotated as COVID-19, including the ones from the end of the monitoring.
- Train/test split. Having several X-rays for the same patient requires extra care at splitting into train/test set. X-rays from the same patient should not be included both in the train and test set.
2.2.2. Collecting Pneumonia X-Rays
2.2.3. Collecting Tuberculosis X-Rays
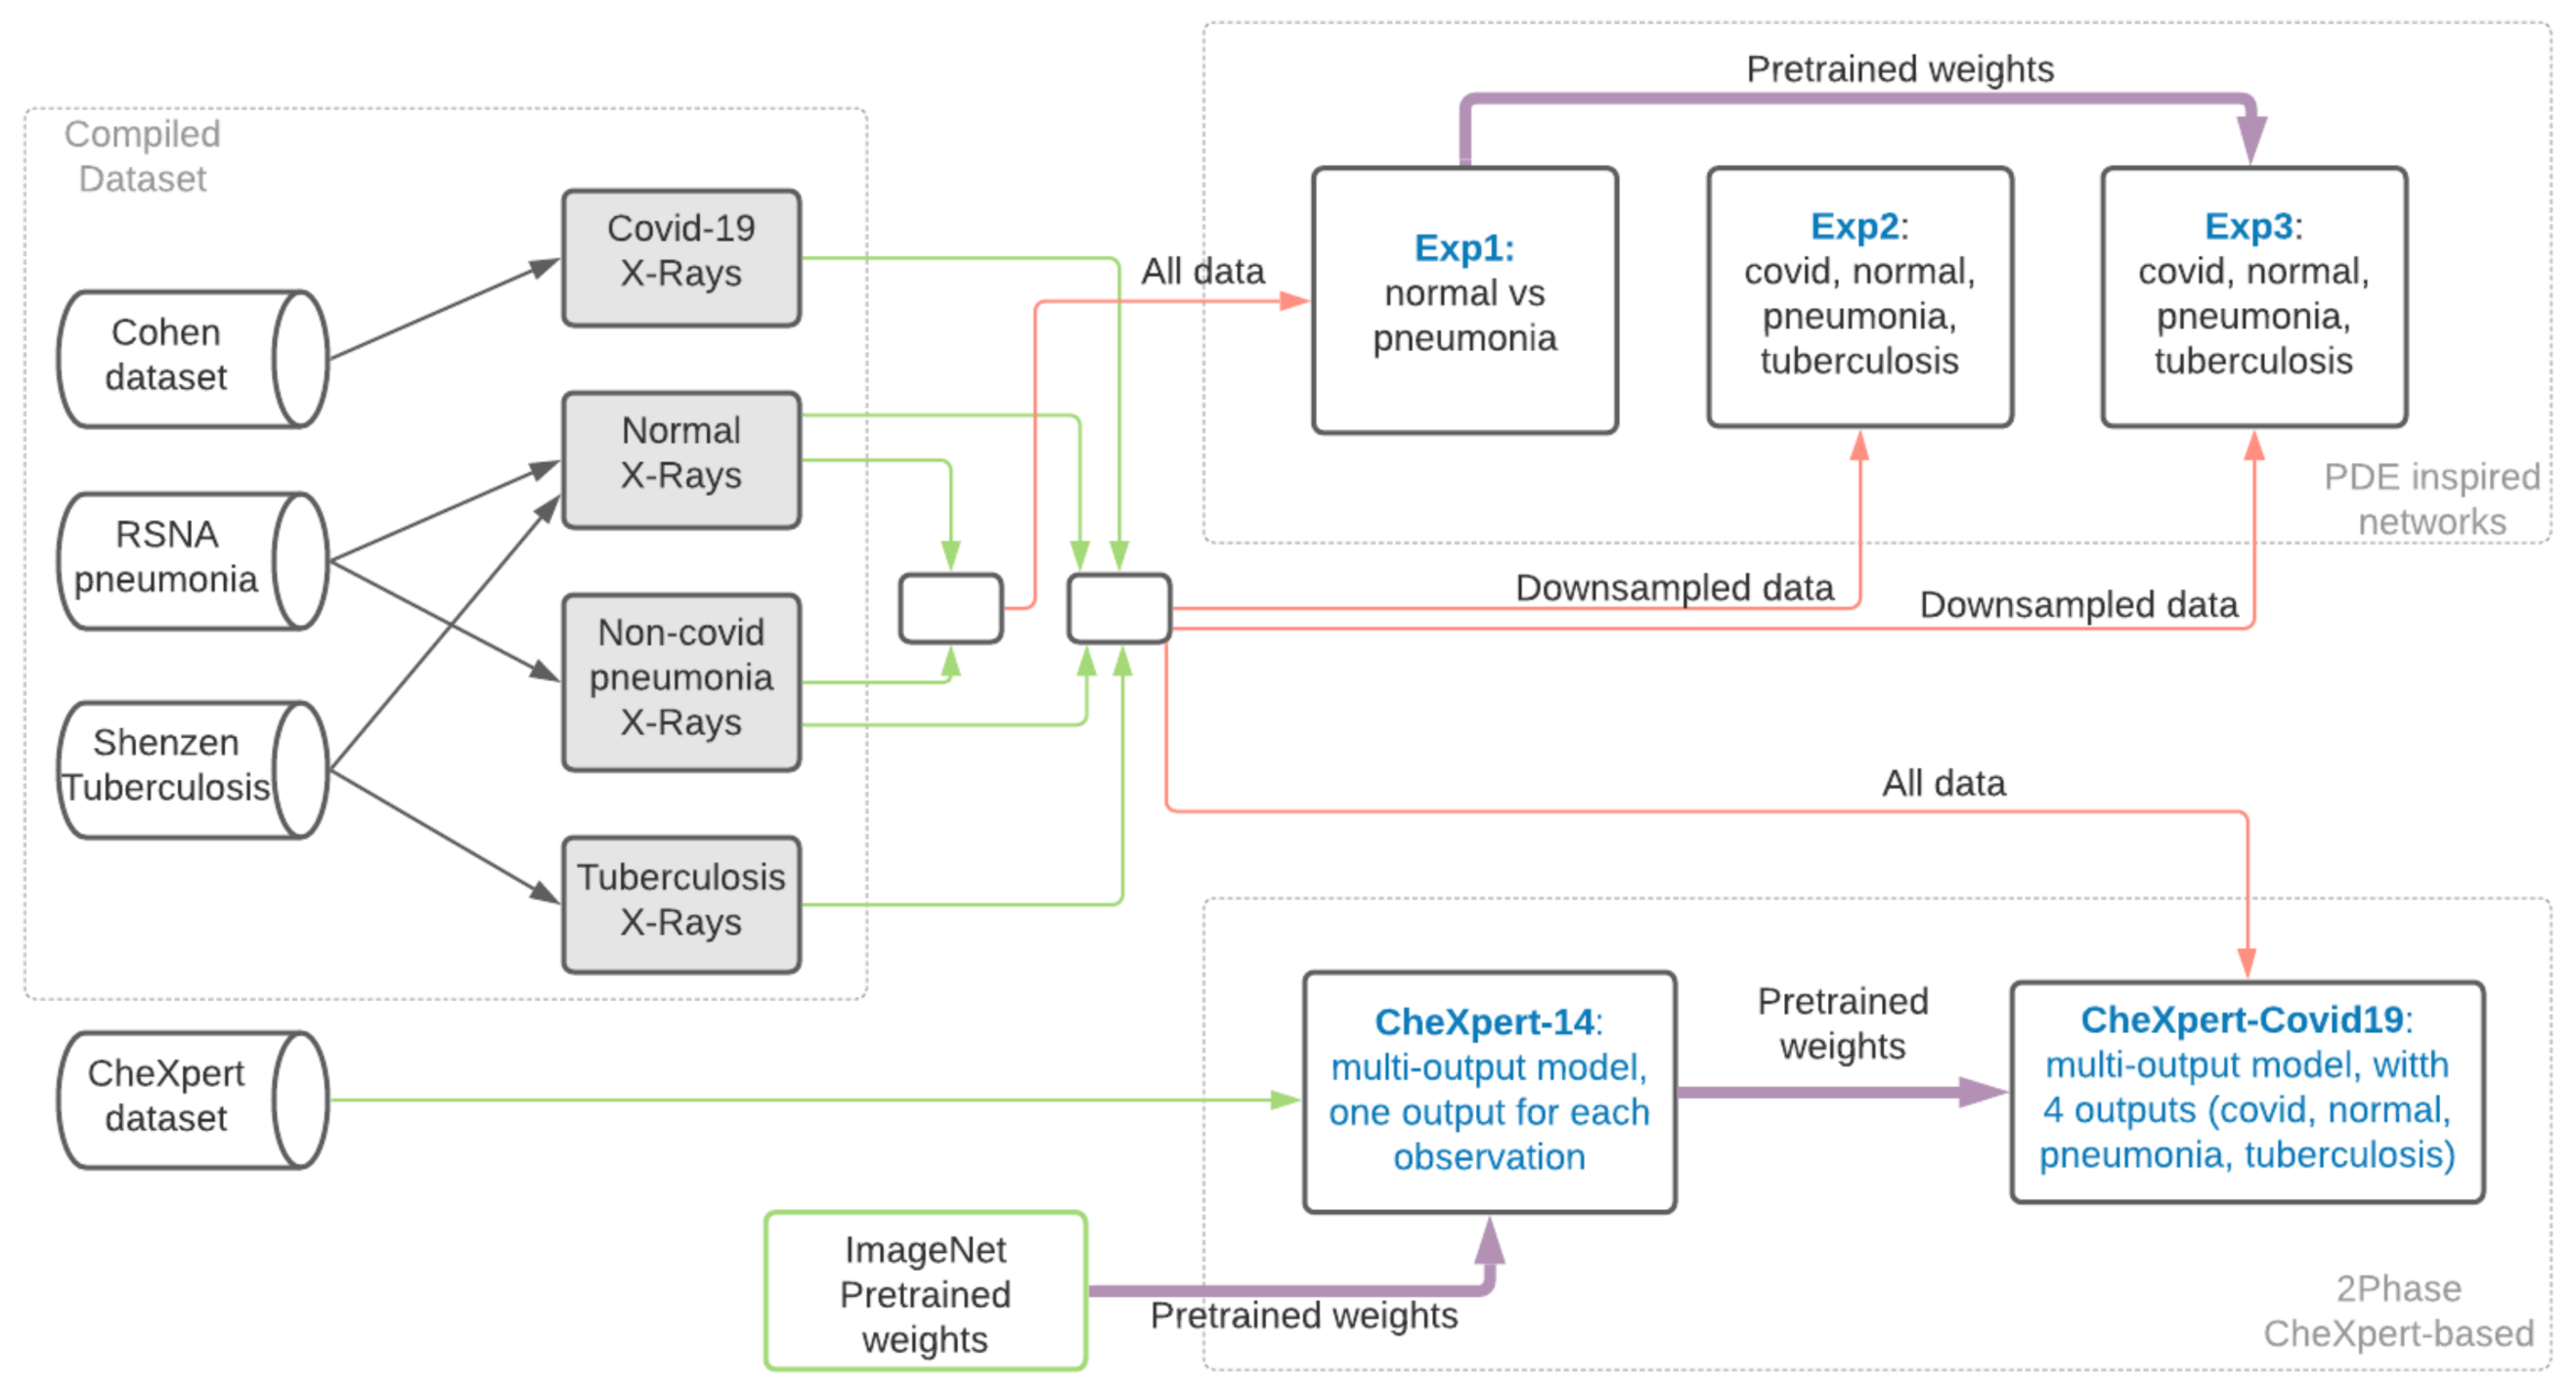
2.3. Method
- Which are the classes we should compare COVID-19 to in order to learn to identify COVID-19 from X-rays?
- Which data source should we use for the selected classes?
- What kind of architectures and learning should we use?
3. Experiments and Results
3.1. Experiments with PDE Inspired CNNs
- —train only for the two classes (i.e., normal and pneumonia) for which the number of images is larger than 1000.
- —train for all four classes, but with downsampling of the normal and pneumonia classes.
- —similar to , but instead of starting from the random weights, we start from the weights obtained in .
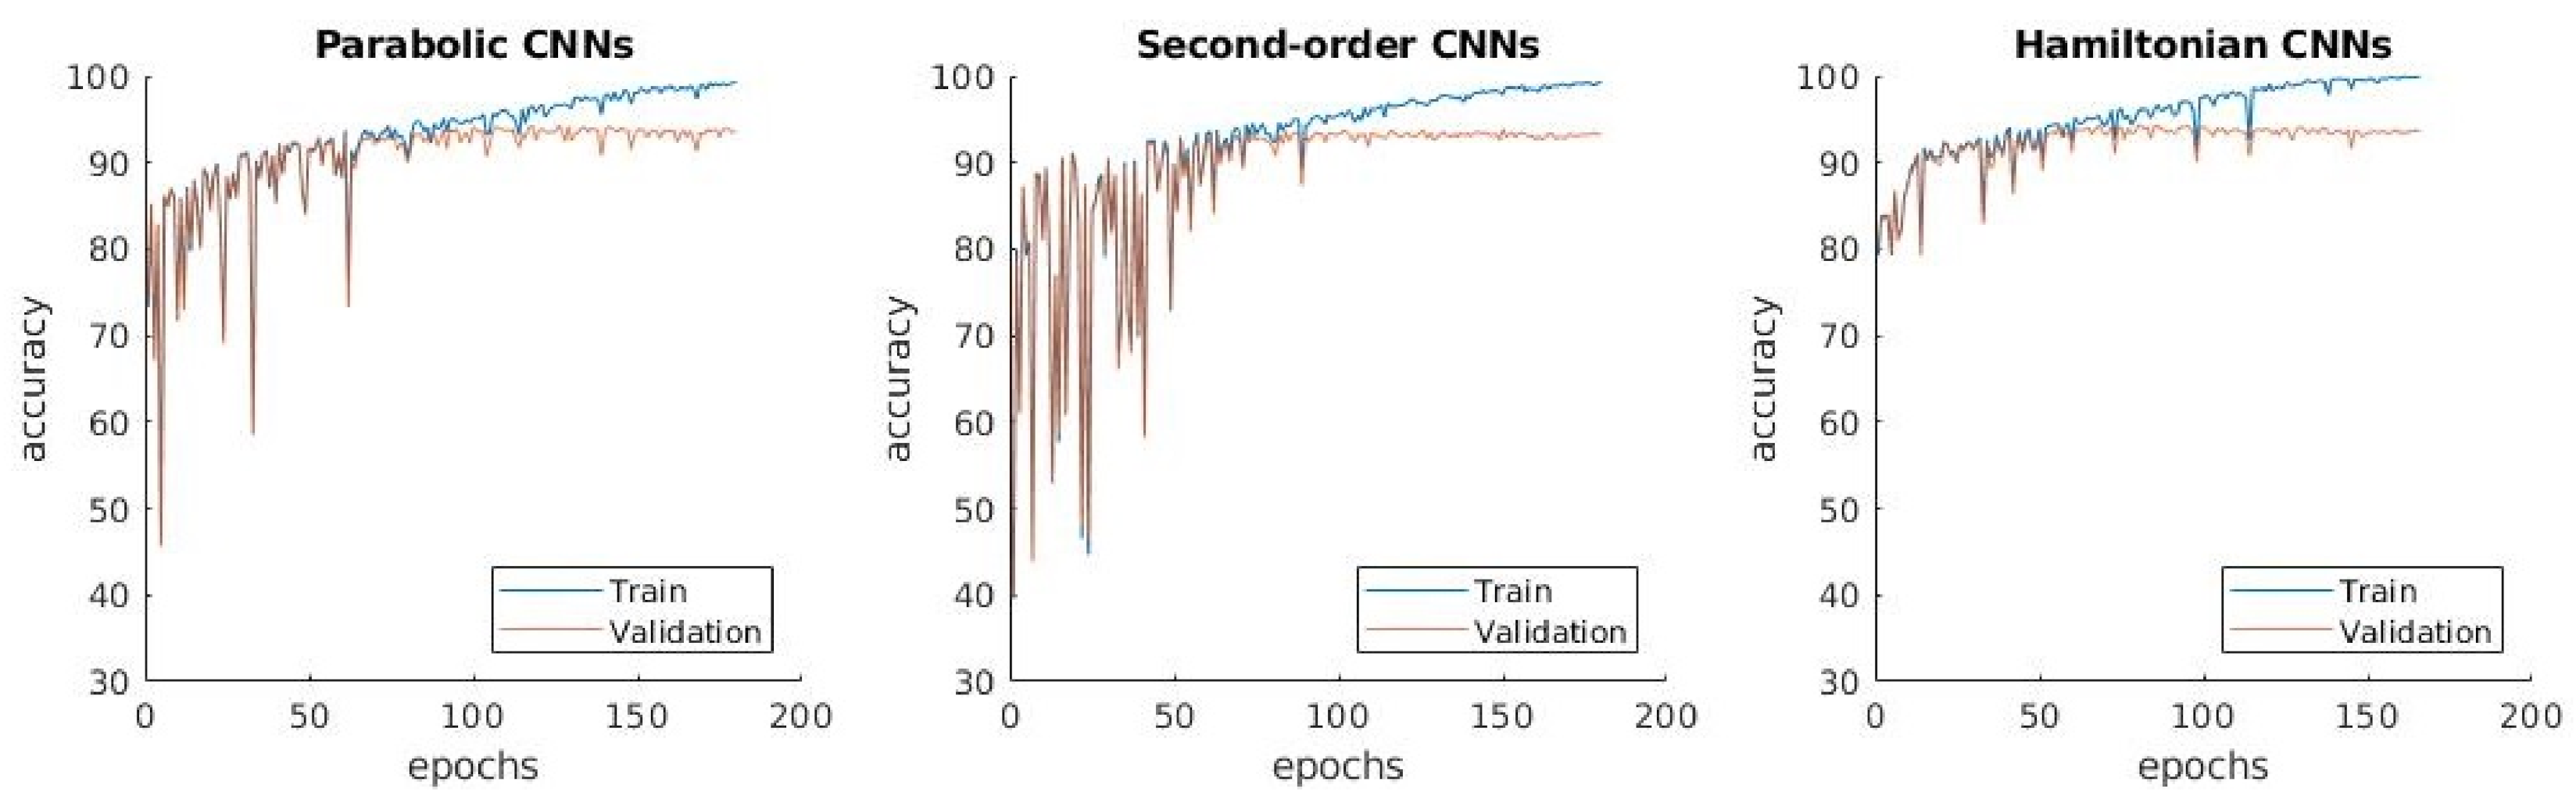
3.1.1. : Distinguishing between Normal and Pneumonia X-Ray Images
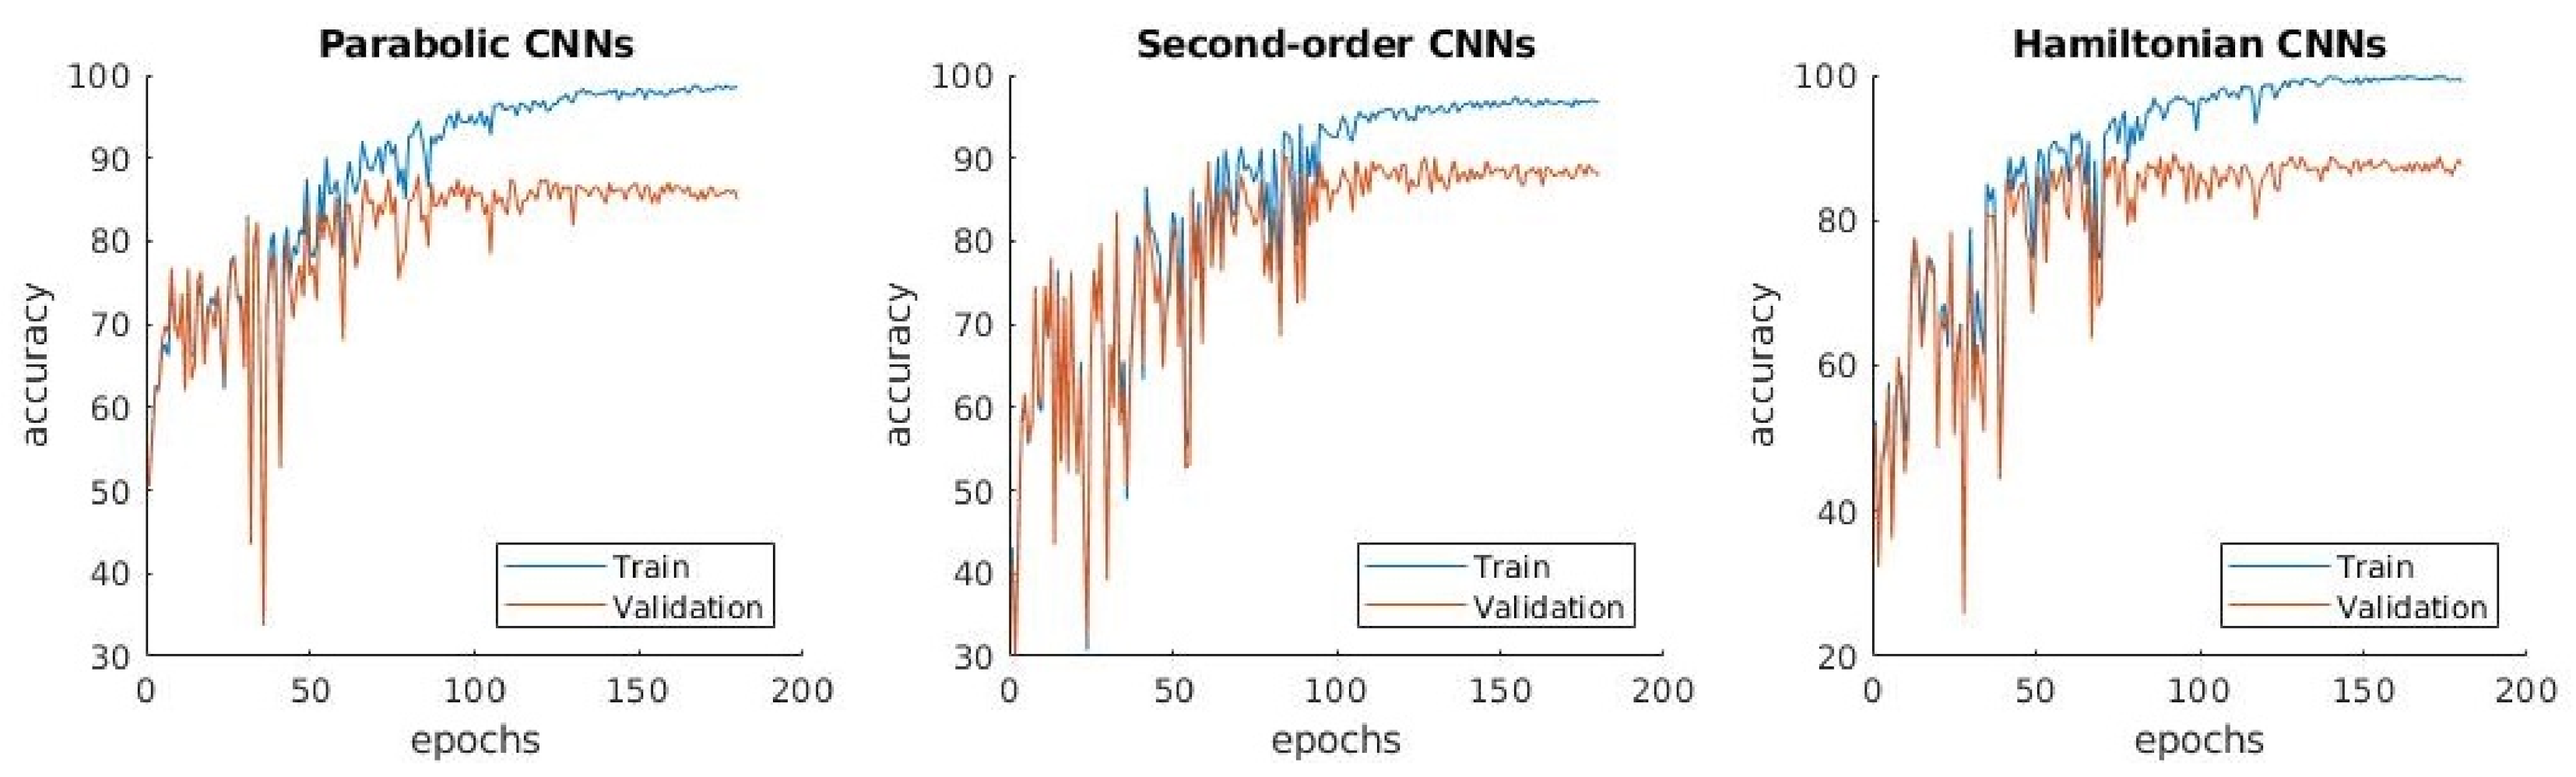
3.1.2. : Distinguishing between Normal, Pneumonia, Tuberculosis and COVID-19
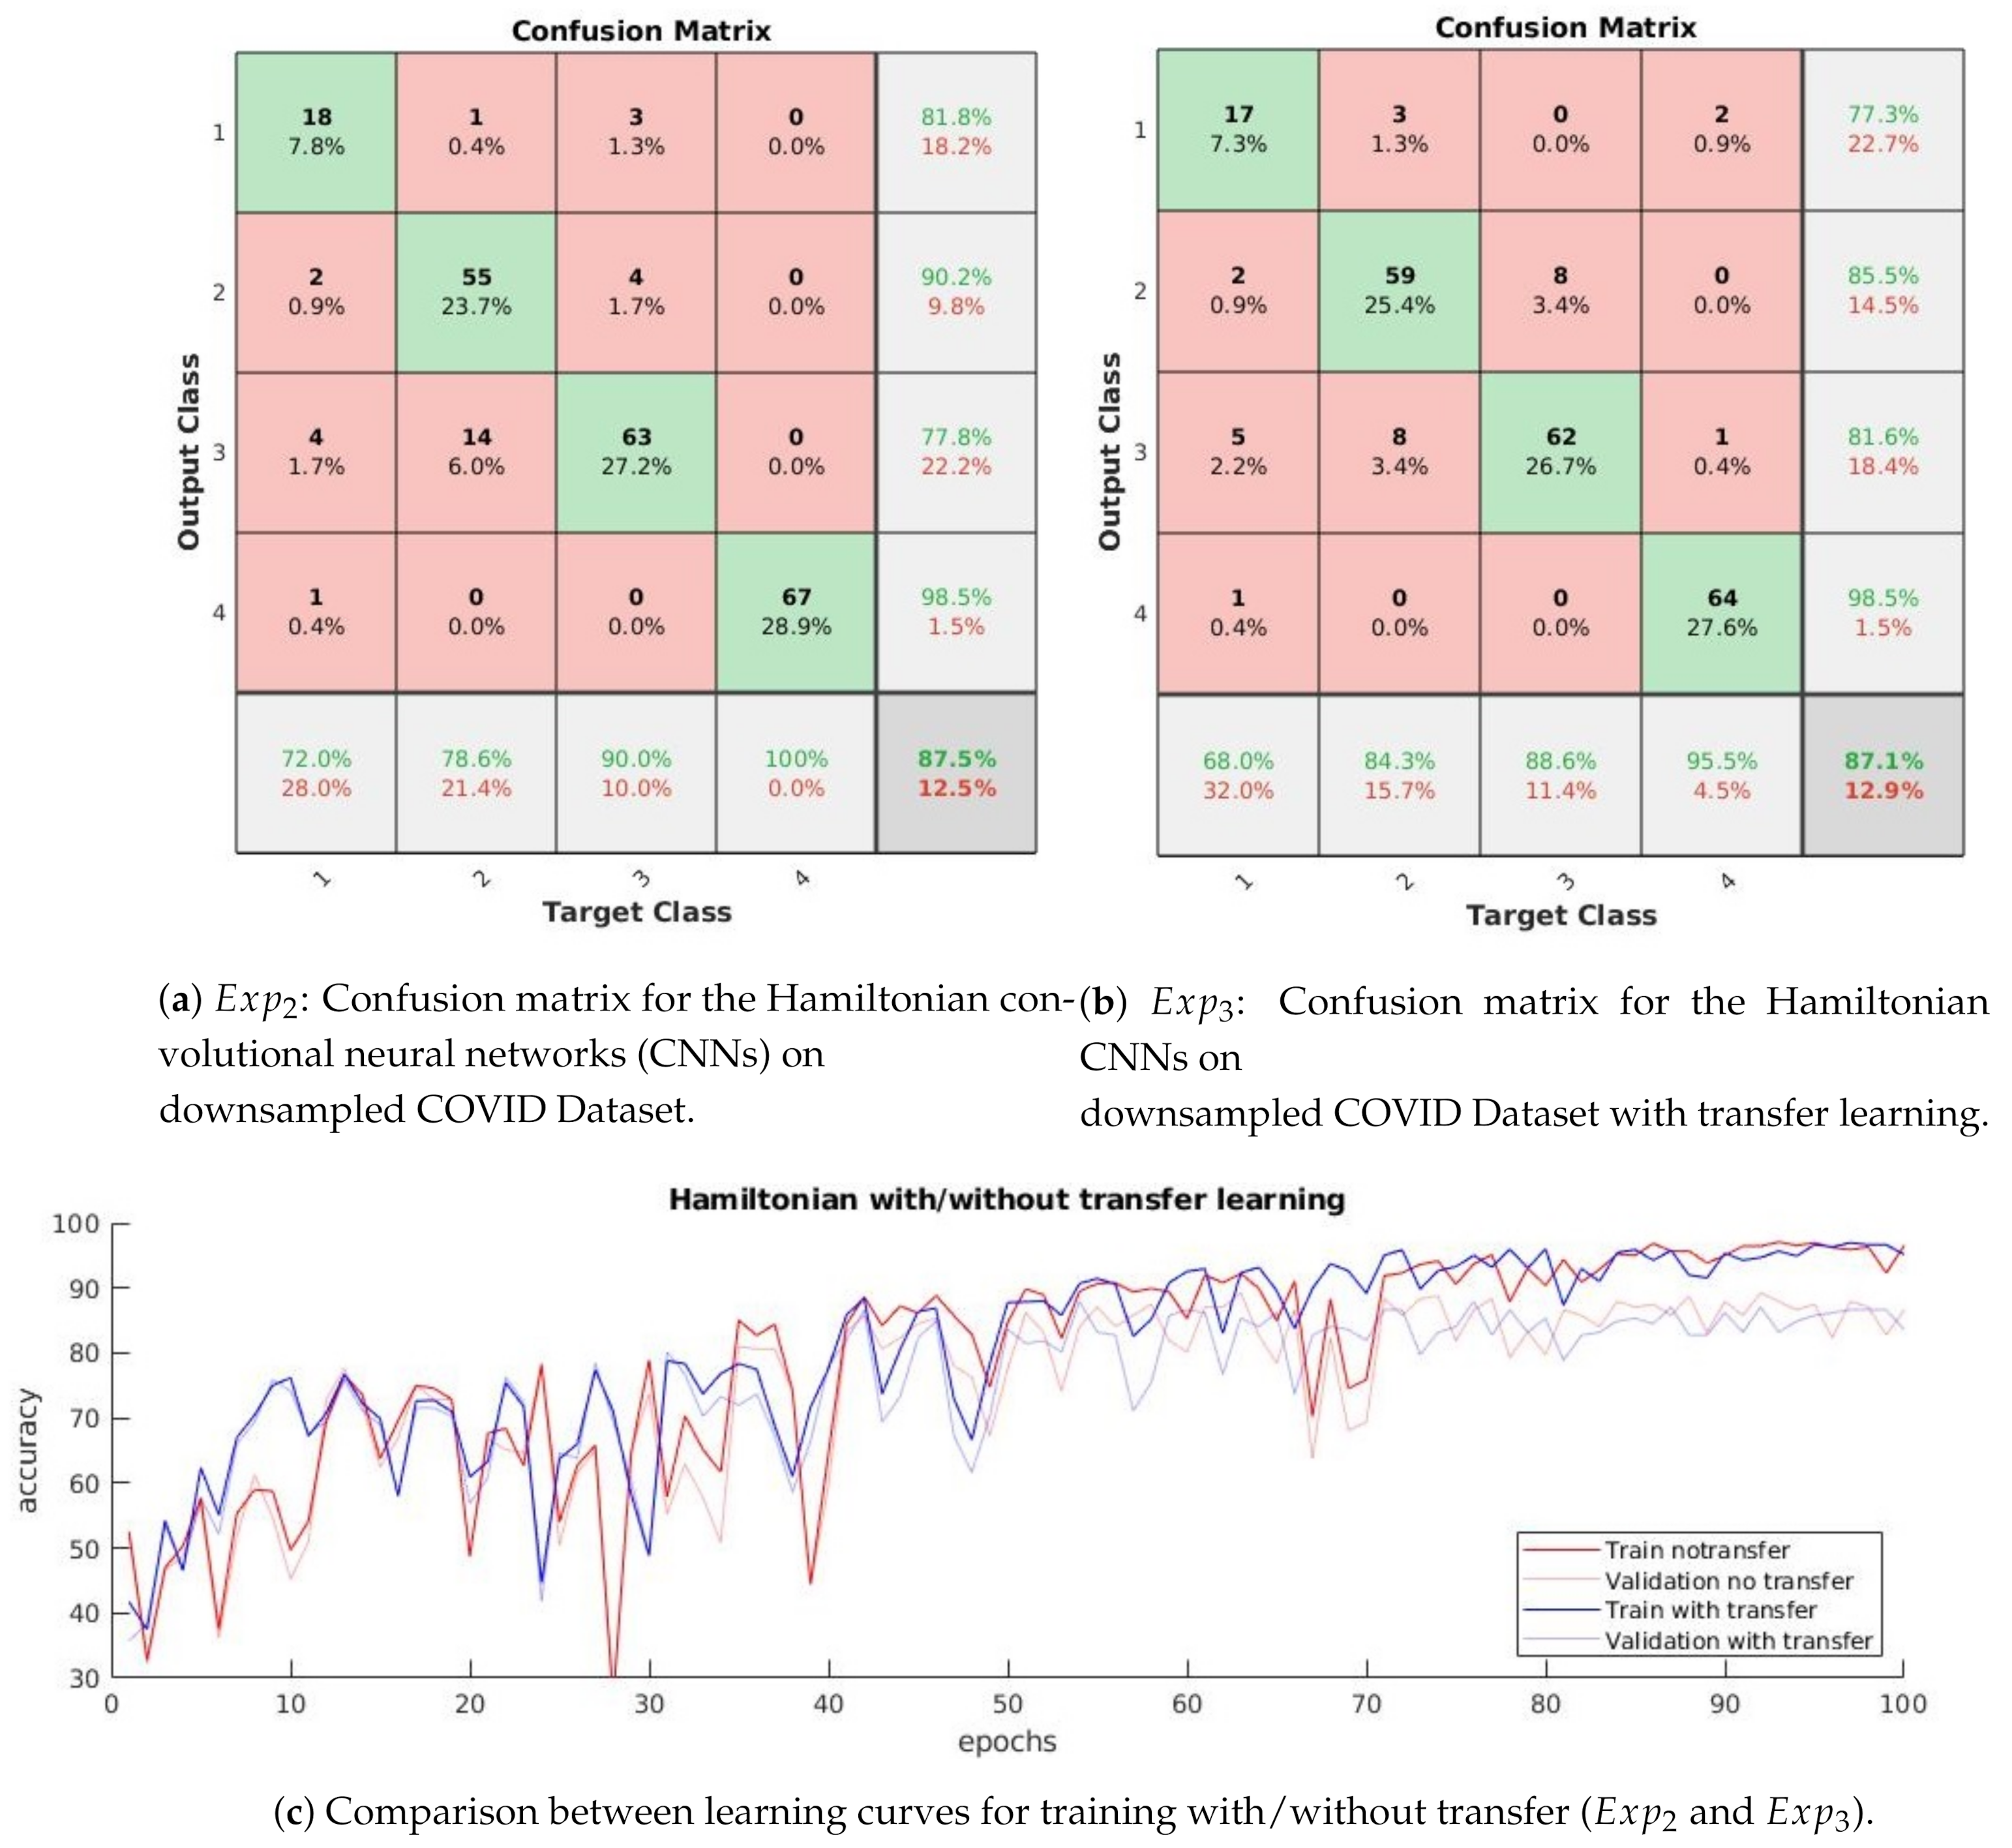
3.1.3. : Distinguishing between Four Classes with Transfer Learning
- The confusion matrix in Figure 5b shows that the normal and pneumonia classes are better predicted in than in , even though the used dataset is the same. Differently, COVID-19 is a little bit worse in .
- The learning curves in Figure 5c show that the accuracy in does not have the high variations from one epoch to another, which is present in .
- The difference between training and validation accuracy is smaller in compared to .
3.2. 2-Phases Learning with CheXpert as X-Ray Embedding
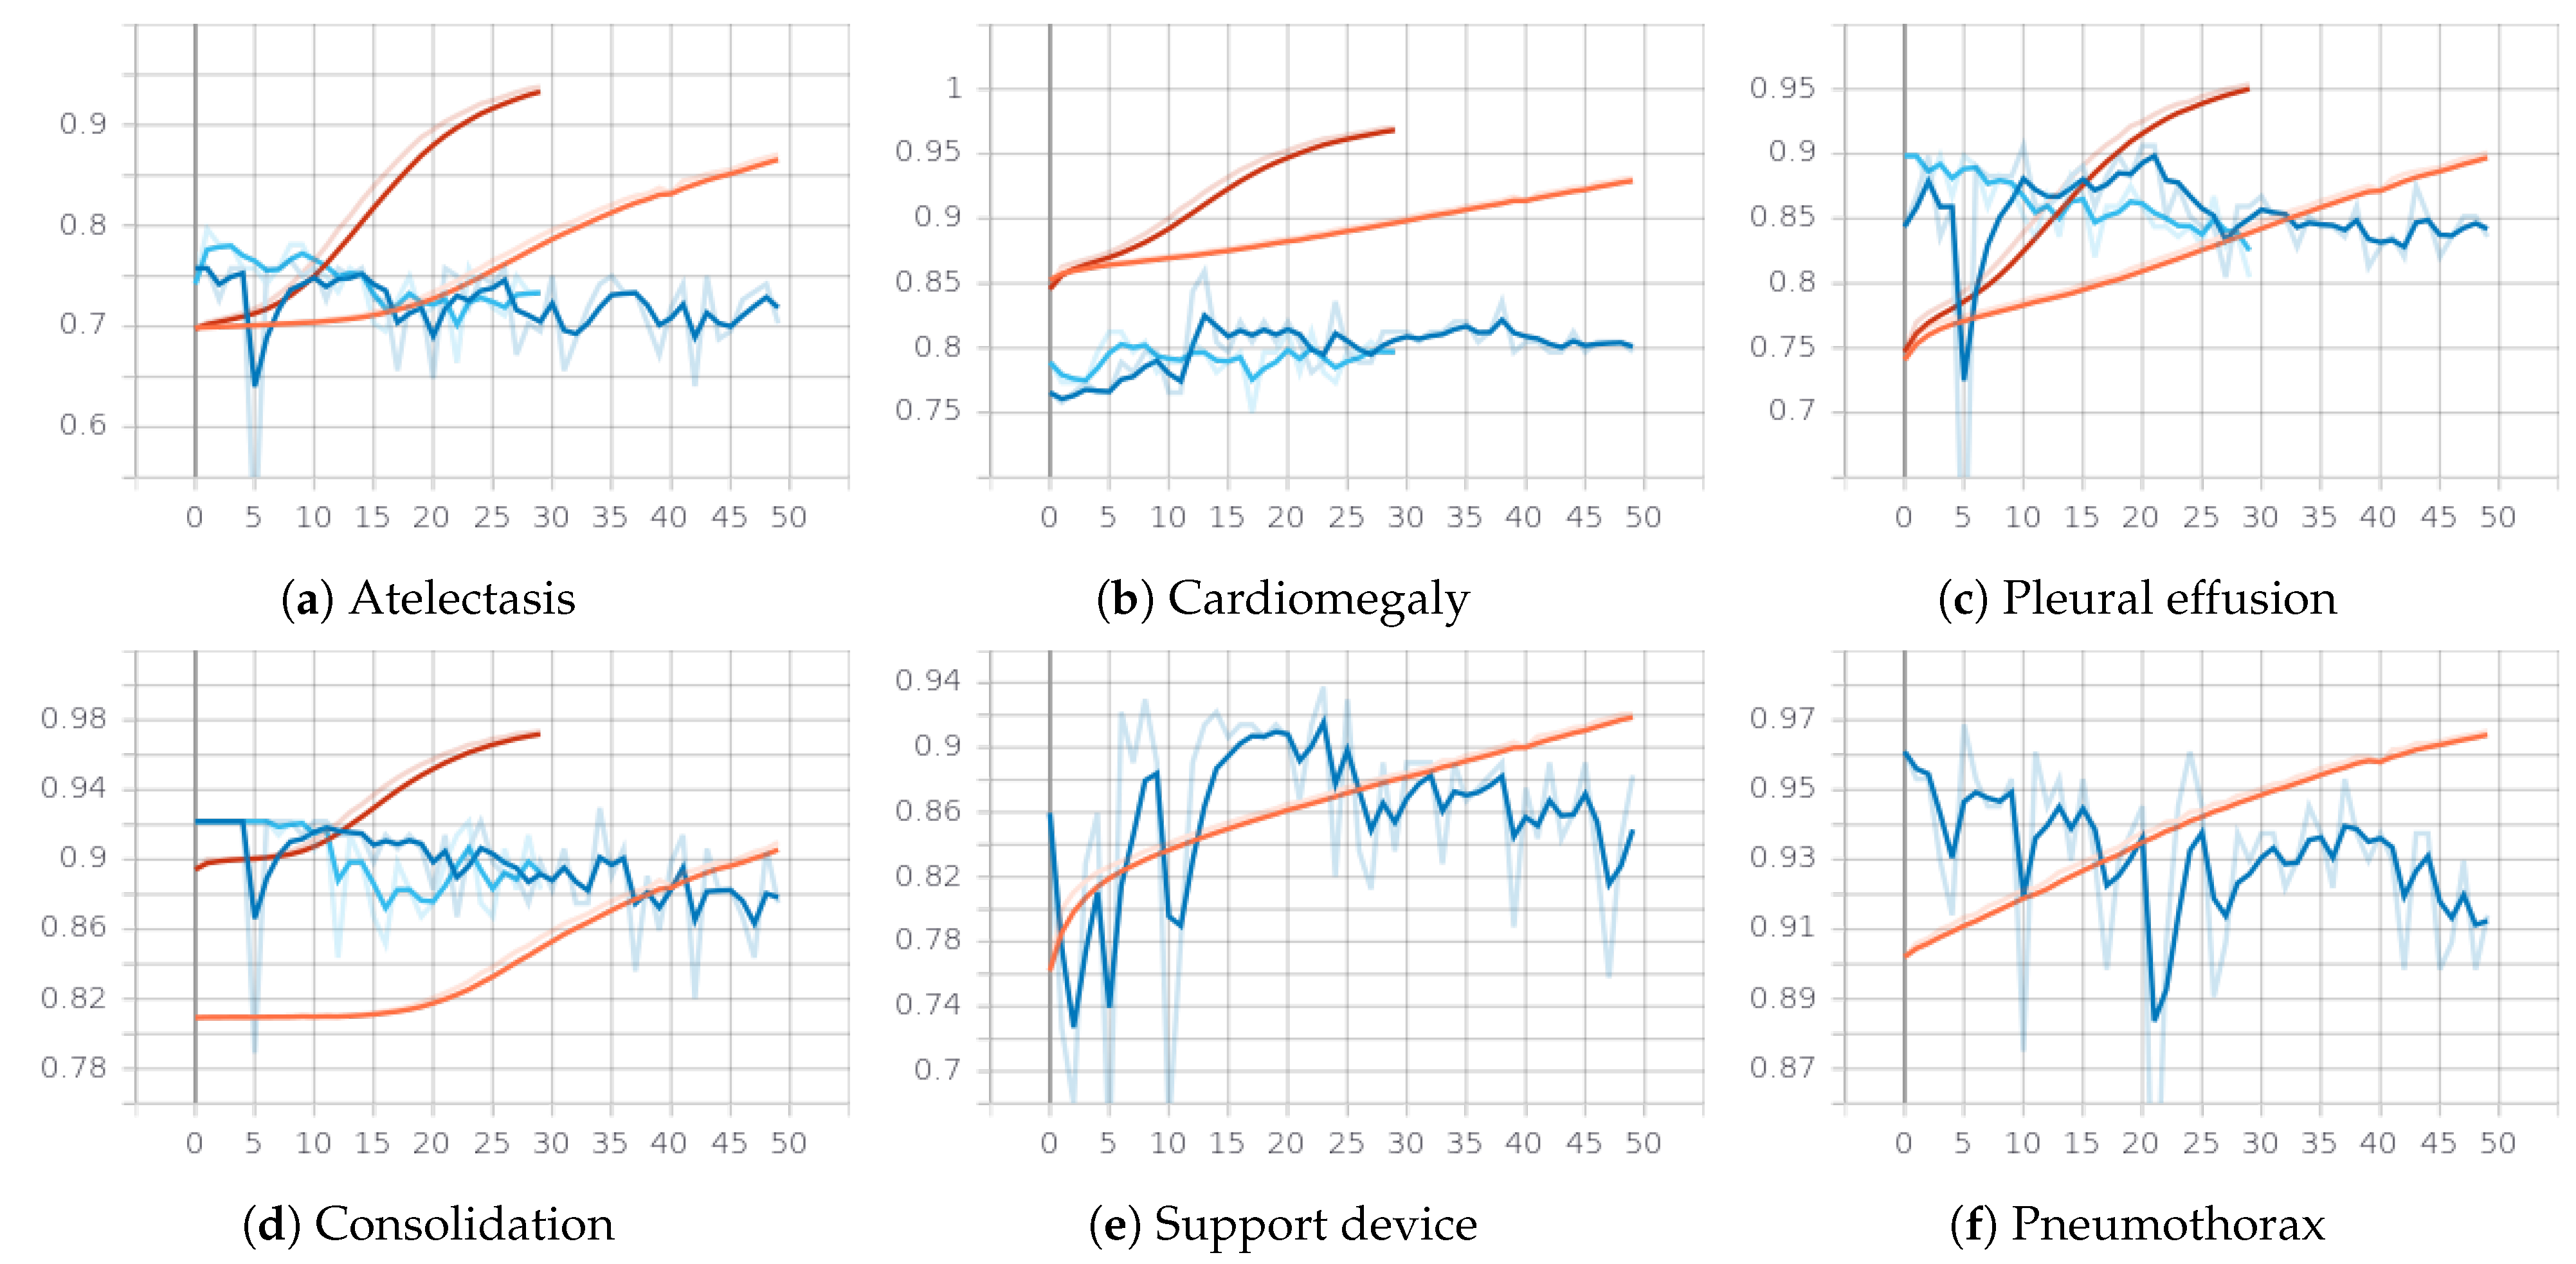
3.2.1. First Phase: Classifying the 14 Observations from CheXpert
- Class weights: for each of the 14 observations, the weights of the 3 classes is computed according to the number of examples in each class (except for the no finding class, where the weight is computed only for 2 classes since there is no example in the uncertain class).
- Reliable classes: training is done only for the the first 5 classes for which F1 of the labeler on positive and negative classes are all very high: edema, consolidation, atelectasis, cardiomegaly, pleural effusion.
- Value of the weight for the uncertain class: the weight of the uncertain class for some outputs is halved such that the errors on this class to have reduced impact on the loss. The reason for doing this is the smaller quality of the labeler on this class.
- Replacing the uncertain class: the samples from the class uncertain for some observations are considered from either positive or negative class.
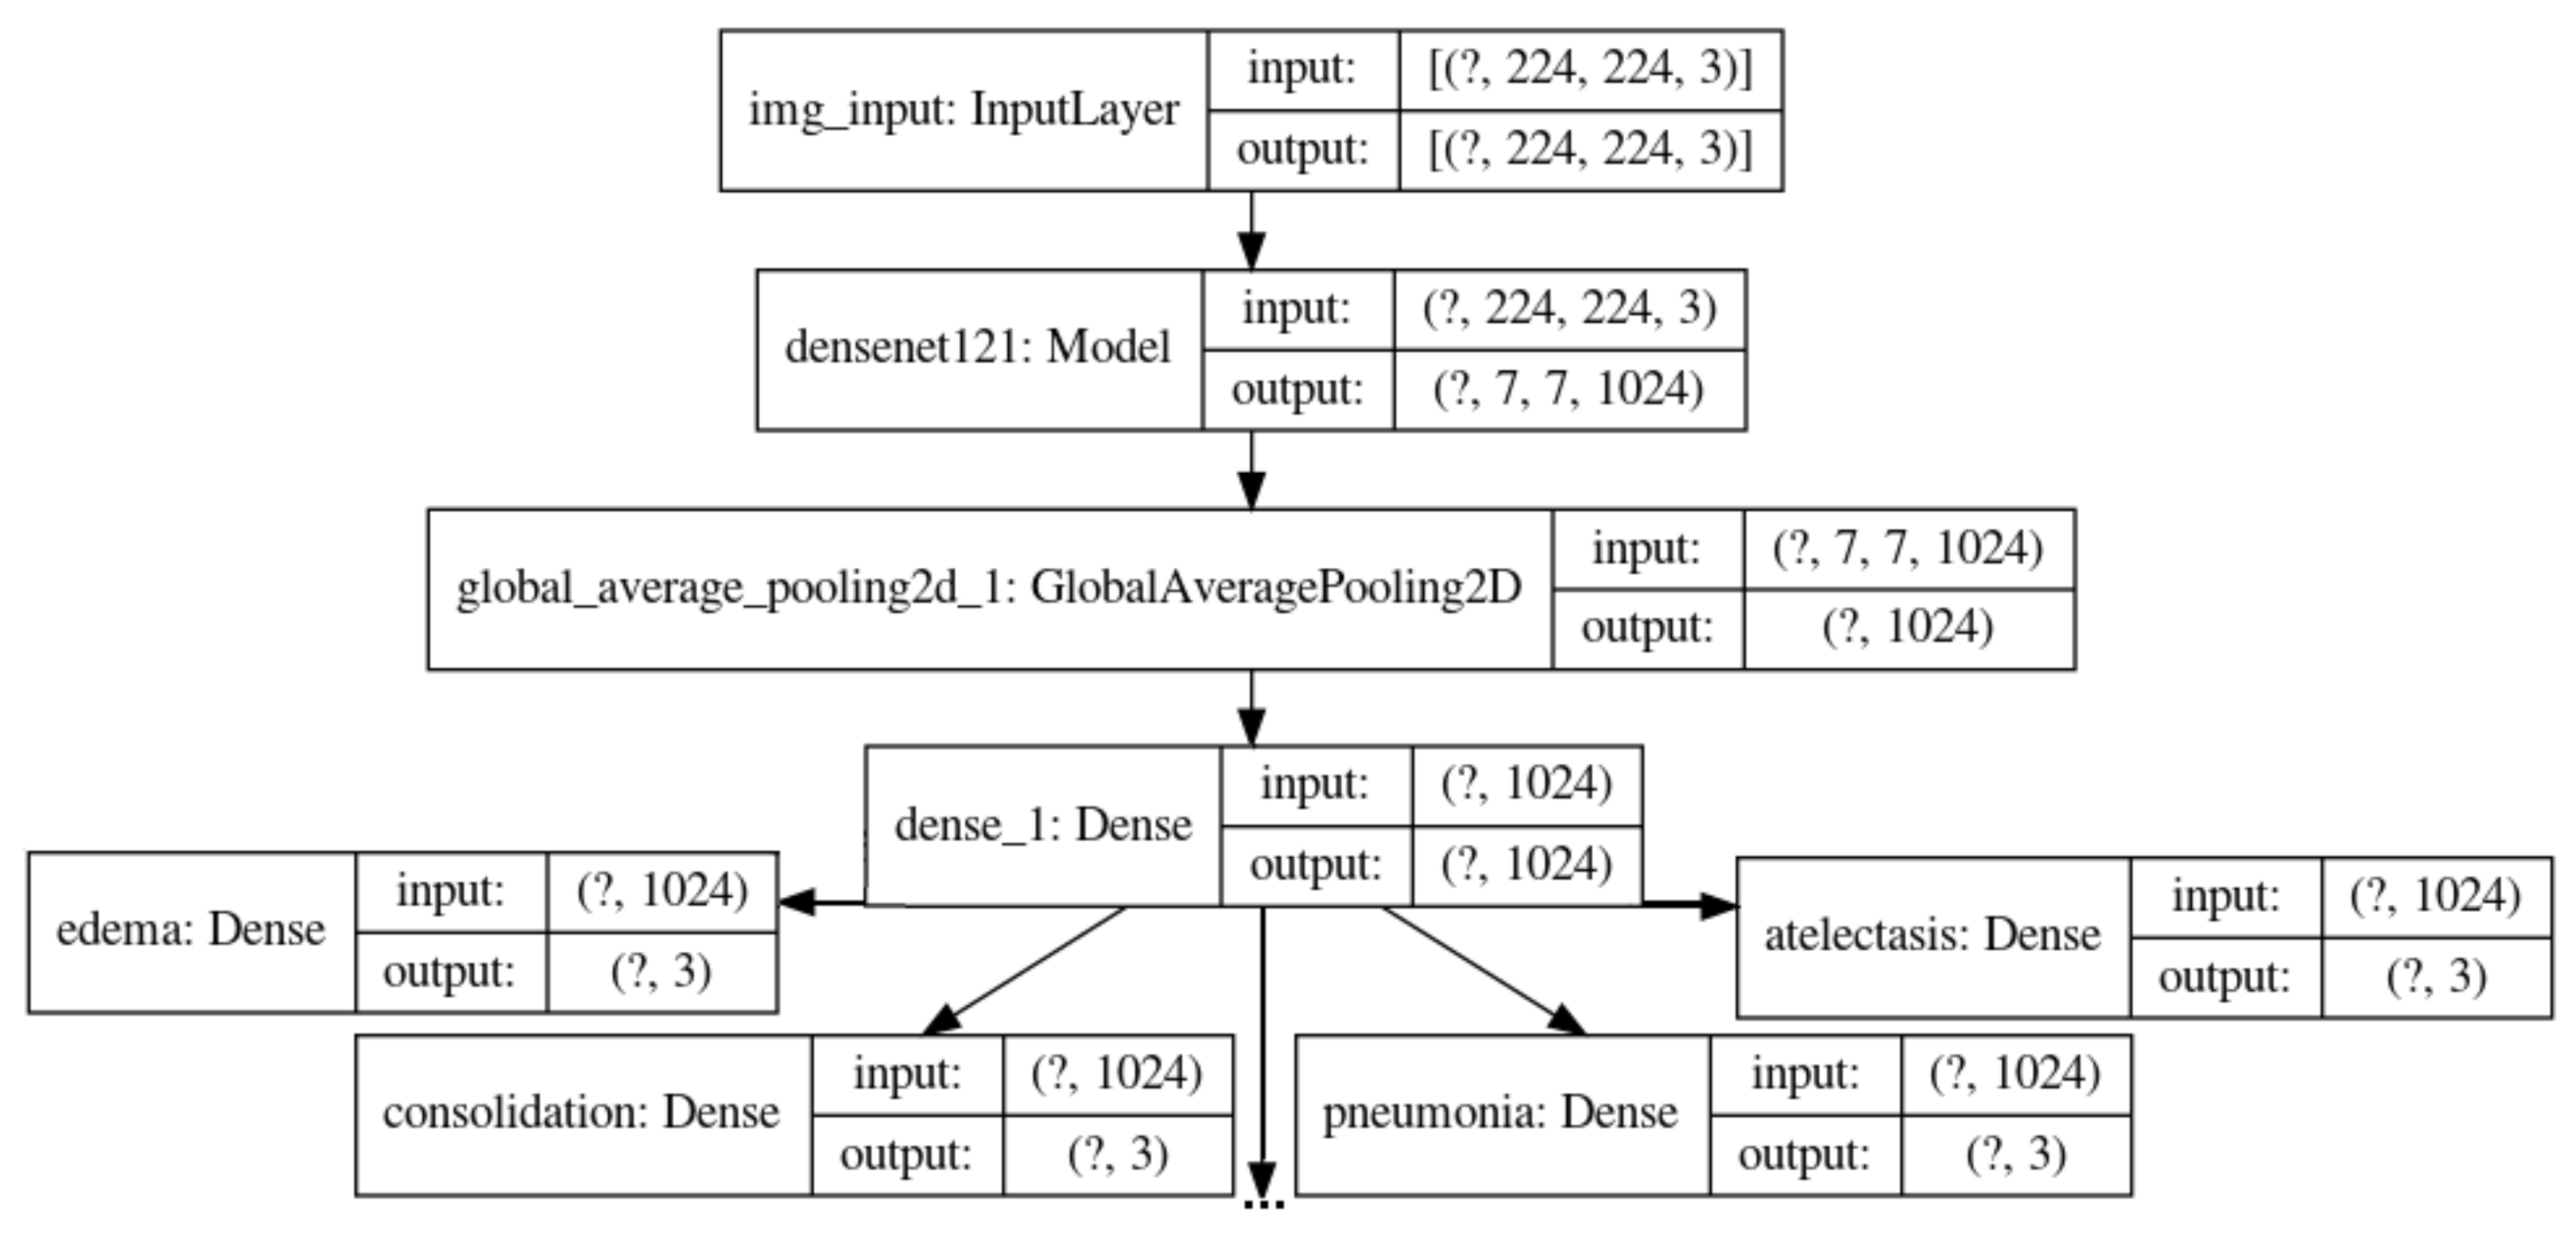
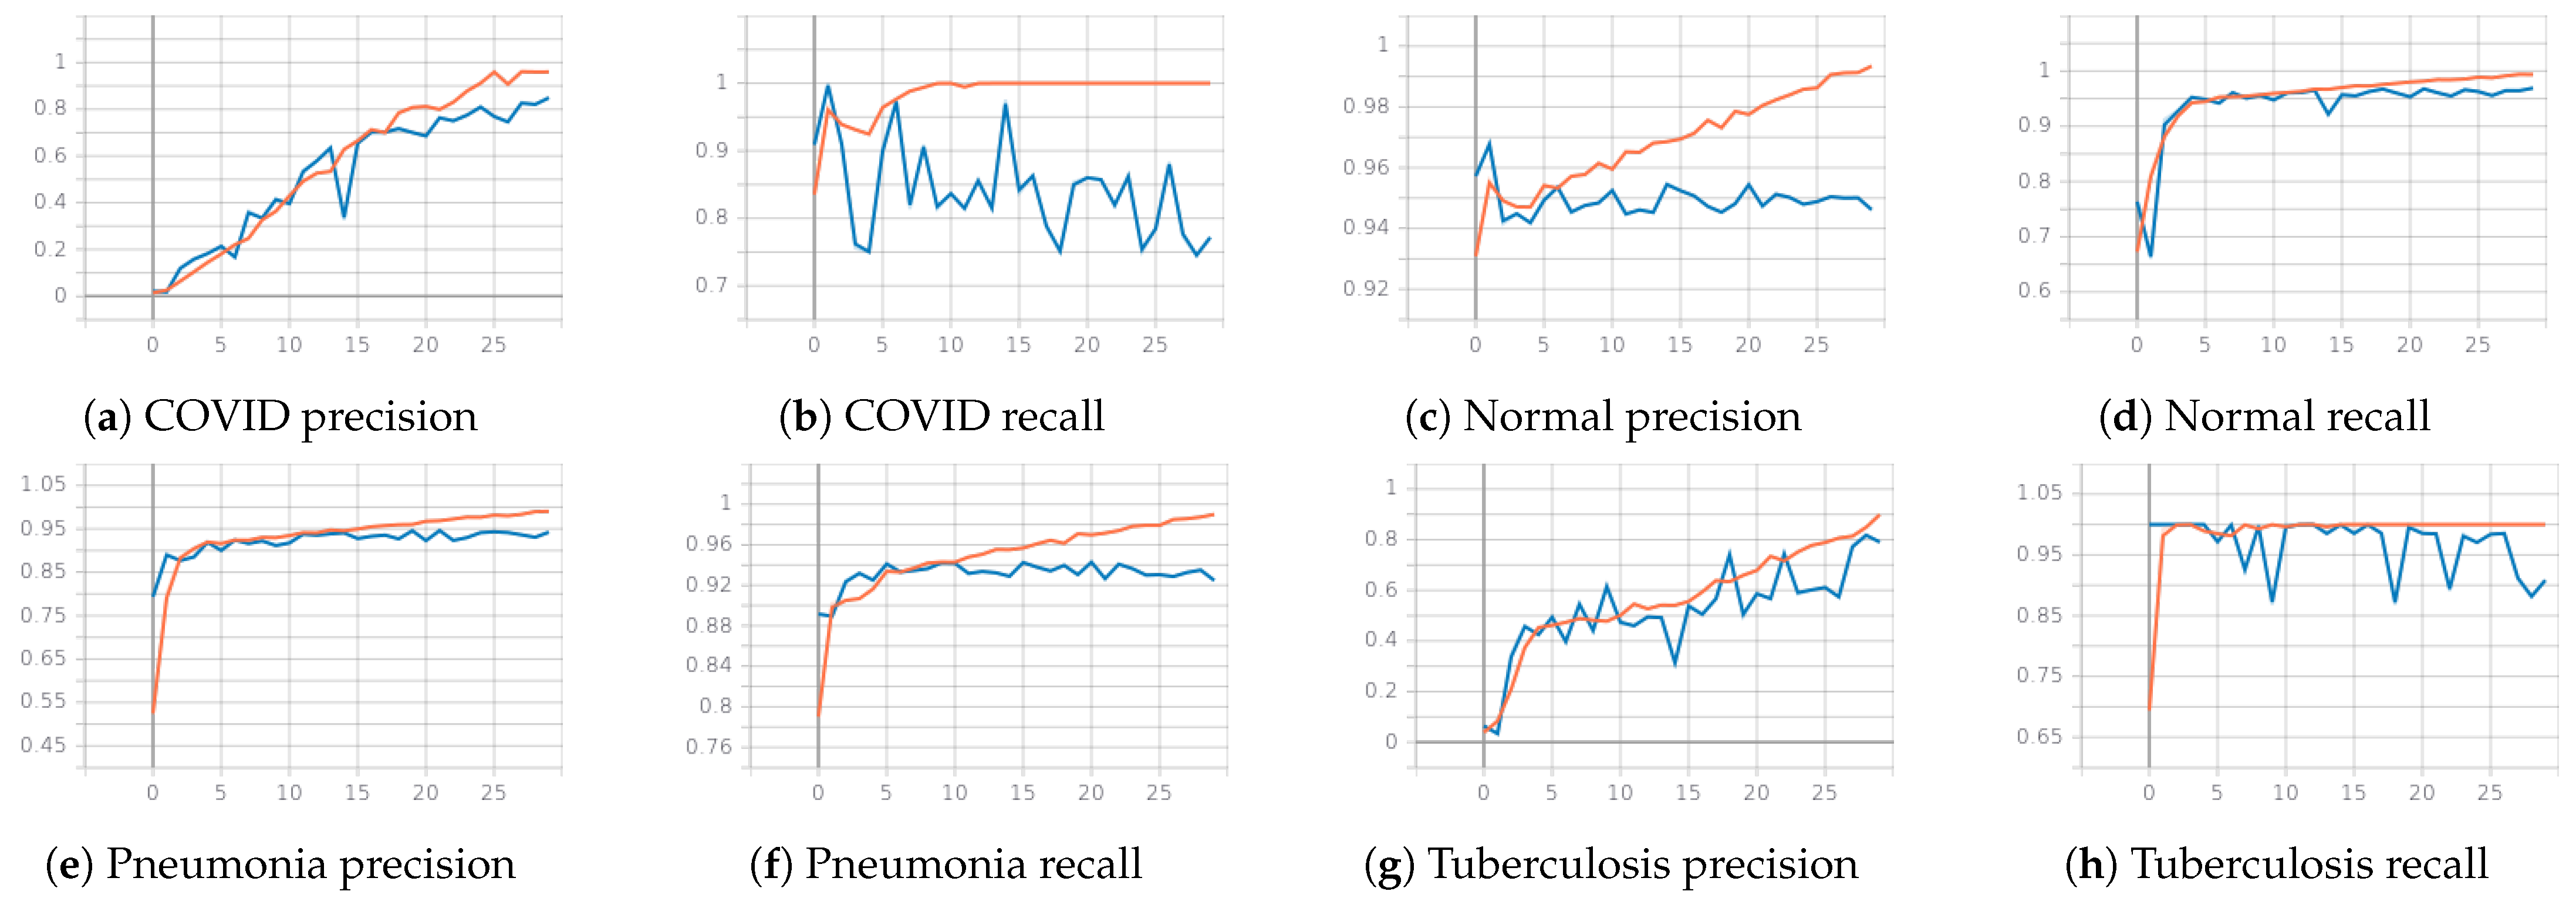
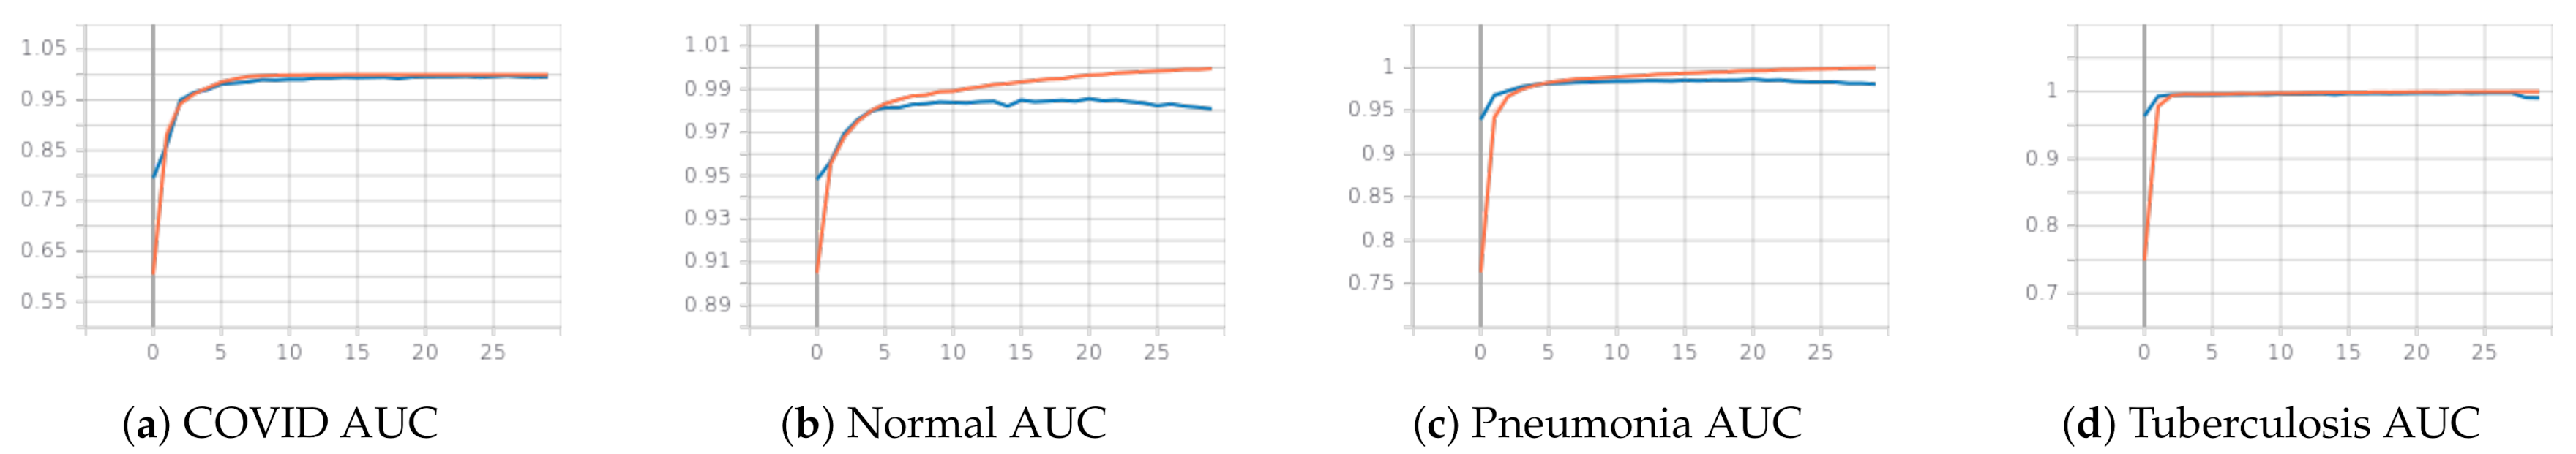
3.2.2. Second Phase: Classifying COVID-19, Pneumonia, Tuberculosis and Normal with CheXpert Pretrained Weights
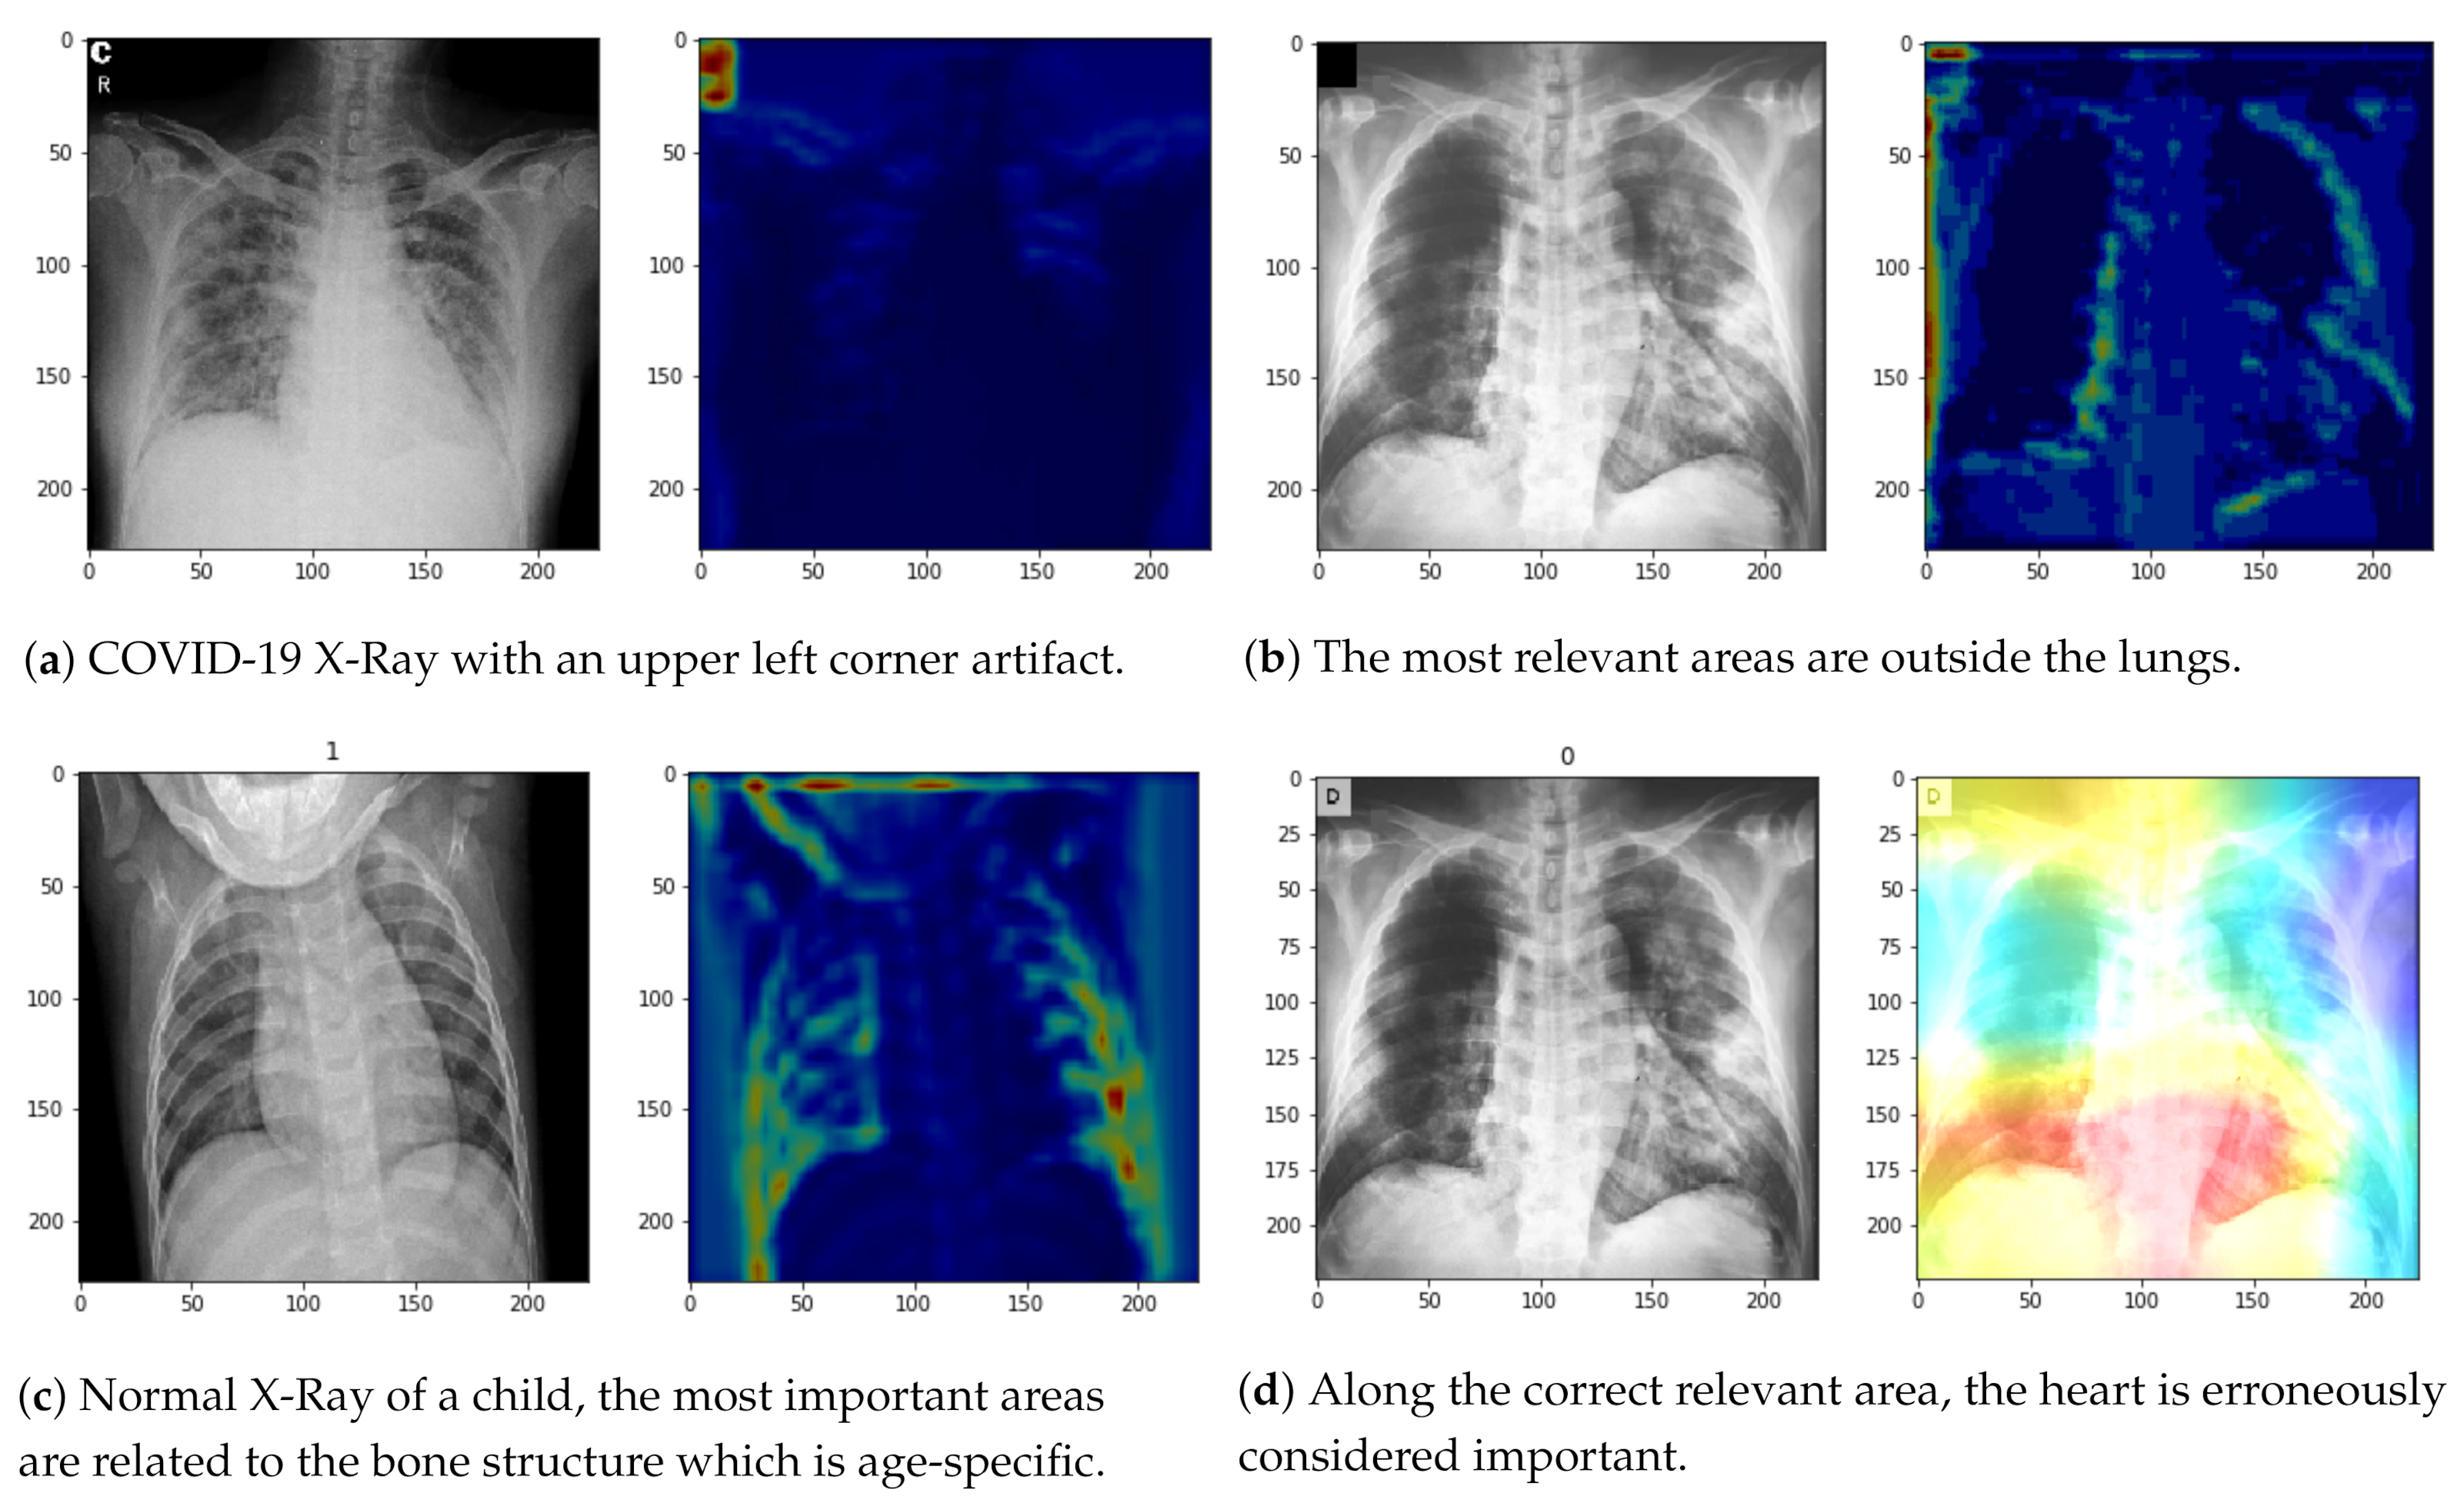
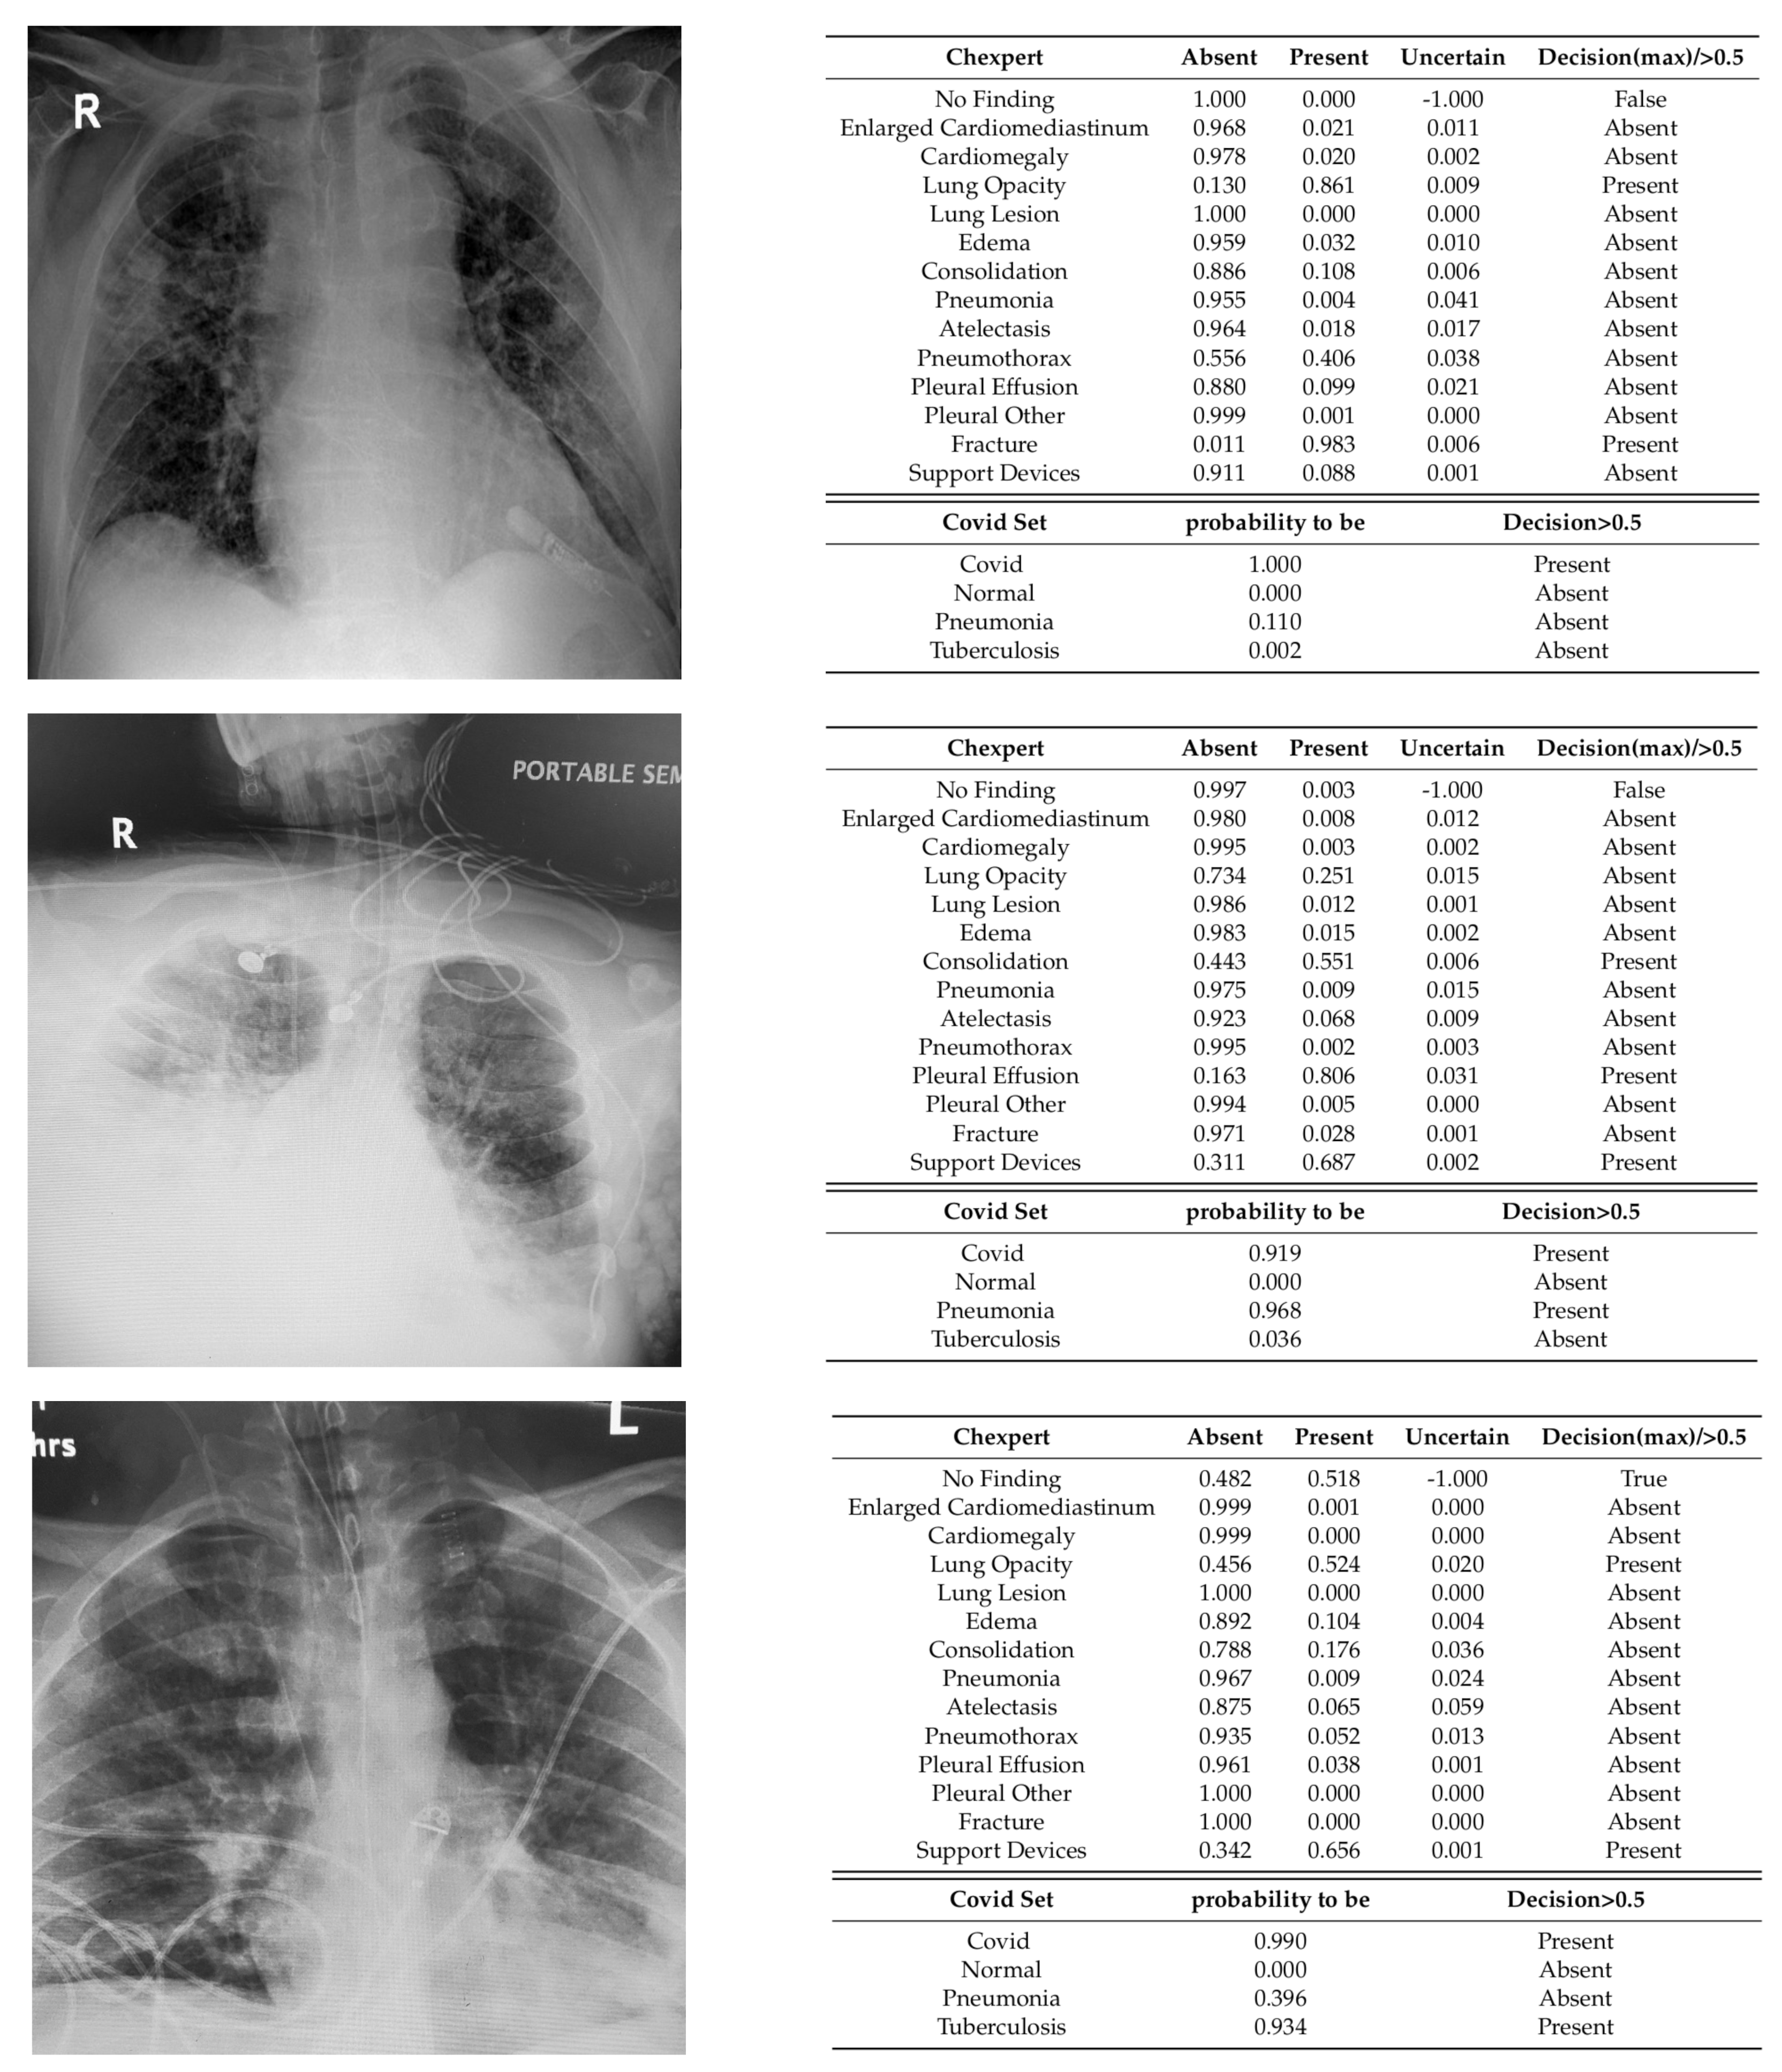
3.2.3. Qualitative Analysis
4. Discussion and Related Work
4.1. PDE-Inspired Networks
4.2. 2-Phase CheXpert-Based Networks
4.3. Comparison between PDE-Inspired Networks and CheXpert-Based Network
5. Code and Data Availability
6. Conclusions
Author Contributions
Funding
Institutional Review Board Statement
Informed Consent Statement
Data Availability Statement
Conflicts of Interest
References
- Ruthotto, L.; Haber, E. Deep Neural Networks Motivated by Partial Differential Equations. J. Math. Imaging Vis. 2020, 62, 352–364. [Google Scholar] [CrossRef]
- He, K.; Zhang, X.; Ren, S.; Sun, J. Deep Residual Learning for Image Recognition. In Proceedings of the 2016 IEEE Conference on Computer Vision and Pattern Recognition (CVPR), Las Vegas, NV, USA, 27–30 June 2016; pp. 770–778. [Google Scholar]
- Luján-García, J.E.; Moreno-Ibarra, M.A.; Villuendas-Rey, Y.; Yáñez-Márquez, C. Fast COVID-19 and Pneumonia Classification Using Chest X-ray Images. Mathematics 2020, 8, 1423. [Google Scholar] [CrossRef]
- Sciacca, F.; Bell, D.J. COVID-19. 2020. Available online: https://radiopaedia.org/articles/covid-19-4 (accessed on 9 January 2021).
- Huang, G.; Liu, Z.; Van Der Maaten, L.; Weinberger, K.Q. Densely Connected Convolutional Networks. In Proceedings of the 2017 IEEE Conference on Computer Vision and Pattern Recognition (CVPR), Honolulu, HI, USA, 21–26 July 2017; pp. 2261–2269. [Google Scholar]
- Cruz, B.G.S.; Sölter, J.; Bossa, M.N.; Husch, A.D. On the Composition and Limitations of Publicly Available COVID-19 X-Ray Imaging Datasets. arXiv 2020, arXiv:abs/2008.11572. [Google Scholar]
- Cohen, J.P.; Morrison, P.; Dao, L. COVID-19 image data collection. arXiv 2020, arXiv:abs/2003.11597. [Google Scholar]
- Winther, H.B.; Laser, H.; Gerbel, S.; Maschke, S.K.; B. Hinrichs, J.; Vogel-Claussen, J.; Wacker, F.K.; Höper, M.M.; Meyer, B.C. COVID-19 Image Repository. Radiol. Soc. N. Am. 2020. [Google Scholar] [CrossRef]
- Chowdhury, M.E.H.; Rahman, T.; Khandakar, A.; Mazhar, R.; Kadir, M.A.; Mahbub, Z.B.; Islam, K.R.; Khan, M.S.; Iqbal, A.; Emadi, N.A.; et al. Can AI Help in Screening Viral and COVID-19 Pneumonia? IEEE Access 2020, 8, 132665–132676. [Google Scholar] [CrossRef]
- Kermany, D.; Zhang, K.; Goldbaum, M. Labeled Optical Coherence Tomography (OCT) and Chest X-Ray Images for Classification. Mendeley Data. 2018. Available online: https://data.mendeley.com/datasets/rscbjbr9sj/2 (accessed on 20 December 2020). [CrossRef]
- Wang, X.; Peng, Y.; Lu, L.; Lu, Z.; Bagheri, M.; Summers, R.M. ChestX-Ray8: Hospital-Scale Chest X-Ray Database and Benchmarks on Weakly-Supervised Classification and Localization of Common Thorax Diseases. In Proceedings of the 2017 IEEE Conference on Computer Vision and Pattern Recognition (CVPR), Honolulu, HI, USA, 21–26 July 2017; pp. 3462–3471. [Google Scholar]
- Jaeger, S.; Candemir, S.; Antani, S.; Wáng, Y.X.J.; Lu, P.X.; Thoma, G. Two public chest X-ray datasets for computer-aided screening of pulmonary diseases. Quant. Imaging Med. Surg. 2014, 4, 475–477. [Google Scholar] [CrossRef] [PubMed]
- Tian, Y.; Wang, Y.; Krishnan, D.; Tenenbaum, J.B.; Isola, P. Rethinking Few-Shot Image Classification: A Good Embedding Is All You Need? Lect. Notes Comput. Sci. 2020, 12359, 266–282. [Google Scholar] [CrossRef]
- Martínez-García, M.; Zhang, Y.; Wan, J.; McGinty, J. Visually Interpretable Profile Extraction with an Autoencoder for Health Monitoring of Industrial Systems. In Proceedings of the 2019 IEEE 4th International Conference on Advanced Robotics and Mechatronics (ICARM), Toyonaka, Japan, 3–5 July 2019; pp. 649–654. [Google Scholar]
- XtractOpen. Meganet.jl: A Fresh Approach to Deep Learning Written in Julia. 2018. Available online: https://github.com/XtractOpen/Meganet.jl (accessed on 20 December 2020).
- Pan, I.; Cadrin-Chênevert, A.; Cheng, P.M. Tackling the Radiological Society of North America Pneumonia Detection Challenge. Am. J. Roentgenol. 2019, 213, 568–574. [Google Scholar] [CrossRef] [PubMed]
- Ovalle-Magallanes, E.; Avina-Cervantes, J.G.; Cruz-Aceves, I.; Ruiz-Pinales, J. Transfer Learning for Stenosis Detection in X-ray Coronary Angiography. Mathematics 2020, 8, 1510. [Google Scholar] [CrossRef]
- Irvin, J.; Rajpurkar, P.; Ko, M.; Yu, Y.; Ciurea-Ilcus, S.; Chute, C.; Marklund, H.; Haghgoo, B.; Ball, R.; Shpanskaya, K.; et al. CheXpert: A Large Chest Radiograph Dataset with Uncertainty Labels and Expert Comparison. Proc. AAAI Conf. Artif. Intell. 2019, 33, 590–597. [Google Scholar] [CrossRef]
- Wang, L.; Lin, Z.Q.; Wong, A. COVID-Net: A tailored deep convolutional neural network design for detection of COVID-19 cases from chest X-ray images. Sci. Rep. 2020, 10, 19549. [Google Scholar] [CrossRef] [PubMed]
- Pasa, F.; Golkov, V.; Pfeiffer, F.; Cremers, D.; Pfeiffer, D. Efficient Deep Network Architectures for Fast Chest X-Ray Tuberculosis Screening and Visualization. Sci. Rep. 2019, 9. [Google Scholar] [CrossRef] [PubMed]
- Murphy, K.; Smits, H.; Knoops, A.J.; Korst, M.B.; Samson, T.; Scholten, E.T.; Schalekamp, S.; Schaefer-Prokop, C.M.; Philipsen, R.H.; Meijers, A.; et al. COVID-19 on the Chest Radiograph: A Multi-Reader Evaluation of an AI System. Radiology 2020, 296, 166–172. [Google Scholar] [CrossRef] [PubMed]
- Bressem, K.K.; Adams, L.C.; Erxleben, C.; Hamm, B.; Niehues, S.M.; Vahldiek, J.L. Comparing different deep learning architectures for classification of chest radiographs. Sci. Rep. 2020, 10. [Google Scholar] [CrossRef]
- Yang, W.; Cao, Q.; Qin, L.; Wang, X.; Cheng, Z.; Pan, A.; Dai, J.; Sun, Q.; Zhao, F.; Qu, J.; et al. Clinical characteristics and imaging manifestations of the 2019 novel coronavirus disease (COVID-19):A multi-center study in Wenzhou city, Zhejiang, China. J. Infect. 2020, 80, 388–393. [Google Scholar] [CrossRef] [PubMed]
- Zhou, T.; Lu, H.; Yang, Z.; Qiu, S.; Huo, B.; Dong, Y. The ensemble deep learning model for novel COVID-19 on CT images. Appl. Soft Comput. 2021, 98, 106885. [Google Scholar] [CrossRef] [PubMed]
- Raghu, M.; Zhang, C.; Kleinberg, J.; Bengio, S. Transfusion: Understanding Transfer Learning for Medical Imaging. arXiv 2019, arXiv:abs/1902.07208. [Google Scholar]


| Source | COVID-19 | Pneumonia | Tuberculosis | Normal |
|---|---|---|---|---|
| Cohen dataset (RadiopaediaSIRM) | 121 | - | - | - |
| RSNA Pneumonia Challenge | - | 6012 | - | 8851 |
| Shenzhen | - | - | 335 | 326 |
| Total | 121 | 6012 | 335 | 9177 |
| Positive | Negative | Uncertain | |
|---|---|---|---|
| Atelectasis | 0.998 | 0.833 | 0.936 |
| Cardiomegaly | 0.973 | 0.909 | 0.727 |
| Consolidation | 0.999 | 0.981 | 0.924 |
| Edema | 0.993 | 0.962 | 0.796 |
| Pleural Effusion | 0.996 | 0.971 | 0.707 |
| Pneumonia | 0.992 | 0.750 | 0.817 |
| Pneumothorax | 1.000 | 0.977 | 0.762 |
| Enlarged Cardiom. | 0.935 | 0.959 | 0.854 |
| Lung Lesion | 0.896 | 0.900 | 0.857 |
| Lung Opacity | 0.966 | 0.914 | 0.286 |
| Pleural Other | 0.850 | 1.000 | 0.769 |
| Fracture | 0.975 | 0.807 | 0.800 |
| Support Devices | 0.933 | 0.720 | - |
| No Finding | 0.769 | - | - |
| Output | Training | Validation | ||
|---|---|---|---|---|
| Precision (%) | Recall (%) | Precision (%) | Recall (%) | |
| COVID | 90 | 99 | 82 (74) | 77 (88) |
| Normal | 98 | 98 | 94 | 96 |
| Pneumonia | 97 | 97 | 94 | 92 |
| Tuberculosis | 77 | 99 | 60 | 97 |
Publisher’s Note: MDPI stays neutral with regard to jurisdictional claims in published maps and institutional affiliations. |
© 2021 by the authors. Licensee MDPI, Basel, Switzerland. This article is an open access article distributed under the terms and conditions of the Creative Commons Attribution (CC BY) license (http://creativecommons.org/licenses/by/4.0/).
Share and Cite
Marginean, A.N.; Muntean, D.D.; Muntean, G.A.; Priscu, A.; Groza, A.; Slavescu, R.R.; Timbus, C.L.; Munteanu, G.Z.; Morosanu, C.O.; Cosnarovici, M.M.; et al. Reliable Learning with PDE-Based CNNs and DenseNets for Detecting COVID-19, Pneumonia, and Tuberculosis from Chest X-Ray Images. Mathematics 2021, 9, 434. https://doi.org/10.3390/math9040434
Marginean AN, Muntean DD, Muntean GA, Priscu A, Groza A, Slavescu RR, Timbus CL, Munteanu GZ, Morosanu CO, Cosnarovici MM, et al. Reliable Learning with PDE-Based CNNs and DenseNets for Detecting COVID-19, Pneumonia, and Tuberculosis from Chest X-Ray Images. Mathematics. 2021; 9(4):434. https://doi.org/10.3390/math9040434
Chicago/Turabian StyleMarginean, Anca Nicoleta, Delia Doris Muntean, George Adrian Muntean, Adelina Priscu, Adrian Groza, Radu Razvan Slavescu, Calin Lucian Timbus, Gabriel Zeno Munteanu, Cezar Octavian Morosanu, Maria Margareta Cosnarovici, and et al. 2021. "Reliable Learning with PDE-Based CNNs and DenseNets for Detecting COVID-19, Pneumonia, and Tuberculosis from Chest X-Ray Images" Mathematics 9, no. 4: 434. https://doi.org/10.3390/math9040434
APA StyleMarginean, A. N., Muntean, D. D., Muntean, G. A., Priscu, A., Groza, A., Slavescu, R. R., Timbus, C. L., Munteanu, G. Z., Morosanu, C. O., Cosnarovici, M. M., & Pintea, C.-M. (2021). Reliable Learning with PDE-Based CNNs and DenseNets for Detecting COVID-19, Pneumonia, and Tuberculosis from Chest X-Ray Images. Mathematics, 9(4), 434. https://doi.org/10.3390/math9040434