Article

The Quintuple Helix of Innovation Model and the SDGs: Latin-American Countries’ Case and Its Forgotten Effects

by
Luciano Barcellos-Paula
1,2,*,
Iván De la Vega
1,2 and
Anna María Gil-Lafuente
3
1
Departamento Académico de Posgrado en Negocios, CENTRUM Católica Graduate Business School, Lima 15023, Peru
2
Departamento Académico de Posgrado en Negocios, Pontificia Universidad Católica del Perú, Lima 15088, Peru
3
Department of Business Administration, University of Barcelona, 08034 Barcelona, Spain
*
Author to whom correspondence should be addressed.
Mathematics 2021, 9(4), 416; https://doi.org/10.3390/math9040416
Submission received: 22 December 2020 / Revised: 5 February 2021 / Accepted: 12 February 2021 / Published: 20 February 2021
(This article belongs to the Special Issue Fuzzy Sets in Business Management, Finance, and Economics)

Abstract

:
The sustainable development of countries is associated with a set of actions that must be implemented in the long term. In this process, society must be a valid partner in the decisions that are made. Studies show the interrelationship between the Sustainable Development Goals (SDGs), which increases uncertainty and makes decision-making more difficult. On the other hand, the Quintuple Helix of Innovation Model (QHIM) provides an analytical framework to explain the systems’ interactions. The motivation of the study lies in knowing the relationships between the variables that affect SDGs. The manuscript aims to broaden the discussion on sustainable development and propose two models to support decision making. The first one suggests 20 indicators linked to the QHIM with the SDGs in Latin American countries. The second identifies the forgotten effects through the application of a Fuzzy Logic algorithm. The main contribution is to know these effects and to support decision-making. The research carried out can be classified as applied, with the explanatory objective and the combined approach (quantitative-qualitative), modeling and simulation, and case study methods. The QHIM results indicate that Chile leads the ranking, followed by Brazil, Mexico, Peru, and Colombia. Also, it reveals the importance of correctly identifying cause-effects by seeking harmony between systems. A limitation would be the number of variables used. The study indicates promising lines of research.

1. Introduction

Scientific studies point out the need to act in a strategic and socially responsible way towards sustainable development [1,2]. In this sense, innovation plays a crucial role in achieving this goal [3,4]. On the other hand, the search for lasting solutions for the planet requires balancing objectives from several interest groups and strengthening relationships between institutions [5]. Therefore, countries must have a critical mass of researchers in various knowledge areas [6].
In 1987 the Brundtland Report defined sustainable development as one in which “present needs must be met without compromising the future of future generations” [7] and recognized the importance of the commitment of all to achieve this goal.
In 2015 this theme gained greater relevance with the 17 Sustainable Development Goals (SDGs) [8]. Most importantly, it invites us to create a more sustainable, secure, and prosperous planet for humanity. To achieve the SDGs, individuals, businesses, governments, and non-governmental organizations must commit to sustainable development [5]. Therefore, working together with diverse organizations allows us to remember stakeholders’ importance in generating long-term value for both business and society [9].
In this sense, the Quintuple Helix of Innovation Model (QHIM) provides an analytical framework to explain the interactions among the actors of a society that seeks, in theory, to progress [10]. The proposed model is composed of political, educational, economic, environmental, and social systems. Each helix represents a knowledge subsystem that functions as a spiral connecting with the other systems, which, in turn, have a national, regional, and global reach.
Therefore, humanity must find solutions to address significant challenges, such as harmony and cooperation among the five systems towards sustainable development. The uncertainty caused by constant and intense change, which increases decision-making, must also be considered. For these reasons, the primary motivation lies in knowing the relationships between the systems and the variables that affect sustainable development.
As a methodological alternative, the algorithms based on “Fuzzy Logic” [11] contribute to solving problems of the real world when they are dedicated to solving complex systems reducing the uncertainty in decision making [12,13,14].
In this context, the manuscript aims to broaden the discussion on sustainable development and propose two models to support decision making. The first one suggests 20 indicators linked to the QHIM with the SDGs in Latin American countries. The second identifies the forgotten effects through the application of a Fuzzy Logic algorithm. The main contribution of the study is in knowing these effects and supporting decision making. The main contribution of the study is in knowing these effects and supporting decision making. The results reveal the importance of correctly identifying cause-effects by seeking harmony between systems. A limitation of this research is the number of variables used.
This research can be classified as applied, with the explanatory objective and the combined approach (qualitative-quantitative), modeling and simulation, and case study methods [15]. The combination of the two methods generates an added value to the research since, on the one hand, simulation allows to inform and understand a real-world problem and propose solutions adjusted to the identified needs [16]. On the other hand, the case study method is empirical research that finds a contemporary phenomenon within its real-life context [17]. As a result, the combined research method supports the model’s validation and generates interesting theoretical and practical implications.
The document is structured as follows. Section 2 presents the materials and methods. Section 3 shows the results of the simulation applying the Forgotten Effects Theory. Section 4 presents the discussions of the results. Finally, Section 5 details the conclusions followed by the references.

2. Materials and Methods

This section is organized into four parts to explain the methodology of the study. First, it explains the QHIM and SDGs’ theoretical framework. Following, it discusses Latin American countries’ case analysis concerning sustainable development applying the QHIM. Third, it explains the algorithm used in the simulation. Finally, it details the simulation process carried out to identify sustainable development’s forgotten effects.

2.1. QHIM and SDGs: Theoretical Framework

The QHIM results from the continuous development of approaches that seek to explain the dynamic interactions of social actors at different scales, the country level being one of them. Scientific studies confirm the importance of the QHIM in integrating the five systems to achieve sustainable development [10,18]. Table A1 presents the evolution of the models related to the study, definitions, and scope.
The previous theoretical basis on which the QHIM was founded comes from several approaches, the most relevant being the Triple Helix for Development, first published by Etzkowitz and Leydesdorff in 1998 [19].
These approaches have contributed to designing the theoretical base model used for this study, such as the Triple Helix and its evolution towards the Fourth and Fifth Helix of Innovation. This last model was finally selected to explain its relationship with the SDGs. It adds social capital and environmental capital to the Triple Helix model and was therefore considered the most appropriate for this study.
By examining the longitudinal evolution of the models related to the one used in this study, we could indicate that the Triple Helix approach operates under the construction of a socio-institutional fabric that leverages the network of interactive business-university-government agent relationships. This approach describes and analyzes these agents’ relationships, and they were examined, considering the dynamic processes generated among the participants and materialized through initiatives that seek innovative solutions [19,20,21,22,23]. This model has been evolving steadily and today is related to the promotion of new modes of an action directed towards the market and also to propose solutions to problems that are fundamental of a social nature [24,25,26].
The Quadruple Helix model of innovation is an evolution made by a team of specialists integrating central elements of other approaches such as the Triple Helix, Mode 1 and Mode 2, and the National Innovation Systems. This process includes the attributes related to the new actor that the authors incorporate and call Social Capital.
These characteristics are related to the media and the vision of a change process towards a knowledge economy. Including this new actor as a fourth interconnected subsystem, taking into account the media to support disseminating knowledge in a given society, also integrates other aspects such as culture with its values, experience, and traditions [27]. These attributes are relevant since they can favor or condition a given country’s potential development, and society has a relevant weight in decisions [28].
The QHIM has as its central purpose to include the natural environment as a new subsystem of knowledge. This approach’s logic is based on generating innovation ecosystems that include nature as a central component, giving it the same weight as the other four helices [10]. The natural environment serves to preserve, survive, and vitalize humanity and create new green technologies.
The search for sustainable development of the planet as a central idea is a reality in this proposal. It speaks of social ecology, and the center of gravity of the discussion is global climate change. This aspect allows us to determine that this approach is a proposal before creating the SDGs [29]. The abuse of renewable and non-renewable natural resources is no longer conceived without global society’s participation in the substantive decisions on the impact this generates on the planet. Figure 1 presents the model used in this study, and Table A1 provides the definition.
A literature review was performed on SDGs and highlights that the increasingly constant and intense changes brought about by climate change and social inequality were a warning to humanity’s future in recent decades. Sustainable development became the main route to meet these challenges. In this sense, the United Nations intensified the orientations and policies towards sustainable development with various guidelines over time, such as the Brundtland Report [30], Global Compact [31], Millennium Development Goals (MDGs) [32], Paris Agreement [33], and the SDGs [34]. Consequently, sustainable development must be considered a priority and strategic in the countries’ policies [2].
Currently, the focus is on Agenda 2030 through the SDGs, which in general terms, is a set of objectives, goals, and actions that aim to guide governments, academics, entrepreneurs, and society as a whole towards a fairer and better world [5,35]. Through scientific studies, the academic sector also contributes to the SDGs, seeking to explore this theme, which is complex and depends on the harmony and integration of systems to achieve effective results [3,36].
The research identified three gaps related to the SDGs that could increase uncertainty [37] and hinder the implementation of measures and problem-solving.
The first gap is in indicator assessment because countries have autonomy in the implementation of the SDGs, which will require the collection of quality, accessible, and timely data. SDG assessment results can be ambiguous and confusing due to the lack of a well-designed conceptual framework of indicators [37]. Other authors warn that applying indicators in an inconsistent or uncoordinated manner can cause serious problems [38,39]. Therefore, consensus on the indicator framework and its use are needed.
The second gap is the lack of understanding between the MDGs and the SDGs [40]. The MDGs focused on countries, whereas the SDGs should be global. For this reason, new methods can help their implementation and systems thinking. The same study states that the danger is prioritizing individual goals without understanding the possible positive interactions between them [40].
The third gap is to understand the correlation between the SDGs in decision making [36,40]. For example, the decision-maker must understand that responding to the threat of climate change (SDG13) influences natural resource management (SDGs 14 and 15) and food production (SDG2). Conversely, climate stability (SDG13) and preventing ocean acidification (SDG14) will support sustainable food production and fisheries (SDG2) [41]. Other examples would be gender equality (SDG10) or improving health (SDG3), which help eradicate poverty (SDG1), and fostering peace and inclusive societies (SDG16), which will reduce inequalities (SDG10) and help economies thrive (SDG8) [8]. However, decision-makers cannot correctly identify interacting variables, which can harm the environment and compromise the SDGs’ scope [42]. It is essential to understand sustainable development from a broad and systemic approach, which considers each stakeholder’s importance to achieving a more socially just, inclusive, economically viable, and environmentally friendly development.
Along these lines, other studies sought to understand this complexity, reduce uncertainty and facilitate SDG-related decision making through modeling and simulation. For example, in a case study on sustainable tourism in Brazil [14], photovoltaic energy investments in Tanzania [42], and different models, including both scenario analysis and quantitative modeling [43]. However, there is no scientific research on the application of QHIM with the 20 indicators proposed in this study. Also, there are no studies on the Forgotten Effects Theory considering the QHIM and SDGs. In this sense, the study seeks to reduce the identified gaps and contribute to sustainable development with the proposed models. Consequently, the manuscript is novel and useful to various stakeholders, such as governments, society, and academia.
In this context, the present research intends to advance the frontier of knowledge on sustainable development, relating the QHIM with the SDGs through a case study in Latin America and contributing an algorithm in decision making. The next subsection is dedicated to case analysis.

2.2. QHIM: The Latin-American Countries’ Case

This subsection is dedicated to five Latin American countries’ case analysis concerning sustainable development applying the QHIM. The countries analyzed were Brazil, Chile, Colombia, Peru, and Mexico. The QHIM was the model chosen to carry out the case study because it is scientifically based on the importance of integrating the five systems to achieve sustainable development [10,18].
However, the model has some drawbacks associated with the choice of indicators and data homogenization. Useful tips to overcome the drawbacks are: (i) use official databases, (ii) the indicators must present transversal characteristics. In this way, it will be possible to compare each helix, and according country’s real situation, (iii) use the same period, (iv) create a single value scale, and (v) validate the indicators with experts.
The study focused on this region of the world, but the model presented is generic, which means that it can compare any country. Brazil and Mexico were selected for this case study because they are the two countries with the largest Latin American populations. Colombia and Peru have an intermediate population concerning the first two and Chile, the latter being the least densely populated of the five.
Also, this region of the world presents, in general terms, short-term policies, low investment in Research and Development (R&D), and a low number of scientists per million inhabitants. These countries also have low scientific and technological production, economies with high percentages of informality and unemployment, and inefficient use of renewable and non-renewable resources. Finally, society’s low participation as an “auditor” of the activities carried out in the political, educational, business, and environmental spheres is evident [6,44]. This selection shows that the indicators applied are useful, regardless of the size of the country analyzed.
The data from official sources correspond to the period between 2000 and 2017. It should be noted that only some indicators had data until 2019, so a period was chosen in which all the information was available. The study uses 20 indicators that represent the QHIM as criteria for analysis. Each helix was assigned four indicators that are associated with the SDGs. Ten experts in the field of sustainability validated the indicators. The 20 indicators present transversal characteristics that allow a generic comparison of each helix and close the relationship with each country’s real functioning. For this purpose, the proximity and remoteness method and ten initial indicators were used for each helix until a consensus was reached. Subsequently, the SDGs were assigned to each helix.
Official sources use different measurement scales when presenting data, which could make analysis difficult. For this reason, the study will use the same scale to homogenize the data. In this case, the endecadary scale with 11 values of [0, 1] will be used. Thus, the value closest to 1 expresses an approach to sustainable development, and the value closest to 0 shows a move away from development. Table A2 shows the five helixes’ analysis criteria, the 20 indicators, the concepts, and the SDGs’ links. The results of the case study are presented below. Also, Table A3 details the results of QHIM indicators.
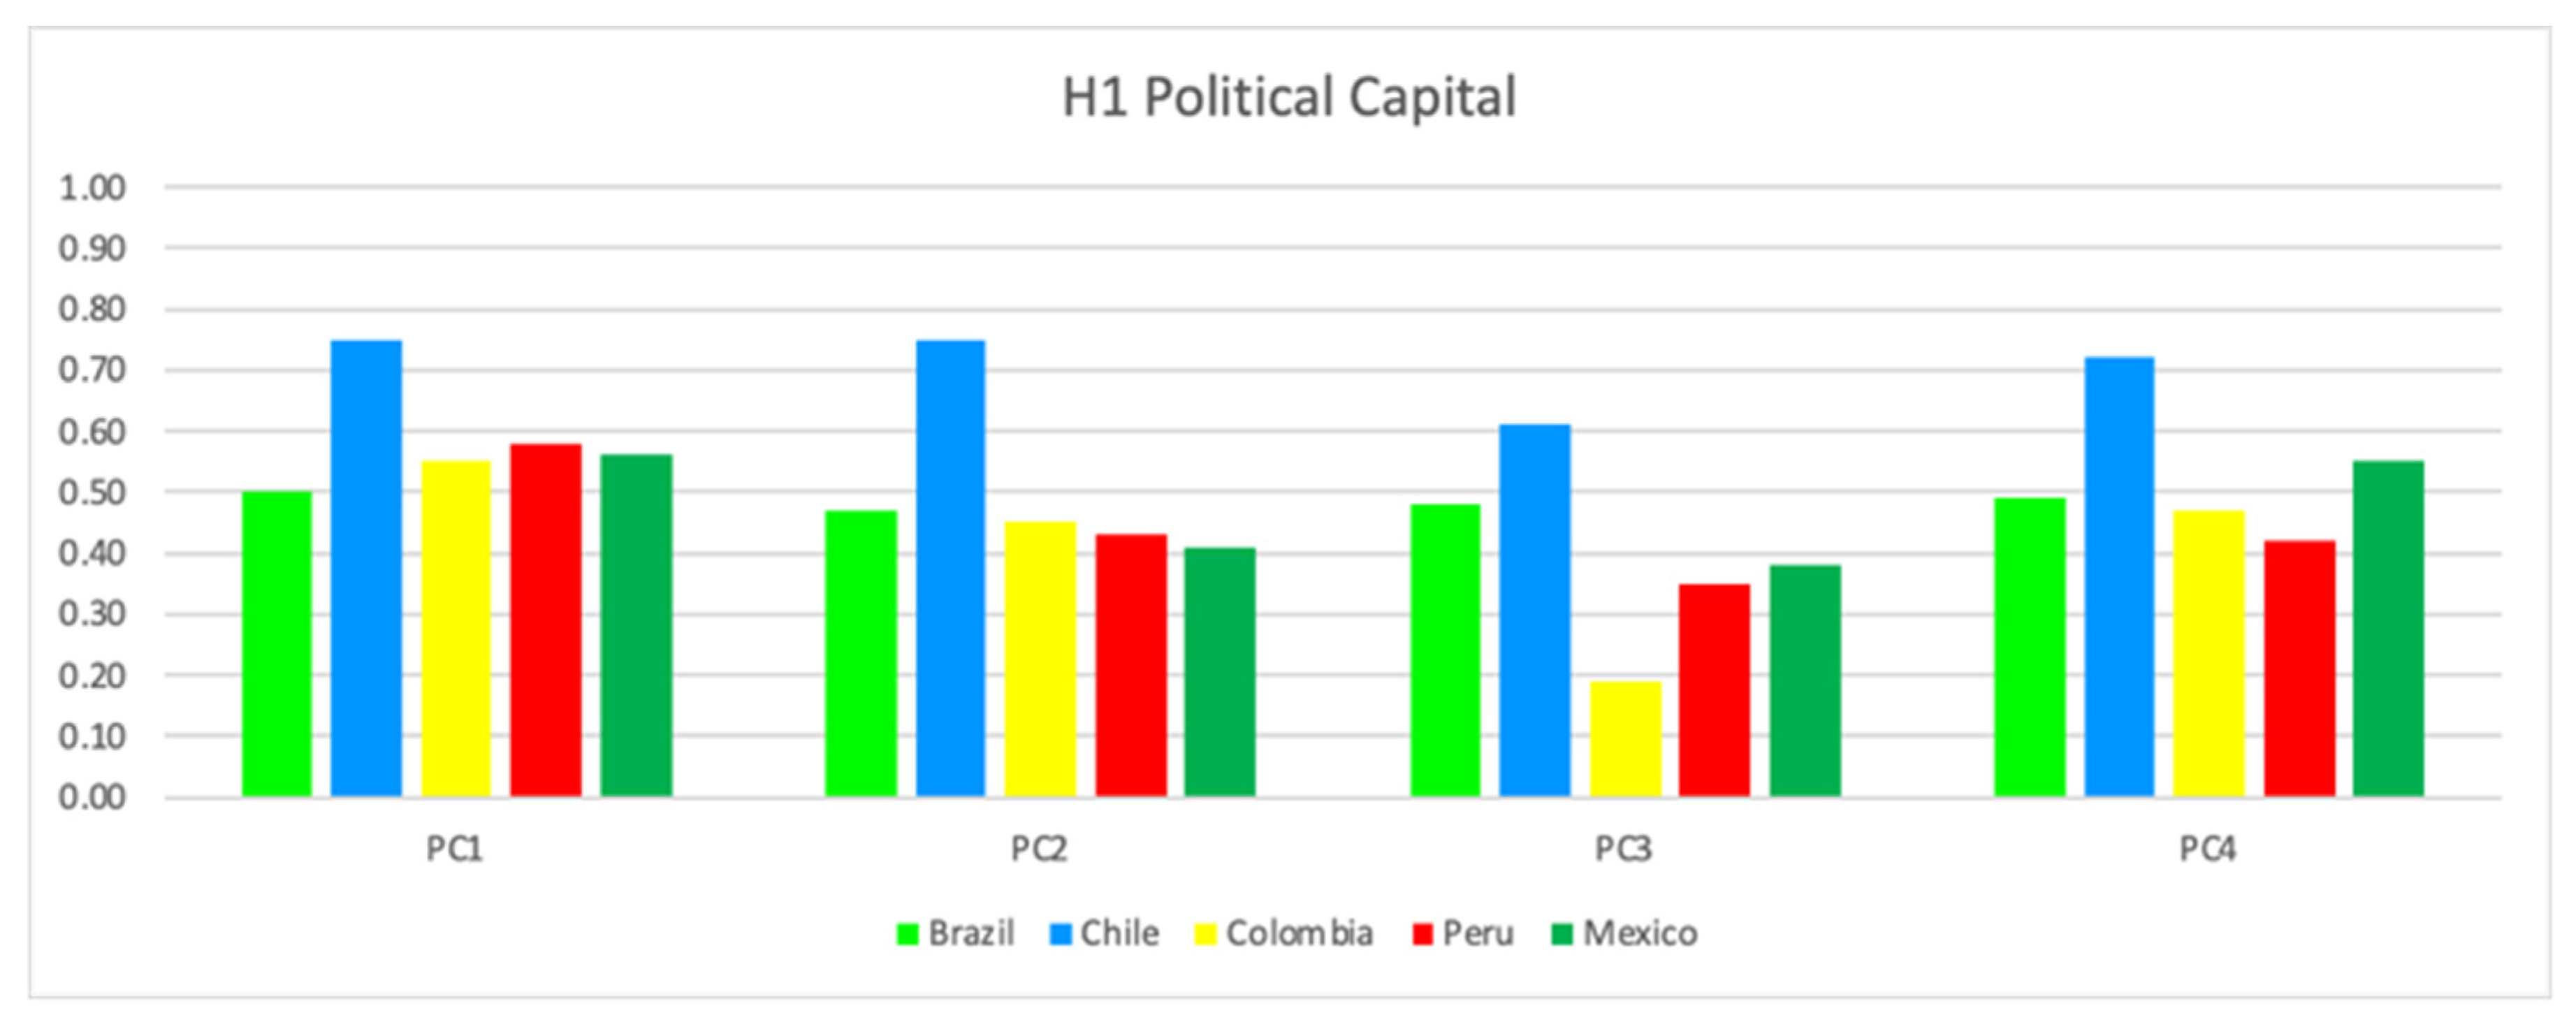
Firstly, Figure 2 presents the four indicators of political capital (PC). The results indicated that Chile leads in all indicators of helix 1. On the other hand, there was an alternation in second place between Peru (PC1), Brazil (PC2 and PC3), and Mexico (PC4). In general terms, Brazil, Colombia, Peru, and Mexico presented results below 0.50, which shows these countries’ fragility in political capital. Consequently, low government regulatory capacity, corruption, political instability, and inadequate public services can be barriers to achieving the SDGs (3, 10, 11, 16, and 17).
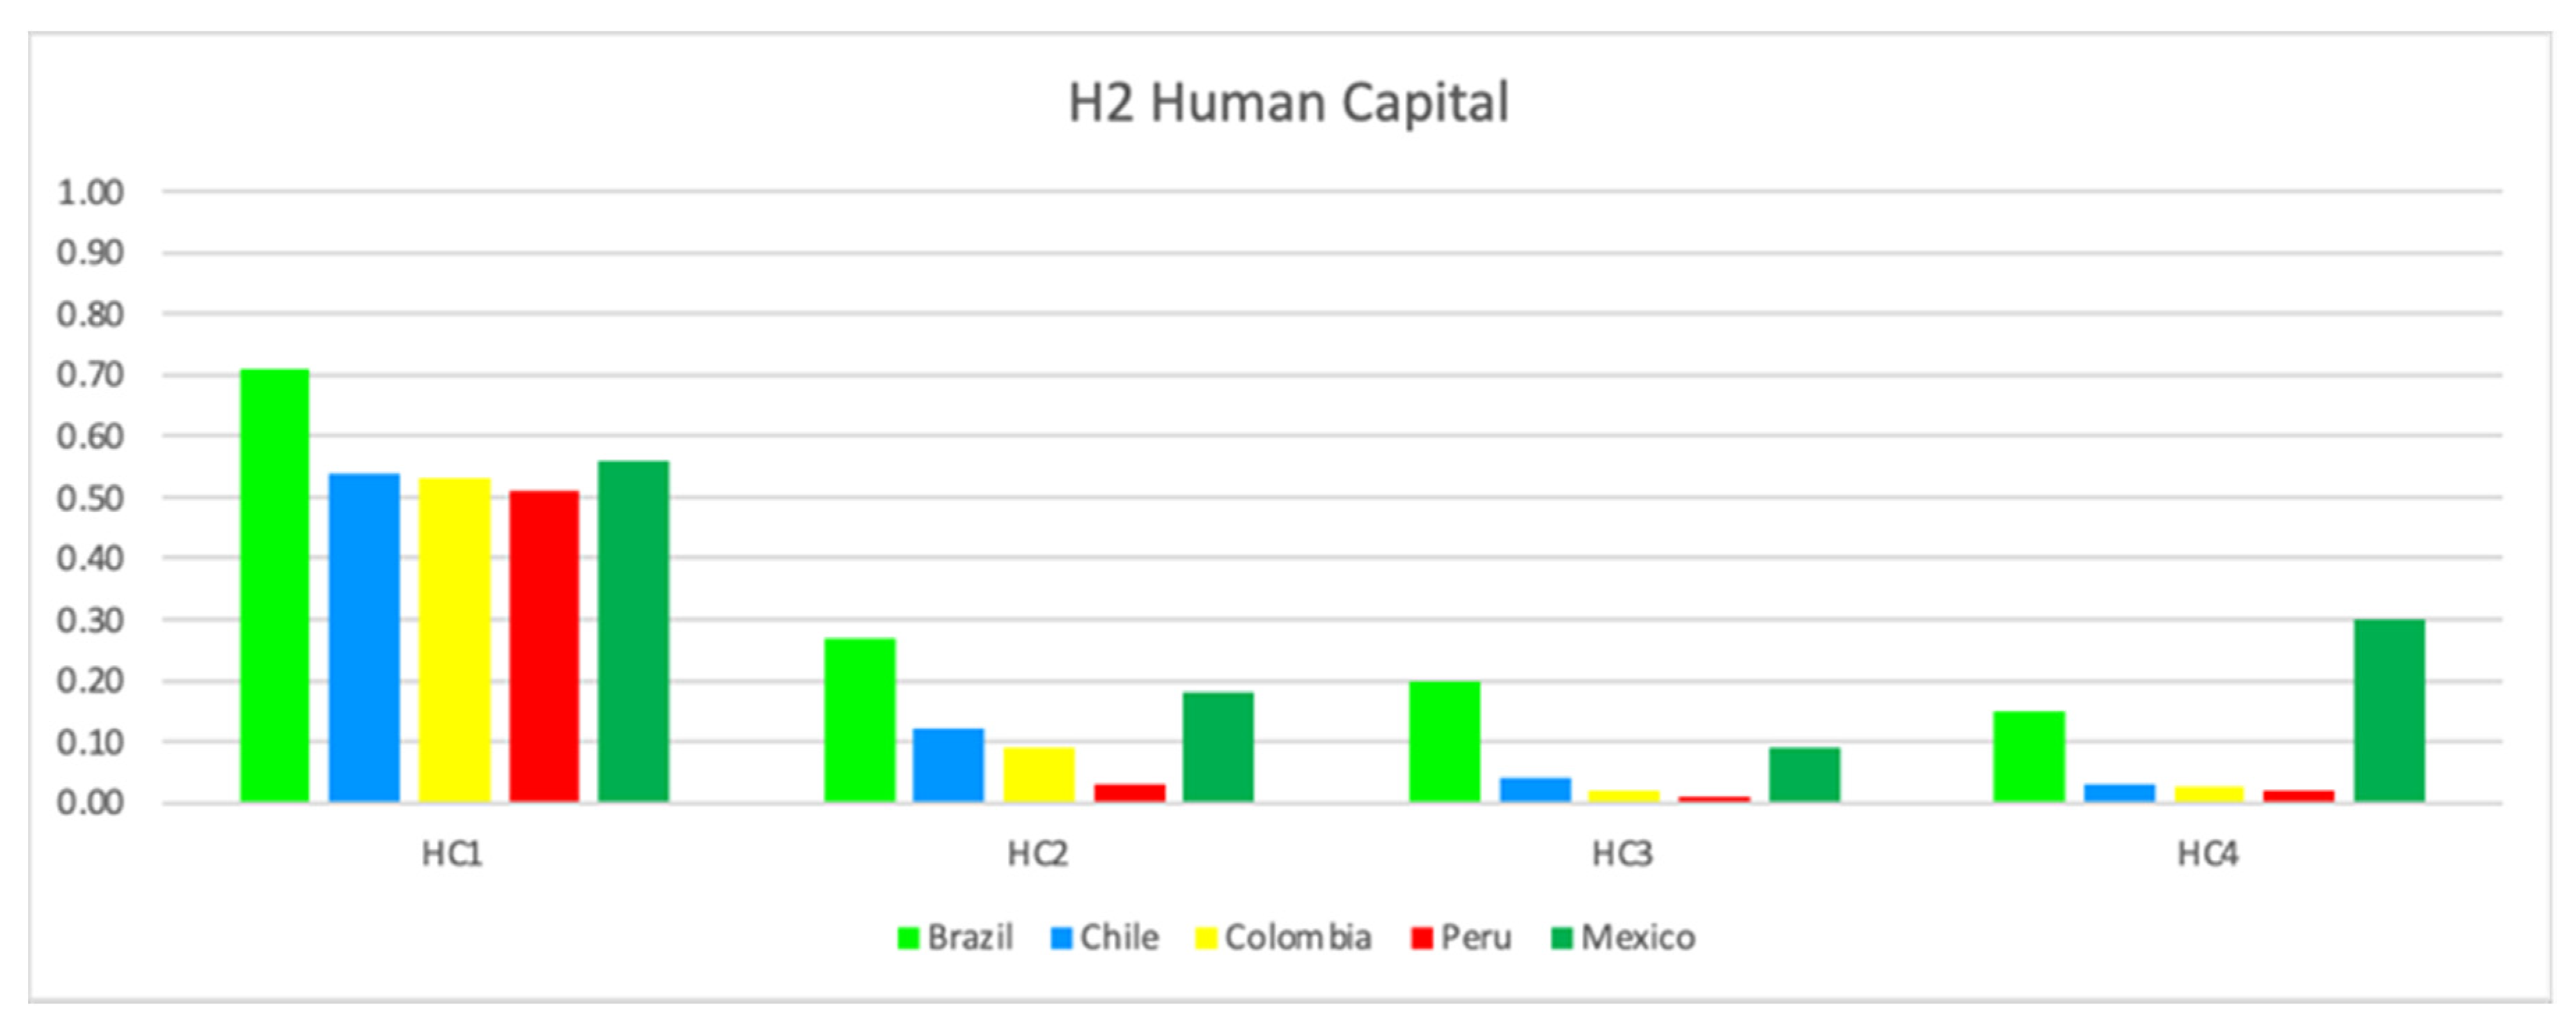
Secondly, Figure 3 shows the human capital (HC) indicators. The results revealed that Brazil led in three indicators (HC1, HC2, and HC3) and Mexico in one indicator (HC4). Overall, all five countries had the best result in HC1, which refers to total R&D expenditure. However, the total score for helix 2 would be below 0.30 (except for Brazil with 0.32), which shows a weakness in the education helix. At the same time, a concern, since low investment in education will compromise the reach of SDGs 4 and 9.
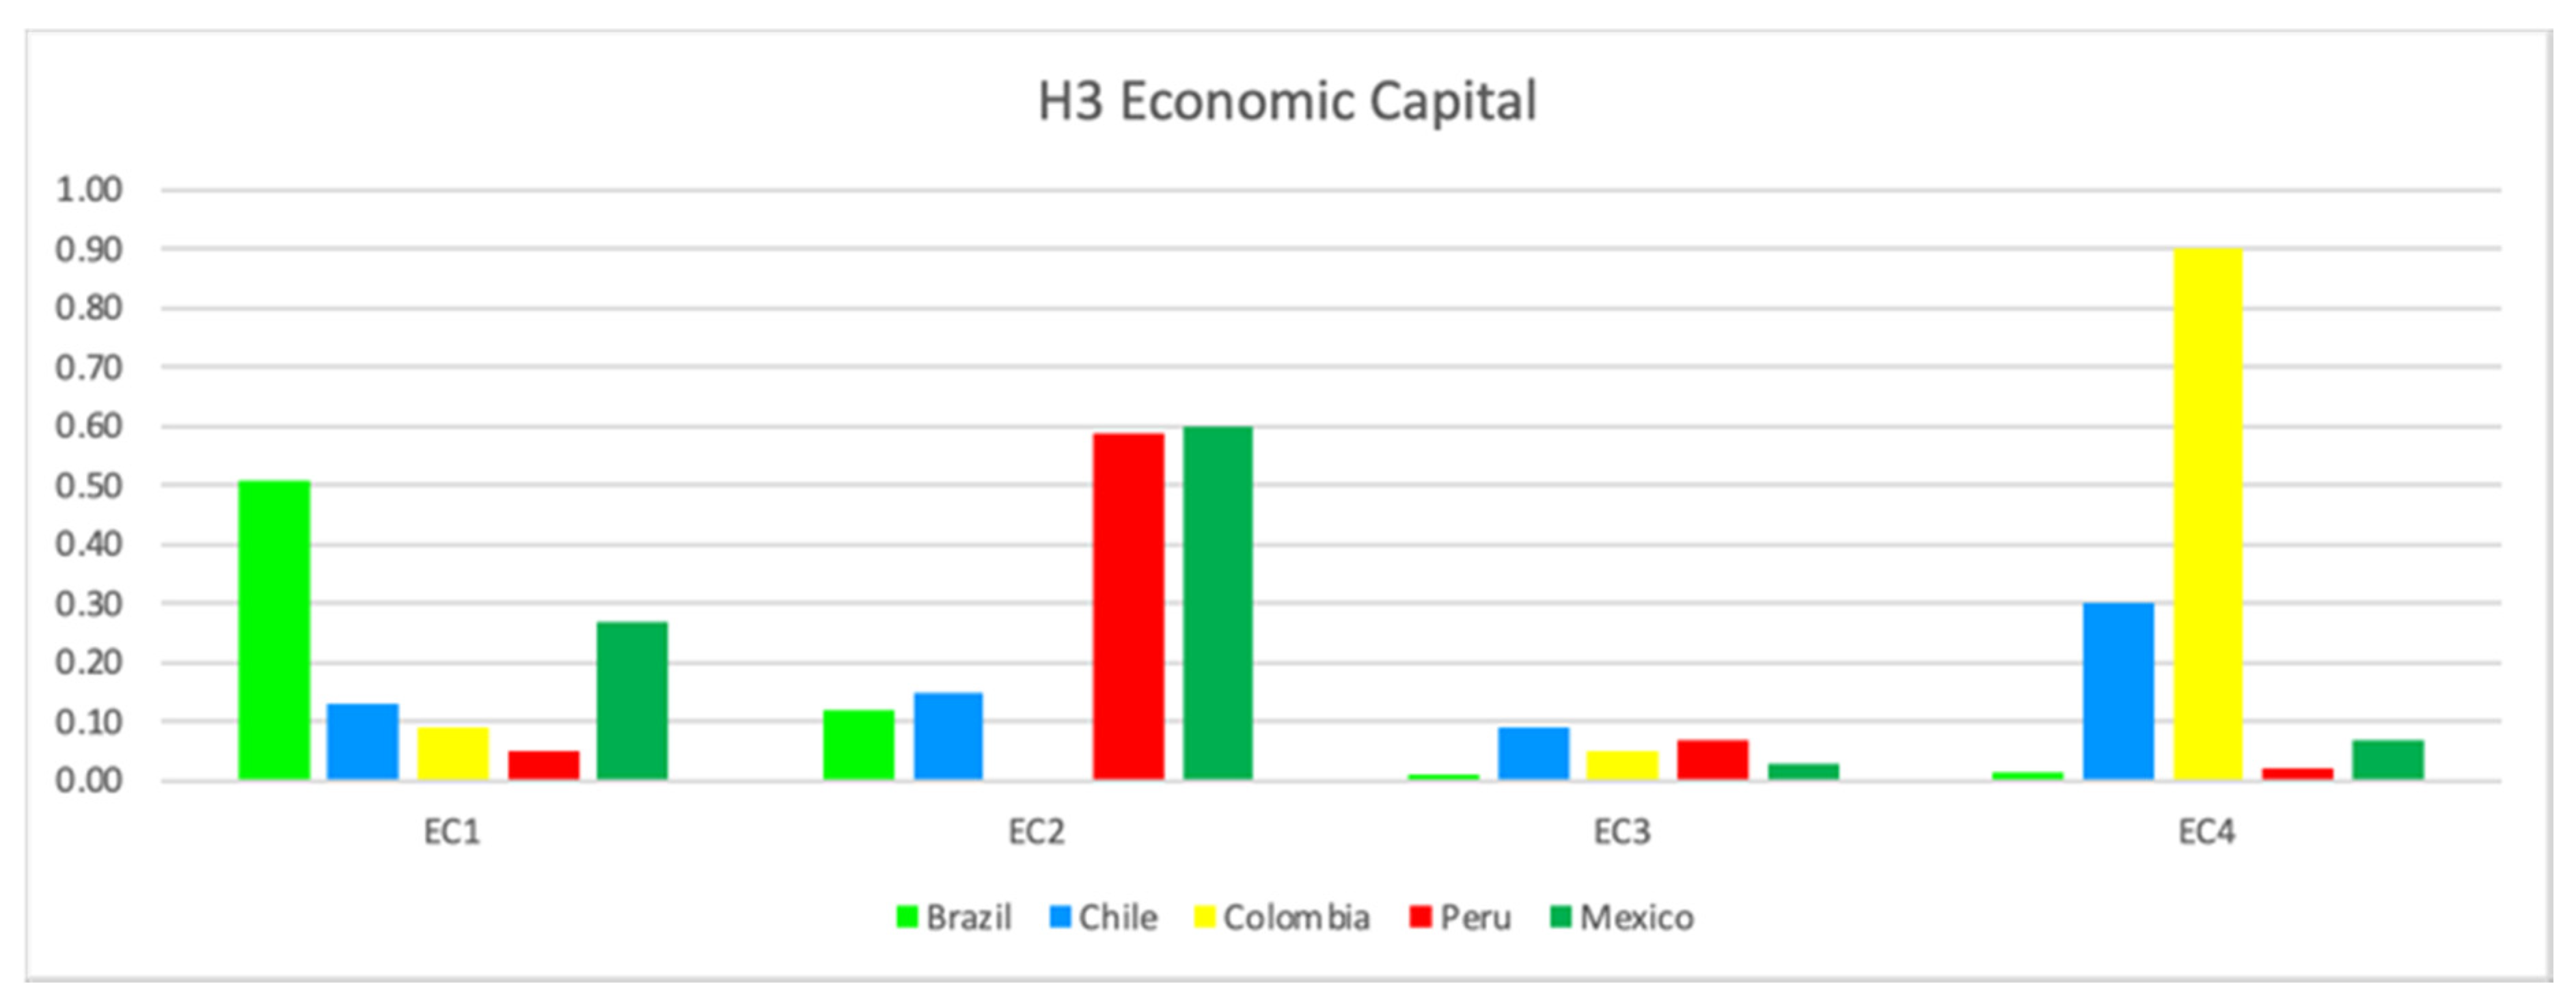
Thirdly, Figure 4 shows the indicators of helix 3, economic capital (EC). The results indicated that Colombia led in EC4, Mexico in EC2, Brazil in EC1, and Chile in EC3. In general, economic capital presented the worst result among all the helices. In general terms, the region has low foreign direct investment, high unemployment, a weak current account balance, and low purchasing power. As a consequence, it will negatively affect the fight against poverty (SDG1), hunger (SDG2), decent work (SDG8), industry, innovation and infrastructure (SDG9), and partnerships (SDG17).
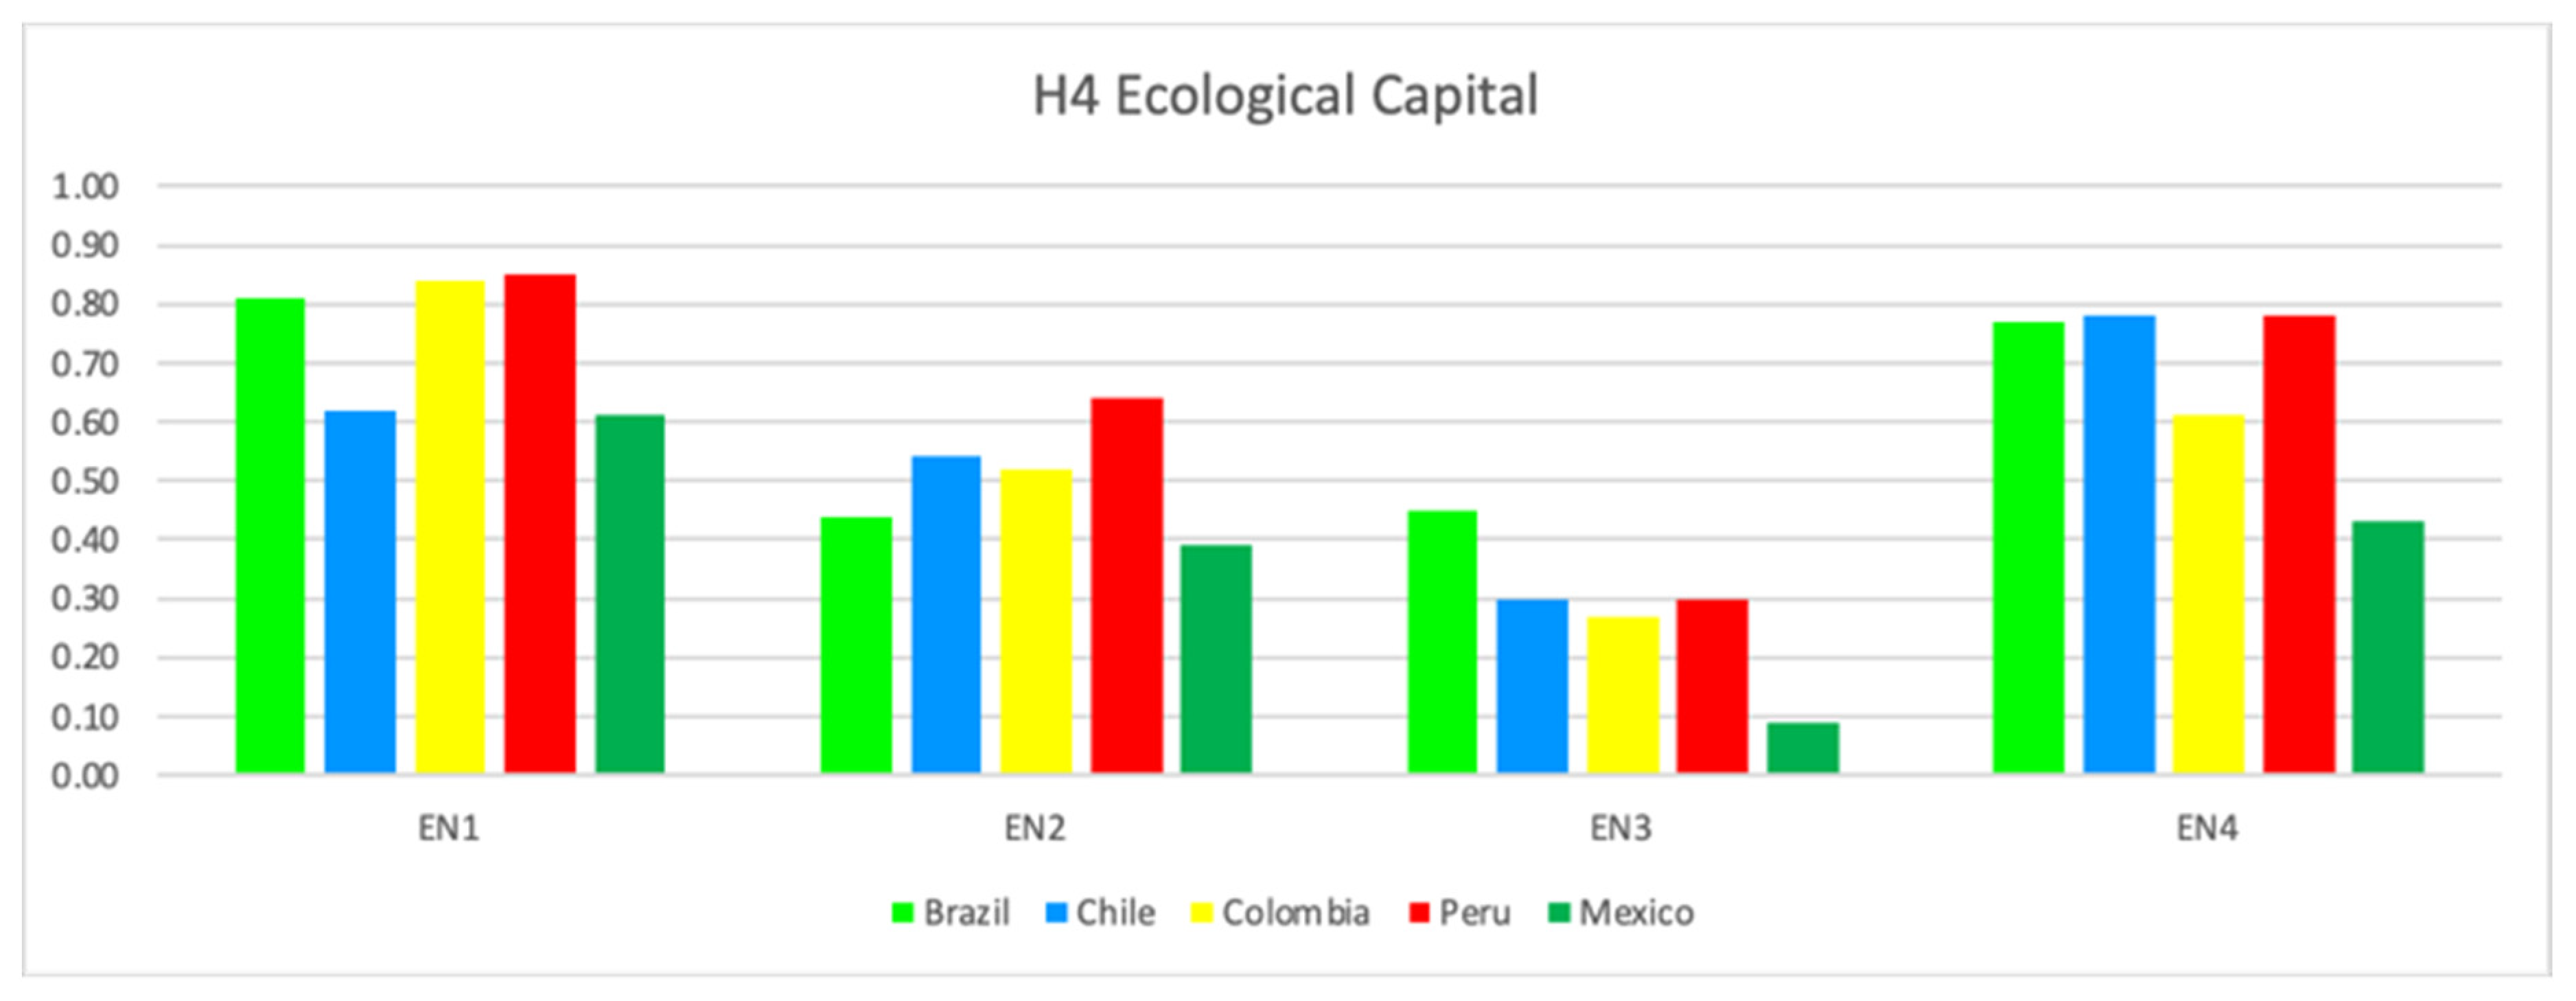
Fourthly, Figure 5 presents the indicators of ecological capital (EN). Peru led in EN1, EN2, and EN4, and Brazil in EN3. Except for Mexico, the other four countries achieved a score above 0.60. In Mexico’s case, the lowest ratings were in renewable energy (EN3) and population density (EN4), which impacted the final result. In helix 4, the countries analyzed show a small advance towards achieving the objectives (SDG 1, 2, 6, 7, 13, 14, and 15).
Fifthly, Figure 6 shows the social capital indicators (SC). Chile led in SC1, SC2, and SC4, and Mexico in SC3. All five countries presented total scores above 0.50, indicating some progress in gender development, human development, and poverty reduction, contributing to the SDGs (SDG 1, 2, 5, 10, 11, 12, and 15). However, the results point to the existence of gaps in the social sphere.
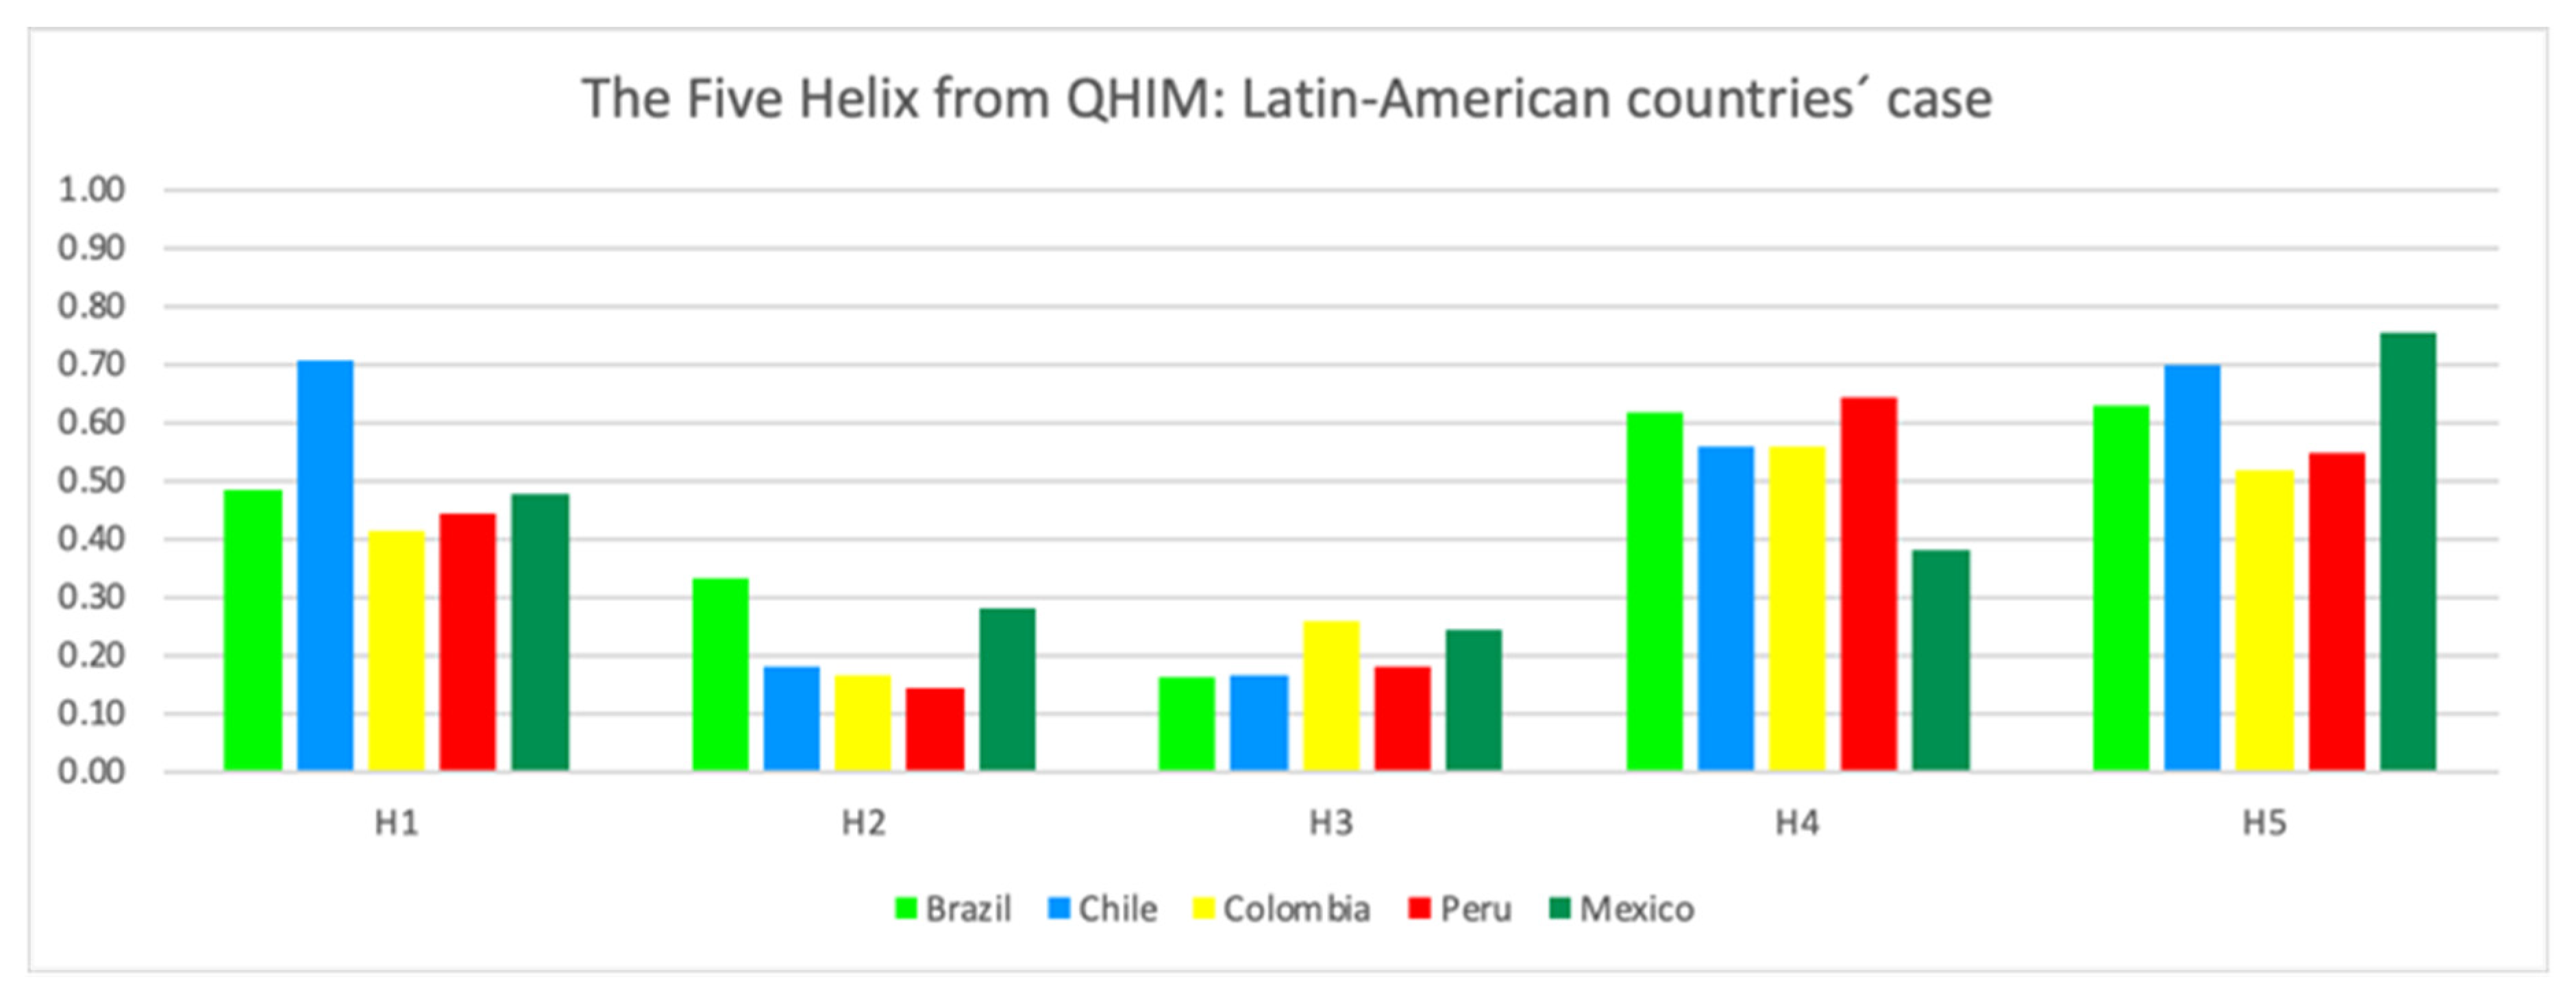
Figure 7 reveals the overall result of the five helices. Also, Table A4 shows the results of QHIM per each helix and country. The result of each helix is the average value of the four indicators per block. Social capital led the ranking (0.63), followed by ecological capital (0.55). Political capital would be in third position (0.51), followed by human capital (0.22) and economic capital (0.20). Chile led in H1, Brazil in H2, Colombia in H3, Peru in H4, and Mexico in H5.
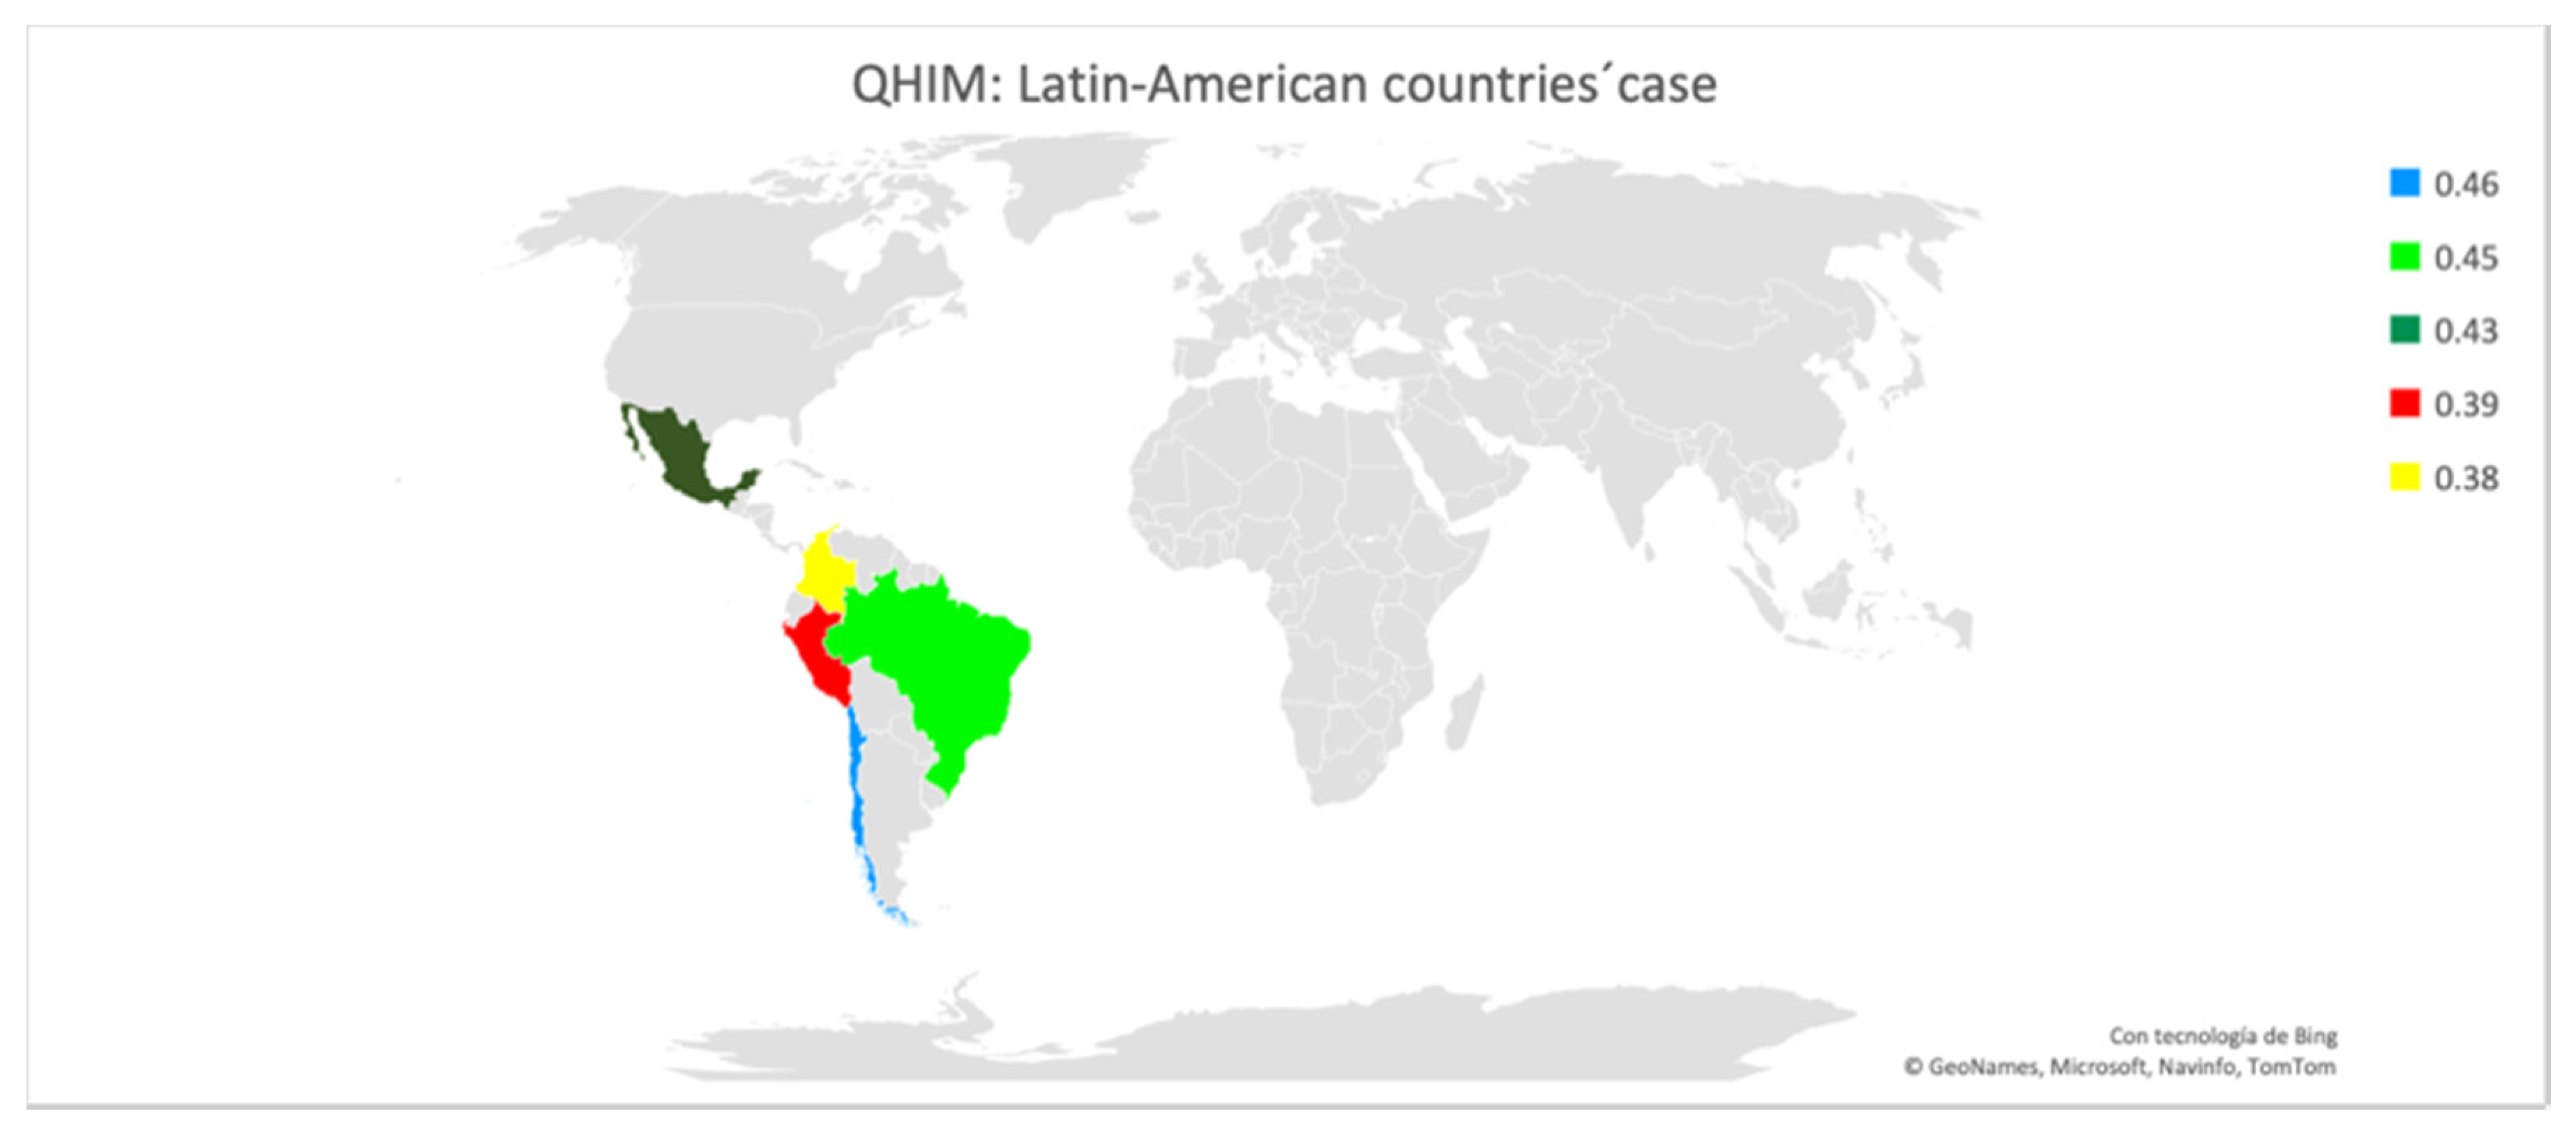
Finally, Figure 8 shows the result of applying the QHIM through the case study in Latin America. The total value represents the average of the five helices for each country. Chile led the ranking with an overall score of 0.46. The second position would be Brazil (0.45), followed by Mexico (0.43), Peru (0.39), and Colombia (0.38).
It should be remembered that the rating scale used was 11 values [0, 1]. Thus, the value closest to 1 expresses an approach to sustainable development, and the value closest to 0 shows a distance to sustainable development. Therefore, results show that there is still a long way to go for the countries analyzed towards sustainable development according to the indicators proposed by the QHIM. The main reason for this would be the low performance in the human and economic capital indicators.
Therefore, the study recommends that countries increase investment in education, incentives for research and development, fiscal balance, economic stimuli, foreign investment, and quality employment. The next subsection explains the use of the Forgotten Effects Theory.

2.3. Forgotten Effects Theory

This subsection explains the simulation algorithm and presents the process carried out to identify sustainable development’s forgotten effects.
The “Forgotten Effects Theory” [54] is the mathematical model chosen to simulate this research. This algorithm was applied in several knowledge areas based on previous studies and presented reliable decision-making results [14,55]. However, the model has drawbacks associated with the selection of variables and the choice of experts. Useful tips for solving these problems are: first, it is necessary to know the research topic well and support the use of the variables scientifically. Secondly, it is essential to invite experts on the subject under investigation with time available to collaborate.
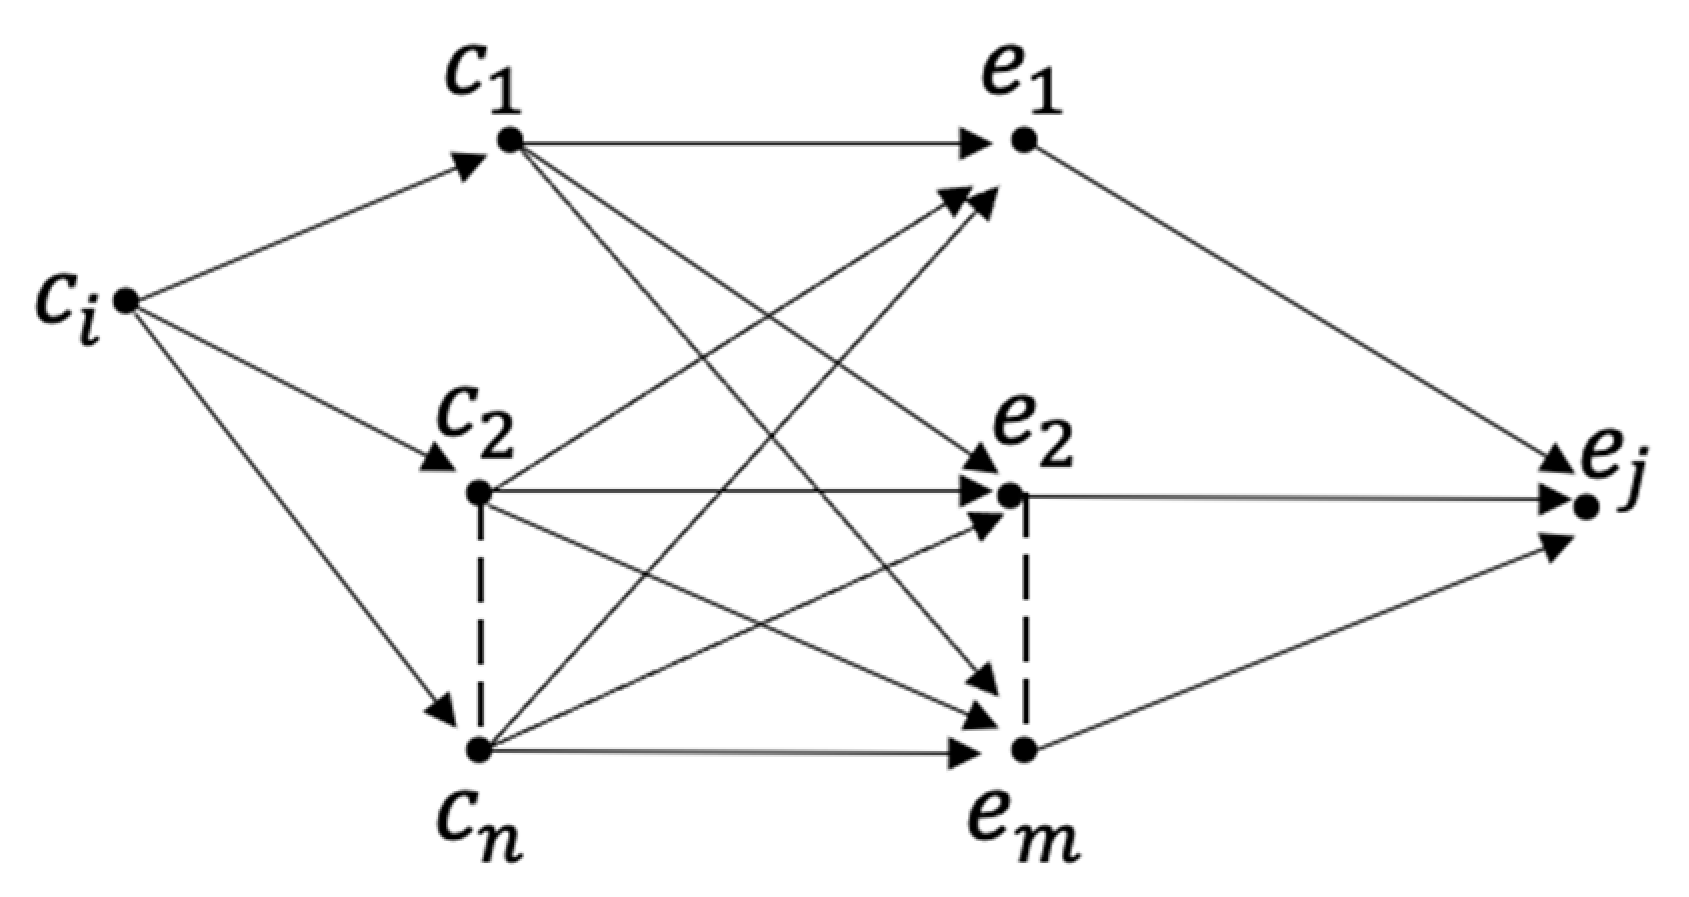
The process begins with the presence of a direct incidence relationship, defined by a cause-and-effect matrix defined by two sets of elements: C = { c i / i = 1 , 2 , , n } which act as causes; E = { e / j = 1 , 2 , , m } which act as effects and a causality relationship G ˜ defined by the n × m dimension matrix: [ G ˜ ] = { μ c i e j [ 0 , 1 ] / i = 1 , 2 , ,   n ; j = 1 , 2 , , m } being μ ( c i , e j ) of the values the characteristic function of belonging of each one of the elements of the matrix G ˜ (formed by the rows corresponding to the set’s elements-causes-and the columns corresponding to the elements of the set-effects). The matrix G ˜ , also named first-generation, is the result of cause-effect estimates. The assigned value belongs to the interval [0, 1], where zero means the lowest value, and the closer to 1, the higher the incidence rate.
The second step is to calculate the relationships between the causes, and the relationships between the effects, through two square auxiliary matrices. These two matrices include the possible effects derived from relating causes and effects to each other: [ C ˜ ] = { μ c i c j [ 0 , 1 ] / i , j = 1 , 2 , , n } and [ E ˜ ] = { μ e i e j [ 0 , 1 ] / i , j = 1 , 2 , , m } .
The Matrix [ C ˜ ] shows the incidence relationships that can occur between causes, and the matrix [ E ˜ ] presents the incidence relationships that can occur between effects. Both matrices are reflexive: μ c i c j = 1   i = 1 , 2 , , n and μ e i e b j = 1   j = 1 , 2 , , m . Therefore, an element, either cause or effect, affects itself with the greatest presumption. Neither [ C ˜ ] nor [ E ˜ ] are symmetrical matrices, there is at least some pair of subscripts i , j so: μ c i c j μ c j c i   a n d   μ e i e j μ e j e i .
The third step is to establish the direct and indirect incidences, through the maximum-minimum composition of the three matrices (1): [ C ˜ ] [ G ˜ ] [ E ˜ ] = [ G ˜ * ] . The result is the matrix [ G ˜ * ] that collects the incidences between causes and effects of second generation.
[ G ˜ * ]   =   e 1 e 2 e m c 1 μ * c 1 e 1 μ * c 1 e 2 μ * c 1 e m c 2 μ * c 2 e 1 μ * c 2 e 2 μ * c 2 e m c n μ * c n e 1 μ * c n e 2 μ * c n e m
The fourth step is to calculate the degree to which some causal relationships were forgotten or overlooked (2): [ F ˜ ] = [ G ˜ * ] [ G ˜ ] .
[ F ˜ ] = e 1 e m c 1 μ * c 1 e 1 μ c 1 e 1 μ * c 1 e m μ c 1 e m c 2 μ * c 2 e 1 μ c 1 e 1 μ * c 2 e m μ c 2 e m c n μ * c n e 1 μ c n e 1 μ * c n e m μ c n e m
With the result, it is possible to know the element that has been interposed between cause and effect. Figure 9 indicates the steps to follow.
Finally, the forgotten effects matrix shows that values closer to number 1 have a more significant forgotten effect. Therefore, some effects were not considered initially, and that can generate negative impacts.
The algorithm identifies an interposed element that enhances and accumulates the causal relationship’s effects from its application. Therefore, the results allow predicting and acting more effectively on the causes, thus minimizing the effects.

2.4. Simulation Process

To proceed with the calculations, the software FuzzyLog© was used, which allows the elaboration and work with models based on the mathematics of uncertainty to recover the so-called forgotten effects in the causality relations. This program facilitates the values’ insertion and automatically solves the incidence matrices’ calculation, showing all the results directly in their different versions and variants in graphic and numerical form for their corresponding analysis. Researchers have validated this tool’s effectiveness as robust, reliable, and easy to operate [13,56].
The research used the simulation process proposed by the authors [16], which consisted of four stages: (1) Analysis of a real-world problem, (2) Development and validation of the conceptual model, (3) Codification and verification of the model, and (4) Experimental development and simulation results.
The first stage of the simulation process corresponds to the five Latin American countries’ case analysis presented in Section 2.2.
The second stage consisted of developing and validate the conceptual model, beginning with identifying the study variables. Two sets of interrelated elements have been proposed from the literature review that act as causes and effects. Three academic specialists on the subjects validate the 22 variables that are the study object in the simulation. They are professors and researchers in Brazil, Colombia, and Spain.
In this case, the set of causes represents the five innovation helixes and is presented as: C = { c 1 , c 2 , c 3 , c 4 , c 5 } . Table 1 presents a set of causes.
The set of effects constitutes the SDGs and is presented as: E = { e 1 , e 2 , e 3 , e 4 , e 5 , e 6 , e 7 , e 8 , e 9 , e 10 , e 11 , e 12 , e 13 , e 14 , e 15 , e 16 , e 17 } . Table 2 presents a set of effects.
The third stage was to code and verify the model proposed. All variables were inserted into the FuzzyLog© software provided by Anna María Gil-Lafuente, and a review of the data performed. Lastly, with the appropriate programming, the simulation was carried out.
Finally, in the experimental development stage, the specialists estimated the direct incidence between the two sets of causes and effects shown in the matrix [ M ˜ ] . The assigned value belongs to the interval [0, 1], where zero means the lowest value, and the closer to 1, the higher the incidence rate. After collecting the assessments of each specialist, an average is calculated to obtain the consolidated outcome. Figure A1 shows the results.
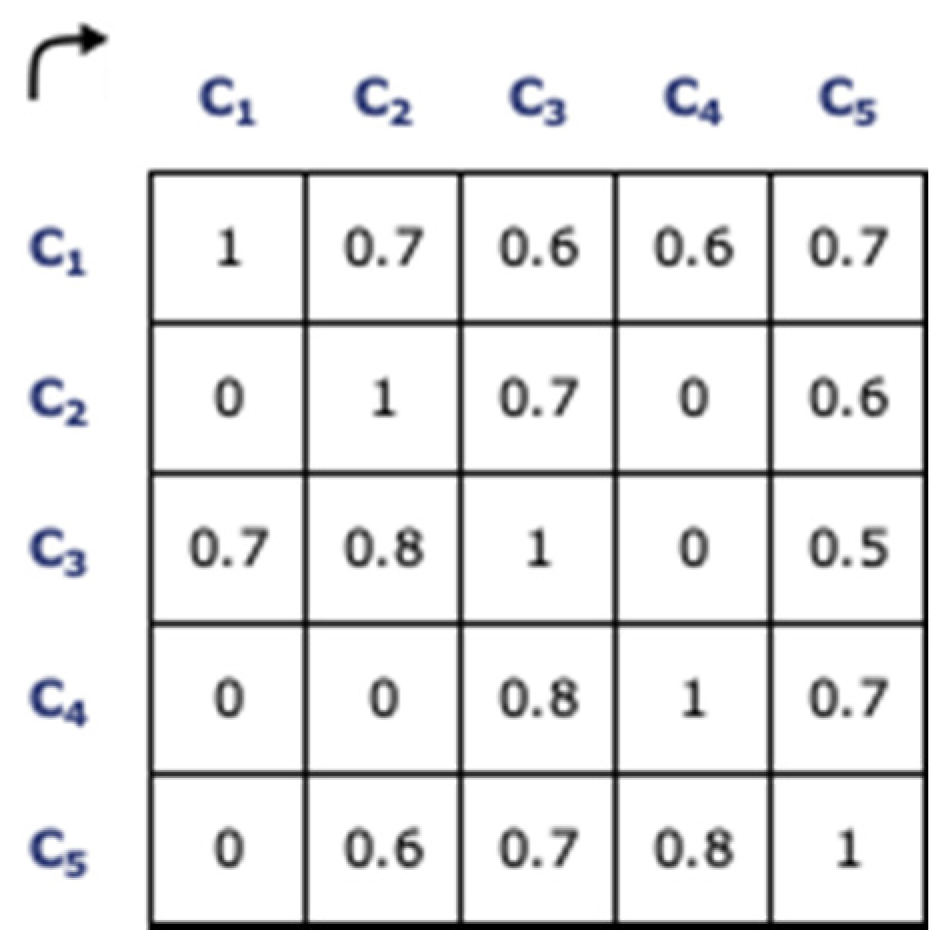
Next, the same specialists evaluated the incidences between the causes and between the effects. The specialists sent the answers by e-mail in spreadsheet format. An average was then calculated to aggregate the values. As a result, the matrix between causes and the matrix between effects is generated, represented in Figure A2 and Figure A3, respectively.
With the three matrices [ M ˜ ] , [ A ˜ ] ,   and [ B ˜ ] , the accumulated effects matrix was calculated [ M ˜ * ] . Figure A4 presents the results of the matrix calculation [ A ˜ ] [ M ˜ ] [ B ˜ ] = [ M ˜ * ] .
Finally, the Forgotten Effects Matrix was calculated: [ F ˜ ] = [ M ˜ * ] [ M ˜ ] . Figure A5 shows the results.
The results of the Forgotten Effects Matrix indicated the effects not observed or forgotten during the assessment stage. The higher the value, the greater the degree of forgotten effect. Therefore, values closer to the number 1 deserve special attention from the decision-maker. The most relevant results of the simulation are presented below.

3. Results of Simulation Applying the Forgotten Effects Theory

This section presents the main results applying the Forgotten Effects Theory. The selection criterion used was to detail one result for each helix due to this publication’s page limit. These five results presented are sufficient to validate the model. The incidences chosen should be between 0.8 (almost full incidence) and 0.9 (practically full incidence) [57]. Future studies may explore other application results.
Table 3 shows these cause-effect relationships that presented high incidences of 0.8 and 0.9 and recovered with the model’s application.
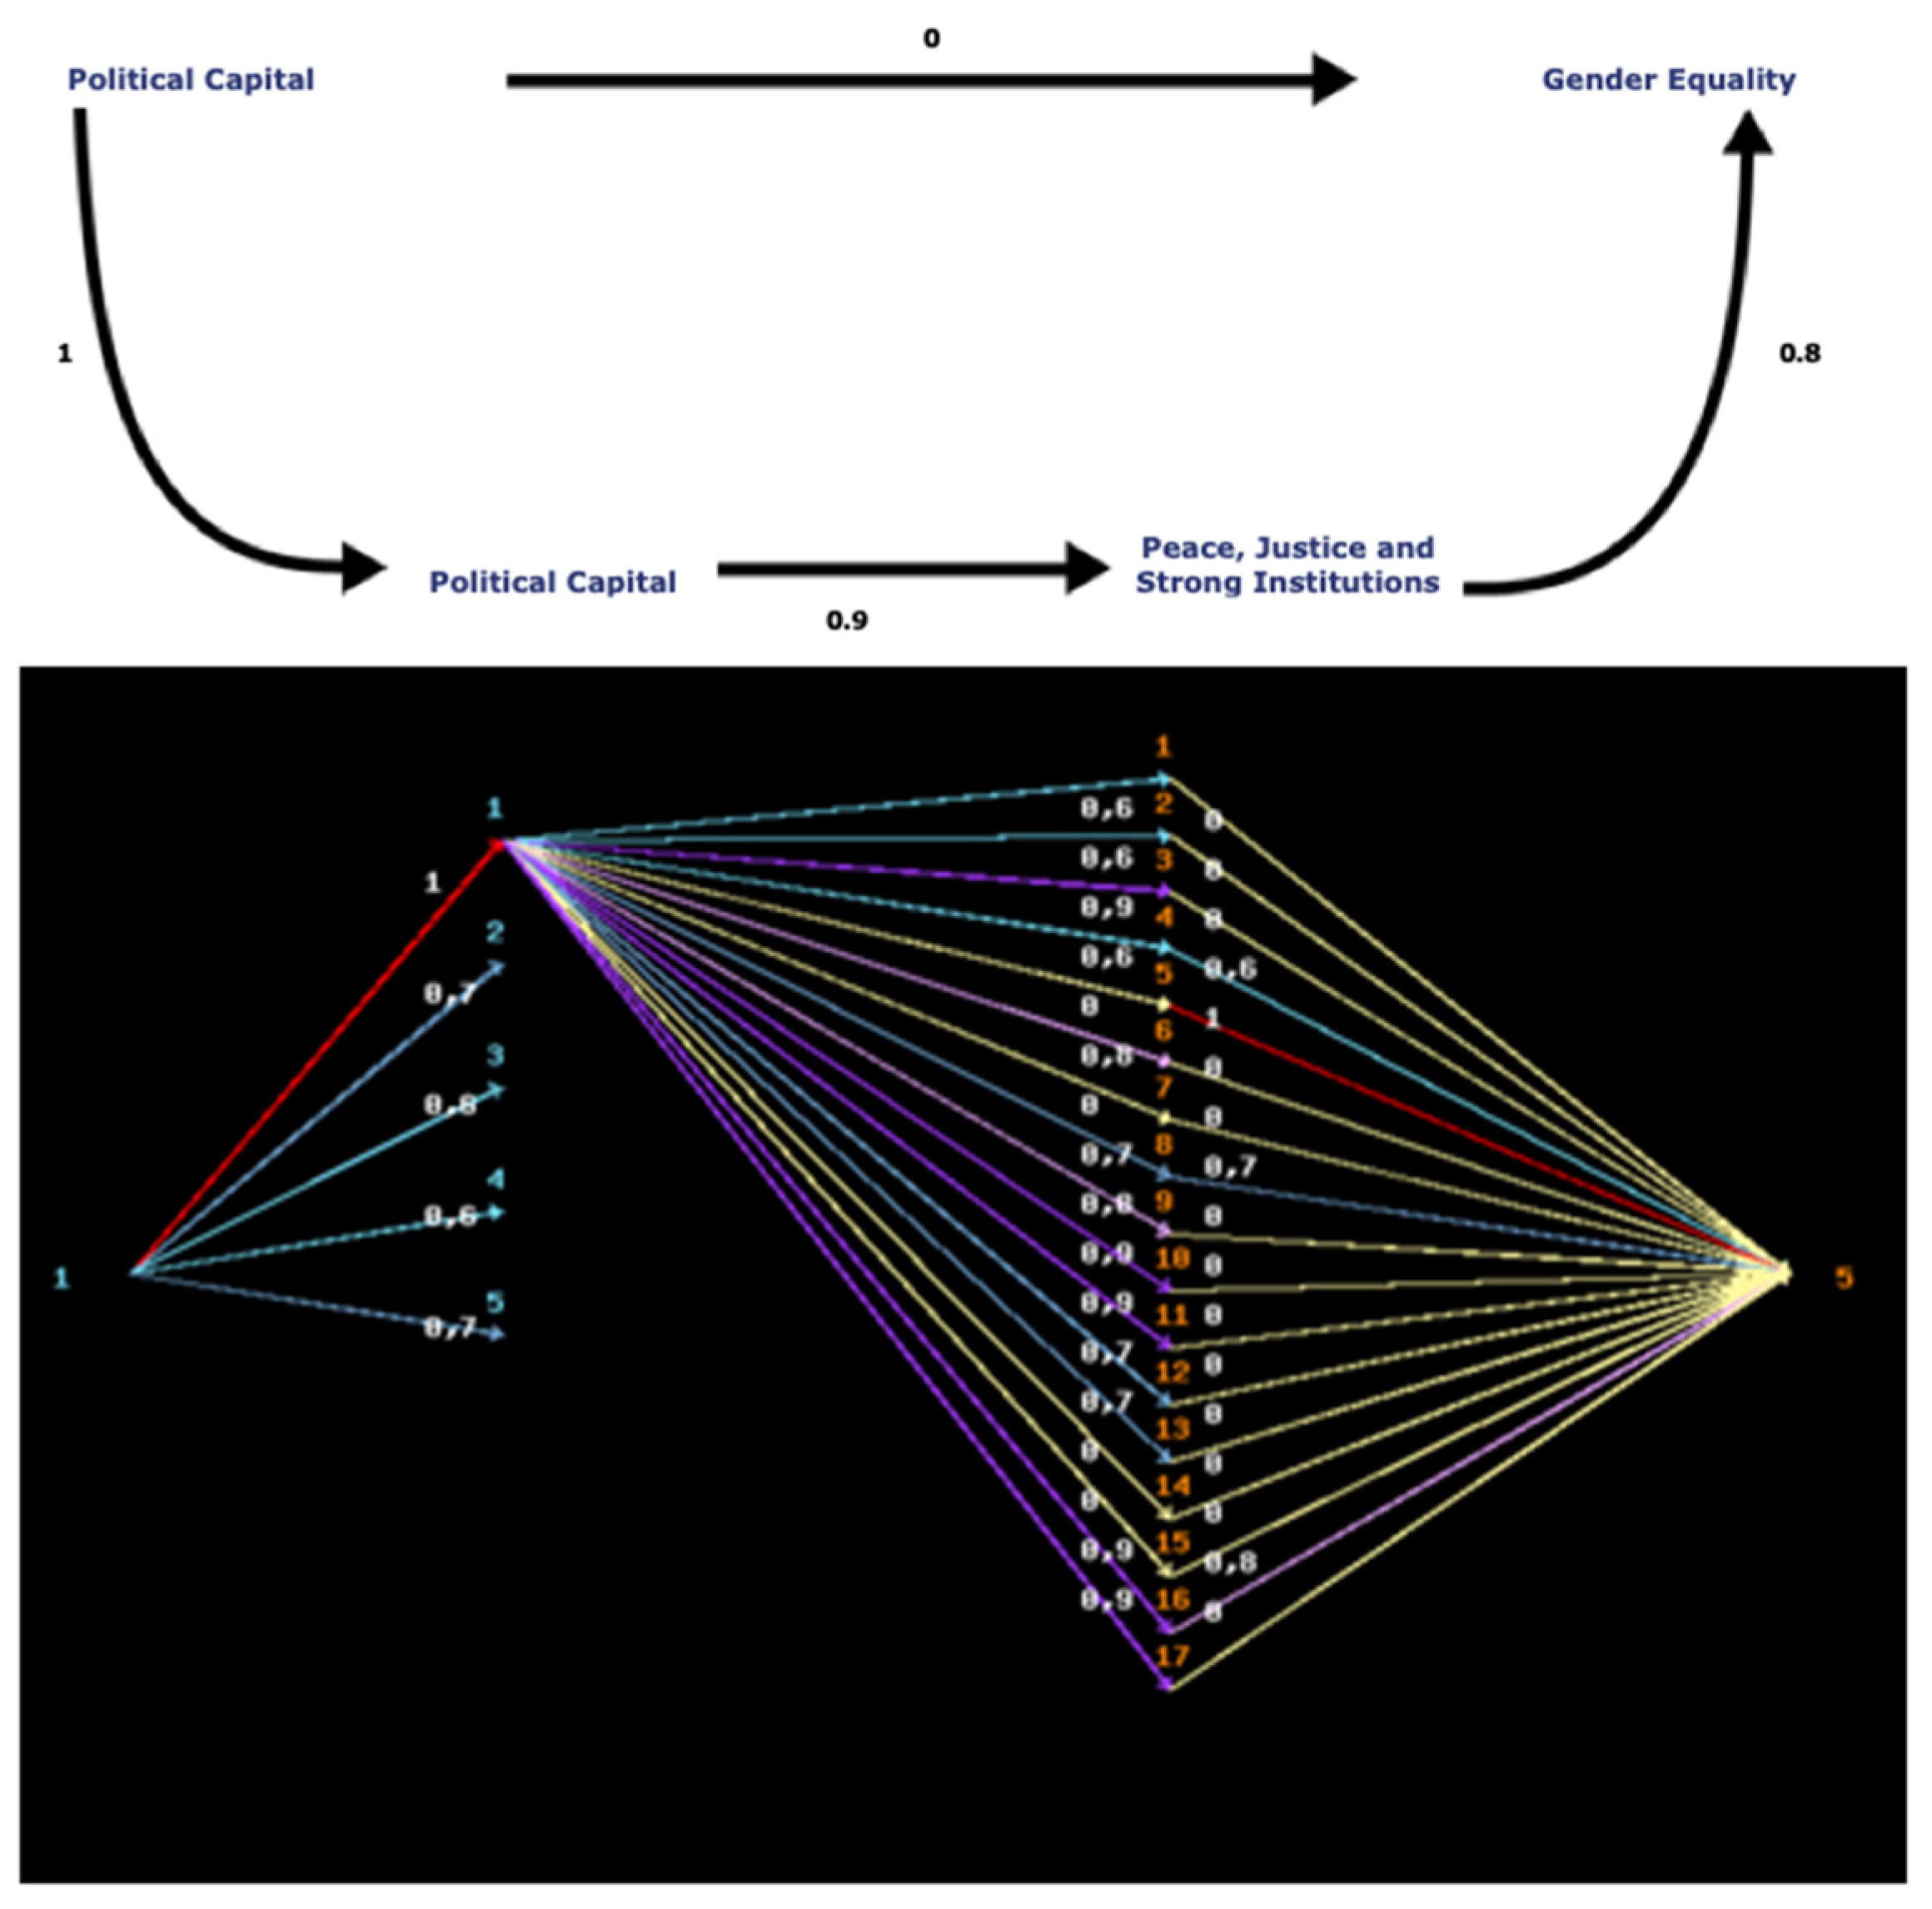
Firstly, Figure 10 shows the non-existence of a relationship between political capital (H1) and Gender Equality (SDG 5). However, it can be seen that the interposed element (SDG16) Peace, Justice, and Strong Institutions potentiated this relationship to 0.8. The figure also shows the path traveled with all incidents. Therefore, the result indicates that to achieve SDG5 political capital and strong institutions are needed to promote gender equality.
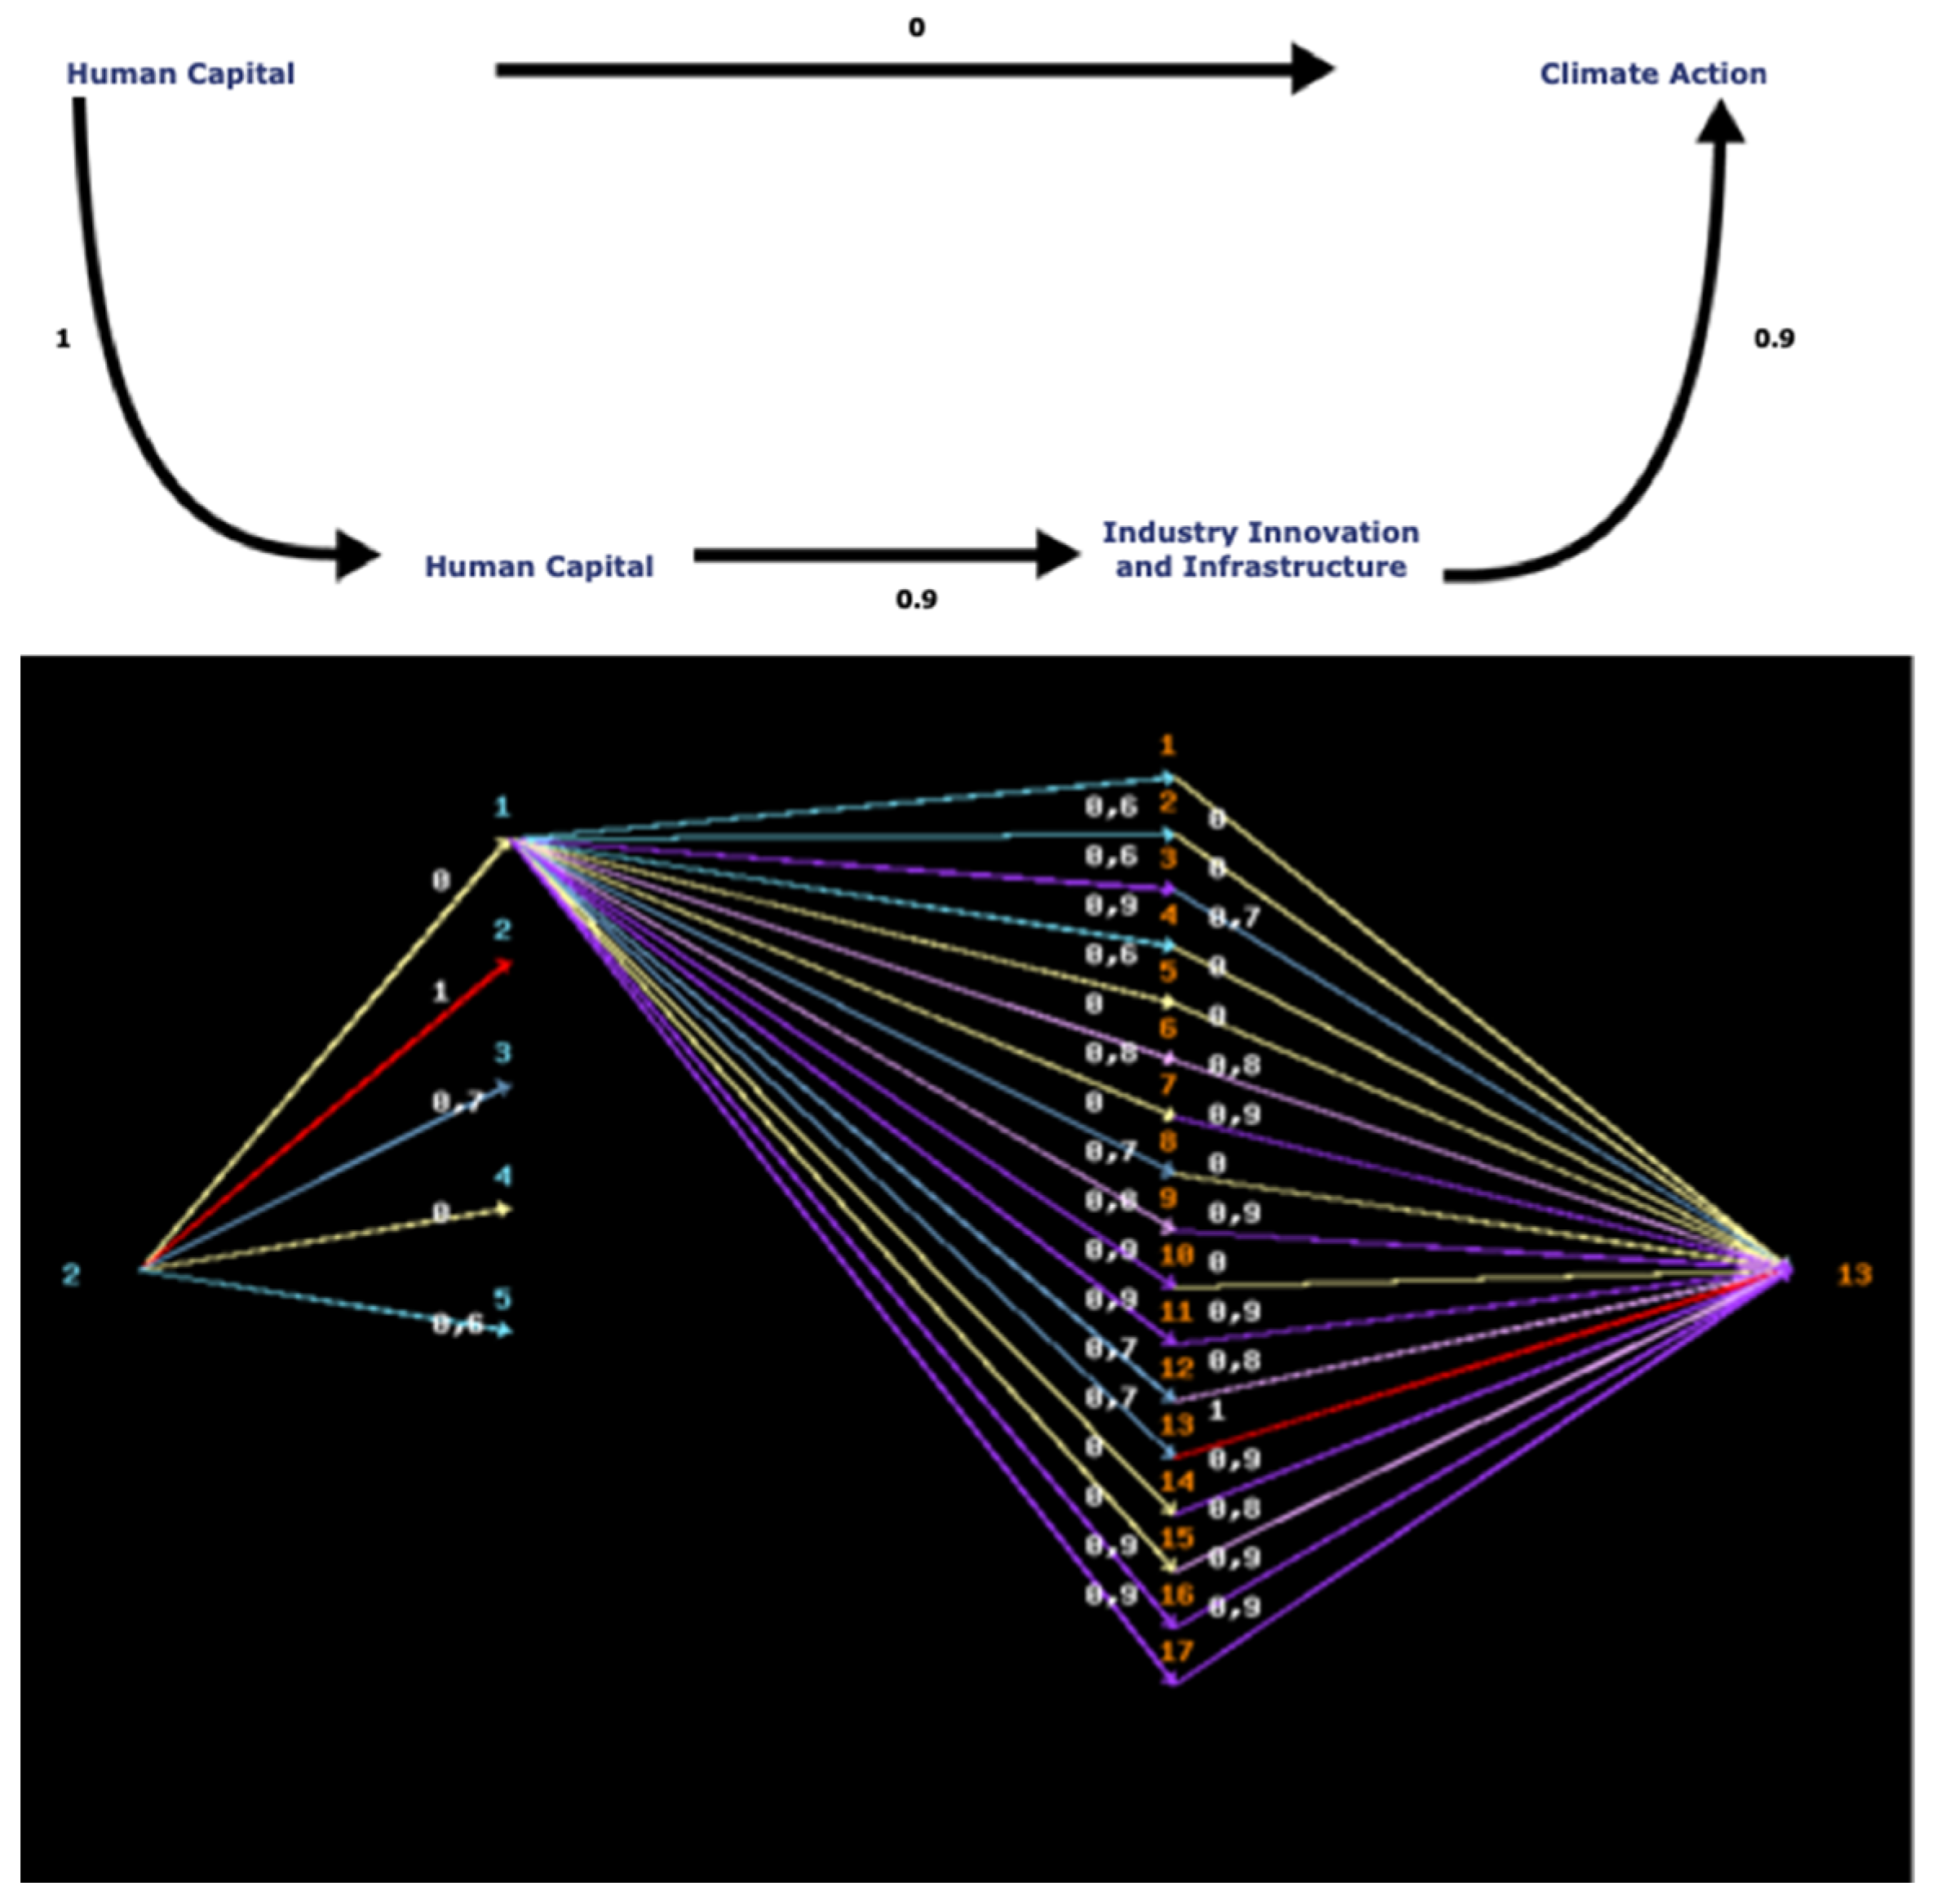
Secondly, Figure 11 presents the relationship between the Human Capital (H2) and Climate Action (SDG13) variables. The result shows no direct relationship between the variables, but the interposed element (SDG9) Industry, Innovation, and Infrastructure potentiated this relationship to 0.9. Also, the figure presents all existing incidences. Therefore, the result shows the importance of H2 to reach the SDG13. In this case, investment in R&D strengthens the industry with sustainable production, reducing global warming.
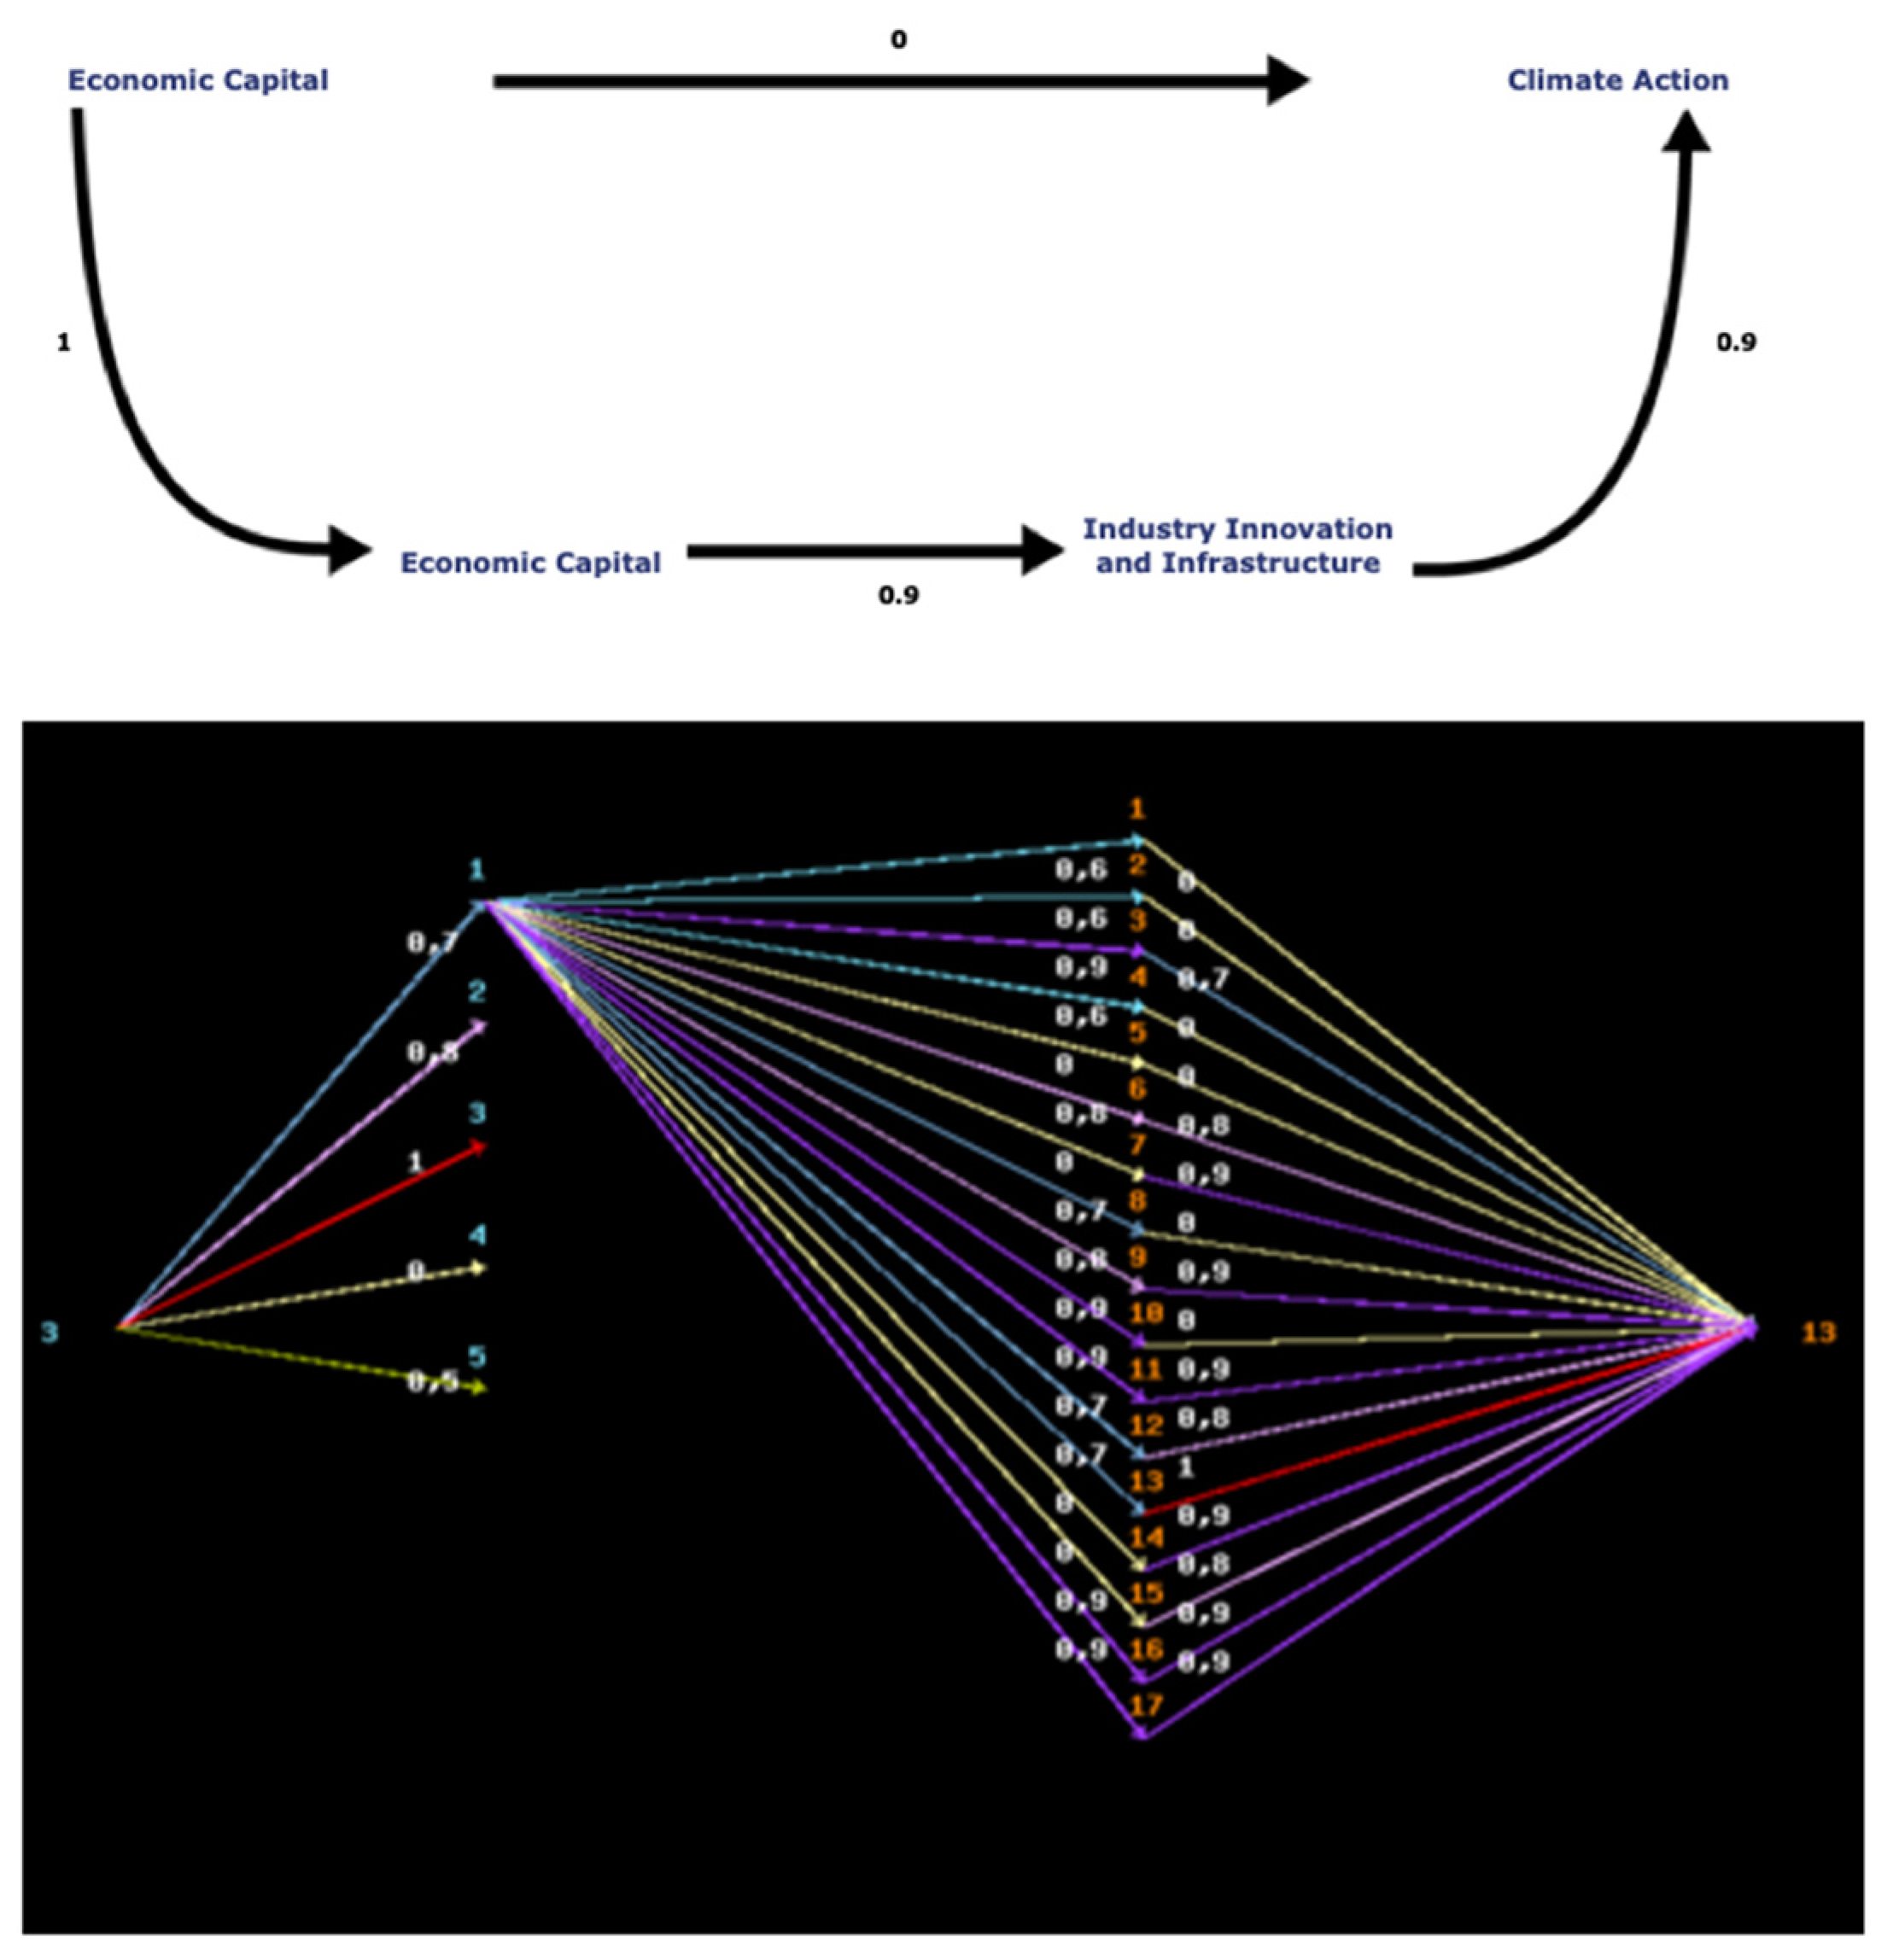
Thirdly, Figure 12 shows the relationship between the Economic Capital (H3) and Climate Action (SDG 13) variables. The result shows no direct relationship between the variables, but the interposed element (SDG9) Industry, Innovation, and Infrastructure potentiated this relationship to 0.9. The figure also presents all existing incidences. Soon the result shows the importance of the H3 to reach the SDG13. In this case, the economic stimuli will increase the opportunities for SDG9 with sustainable solutions and thus allow to face climate change.
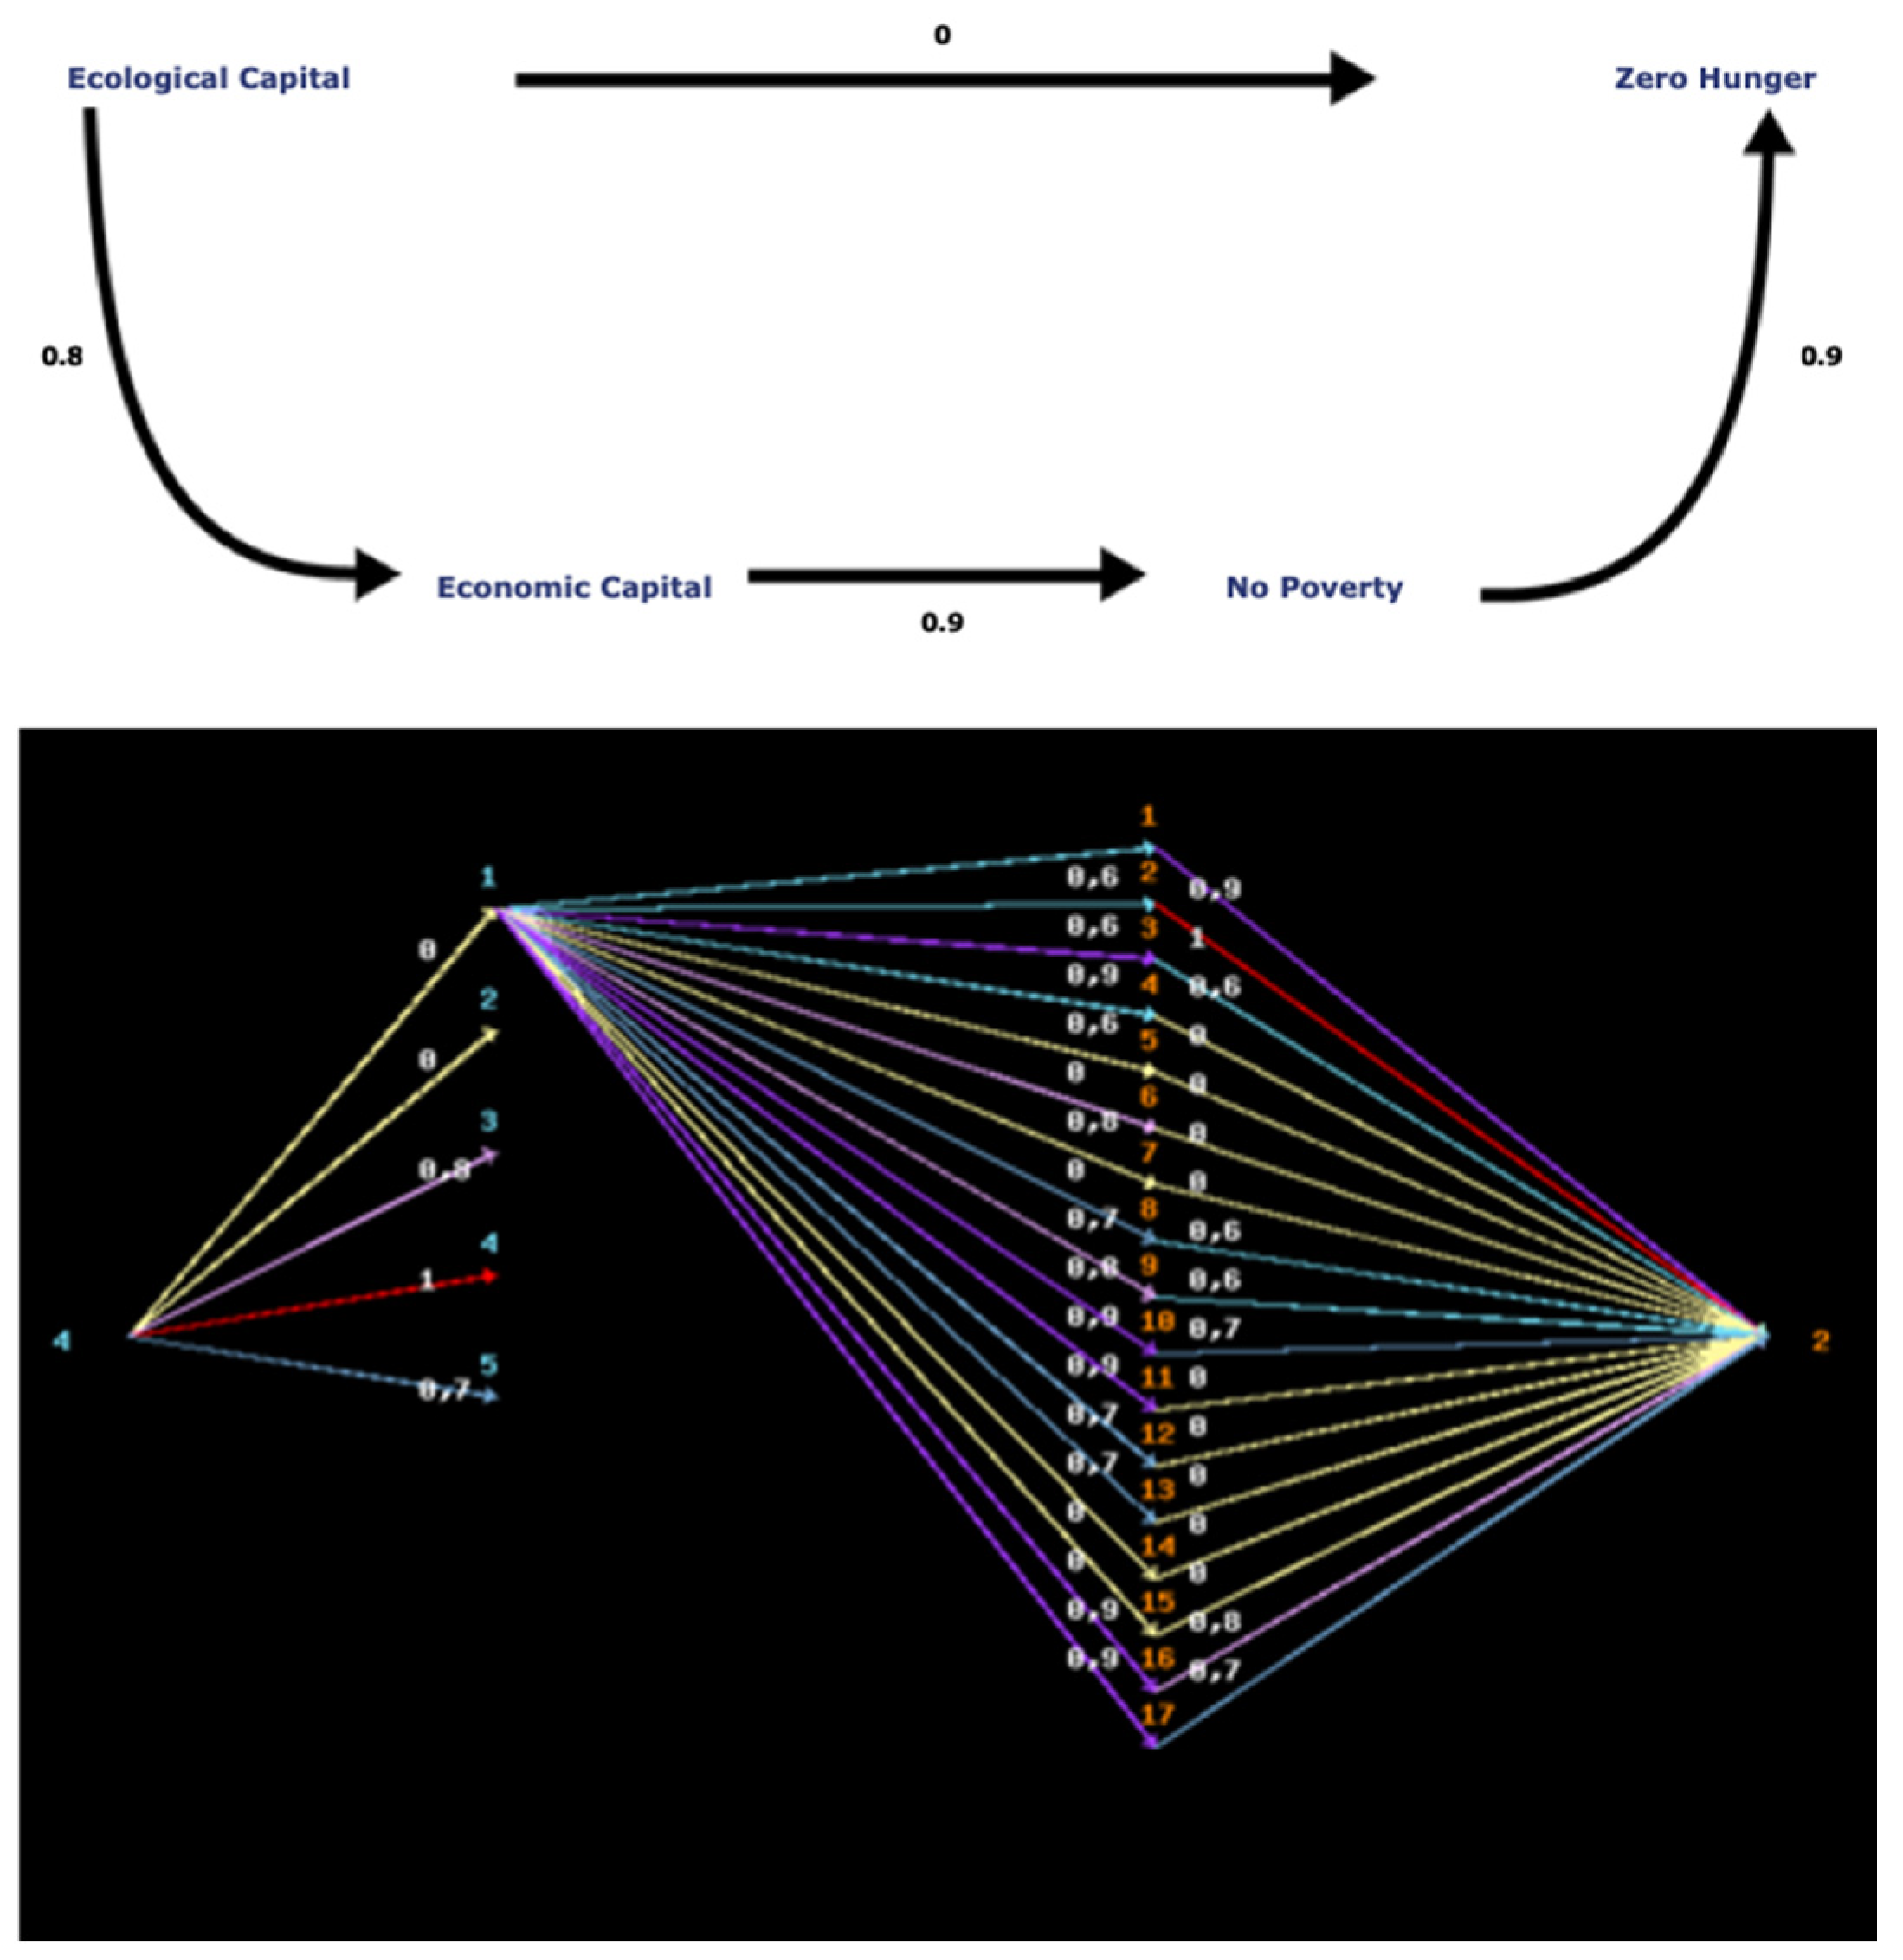
Fourthly, Figure 13 shows the relationship between the Ecological Capital (H4) and Zero Hunger (SDG2) variables. At first, this relationship did not exist, but the interposed elements (H3) Economic capital and (SDG1), No poverty, potentiated this relationship to 0.9. The figure also shows the path traveled with all incidents. Then, the result indicates that to reach SDG1, and it is necessary to involve the H4; for example, the use of clean energy will expand employment opportunities and, as a consequence, contribute to the reduction of poverty and hunger.
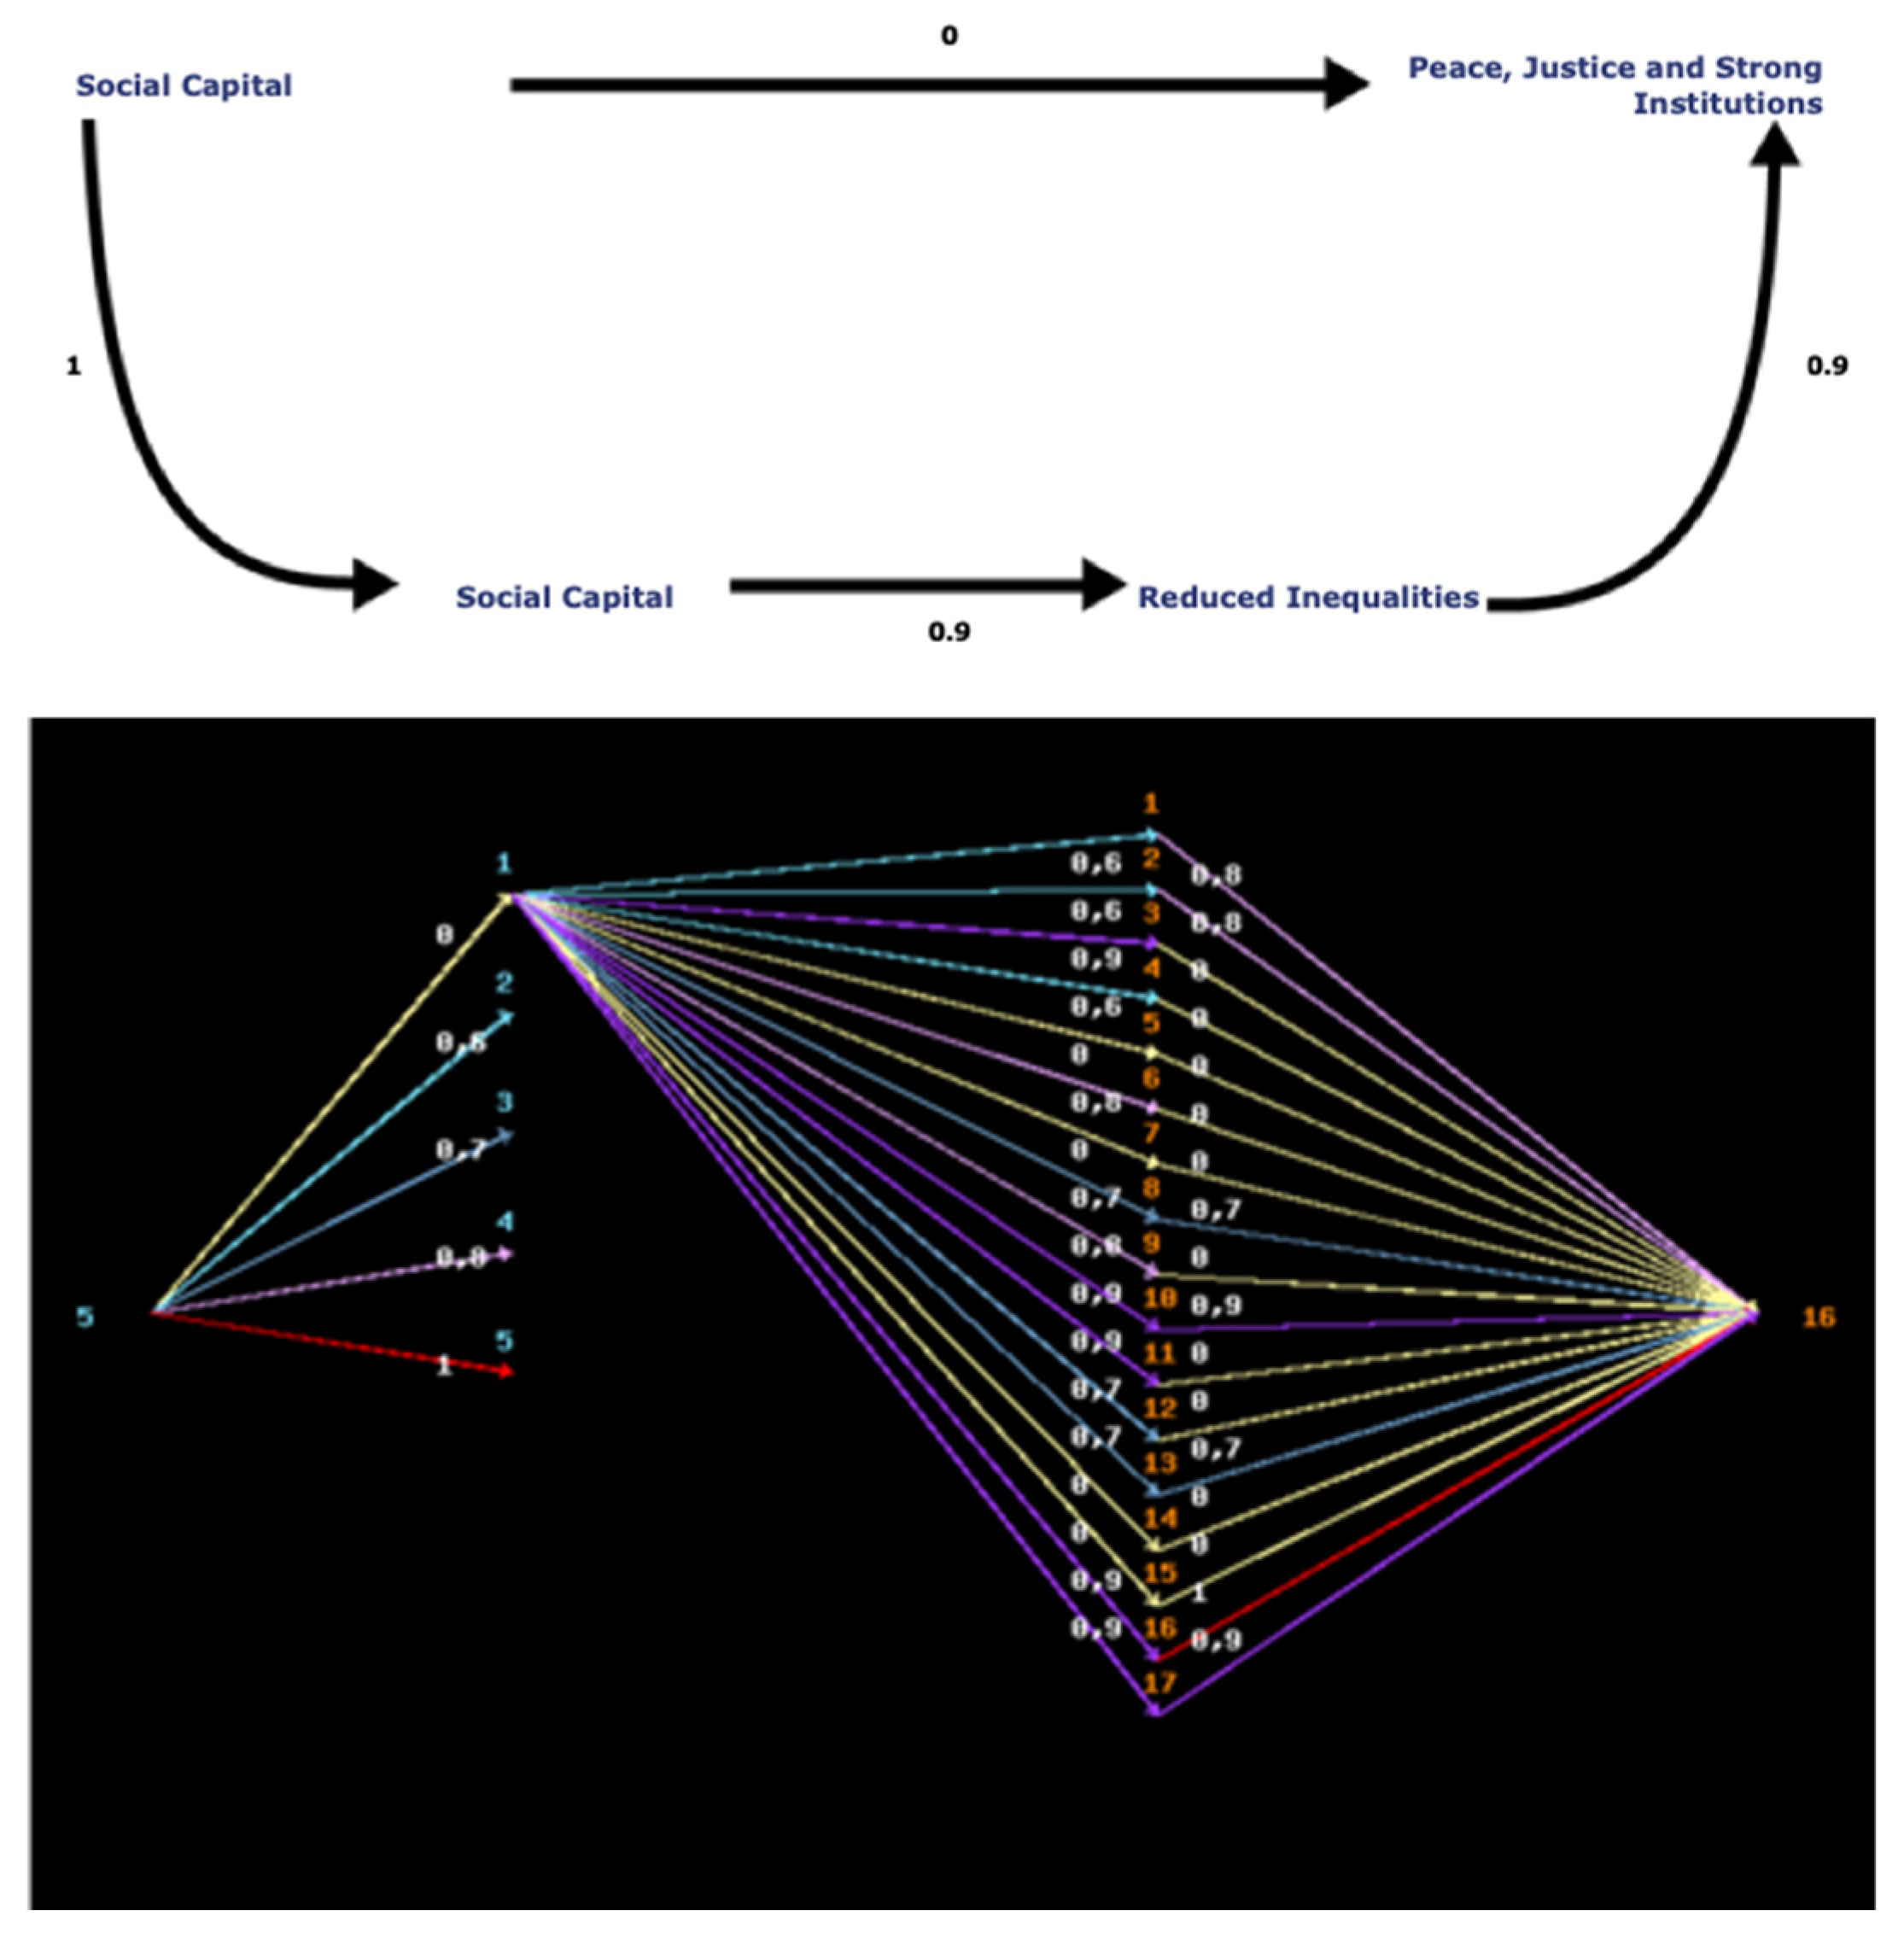
Fifthly, Figure 14 presents the relationship between the Social Capital (H5) and Peace, Justice, and Strong Institutions (SDG16) variables. The result showed no direct relationship between the variables, but the interposed element (SDG10) Reducing Inequality potentiated this relationship to 0.9. Also, the figure presents all existing incidences. Therefore, the result shows the importance of H5 to reach the SDG16. Therefore, social protection policies’ adoption contributes to achieving greater equality, peace, and social justice progressively.
In summary, the results reinforce the existing links between the helices and the SDGs (Table A5). The algorithm’s application allowed the identification of forgotten effects that can impact the scope of sustainable development. It is up to the decision-maker to use the simulation results or adjust the model and apply it in their country or company.

4. Discussion of the Results

Applying the proposed QHIM model indicated that Chile was the country with the highest score, followed by Brazil, Mexico, Colombia, and Peru. In the ranking of the five helixes, social capital (H5) would rank first, followed by ecological (H4), political (H1), human (H2), and economic (H3) capital, respectively. Despite the progress made by these countries in recent years, the study identified opportunities for improvement in all helixes, which can support decision-making on strategy and prioritization of actions. In this sense, the study recommends that countries increase investment in education, incentives for research and development, fiscal balance, economic stimulus, foreign investment, and quality employment.
In response to other studies [37,38,39], the application of the QHIM provides a set of indicators with quality, accessible and timely data from official sources, which reduces uncertainty in decision making. In this way, the research contributes to a conceptual framework of indicators reducing the identified gap [37]. In line with another study [44], the QHIM can help implement sustainable development systems. With this model, it is possible to know each helix’s result and its links with the SDGs and the country’s overall performance. Also, the model makes it possible to identify the interrelationships between the systems.
However, it would be interesting in the future to compare the results with other methods, such as generations of Ordered Weighted Averaging (OWA) Operators [58] or Pythagorean Fuzzy Uncertain Environments [59]. As advantages, these methods allow to add weights to the variables, to deal with large amounts of data, and to prioritize the results. In this way, they are methods that facilitate management and decision making.
On the other hand, the case study confirmed that the SDGs’ scope depends on several systems [10], so it is necessary to evaluate the five helices (social, ecological, political, human, and economic) analyze them in an integrated manner. Table A3 shows the main study results. These results reinforce the findings of other studies [3,36]. Countries should have a systemic vision since one helix will affect the others’ performance and, consequently, sustainable development [8].
Nevertheless, they reinforce research [36,40] on understanding the correlation between the SDGs in decision making. Also, the application of the QHIM and the simulation conducted seek to reduce the gaps identified by other authors [8,41,42].
The research also reveals the importance of correctly identifying cause-effects by seeking harmony between systems. The application of a Fuzzy Logic algorithm identified the forgotten effects of sustainable development. It confirmed other authors’ findings [37] on the uncertainty caused by the SDGs’ interactions. The simulation also confirmed the results of the QHIM application from official sources.
Finally, the simulation corroborated the indications of other studies’ results [14,42] by understanding this complexity, reducing uncertainty [16], and facilitating SDG-related decision making.

5. Conclusions

The research deepened the debate on sustainable development by relating the Quintuple Helix Innovation Model (QHIM) to the Sustainable Development Goals (SDGs). The literature review identified knowledge gaps in the implementation of the SDGs. For this reason, the study proposed 20 indicators related to the QHIM through a case analysis in Latin American countries to respond to the identified gaps. The study also applied a Fuzzy Logic algorithm to identify forgotten effects that may affect the SDGs’ achievement, confirming the case study’s findings. The results revealed the importance of correctly identifying cause-effects by seeking harmony between systems.
As theoretical contributions, the research advanced the frontier of knowledge by reducing the identified gaps, and at the same time, contributes to sustainable development with the proposed models. As practical contributions, the applied study offers governments, society, academia, and companies solutions adjusted to the problems identified, such as the lack of integration and systemic vision to achieve SDGs. Also, the research involved the participation of stakeholders in decision making.
Therefore, the present study is novel and useful for various stakeholders. A limitation of the research may be the number of variables used. Finally, the study results indicate promising research lines on sustainable development and decision making in uncertain environments applied to other countries. The study also opens up new research opportunities in prioritization models that facilitate decision-making.

Author Contributions

Conceptualization, L.B.-P. and I.D.l.V.; methodology, L.B.-P. and A.M.G.-L.; software, A.M.G.-L.; validation, L.B.-P., I.D.l.V., and A.M.G.-L.; formal analysis, I.D.l.V.; investigation, L.B.-P., and I.D.l.V.; resources, L.B.-P. and A.M.G.-L.; writing—original draft preparation, L.B.-P.; writing—review and editing, L.B.-P. and I.D.l.V.; supervision, A.M.G.-L. All authors have read and agreed to the published version of the manuscript.

Funding

This research received no external funding.

Institutional Review Board Statement

Not applicable.

Informed Consent Statement

Not applicable.

Data Availability Statement

Not applicable.

Acknowledgments

The authors wish to thank The Royal Academy of Economic and Financial Sciences and the University of Barcelona from Spain, and CENTRUM Católica Graduate Business School, Peru.

Conflicts of Interest

The authors declare no conflict of interest.

Appendix A

Table A1. Evolution of theoretical models.
TypologiesFirst DefinitionScope and Approaches of the Proposals
Triple Helix
[20]
This model is a tool that applies to developed countries because it assumes that some activities are automatically related to economic growth. While this is true, the model focuses on universities but recognizes the other actors’ dynamic interactions. It even proposes the creation of new intermediary organizations that are relevant for promoting knowledge generation processes.This model seeks to establish a paradigm based on the growing interest in knowledge production among government, university, and business. In particular, it gives a central role to universities. It defines them as the actor that creates knowledge and plays a fundamental role in the relationship between companies and government policies. The aim is to identify the dynamic interactions in which innovative initiatives are generated.
Quadruple Helix Innovation Model
[27]
This model describes the university-industry-government-public environment interactions within a knowledge economy. In this theory, each sector is represented by a knowledge subsystem (helix), which shows the four actors’ overlapping interactions and seeks to boost innovation initiatives, giving a relevant social capital role.The evolution of the model from Triple Helix to Quadruple Helix was due to incorporating an actor who changes the analysis perspective. The public environment (or social capital) allows us to examine society’s behavior, understood as the public that interacts with other actors, from the concept of media-based democracy.
Quintuple Helix Innovation Model
[10]
This model describes five knowledge subsystems (helices) and incorporates the environment as a key actor in the decision-making process. Here, know-how plays a predominant role since it allows the creation and transformation through innovation initiatives that activate the circulation of knowledge among the subsystems.This model’s model focuses on promoting innovation initiatives that seek to generate socio-ecological interactions from the circulation of knowledge from the subsystems (helices). This model’s central value focuses on environmental impact and seeks to generate awareness of the responsibility of societies concerning this issue.
Smart Quintuple Helix Innovation System [18]This theoretical model based on innovation is based on the interaction of five subsystems that exchange knowledge to generate and promote sustainable development. The subsystems are political capital, educational capital, economic capital, environmental capital, and social capital.These theoretical models are evolutions of the triple helix incorporating relevant actors conceptualized as knowledge subsystems. It starts from the conception of a search for developing countries from the articulation of innovative initiatives. Each capital plays a relevant role and in which the environment is critical. Likewise, social capital and social networks, and media outlets have vital roles in generating opinion matrices and in which society can ‘audit’ the decisions of other actors.
Source: Own elaboration based on [10,18,20,27].
Table A2. Analysis criteria.
HelixIndicatorsConcepts1 SDGs
H1. Politics
(Political Capital)
PC1. Regulatory Quality
PC2. Control of Corruption
PC3. Political Stability and Absence of violence
PC4. Government Effectiveness
PC1. Reflects perceptions of the government’s ability to formulate and implement sound policies and regulations that permit and promote private sector development. PC2. Reflects perceptions of the extent to which public power is exercised for private gain, including both petty and grand forms of corruption and capture of the state by elites and private interests. PC3. Measures perceptions of the likelihood of political instability and politically motivated violence, including terrorism. PC4. Reflects perceptions of the quality of public services, the quality of the civil service and the degree of its independence from political pressures, the quality of policy formulation and implementation, and the credibility of the government’s commitment to such policies.3, 10, 11, 16, and 17.
H2. Education
(Human Capital)
HC1. GERD (GDP %)
HC2. GERD (US$PPP)
HC3. Scientific articles published
HC4. Granted patents
HC1. Defined as the total expenditure (current and capital) on R&D carried out by all resident companies, research institutes, university, and government laboratories, etc., in a country. HC2. Total intramural expenditure on R&D performed during a specific reference period expressed in Purchasing Power Parity dollars. HC3. Scientific articles published in the Web of Science. HC4. Measures the number of granted patents.4 and 9.
H3. Economy
(Economic Capital)
EC1. Foreign Direct Investment
EC2. Unemployment
EC3. Current Account Balance
EC4. Purchasing power parity (PPP)
EC1. Refers to direct investment equity flows in the reporting economy. EC2. Refers to the share of the labor force that is without work but available for and seeking employment. EC3. The current account balance is the sum of net exports of goods and services, net primary income, and net secondary income. Data are in current US$ dollars. EC4. PPP conversion factor is the number of units of a country’s currency required to buy the same amount of goods and services in the domestic market as a U.S. dollar would buy in the United States. 1, 2, 8, 9, and 17.
H4. Environment
(Ecological Capital)
EN1. CO2 Emissions
EN2. Renewable water resources
EN3. Renewable energy consumption
EN4. Population density
EN1. Carbon dioxide emissions are those stemming from the burning of fossil fuels and the manufacture of cement. They include carbon dioxide produced during consumption of solid, liquid, and gas fuels and gas flaring. EN2. Total real renewable water resources in m3 per inhabitant per year. EN3. Renewable energy consumption is the share of renewable energy in total final energy consumption. EN4. Population density is midyear population divided by land area in square kilometers.1, 2, 6, 7, 13, 14, and 15.
H5. Society
(Social Capital)
SC1. Gender Development
SC2. Human Development Index
SC3. International migrant stock
SC4. Poverty headcount
SC1. It measures the human development costs of gender inequality. SC2. The Human Development Index is a summary measure of human development. It measures the average achievements in a country in three primary human development dimensions: a long and healthy life, access to knowledge, and a decent living standard. SC3. International migrant stock is the number of people born in a country other than those they live in. It also includes refugees. SC4. The poverty headcount ratio at $1.90 a day is the percentage of the population living on less than $1.90 a day at 2011 international prices.1, 2, 5, 11, 10, 12, 13 and 15.
Source: [8,45,46,47,48,49,50,51,52,53]. 1 SDGs: 1 No Poverty, 2 Zero Hunger, 3 Good Health and Well-being, 4 Quality Education, 5 Gender Equality, 6 Clean Water and Sanitation, 7 Affordable and Clean Energy, 8 Decent Work and Economic Growth, 9 Industry, Innovation and Infrastructure, 10 Reducing Inequality, 11 Sustainable Cities and Communities, 12 Responsible Consumption and Production, 13 Climate Action, 14 Life Below Water, 15 Life on Land, 16 Peace, Justice, and Strong Institutions, and 17 Partnerships for the Goals.
Table A3. Results of QHIM indicators.
sIndicatorsBrazilChileColombiaPeruMexico
H1. Political CapitalPC1. Regulatory Quality0.500.750.550.580.56
PC2. Control of Corruption0.470.750.450.430.41
PC3. Political Stability and Absence of violence0.480.610.190.350.38
PC4. Government Effectiveness0.490.720.470.420.55
H2. Human CapitalHC1. GERD (GDP %)0.710.540.530.510.56
HC2. GERD (US$PPP)0.270.120.090.030.18
HC3. Scientific articles published0.200.040.020.010.09
HC4. Granted patents0.150.030.030.020.30
H3. Economic CapitalEC1. Foreign Direct Investment0.510.130.090.050.27
EC2. Unemployment0.120.150.000.590.60
EC3. Current Account Balance0.010.090.050.070.03
EC4. Purchasing power parity (PPP)0.010.300.900.020.07
H4. Ecological CapitalEN1. CO2 Emissions0.810.620.840.850.61
EN2. Renewable water resources0.440.540.520.640.39
EN3. Renewable energy consumption0.450.300.270.300.09
EN4. Population density0.770.780.610.780.43
H5. Social CapitalSC1. Gender Development0.570.660.600.610.64
SC2. Human development Index0.720.800.700.710.74
SC3. International migrant stock0.650.360.120.100.81
SC4. Poverty headcount 0.580.980.650.770.83
Note: Official sources use different measurement scales when presenting the data, which could make analysis difficult. For this reason, the study used the same scale to homogenize the data. In this case, the endecadary scale with 11 values of [0, 1] was used. Thus, the value closest to 1 expresses an approach to sustainable development, and the value closest to 0 shows a move away from sustainable development. Source: Own elaboration based on [8,45,46,47,48,49,50,51,52,53].
Table A4. Results of QHIM per each helix and country.
BrazilChileColombiaPeruMexico
H1. Political Capital0.490.710.420.450.48
H2. Human Capital0.330.180.170.140.28
H3. Economic Capital0.160.170.260.180.24
H4. Ecological Capital0.620.560.560.640.38
H5. Social Capital0.630.700.520.550.76
TOTAL0.450.460.380.390.43
Note: The result of each helix is the average value of the four indicators per block. The total value represents the average of the five helices for each country. Source: Own elaboration based on [8,45,46,47,48,49,50,51,52,53].
Table A5. Main study results.
Case Analysis Applying the QHIMSDGs (Effects)Simulation Applying the Forgotten Effects TheorySDGs (Forgotten Effects)
H1Low government regulatory capacity, corruption, political instability, and inadequate public services.3,10,11, 16 and 17Political Capital (H1) and Gender Equality (SDG5).16
H2Low investment in education.4 and 9.Human Capital (H2) and Climate Action (SDG 13)9
H3Low foreign direct investment, high unemployment, weak current account balance, and low purchasing power.1, 2, 8, 9 and 17.Economic Capital (H3) and Climate Action (SDG13).9
H4Little progress in environmental indicators. Better performance in CO2 emissions. Lower performance in renewable energy consumption.1,2, 6, 7, 13, 14
and 15.
Ecological Capital (H4) y Zero Hunger (SDG2).1
H5Some progress in gender development, human development, and poverty reduction.1, 2, 5, 10, 11, 12 and 15.Social Capital (H5) and Peace, Justice, and Strong Institutions (SDG16).10
Source: Own elaboration.
Figure A1. Matrix with a valuation of direct incidences between causes (C) and effects (E).
Mathematics 09 00416 g0a1
Figure A2. Matrix with a valuation of incidences among causes.
Mathematics 09 00416 g0a2
Figure A3. Matrix with a valuation of incidents between effects.
Mathematics 09 00416 g0a3
Figure A4. Cumulative effects matrix.
Mathematics 09 00416 g0a4
Figure A5. Forgotten Effects matrix.
Mathematics 09 00416 g0a5

References

  1. Gil-Lafuente, A.M.; De Paula, L.B. Algorithm applied in the identification of stakeholders. Kybernetes 2013, 42, 674–685. [Google Scholar] [CrossRef]
  2. Sachs, J.D. How Can We Achieve the SDGS? Strategic Policy Directions. Dubai Policy Rev. 2019, 1, 25–31. [Google Scholar] [CrossRef]
  3. Cordova, M.F.; Celone, A. SDGs and Innovation in the Business Context Literature Review. Sustainability 2019, 11, 7043. [Google Scholar] [CrossRef] [Green Version]
  4. De la Vega, I.; De Paula, L.B. Scientific mapping on the convergence of innovation and sustainability (innovability): 1990–2018. Kybernetes 2020. Ahead-of-Publiction. [Google Scholar] [CrossRef]
  5. Ghosh, S.; Rajan, J. The business case for SDGs: An analysis of inclusive business models in emerging economies. Int. J. Sustain. Dev. World Ecol. 2019, 26, 344–353. [Google Scholar] [CrossRef]
  6. Hernández, I.M.D.L.V.; De Paula, L.B. The quintuple helix innovation model and brain circulation in central, emerging and peripheral countries. Kybernetes 2019, 49, 2241–2262. [Google Scholar] [CrossRef]
  7. World Commission on Environment and Development. Our Common Future; Oxford University Press: Oxford, UK, 1987. [Google Scholar]
  8. Take Action for the Sustainable Development Goals. Available online: https://www.un.org/sustainabledevelopment/sustainable-development-goals/ (accessed on 10 October 2020).
  9. Freeman, R.E.; Harrison, J.S.; Wicks, A.C.; Parmar, B.; Colle, S. Stakeholder Theory: The State of the Art; Cambridge University Press: Cambridge, UK; New York, NY, USA, 2010; ISBN1 978-0-521-19081-7. ISBN2 978-0-521-13793-5. [Google Scholar]
  10. Carayannis, E.G.; Barth, T.D.; Campbell, D.F. The Quintuple Helix innovation model: Global warming as a challenge and driver for innovation. J. Innov. Entrep. 2012, 1, 2. [Google Scholar] [CrossRef] [Green Version]
  11. Zadeh, L.A. Fuzzy sets. Inf. Control. 1965, 8, 338–353. [Google Scholar] [CrossRef] [Green Version]
  12. Mesa, F.R.B.; Merigó, J.M.; Gil Lafuente, A.M. Fuzzy decision making: A bibliometric-based review. J. Intell. Fuzzy Syst. 2017, 32, 2033–2050. [Google Scholar] [CrossRef] [Green Version]
  13. Carles, M.-F.; Patricia, H.; Antonio, S.; Merigo, J.M. The Forgotten Effects: An Application in the Social Economy of Companies of the Balearic Islands. Econ. Comput. Econ. Cybern. Stud. Res. 2018, 52, 147–160. [Google Scholar] [CrossRef]
  14. De Paula, L.B.; Gil-Lafuente, A.M.; Alvares, D.F. A contribution of fuzzy logic to sustainable tourism through a case analysis in Brazil. J. Intell. Fuzzy Syst. 2021, 40, 1851–1864. [Google Scholar] [CrossRef]
  15. Bertrand, J.W.M.; Fransoo, J.C. Operations management research methodologies using quantitative modeling. Int. J. Oper. Prod. Manag. 2002, 22, 241–264. [Google Scholar] [CrossRef]
  16. Harper, A.; Mustafee, N.; Yearworth, M. Facets of trust in simulation studies. Eur. J. Oper. Res. 2021, 289, 197–213. [Google Scholar] [CrossRef]
  17. Yin, R. Case Study Research, Design Methods, 5th ed.; SAGE Publications Ltd.: Thousand Oaks, CA, USA, 2014; ISBN 978-1452242569. [Google Scholar]
  18. Carayannis, E.G.; Campbell, D.F.J. Smart Quintuple Helix Innovation Systems; SpringerBriefs in Business; Springer International Publishing: Cham, Switzerland, 2019; ISBN 978-3-030-01516-9. [Google Scholar]
  19. The Endless Transition: A “Triple Helix” of University-Industry-Government Relations. Minerva 1998, 36, 203–208. [CrossRef]
  20. Etzkowitz, H. The norms of entrepreneurial science: Cognitive effects of the new university–industry linkages. Res. Policy 1998, 27, 823–833. [Google Scholar] [CrossRef]
  21. Etzkowitz, H.D.; Leydesdorff, L. The dynamics of innovation: From National Systems and “Mode 2” to a Triple Helix of university–industry–government relations. Res. Policy 2000, 29, 109–123. [Google Scholar] [CrossRef]
  22. Leydesdorff, L. The Triple Helix of University-Industry-Government Relations (February 2012). SSRN Electron. J. 2012. [Google Scholar] [CrossRef]
  23. Etzkowitz, H.; Zhou, C. Innovation incommensurability and the science park. R&D Manag. 2018, 48, 73–87. [Google Scholar] [CrossRef] [Green Version]
  24. Etzkowitz, H. The evolution of the entrepreneurial university. Int. J. Technol. Glob. 2004, 1, 64. [Google Scholar] [CrossRef]
  25. Etzkowitz, H.; Zhou, C. Introduction to special issue Building the entrepreneurial university: A global perspective. Sci. Public Policy 2008, 35, 627–635. [Google Scholar] [CrossRef]
  26. Dzisah, J.; Etzkowitz, H. Triple helix circulation: The heart of innovation and development. Int. J. Technol. Manag. Sustain. Dev. 2008, 7, 101–115. [Google Scholar] [CrossRef] [Green Version]
  27. Carayannis, E.G.; Campbell, D.F. ‘Mode 3’ and ‘Quadruple Helix’: Toward a 21st century fractal innovation ecosystem. Int. J. Technol. Manag. 2009, 46, 201. [Google Scholar] [CrossRef] [Green Version]
  28. Carayannis, E.G.; Campbell, D.F. Triple Helix, Quadruple Helix and Quintuple Helix and How Do Knowledge, Innovation and the Environment Relate To Each Other? Int. J. Soc. Ecol. Sustain. Dev. 2010, 1, 41–69. [Google Scholar] [CrossRef]
  29. Carayannis, E.G.; Campbell, D.F.J. Open Innovation Diplomacy and a 21st Century Fractal Research, Education and Innovation (FREIE) Ecosystem: Building on the Quadruple and Quintuple Helix Innovation Concepts and the “Mode 3” Knowledge Production System. J. Knowl. Econ. 2011, 2, 327–372. [Google Scholar] [CrossRef]
  30. Mondini, G. Sustainability assessment: From brundtland report to sustainable development goals. Valori Valutazioni 2019, 23, 129–137. [Google Scholar]
  31. Brown, J.A.; Clark, C.; Buono, A.F. The United Nations Global Compact: Engaging Implicit and Explicit CSR for Global Governance. J. Bus. Ethic 2016, 147, 721–734. [Google Scholar] [CrossRef]
  32. Lomazzi, M.; Borisch, B.; Laaser, U. The Millennium Development Goals: Experiences, achievements and what’s next. Glob. Health Action 2014, 7, 23695. [Google Scholar] [CrossRef]
  33. Mitchell, D.; Allen, M.R.; Hall, J.W.; Muller, B.; Rajamani, L.; Le Quéré, C. The myriad challenges of the Paris Agreement. Philos. Trans. R. Soc. A Math. Phys. Eng. Sci. 2018, 376, 20180066. [Google Scholar] [CrossRef] [PubMed]
  34. Fraisl, D.; Campbell, J.; See, L.; Wehn, U.; Wardlaw, J.; Gold, M.; Moorthy, I.; Arias, R.; Piera, J.; Oliver, J.L.; et al. Mapping citizen science contributions to the UN sustainable development goals. Sustain. Sci. 2020, 15, 1735–1751. [Google Scholar] [CrossRef]
  35. Junior, R.M.; Fien, J.; Horne, R. Implementing the UN SDGs in Universities: Challenges, Opportunities, and Lessons Learned. Sustain. J. Rec. 2019, 12, 129–133. [Google Scholar] [CrossRef]
  36. Pradhan, P.; Costa, L.; Rybski, D.; Lucht, W.; Kropp, J.P. A Systematic Study of Sustainable Development Goal (SDG) Interactions. Earth’s Future 2017, 5, 1169–1179. [Google Scholar] [CrossRef] [Green Version]
  37. Janoušková, S.; Hák, T.; Moldan, B. Global SDGs Assessments: Helping or Confusing Indicators? Sustainability 2018, 10, 1540. [Google Scholar] [CrossRef] [Green Version]
  38. Yonehara, A.; Saito, O.; Hayashi, K.; Nagao, M.; Yanagisawa, R.; Matsuyama, K. The role of evaluation in achieving the SDGs. Sustain. Sci. 2017, 12, 969–973. [Google Scholar] [CrossRef]
  39. Hák, T.; Janoušková, S.; Moldan, B. Sustainable Development Goals: A need for relevant indicators. Ecol. Indic. 2016, 60, 565–573. [Google Scholar] [CrossRef]
  40. Morton, S.; Pencheon, D.; Squires, N. Sustainable Development Goals (SDGs), and their implementation. Br. Med. Bull. 2017, 124, 1–10. [Google Scholar] [CrossRef] [PubMed]
  41. Nilsson, M.; Griggs, D.; Visbeck, M. Policy: Map the interactions between Sustainable Development Goals. Nat. Cell Biol. 2016, 534, 320–322. [Google Scholar] [CrossRef]
  42. Collste, D.; Pedercini, M.; Cornell, S.E. Policy coherence to achieve the SDGs: Using integrated simulation models to assess effective policies. Sustain. Sci. 2017, 12, 921–931. [Google Scholar] [CrossRef] [PubMed]
  43. Allen, C.; Metternicht, G.; Wiedmann, T. National pathways to the Sustainable Development Goals (SDGs): A comparative review of scenario modelling tools. Environ. Sci. Policy 2016, 66, 199–207. [Google Scholar] [CrossRef] [Green Version]
  44. De la Vega, I. Estado y dinámicas de los sistemas tecnocientíficos: El caso de los países de la Alianza del Pacífico. CLAD Mag. Reforma Democr. 2018, 70, 29–60. [Google Scholar]
  45. World Bank Open Data Countries. Available online: https://data.worldbank.org/%0Ahttps://data.worldbank.org/country (accessed on 10 October 2020).
  46. OECD Gross Domestic Spending on R&D. Available online: https://data.oecd.org/rd/gross-domestic-spending-on-r-d.htm (accessed on 28 September 2020).
  47. Web of Science Scientific Articles Published. Available online: http://login.webofknowledge.com/error/Error?Src=IP&Alias=WOK5&Error=IPError&Params=&PathInfo=%2F&RouterURL=http%3A%2F%2Fwww.webofknowledge.com%2F&Domain=.webofknowledge.com (accessed on 28 September 2020).
  48. WIPO Statistics Database Total Patent Grants (Direct and PCT National Phase Entries). Total Count by Filling Office. Available online: https://www3.wipo.int/ipstats/index.htm?tab=patent (accessed on 28 September 2020).
  49. FAO. Aquastat. Available online: http://www.fao.org/nr/water/aquastat/data/query/index.html?lang=en (accessed on 28 September 2020).
  50. Our World in Data per Capita CO2 Emissions. Available online: https://ourworldindata.org/grapher/co-emissions-per-capita?tab=chart (accessed on 28 September 2020).
  51. UNDP Human Development Reports. Available online: http://hdr.undp.org/en/data# (accessed on 28 September 2020).
  52. United Nations International Migrant Stock. Available online: https://www.un.org/en/development/desa/population/migration/data/estimates2/estimates19.asp (accessed on 28 September 2020).
  53. UNESCO Institute for Statistics GERD in Purchasing Power Parities (PPPs). Available online: http://uis.unesco.org/en/glossary-term/gerd-purchasing-power-parities-ppps (accessed on 28 September 2020).
  54. Kaufmann, A.; Gil-Aluja, J. Modelos para la Investigación de Efectos Olvidados; Editorial Milladoiro: Vigo, Spain, 1988; ISBN 84-404-3657-2. [Google Scholar]
  55. Luciano, E.V.; Gil-Lafuente, A.M.; González, A.G.; Boria-Reverter, S. Forgotten effects of corporate social and environmental responsibility. Kybernetes 2013, 42, 736–753. [Google Scholar] [CrossRef]
  56. Beatriz, F.-R.; Federico, G.-S. Study of the Competitiveness of the Michoacán Company and Variables that Affect it: Application of the Theory of Forgotten Effects. Econ. Comput. Econ. Cybern. Stud. Res. 2020, 54, 233–250. [Google Scholar] [CrossRef]
  57. Linares-Mustarós, S.; Gil-Lafuente, A.M.; Coll, D.C.; Ferrer-Comalat, J.C. Premises for the Theory of Forgotten Effects. In Advances in Intelligent Systems and Computing; Springer: Berlin/Heidelberg, Germany, 2019; Volume 894, pp. 206–215. [Google Scholar]
  58. Perez-Arellano, L.A.; Blanco-Mesa, F.; Leon-Castro, E.; Alfaro-Garcia, V. Bonferroni Prioritized Aggregation Operators Applied to Government Transparency. Mathematics 2020, 9, 24. [Google Scholar] [CrossRef]
  59. Wang, L.; Garg, H.; Li, N. Pythagorean fuzzy interactive Hamacher power aggregation operators for assessment of express service quality with entropy weight. Soft Comput. 2021, 25, 973–993. [Google Scholar] [CrossRef]
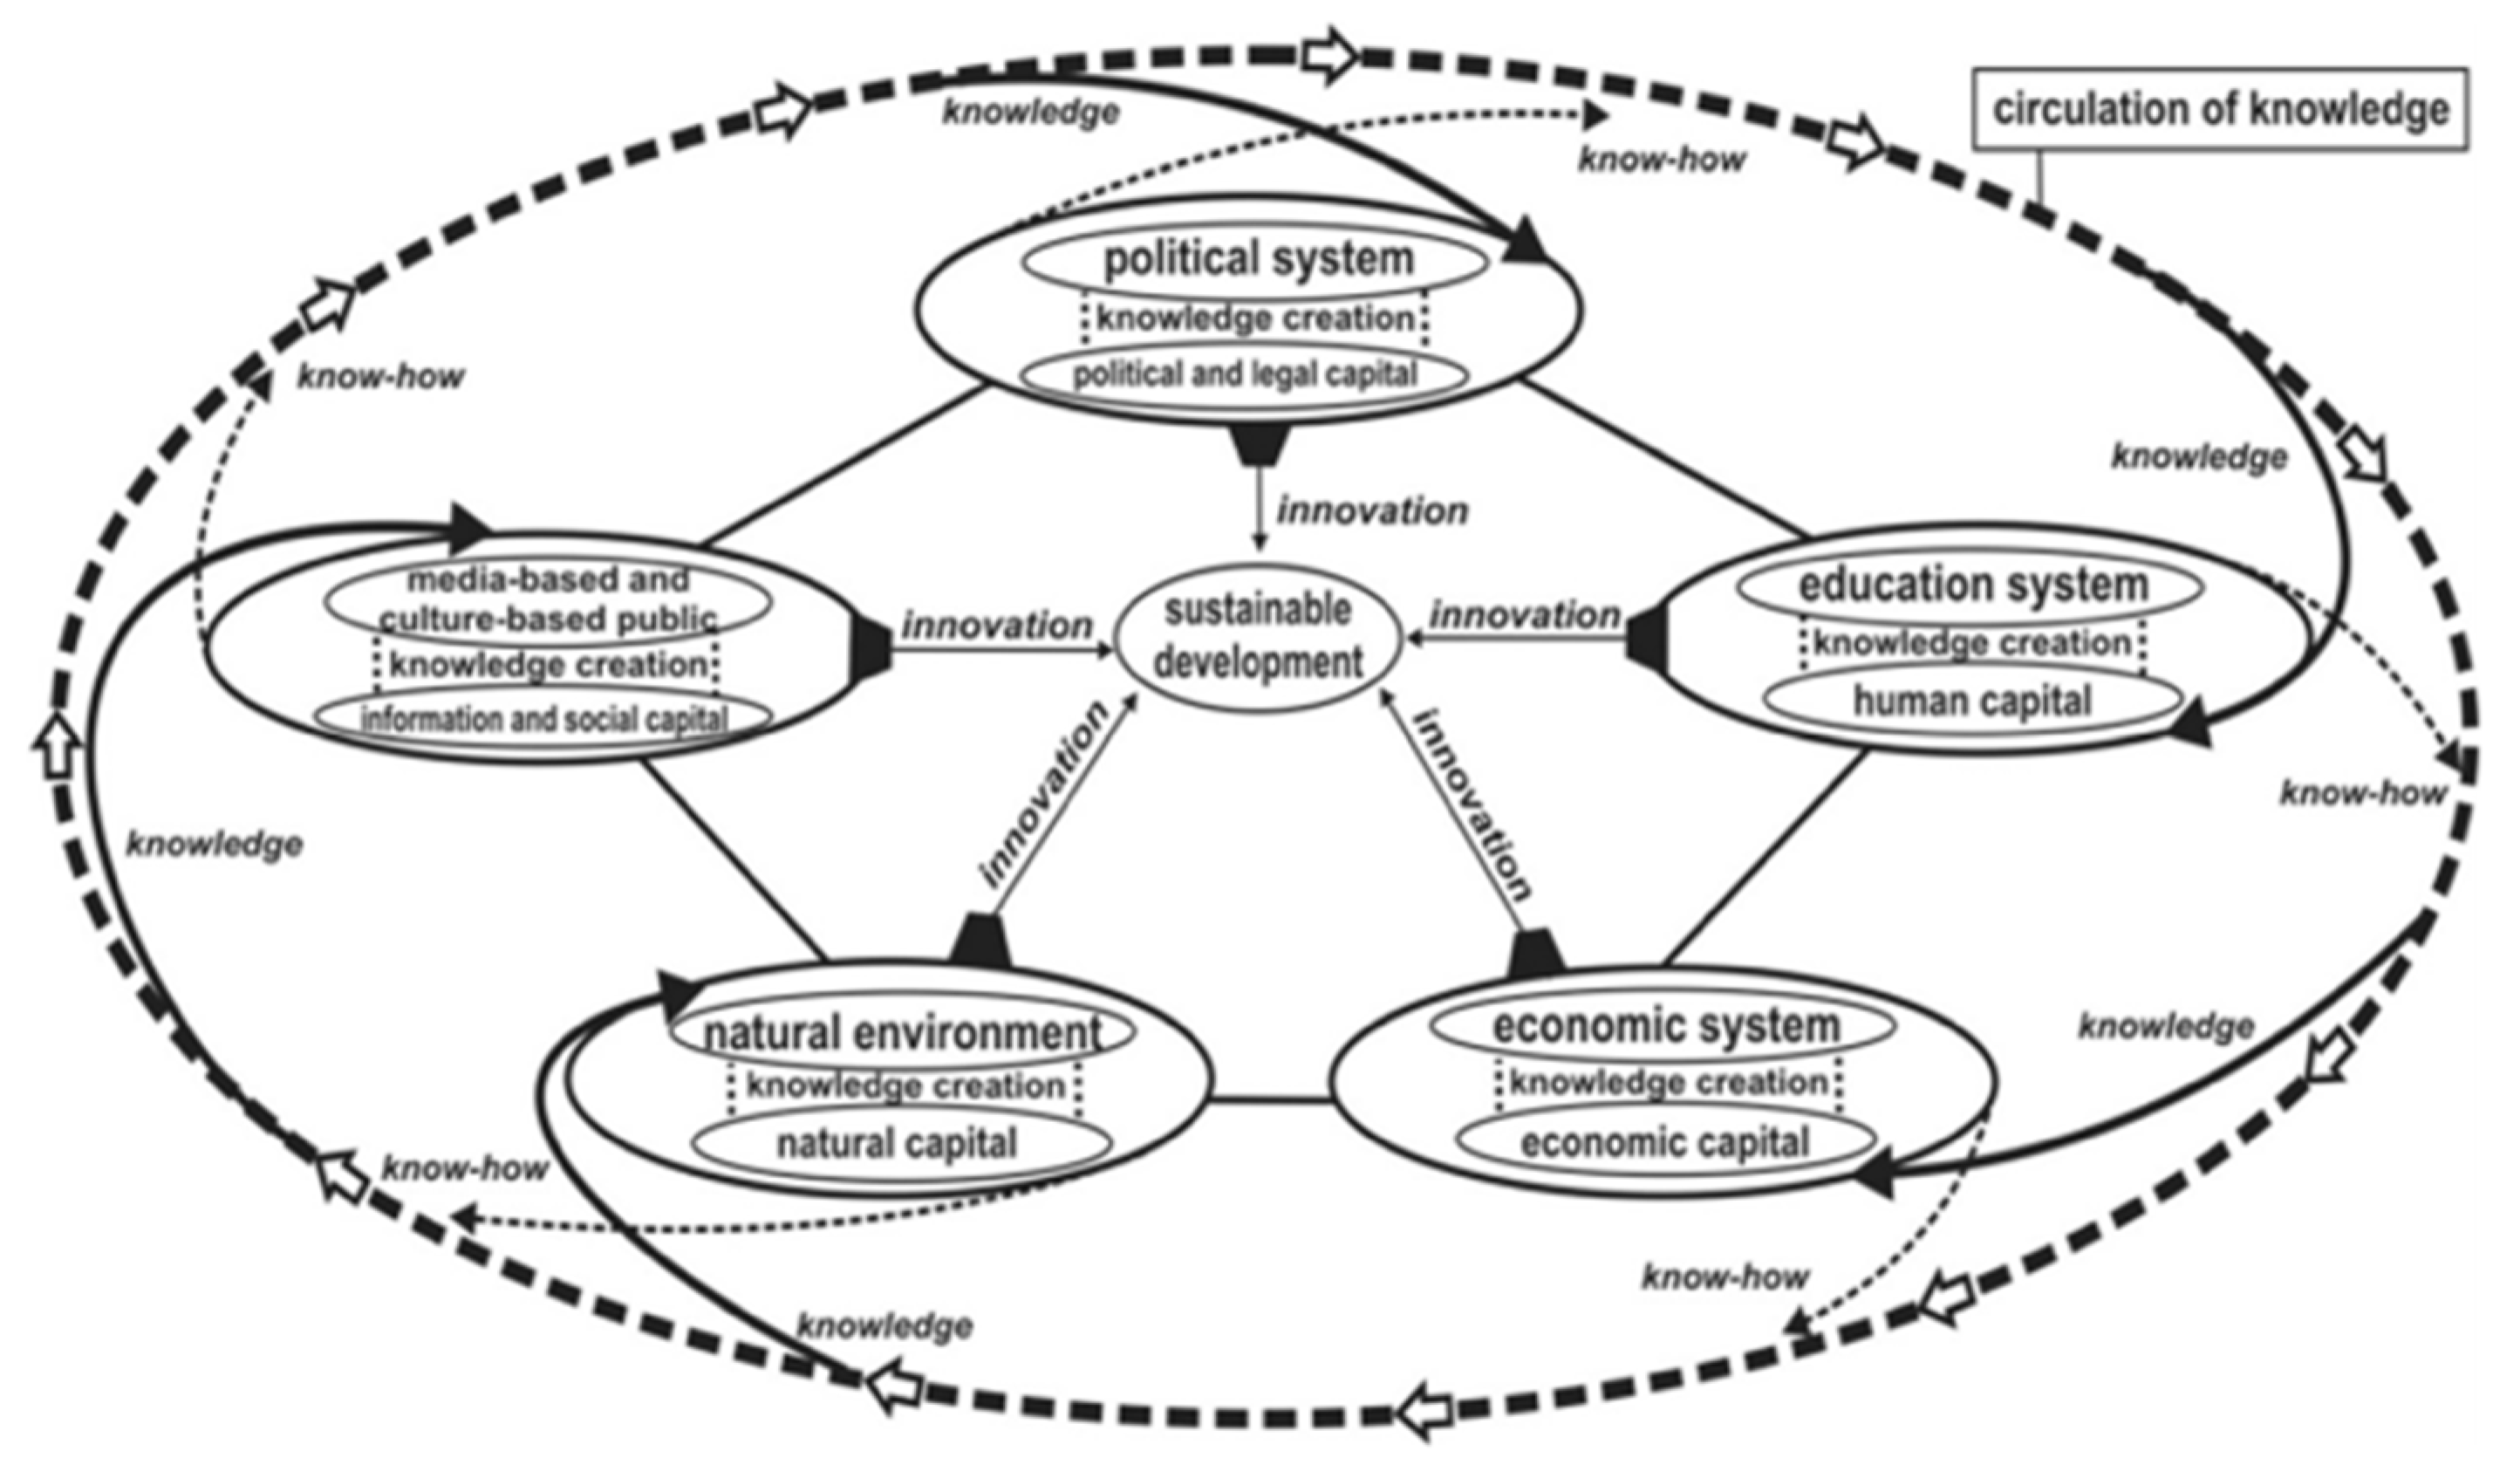
Figure 1. The Quintuple Helix Innovation Model (QHIM). Source: [10].
Mathematics 09 00416 g001
Figure 2. Political Capital (PC). Source: Own elaboration based on [45].
Mathematics 09 00416 g002
Figure 3. Human Capital (HC). Source: Own elaboration based on [45,46,47,48].
Mathematics 09 00416 g003
Figure 4. Economic Capital (EC). Source: Own elaboration based on [45].
Mathematics 09 00416 g004
Figure 5. Ecological Capital (EN). Source: Own elaboration based on [45,49,50].
Mathematics 09 00416 g005
Figure 6. Social Capital (SC). Source: Own elaboration based on [45,51,52].
Mathematics 09 00416 g006
Figure 7. The Five Helix (H1–5) from QHIM: Latin-American countries’ case. Source: Own elaboration based on [8,45,46,47,48,49,50,51,52,53].
Mathematics 09 00416 g007
Figure 8. QHIM: Latin-American countries’ case. Source: Own elaboration based on [8,45,46,47,48,49,50,51,52,53].
Mathematics 09 00416 g008
Figure 9. The max-min composition of the matrices.
Mathematics 09 00416 g009
Figure 10. Relation between Political Capital (H1) and Gender Equality (SDG5).
Mathematics 09 00416 g010
Figure 11. Relation between Human Capital (H2) and Climate Action (SDG 13).
Mathematics 09 00416 g011
Figure 12. Relation between Economic Capital (H3) and Climate Action (SDG13).
Mathematics 09 00416 g012
Figure 13. Relation between Ecological Capital (H4) and Zero Hunger (SDG2).
Mathematics 09 00416 g013
Figure 14. Relation between Social Capital (H5) and Peace, Justice, and Strong Institutions (SDG16).
Mathematics 09 00416 g014
Table 1. The five helices of innovation.
CThe Five Helices of Innovation
c 1 Political Capital
c 2 Human Capital
c 3 Economic Capital
c 4 Ecological Capital
c 5 Social Capital
Source: Own elaboration based on [10]. C/c: Cause.
Table 2. The 17 Sustainable Development Goals.
ESDGs
e 1 1 No Poverty
e 2 2 Zero Hunger
e 3 3 Good Health and Well-being
e 4 4 Quality Education
e 5 5 Gender Equality
e 6 6 Clean Water and Sanitation
e 7 7 Affordable and Clean Energy
e 8 8 Decent Work and Economic Growth
e 9 9 Industry, Innovation and Infrastructure
e 10 10 Reducing Inequality
e 11 11 Sustainable Cities and Communities
e 12 12 Responsible Consumption and Production
e 13 13 Climate Action
e 14 14 Life Below Water
e 15 15 Life on Land
e 16 16 Peace, Justice, and Strong Institutions
e 17 17 Partnerships for the Goals
Source: Own elaboration based on [8]. E/e: effect.
Table 3. Cause-effect relationships.
Causes (Helices of Innovation)Effects (SDGs)
H1 Political Capital5 Gender Equality
H2 Human Capital13 Climate Action
H3 Economic Capital13 Climate Action
H4 Ecological Capital2 Zero Hunger
H5 Social Capital16 Peace, Justice, and Strong Institutions
Source: Own elaboration based on [54]. SDGs: sustainable development goals.
Publisher’s Note: MDPI stays neutral with regard to jurisdictional claims in published maps and institutional affiliations.