Article

DNA-Guided Assembly for Fibril Proteins

1
Faculty of Mathematics and Computer Science, University of Bucharest, 030018 Bucharest, Romania
2
National Institute of Research and Development for Biological Sciences, Department of Bioinformatics, 060031 Bucharest, Romania
3
Computational Biomodeling Laboratory, Turku Centre for Computer Science and Department of Computer Science, Åbo Akademi University, 20500 Turku, Finland
4
National Institute of Research and Development for Biological Sciences, Cellular and Molecular Biology Department, 060031 Bucharest, Romania
5
Faculty of Administration and Business, University of Bucharest, 050663 Bucharest, Romania
6
Departamento de Inteligencia Artificial, Universidad Politecnica de Madrid, 28040 Madrid, Spain
*
Author to whom correspondence should be addressed.
Mathematics 2021, 9(4), 404; https://doi.org/10.3390/math9040404
Submission received: 21 December 2020 / Revised: 2 February 2021 / Accepted: 10 February 2021 / Published: 19 February 2021
(This article belongs to the Special Issue Bioinspired Computation: Recent Advances in Theory and Applications)

Abstract

:
Current advances in computational modelling and simulation have led to the inclusion of computer scientists as partners in the process of engineering of new nanomaterials and nanodevices. This trend is now, more than ever, visible in the field of deoxyribonucleic acid (DNA)-based nanotechnology, as DNA’s intrinsic principle of self-assembly has been proven to be highly algorithmic and programmable. As a raw material, DNA is a rather unremarkable fabric. However, as a way to achieve patterns, dynamic behavior, or nano-shape reconstruction, DNA has been proven to be one of the most functional nanomaterials. It would thus be of great potential to pair up DNA’s highly functional assembly characteristics with the mechanic properties of other well-known bio-nanomaterials, such as graphene, cellulos, or fibroin. In the current study, we perform projections regarding the structural properties of a fibril mesh (or filter) for which assembly would be guided by the controlled aggregation of DNA scaffold subunits. The formation of such a 2D fibril mesh structure is ensured by the mechanistic assembly properties borrowed from the DNA assembly apparatus. For generating inexpensive pre-experimental assessments regarding the efficiency of various assembly strategies, we introduced in this study a computational model for the simulation of fibril mesh assembly dynamical systems. Our approach was based on providing solutions towards two main circumstances. First, we created a functional computational model that is restrictive enough to be able to numerically simulate the controlled aggregation of up to 1000s of elementary fibril elements yet rich enough to provide actionable insides on the structural characteristics for the generated assembly. Second, we used the provided numerical model in order to generate projections regarding effective ways of manipulating one of the the key structural properties of such generated filters, namely the average size of the openings (gaps) within these meshes, also known as the filter’s aperture. This work is a continuation of Amarioarei et al., 2018, where a preliminary version of this research was discussed.

1. Introduction

Nanoengineered materials have become a main object of focus for many industrial and academic communities alike. Current developments in the field include molecular sieving membranes for highly efficient gas separation [1], hybrid carbon nanostructure for supercapacitors [2], nanocomposite gels for repair of damaged bones [3], nanotextured surfaces with antibacterial properties [4], metalenses—flat surfaces that use nanostructures to focus light [5], exceptionally strong and tough ultrafine fibers [6], nanostructured surface coatings with antifouling properties [7], etc. In some cases, it is the material itself that possesses high functionality, e.g., the super-conductance of graphene [2], the high magnetization limit of certain alloys [8], etc. However, in most cases, it is the high-resolution arrangements of the material’s nanocomponents that give its exceptional characteristics, e.g., the highly aligned calcium silicate hydrate nanoplatelets with bending strength of nacre [9], the nanoengineered ultralight materials based on electroactive graphene aerogel with a high storage capacity of Li+/Na+ ions [10], etc. In this framework, deoxyribonucleic acid (DNA)-based nanotechnology was able to demonstrate great engineering potential due to its versatility and addressability at the nanolevel; laboratory developments in the field include highly addressable scaffolds [11], precise pattering [12], 2- and 3D pattern and shape reconstruction [13,14], and even robotic-like constructs [15,16].
As a raw material, DNA has little intrinsic mechanical properties: it is not particularly rigid, or strong, or tough. Also, it does not conduct electricity and it loses all its interaction properties in dry/dehydrated environments. However, by pairing the DNA addressability properties with that of a strong nanomaterial and by guiding the precise assembly of the latter, we envision a substantial enhancement of the material’s mechanical properties and its applicability. In recent experimental trials, we considered the pairing of DNA nanoconstructs with nanocellulose fibrils in order to create strong and highly aligned nanocellulose meshes for precision filters and membranes. While these experimental trials did not produce the desired results due to the nanocellulose highly random aggregation tendency, other tentative fibril-like proteins are available. For example, one can consider fibroin and vimentin (intermediate) filaments, both of these possessing significant mechanical properties as well as available DNA-aptamers (DNA-aptamers are 20–50 base long single-stranded DNA sequences with natural binding affinity towards a specific material or molecule) for selective binding [17,18].
The use of DNA as an addressable lattice was previously illustrated on many experimental settings using a large variety of pattering elements: gold and silver nanoparticles [12,19]; protein complexes such as steptavidin [11]; various bioactive components such as drugs, antibodies, or adjuvants [20,21,22], etc. Moreover, the possibility of aligning rod-like structures on top of supporting 2D DNA scaffolds was also experimentally shown; see [23,24] where the authors attached pairs of perpendicular carbon nanotubes on top of DNA origami constructs. In our purporting designs, we want to achieve a new nanomaterial where individual fibril units are placed on top of DNA origami structures and achieve a highly order fabric-like alignment using the specific interstructural DNA assembly interactions. Once an alignment is achieved, the fabric is chemically treated such that the fabric retains its structure after alteration/degradation of the supporting DNA scaffolding.
The primary objective of this study was to generate pre-experimental insights on possible ways to control the characteristics of a self-assembled DNA-linked fibril mesh. In particular, we were interested in predicting and even being able to regulate the average opening window in between the individual fibrils of the mesh, also known as the aperture of the mesh. To do this, we needed to create accurate computational models of the assembly dynamical system, which we then had to subject to parameter scans and analysis. Our conjecture was that, by manipulating a relatively small set of the system’s parameters, e.g., the ratio between the input number of fibril proteins and the guiding DNA-based constructs, or the length distribution of the individual fibrils, we might be able to control the average aperture of these meshes.
From the computational modeling perspective, capturing the complexity of a structural self-assembly system is a notoriously difficult task. This is due to the intrinsic nature of these systems which, provided a continuous supply of elementary components, could theoretically generate an arbitrarily large number of different configurations. This, in turn, gives rise to a problematic kinetic modelling of such systems, using e.g., systems of ordinary differential equations. Indeed, according to the classical mathematical/computational kinetic modelling methodology, each possible different configuration, being it an input elementary component or a more complex generated assembly, needs to be assigned to a different variable (aka specie) in the model. Even if we bound the number of input elementary components to some reasonable threshold, in the case of self-assembly systems, the total required number of species becomes easily intractable due to the combinatorial explosion of the number of possible different complexes generated by the system. This leads to the secondary objective of our study, namely to abstract a tractable computational model of the mesh assembly process, which, though not completely following the biological reality, would be close enough and versatile enough to allow for a more involved mathematical and computational study. In a preliminary study [25], we overcame the above modelling challenge by employing a rule-based modeling methodology, which had a fundamentally different approach of capturing the different “species” of the system [26,27]. Although that methodology was able to solve some of the difficulties in capturing the evolution of the DNA-fibril dynamical system, the method was proven not to be flexible enough for capturing some important structural properties of such systems. In the present research, we briefly present the rule-base modeling approach used in [25] as well as some of the results generated within. Then, we introduce a second computational model, which enforces the conclusions from [25] as well as generates new insights into the assembly process and its control.

2. Materials and Methods

DNA-Guided Assembly of Nanocellulose Meshes

In this study, we wanted to model the guided assembly of nanosized (bio-)fibril rods (R) with the help of DNA-based macrostructures (O), i.e., DNA origamis [28] (or simply denoted as origamis), acting as a smart-ligand in between two rods. Moreover, using precise sequence matching and positioning, one can hope to obtain a perfect orthogonal positioning of each two intersecting rods, as exemplified in Figure 1. While experimental implementations of such systems are currently on incipient stages in our laboratories, in this research, we wanted to study the possibility of controlling the size of the autonomously generated average aperture of these meshes, i.e., the average in-between rod gaps, by varying a series of parameters that are achievable from an experimental point of view.
A somewhat simplified discrete dynamical model of the above process can be described as follows: The origamis (O) are functionalized by two contiguous and perpendicular lines of identical-type aptamers (the number of aptamers per line is irrelevant but can be assumed to be at least 5), each of them being able to indiscriminately bind to the “body” of the rods. Moreover, the aptamers are positioned such that those placed on the horizontal line face the upper side, i.e., they bind a rod coming from above, while all those positioned on the vertical line face the lower side, see Figure 1. Note that, since the origamis can be reflected or rotated in the solution, the two lines might change their direction, but they will always remain orthogonal and all aptamers on the same line will face the same side of the origami. Positioning the aptamers on the correct side of the origami can be achieved by selecting the appropriate set of staple strands to be extended by the aptamer sequence, as it can be easily determined which staple-strands are ending facing upwards, downwards, or facing the plane of the origami. Note that such a 2-sided positioning of structures has been previously achieved experimentally; see, e.g., [23], where the authors demonstrate the positioning of orthogonal carbon nanotubes, placed each on a separate side of an origami surface.
The rods (R) are inorganic, or protein-based filamentary structures, all assumed to have an approximate equal length l r o d . Although the aptamers placed along the origamis generically stick to the rods, since these aptamers are positioned on one contiguous direction (per each face of the origami), it is expected that the entire rod will align on the origami according to this direction, as depicted in Figure 1. Thus, a docking position along a rod stands for one continuous section l d o c of this rod of length equal to the origami’s width. In order to translate this behavior into a discrete mathematical model, we asserted that each rod is provided with an integer number l l r o d l d o c of consecutive docking positions, each being able to independently bind to an origami (O) construct.
The structural dynamical framework employed to model the mesh assembly consists of two types of objects, origamis (O) and rods (R), and is defined by the following interaction rules. Each O has exactly two R-binding locations (a.k.a. docking positions), placed on the two opposite faces of the O’s 2D structure. Moreover, if both of these docking positions are occupied by two (distinct) R objects, their placement is confided to an orthogonal positioning to one another, as exemplified in Figure 1; the nano-engineering constrained backing such an abstraction have been described above. Once an O object is bounded on one of the R’s free docking positions, another R can dock onto this O, thus enlarging the assembly; in this study, we assumed that the R–O binding interactions are irreversible. By subsequent assemblies of R and O elements, the rods ultimately assemble into an orthogonal mesh structure, as all the R objects are aligned either horizontally or vertically (relative to one another). Every four interlocking R-objects defines an in-between empty space, also known as the holes within the mesh, and the average size of these pockets determine the aperture of the mesh structure. As in previous studies of self-assembly systems, we assumed that only elementary structures, i.e., R and O, can attach to an assembly and that partial assemblies do not interact with one another (as the free-floating capacity of larger structures decreases proportional to their increasing sizes). While we acknowledge that some partial assemblies might interact with one another, at this moment, it is not clear for us if a stability/binding-strength threshold should be added in order to enable such merger, e.g., in between large partial assembled meshes, as well as how—or if—such interactions can be captured in a tractable computational model. On the other hand, undesired binding in between origami structures, e.g., due to stacking/interactions, can be avoided by classical experimental techniques, such as adding single-strand 4T hairpin loops to the staple-strands (Within the DNA origami design principles, staple-strands are algorithmically designed and synthetically synthesized single-stranded DNA sequences that have the role of directing the assembly of a long single-stranded DNA sequence, known as the scaffold strand, into the desired 2D conformation) located at the border of the origami structure or even completely omitting the staple-strands normally positioned at the border of the origami; see e.g., [28,29].
Depending on the modelling assumptions enforced, we distinguished between several possible variants for the abstract model. On one hand, we called this model variant M1; we can assume that the minimum gap between two parallel rods is at least the size of an origami. Indeed, such close parallel rods would be placed on top of two origamis, each on consecutive docking positions of a third rod, which is perpendicular to both of them (see e.g., Figure 2a). Thus, in our model M1, in between every two parallel Rs, there should be at least one minimum space/gap, which is discretized as size 1 (in comparison to the discrete size l, i.e., the number of docking positions, of all the rods considered in the system).
On the other hand, we called this model variant M0; it could be that the two origamis which are docked on consecutive positions along the perpendicular rod have done so, with the first on one side of the rod and the latter on the opposite side (see Figure 2b). Thus, the two origamis could visually overlap, as they are on slightly different planes. Thus, according to this model variant, the distance in between two parallel rods could be as close to 0 as possible, i.e., will generate a “gap” of size 0 in the discrete universe of this model. Generalizing, we denoted by M d the model in which the minimum distance between two parallel rods has discrete value d in relation to the total discrete value l of the length of the rods. In this study, we concentrated over the models M0, M1, M2, and M3.
As previously mentioned, one of the objectives of this study was to gain actionable information on how to control, or influence, the average aperture size of the final assembled meshes, i.e., the average size of those spaces that are obtained by interlocking rods and that are completely surrounded by these rods. The model parameters identified by us as experimentally achievable and with a good chance of having an effect over the average gap size are the ratio between the number of origamis and rods in the system, and the discrete length l of these rods, respectively. The reasoning for choosing these parameters is as follows. In the classical DNA origami assembly, one important setting for achieving good experimental results is to correctly set the proportion between the concentration of scaffold strand and staple strands. Inspired by this fact, we believed that the ratio between the R and O elements could prove to be an efficient control mechanism for the size of the average mesh aperture. For the second parameter, the discretized length l of a rod, i.e., compared to the size of an origami, had an influence over the inter-rod spaces as it changes the probability of consecutive docking positions along an R object being occupied by O elements.

3. Results

3.1. Coarse-Grained Computational Modeling of the DNA-Fibril Dynamical System

We briefly present first a rule-based modeling approach for capturing the assembly of the DNA-fibril mesh. The model, first introduced in [25], is based on the BioNetGen modeling language [26,27] and implemented using the NFsim [30] and RuleBender [31] computational platforms.
As in the case of the mathematical dynamical system described before, our numerical model consists of 2 types of objects, rods (R) and origamis (O). As the NFsim numerical framework employed in the study was designed to operate with particle numbers, instead of concentrations of species, we fixed the number of R objects at 1000 copies while the number of O object may vary during the various numerical experiments depending on the value of the ratio s = O / R we wanted to analyze; this ratio s is one of the two parameters that we used in order to adjust/analyze the model dynamics. For example, for the case, when we studied the model where s = 0.1 , the number of O objects was fixed to 100.
The discrete length l of the rods was the second parameter in the study. Each R object has thus an l number of consecutive docking positions for the O elements, while each O has 2 docking positions for the R elements, each placed on a different side of the structure and orthogonal to one-another. While in this course-grain model we assumed the discrete length l of the rod objects to be uniform for the entire R population, the influence of a varying length distribution over the average gap size was analyzed in our subsequent approach discussed in the next session. As in the case of other studies dealing with computational simulations of the self-assembly process, we captured the growth of only one of the assemblies emerging from the system and, moreover, we assumed a lack of interactions on behalf of partial assemblies, i.e., only elementary R and O units interact with a partial assembly. This approach can be explained also as modelling only a very small portion of the entire volume of the experiment (see the relative small particle number of R and O objects), in which case the probability of two large assemblies coexisting so close is very small. The assembly starts from a preselected seed of type R and grows through multiple subsequent associations of O and R elements. We direct readers who are particularly interested in this rule-based approach to [25], where more technical details about this model are discussed.
By postprocessing the output NFsim data, we can reconstruct the entire state of the system at any desired time point, including the structure of the emerging assembly. Once extracted, the structural arrangement of interlocking R and O objects can be represented as a 2D integer matrix, called the mesh distribution matrix, for which the entry on point ( i , j ) has value k, k 0 , iff there are exactly k superimposed R objects on the (discrete) position ( i , j ) . In order to trim the output, we cropped this matrix according to the mesh surface determined by the area between the coordinates of the top and bottom horizontal R, and the left-most and right-most vertical R. The mesh distribution matrix can subsequently be displayed as a 2D heat map of the generated structure; see e.g., Figure 3.
During successive in silico experiments, we spanned the parameters s = O / R through the values 0.1, 0.5, 1, 5, and 10 and l through the values 5, 10, 15, and 20 while we kept the concentration (i.e., particle number) of free-floating Rs set to 1000. Also, we simulated each of these scenarios until the number of Rs captured within the mesh reached 1000 (Note: Even if the designing assumption is that of a closed dynamical model, with no copies of R and O objects being created or destroyed, we have to acknowledge that we are modelling a very small part/volume of this dynamical system. Thus, when one copy of an R or an O object become embedded in the assembly, the number of remaining free-floating copies in the entire volume, which is in the order of 10 20 , could be considered unchanged, and this assumption would remain the same in the case of subsequent 1000 of such additions. However, within the small volume that we are observing in our system, 1000 additions, or even 100, would substantially modify the reaction rates of the assembly process. To compensate between this difference between local concentration (within the modelled volume) and global concentration of the reactants, whenever an R on O object is embedded in the assembly, a new similar free-floating object is introduced, thus leaving the concentration of the reactants and their ratio s = O / R constant. Thus, the state when the assembly contains 1000 R objects is achievable in a reasonable time interval, even if we start with only 1000 free-floating copies of R). In each of the above experiments, we tracked the mean aperture of the holes in the mesh by averaging over the entire structure. In Figure 3a, we display these median values obtained after 30 independent runs of the computational model for each different ( O / R , l ) pair of parameters. For a visual assessment, in Figure 3b, we display the heat map of one of these simulations for the case when O / R = 0.1 and l = 10 .
The data captured in these experiments suggests that modifications in the rod’s length parameter l generates overall larger differences in the average mesh aperture values than modifications of the O / R parameter. However, this latter parameter also influences, at a lower fine-grained resolution, the average gap values, with slight value increases at the lower and upper limits of the scanned interval [ 0.1 , 10 ] .

3.2. Tailored Stochastic Modeling of Assembly Formation and Dynamics

The previously considered course-grained modelling approach captures very well the binding of free-floating R and O objects within the assembly. However, it does not record the intersections that these objects generate with other objects in the assembly, i.e., other than their initial docking partners. Indeed, in order to analyze the size and distribution of the generated gaps, we have to further process the output data and recreate the structural composition of the generated assembly. Since not all R-O intersections within the assembly are recorded, it implies that these undetected overlaps would generate an increased number of O (and subsequently R) overlapped docking positions, which in reality would not be reachable, as they would become encapsulated in the surrounding overlapped objects. Thus, the model would tend to over-agglomerate the assembly. In order to deal with this bias, we developed a special tailored stochastic modeling approach which keeps track of the overlying mesh structure during its dynamical evolution. Moreover, in this more flexible approach, we are able to amend the assumption of a fixed length value for the initial population of filament proteins by assuming instead that this parameter is distributed according to a given probability distribution. Finally, this modeling methodology has also the advantage of being able to take into consideration yet another important design parameter, namely d, the minimal length in between two possible O docking positions. The range of the d variable is from 0, i.e., two consecutive Os can dock on an R on abutting positions, to l 2 (with l as the discrete length of R), i.e., the two Os would dock on opposite heads of an R. This parameter corresponds to the design characteristic of the assembly-guiding DNA origami structures; large origamis, with respect to the width of a protein filament, generate larger d values, while smaller structural designs for O generate small d values. In this study, we concentrated over the cases when d = 0 , d = 1 , d = 2 , and d = 3 , giving the model the name Model d.
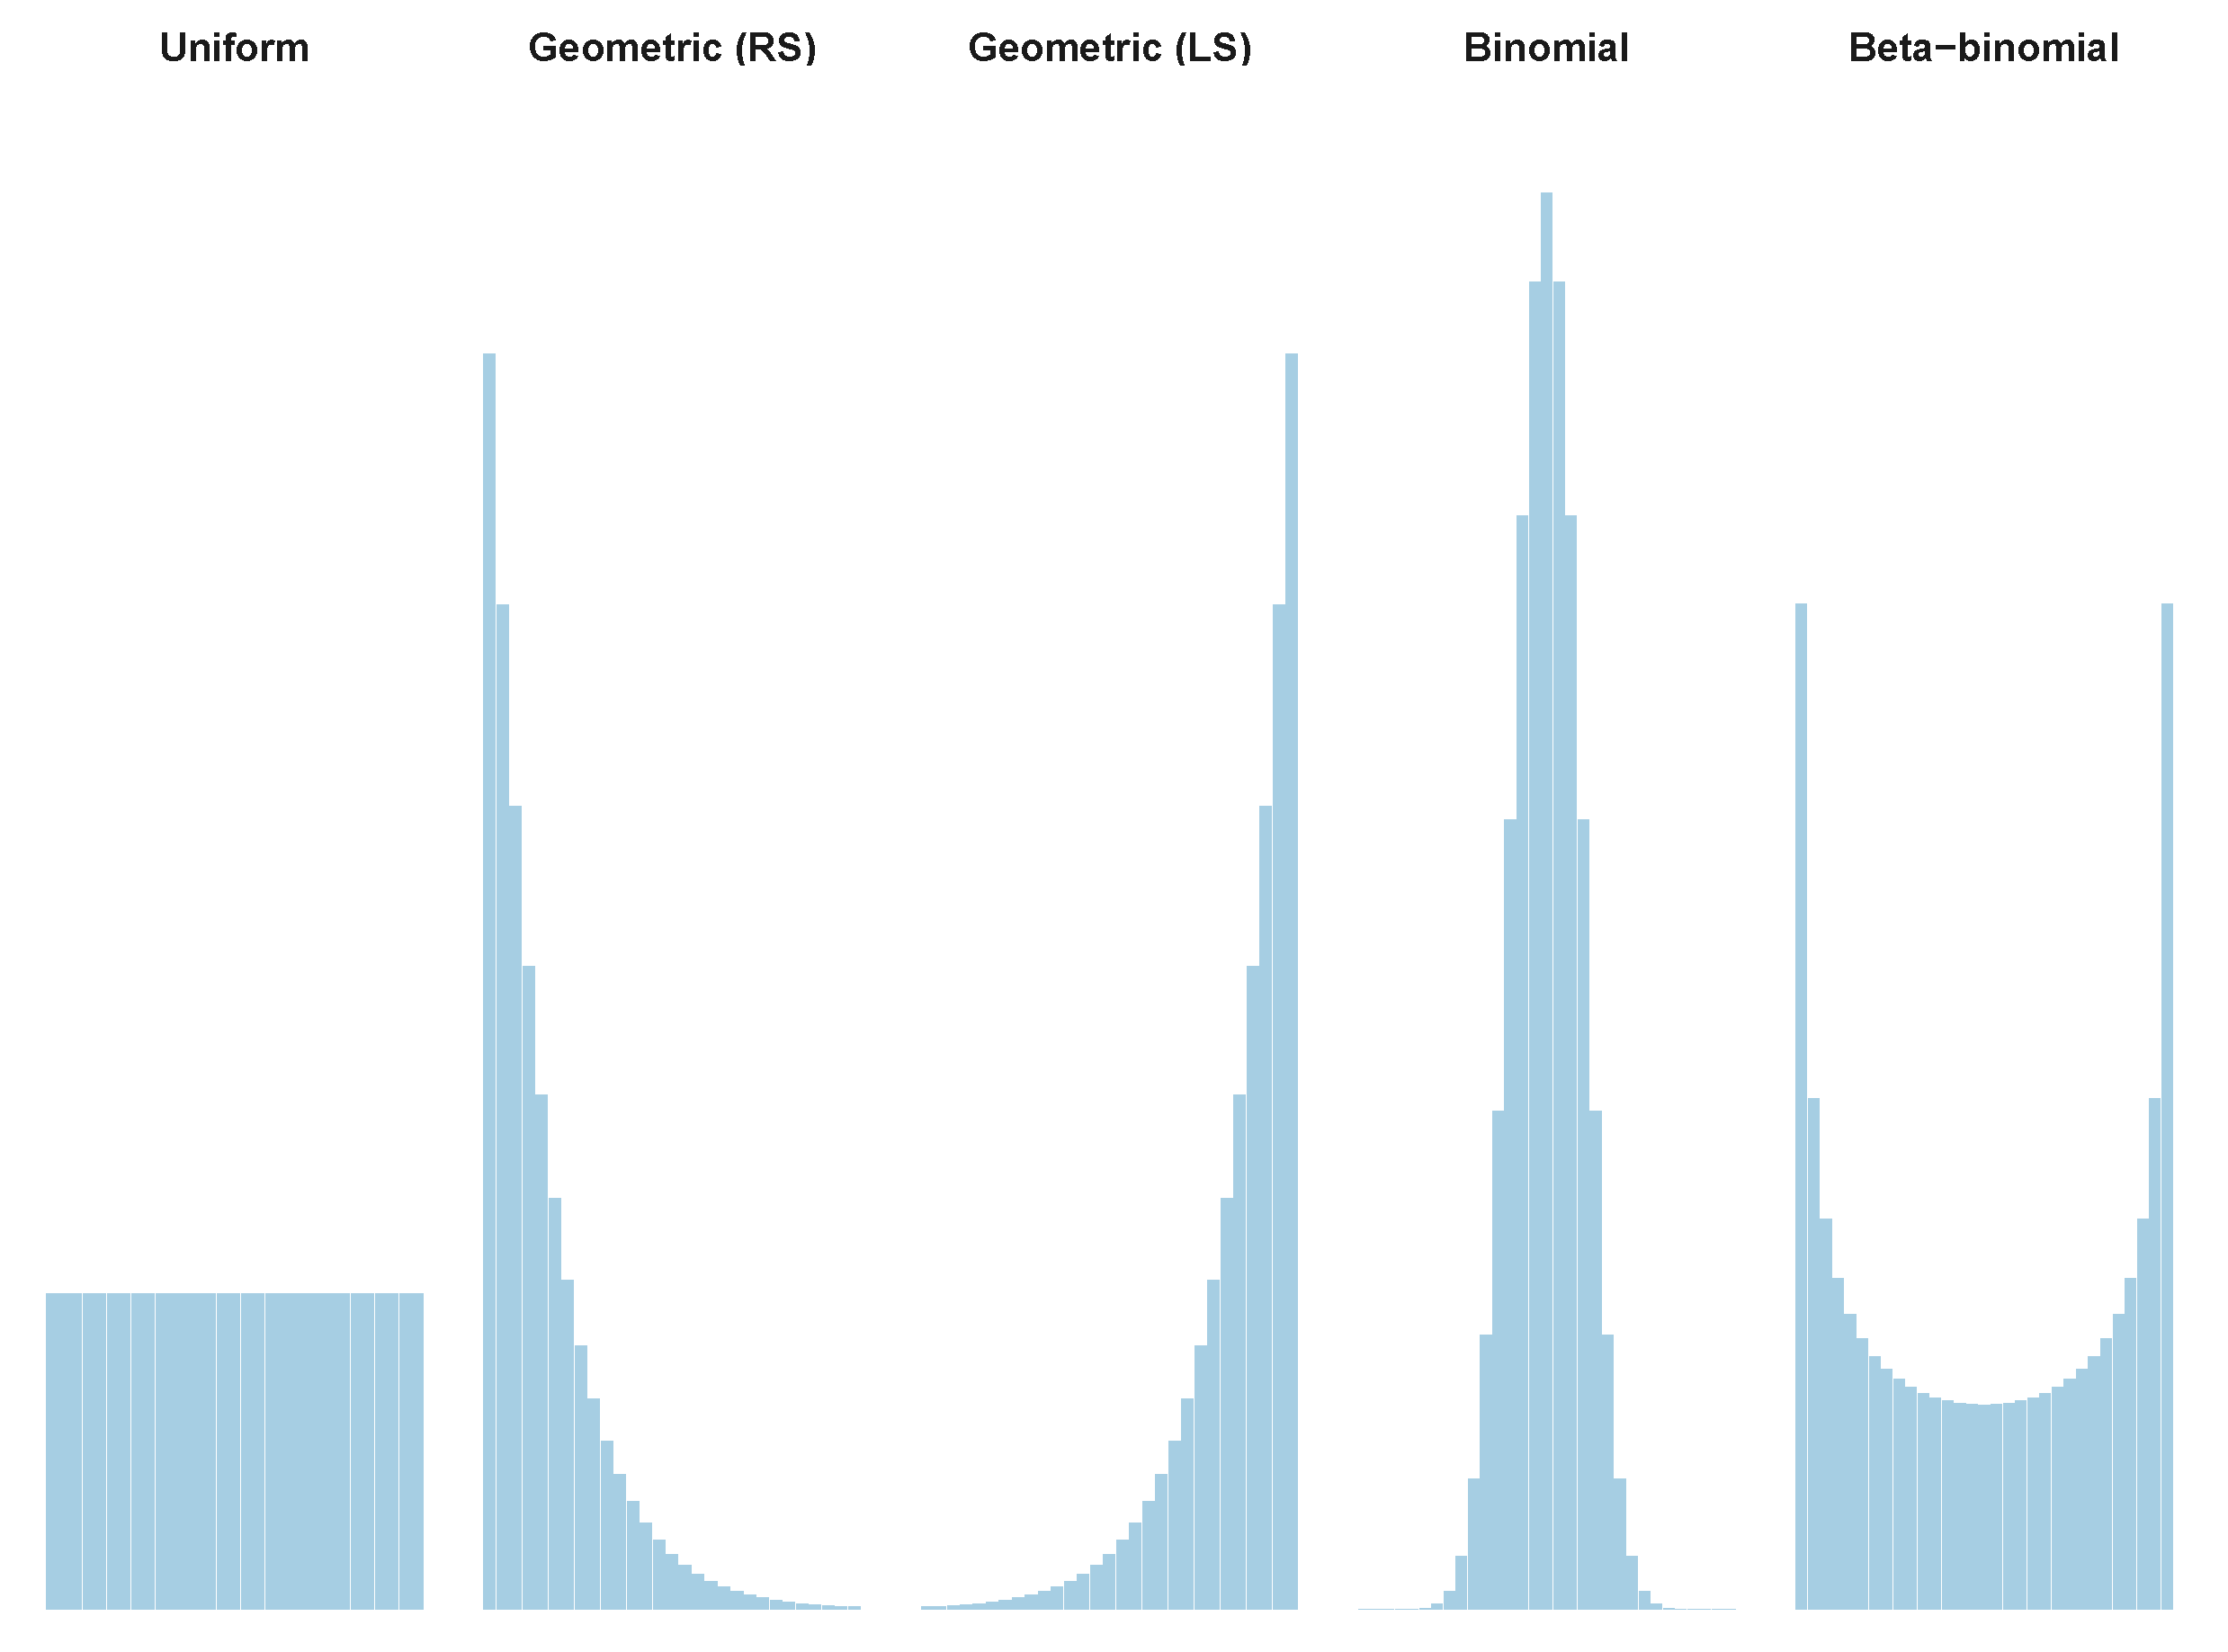
As previously mentioned, one of the advantages of the tailored stochastic model is that it can generate a population of R objects having a length l randomly distributed over the set { l m i n , l m i n + 1 , , l m a x } with any given distribution. We considered here five different initial distributions for the rod lengths: uniform distribution (uniform), which gives equal weight to all sizes within the considered interval; truncated right skewed geometric distribution (geometric (RS)), which puts more weight on rods with small lengths; truncated left skewed geometric distribution (geometric (LS)), which puts more weight on rods with large lengths; binomial distribution (binomial), for rod lengths of medium sizes; and beta-binomial distribution (beta-binomial), in order to include extreme, both small and large, cases. See e.g., Figure 4.
The simulation process, i.e., the generation of the mesh distribution matrix, starts with an empty mesh, containing only one R with length randomly generated over { l m i n , l m i n + 1 , , l m a x } according to the selected initial distribution. As in the previous modeling approach, we assumed that there are always 1000 free floating R objects and 1000 × s free floating O objects, where s = O / R is the stoichiometry ratio, a model parameter which we valued at 2.5, 5, 7.5, and 10 during subsequent in vitro experiments. At each iteration, we randomly selected an object, i.e., R or O, to place next, with probability P R and P O , respectively, where
P R = # R × D o c k R # R × D o c k R + # O × D o c k O , P O = 1 P R = # O × D o c k O # R × D o c k R + # O × D o c k O .
In the above equation, # R and # O are the number of free floating R and O objects; D o c k R is the number of free R-docking positions within the assembly, i.e., the number of O objects within the assembly that are connected only to one R element; and D o c k O is the maximum number of possible O-docking positions within the assembly, taking into consideration the minimum gap d allowed in between two consecutive docking positions along the same R object. When a rod object is selected, its length is randomly generated following the selected initial distribution. After a selection is made, the object is placed within the assembly on a position, which is randomly chosen (uniformly distributed) from the currently available free positions for that object in the assembly, and the values for D o c k O and D o c k R are updated accordingly (Note that, according to our assumption, the # R and # O values are constant). The process continues until the assembled mesh contains 1000 rods or there are no available positions within the assembly for origami or rod objects ( D o c k O + D o c k R = 0 ).
In order to asses the effect and possibly the actionable control pathway of each of the considered parameters over the average gap size of the mesh, namely, the O / R ratio, the type of length distribution for the initial rod length (considered always within the l m i n = 10 and l m a x = 40 bounds), and the minimal length d in between two possible docking positions, we performed a number of independent simulation runs for these models. In particular, for statistical relevance, for each different set of parameters, we always considered 100 independent iterations of the simulation process, while for computing the average gap size, we used the trimmed mean function (For almost all the statistical analysis presented in this section, we used all three central tendency measure functions, average, mean, and truncated mean, without obtaining any significant changes in the conclusions), excluding the top and bottom 10% of the values in order to filter out the outliers.
For an initial assessment of the outcome predicted by this current tailored stochastic approach, we analyzed the trend of the trimmed mean gap size for all the considered values of O / R differentiated by model and initial rod lengths distribution; see Figure 5, displaying these values. The locally estimated scatter plot smoothing (loess) fitted curves illustrates a stationary profile with a slow increase tendency with respect to O / R ratio for all models with extreme values for truncated geometric distribution: lower profile for right skewed and upper profile for left skewed. In accordance with the conclusions drawn from the analysis of our initial course grain model and despite the initial empirical assumption that the O / R ratio can influence the average gap size of the mesh structure, consistent numerical simulations showed that this parameter does not bring about a significant change over the considered statistic of the gap size. Thus, for model (and visualization) simplicity, for the remainder of this study, we concentrate only on the middle value, i.e., O / R = 5 .
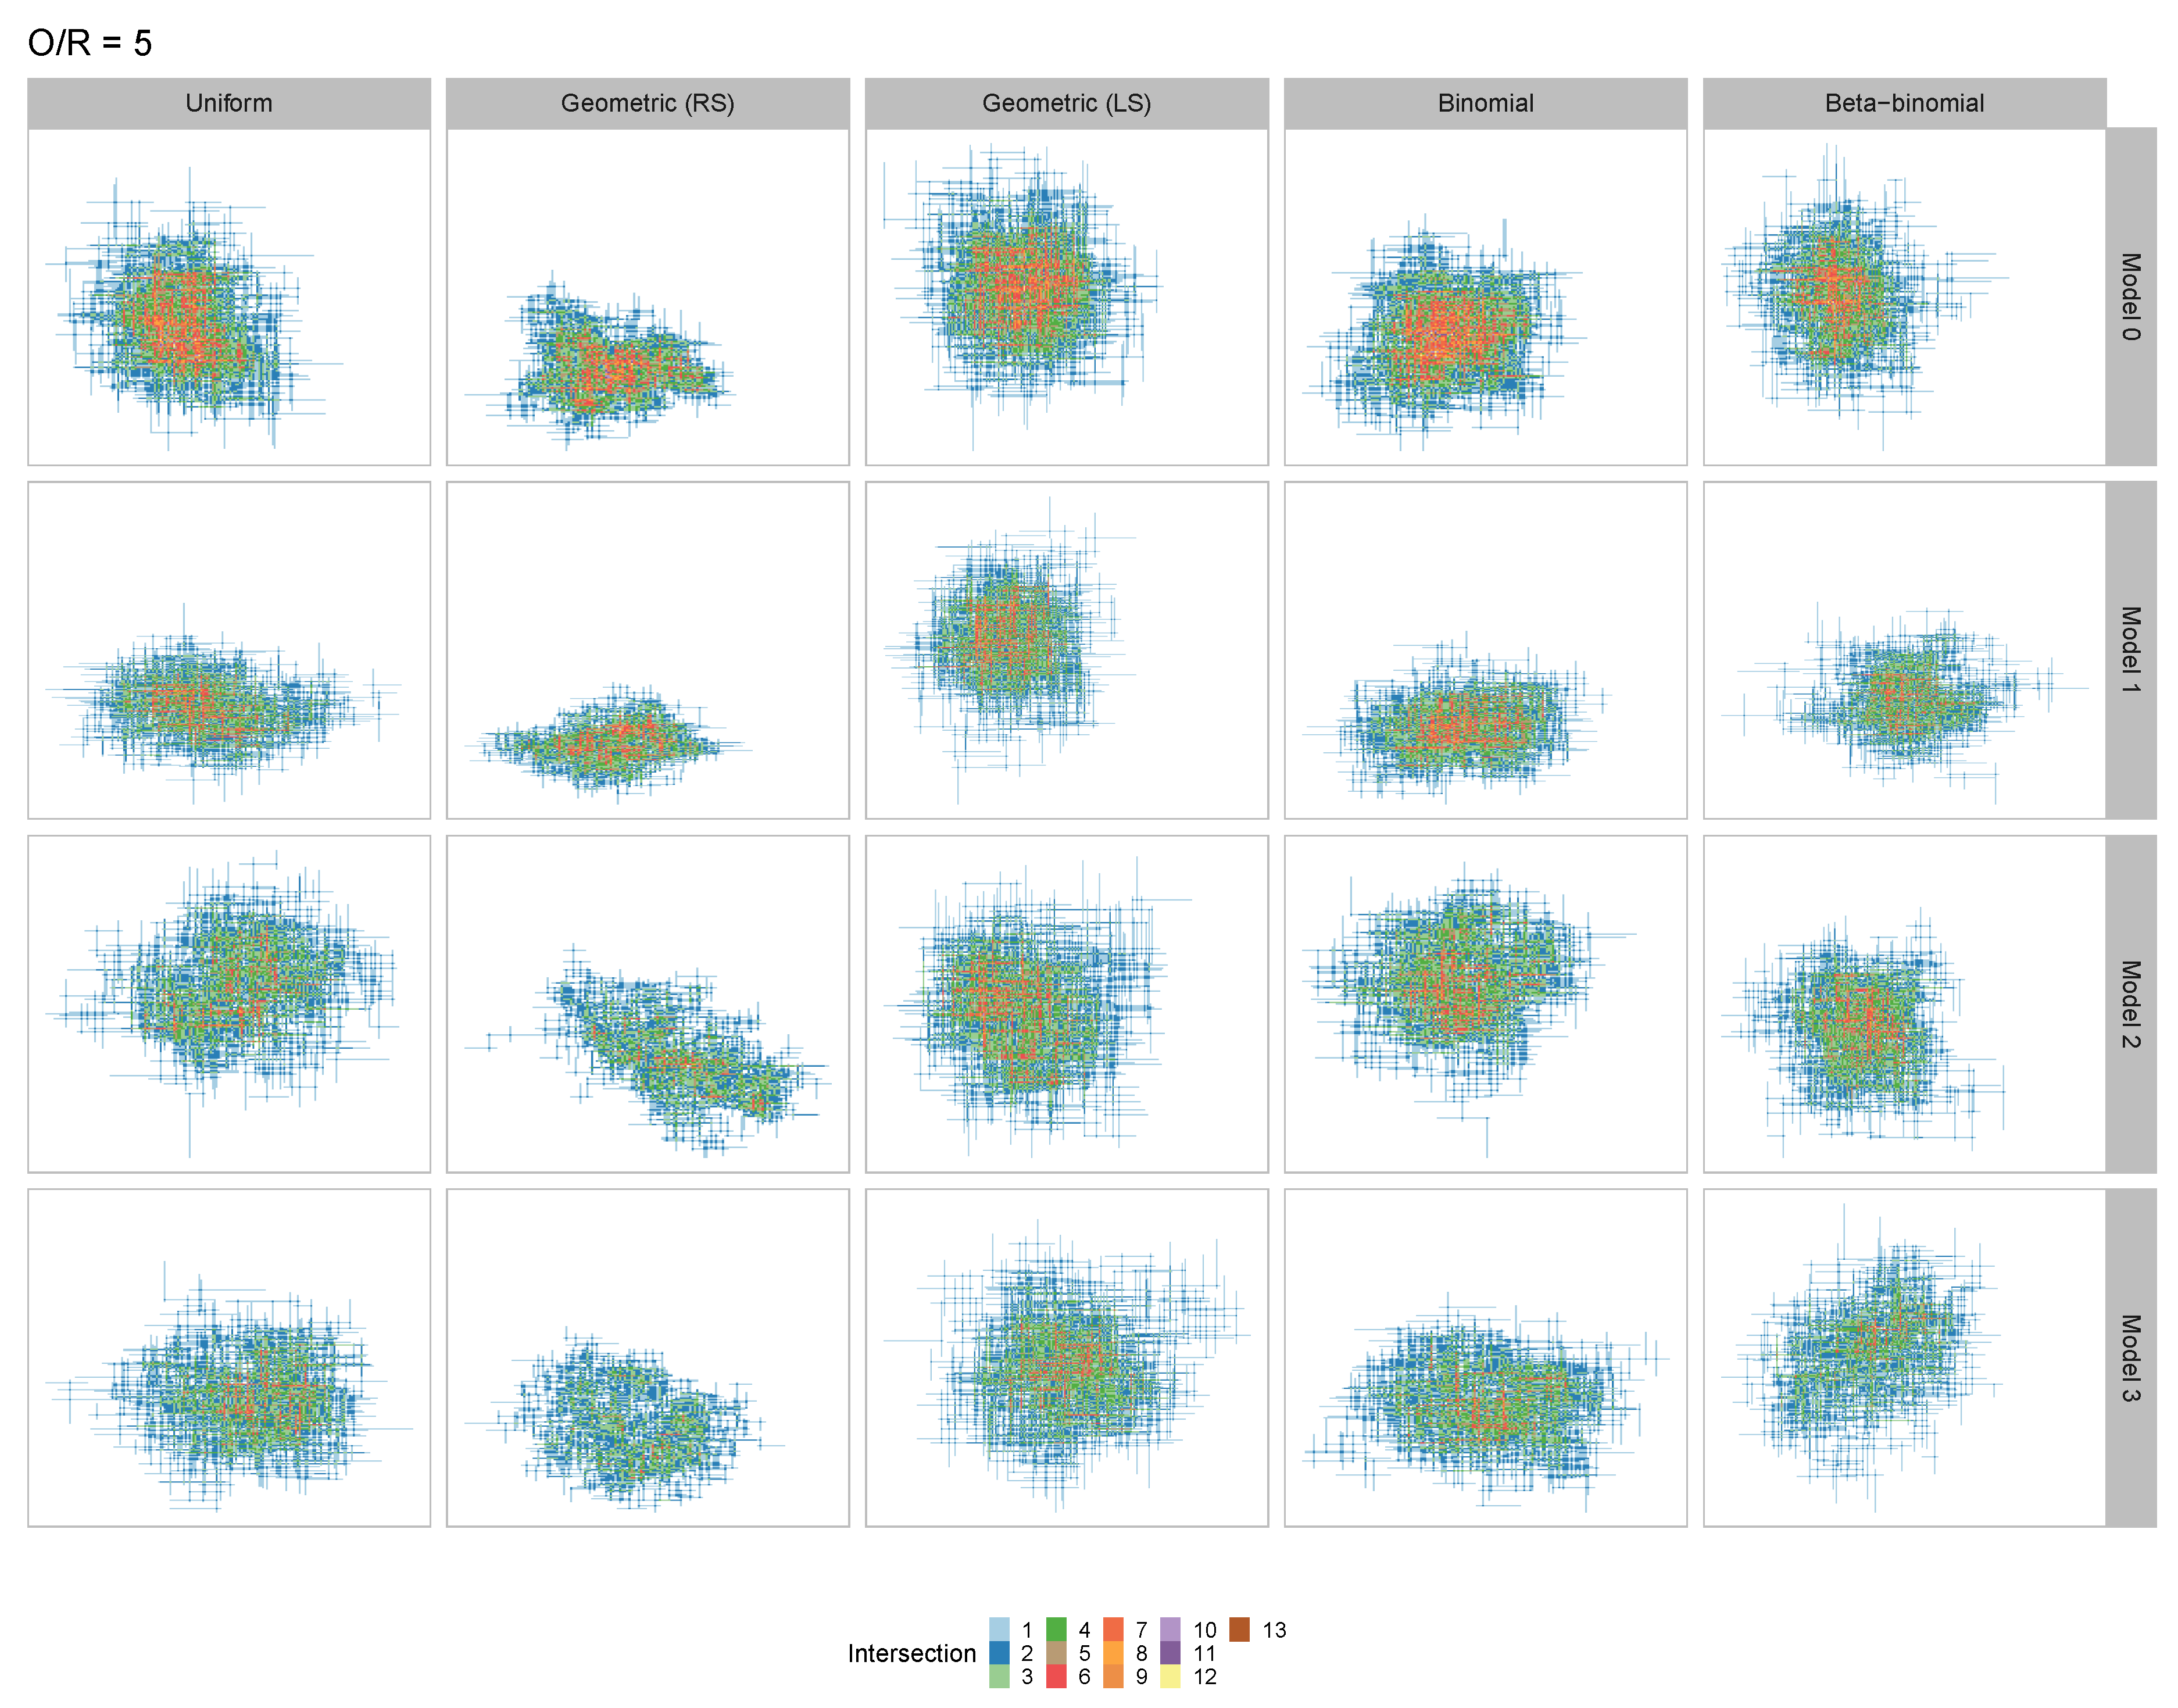
For a visual assessment of the different trends imposed by different model parameters, in Figure 6, we present the heat maps of the mesh distribution matrix for one representative assembled mesh in the case of each of the considered model variants M d and each initial rod length distribution. It can be remarked that the level of structurally superimposed R objects decreases with the increase in the minimum length parameter d in between two possible docking positions, regardless of the initial distribution of the rod lengths. Additionally, we can observe that the granularity of the assembled meshes increases both with the rod length and the distance d.
Another observation from Figure 6, supported also by the initial empirical assumption, is that the sizes of the gaps within the mesh are bound to be influenced by their relative position within the mesh, i.e., central locations are expected to exhibit smaller gap sizes. Thus, we further provided a localized statistics of the average gap size, based on a user-defined zoning granulation of the mesh distribution matrix and by assigning gaps within these zones according to the position of their center of mass. In this study, we focused on a 4 × 4 zoning, where the areas are labeled as bellow:
zone 1 zone 2 zone 3 zone 4 
zone 5 zone 6 zone 7 zone 8 
zone 9 zone 10 zone 11 zone 12 
zone 13 zone 14 zone 15 zone 16 
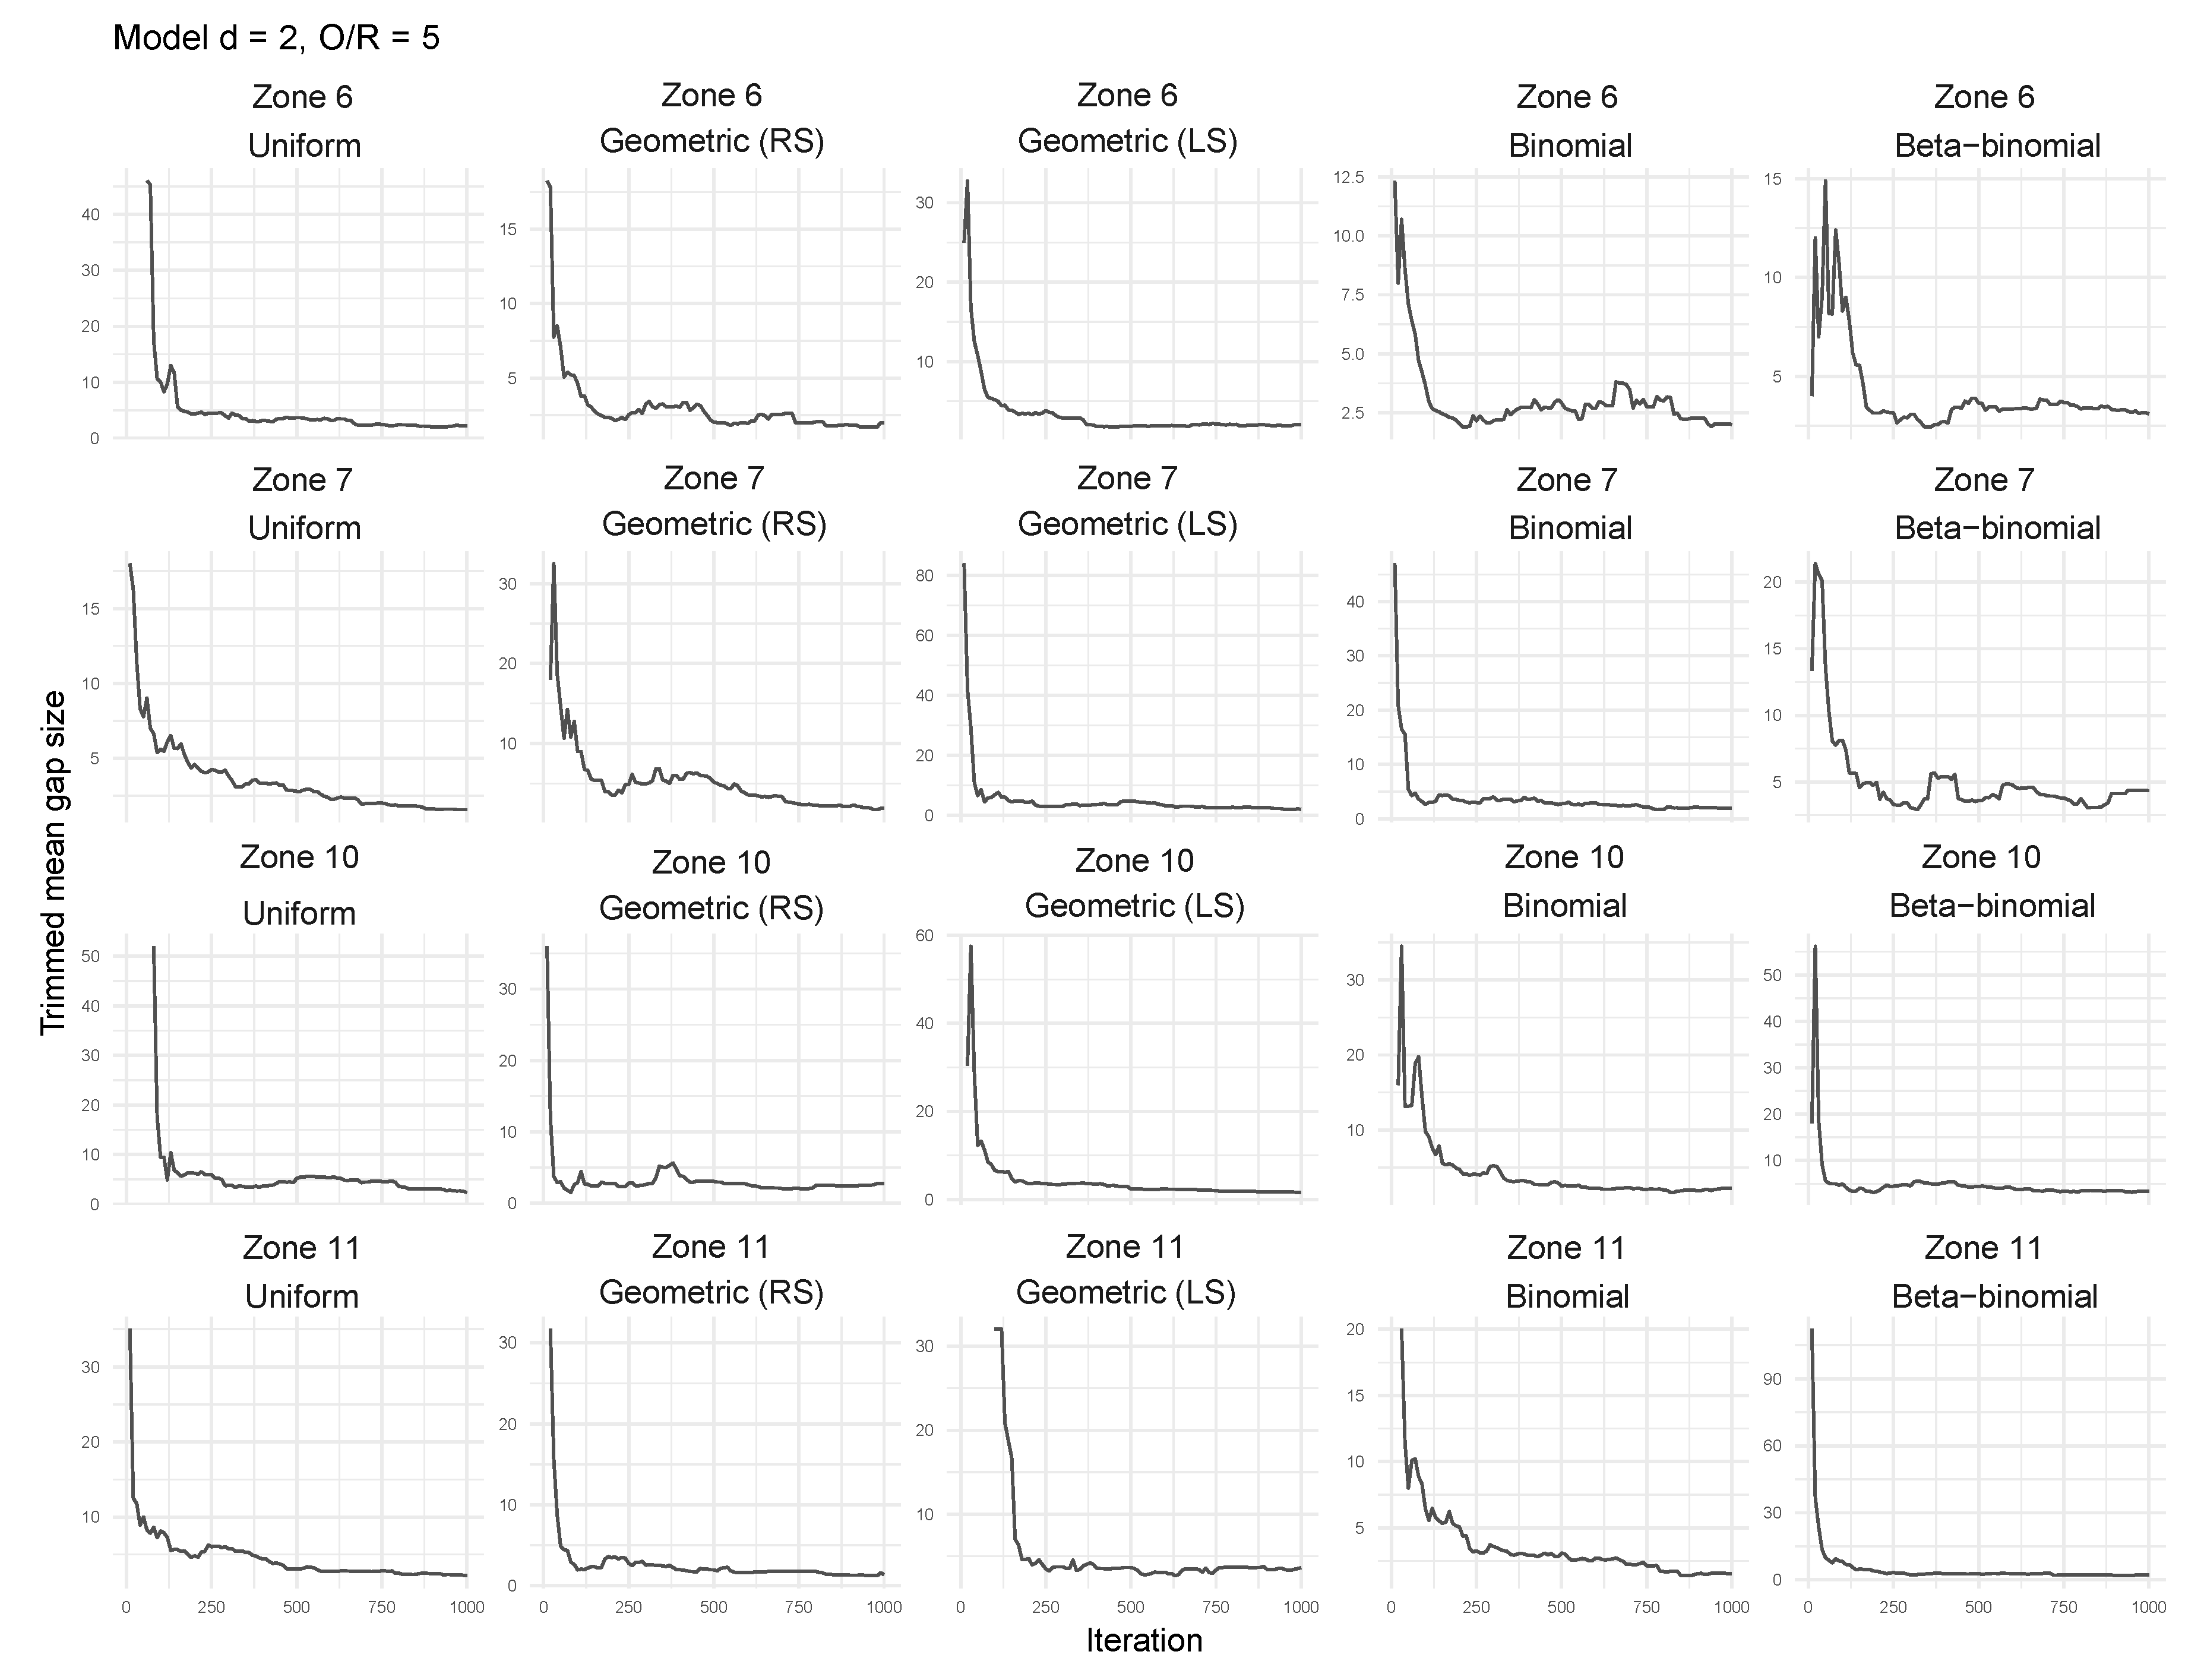
In Figure 7, we displaythe evolution of the trimmed mean gap size differentiated by central zones, i.e., zones 6, 7, 10, and 11 and rod lengths distributions for the considered mesh assembly models with ( d = 2 and O / R = 5 ). One can observe that, at the initial stages of the assembly process, the gap sizes are large, dropping fast to zero at latter stages, regardless of the initial distribution. This behavior can be intuitively explained by the forming process: since the assembly growth is radial, the available docking positions from the central zones are the first to be filled, generating a rapid aggregation of R objects and thus a fast decrease of the average gap size.
Furthermore, in Table 1, we present a numerical comparison of the trimmed mean gap size values for the selected central zones (z6, z7, z10, and z11) as well as for the entire structure (all) for each of the five initial distributions of the length of the rods. Despite the initial assumption, it can be noticed that, on average, the central zones are representative for the average gap size for the entire mesh. Additionally, similar to the conclusions drawn from analyzing the heat maps of the assemblies, we noticed a strong correlation between the rod lengths and the average gap sizes: assemblies in which the initial rod length distribution favors short R objects, i.e. geometric (RS), lead to smaller average gap sizes, while assemblies in which the initial rod length distribution allow even for a moderate number of long R objects, i.e. uniform, beta-binomial, and geometric (LS), lead to larger average gap sizes.
In order to test the goodness of fit of the distribution of the (trimmed) average gap size formed in the generated mesh to a hypothesized continuous cumulative distribution, a series of fifteen continuous cumulative distribution functions with positive support were considered (see Table A1 in the Appendix A). For each proposed distribution, the parameters were estimated using the Maximum Likelihood Estimation method (MLE) [32].
The fitting process was done with the help of three classical goodness of fit techniques based on empirical distribution functions [33]: Kolmogorov–Smirnov, Cramer–von Mises and Anderson–Darling. We used the Anderson–Darling’s statistic to select the best distribution among those fitted since it weights equally both the tails and the body of the distribution [34].
The computational methods and the estimation of the parameters of the test distributions were made by adapting the corresponding functions from the R packages: fitdistrplus [35], actuar [36], and VGAM [37].
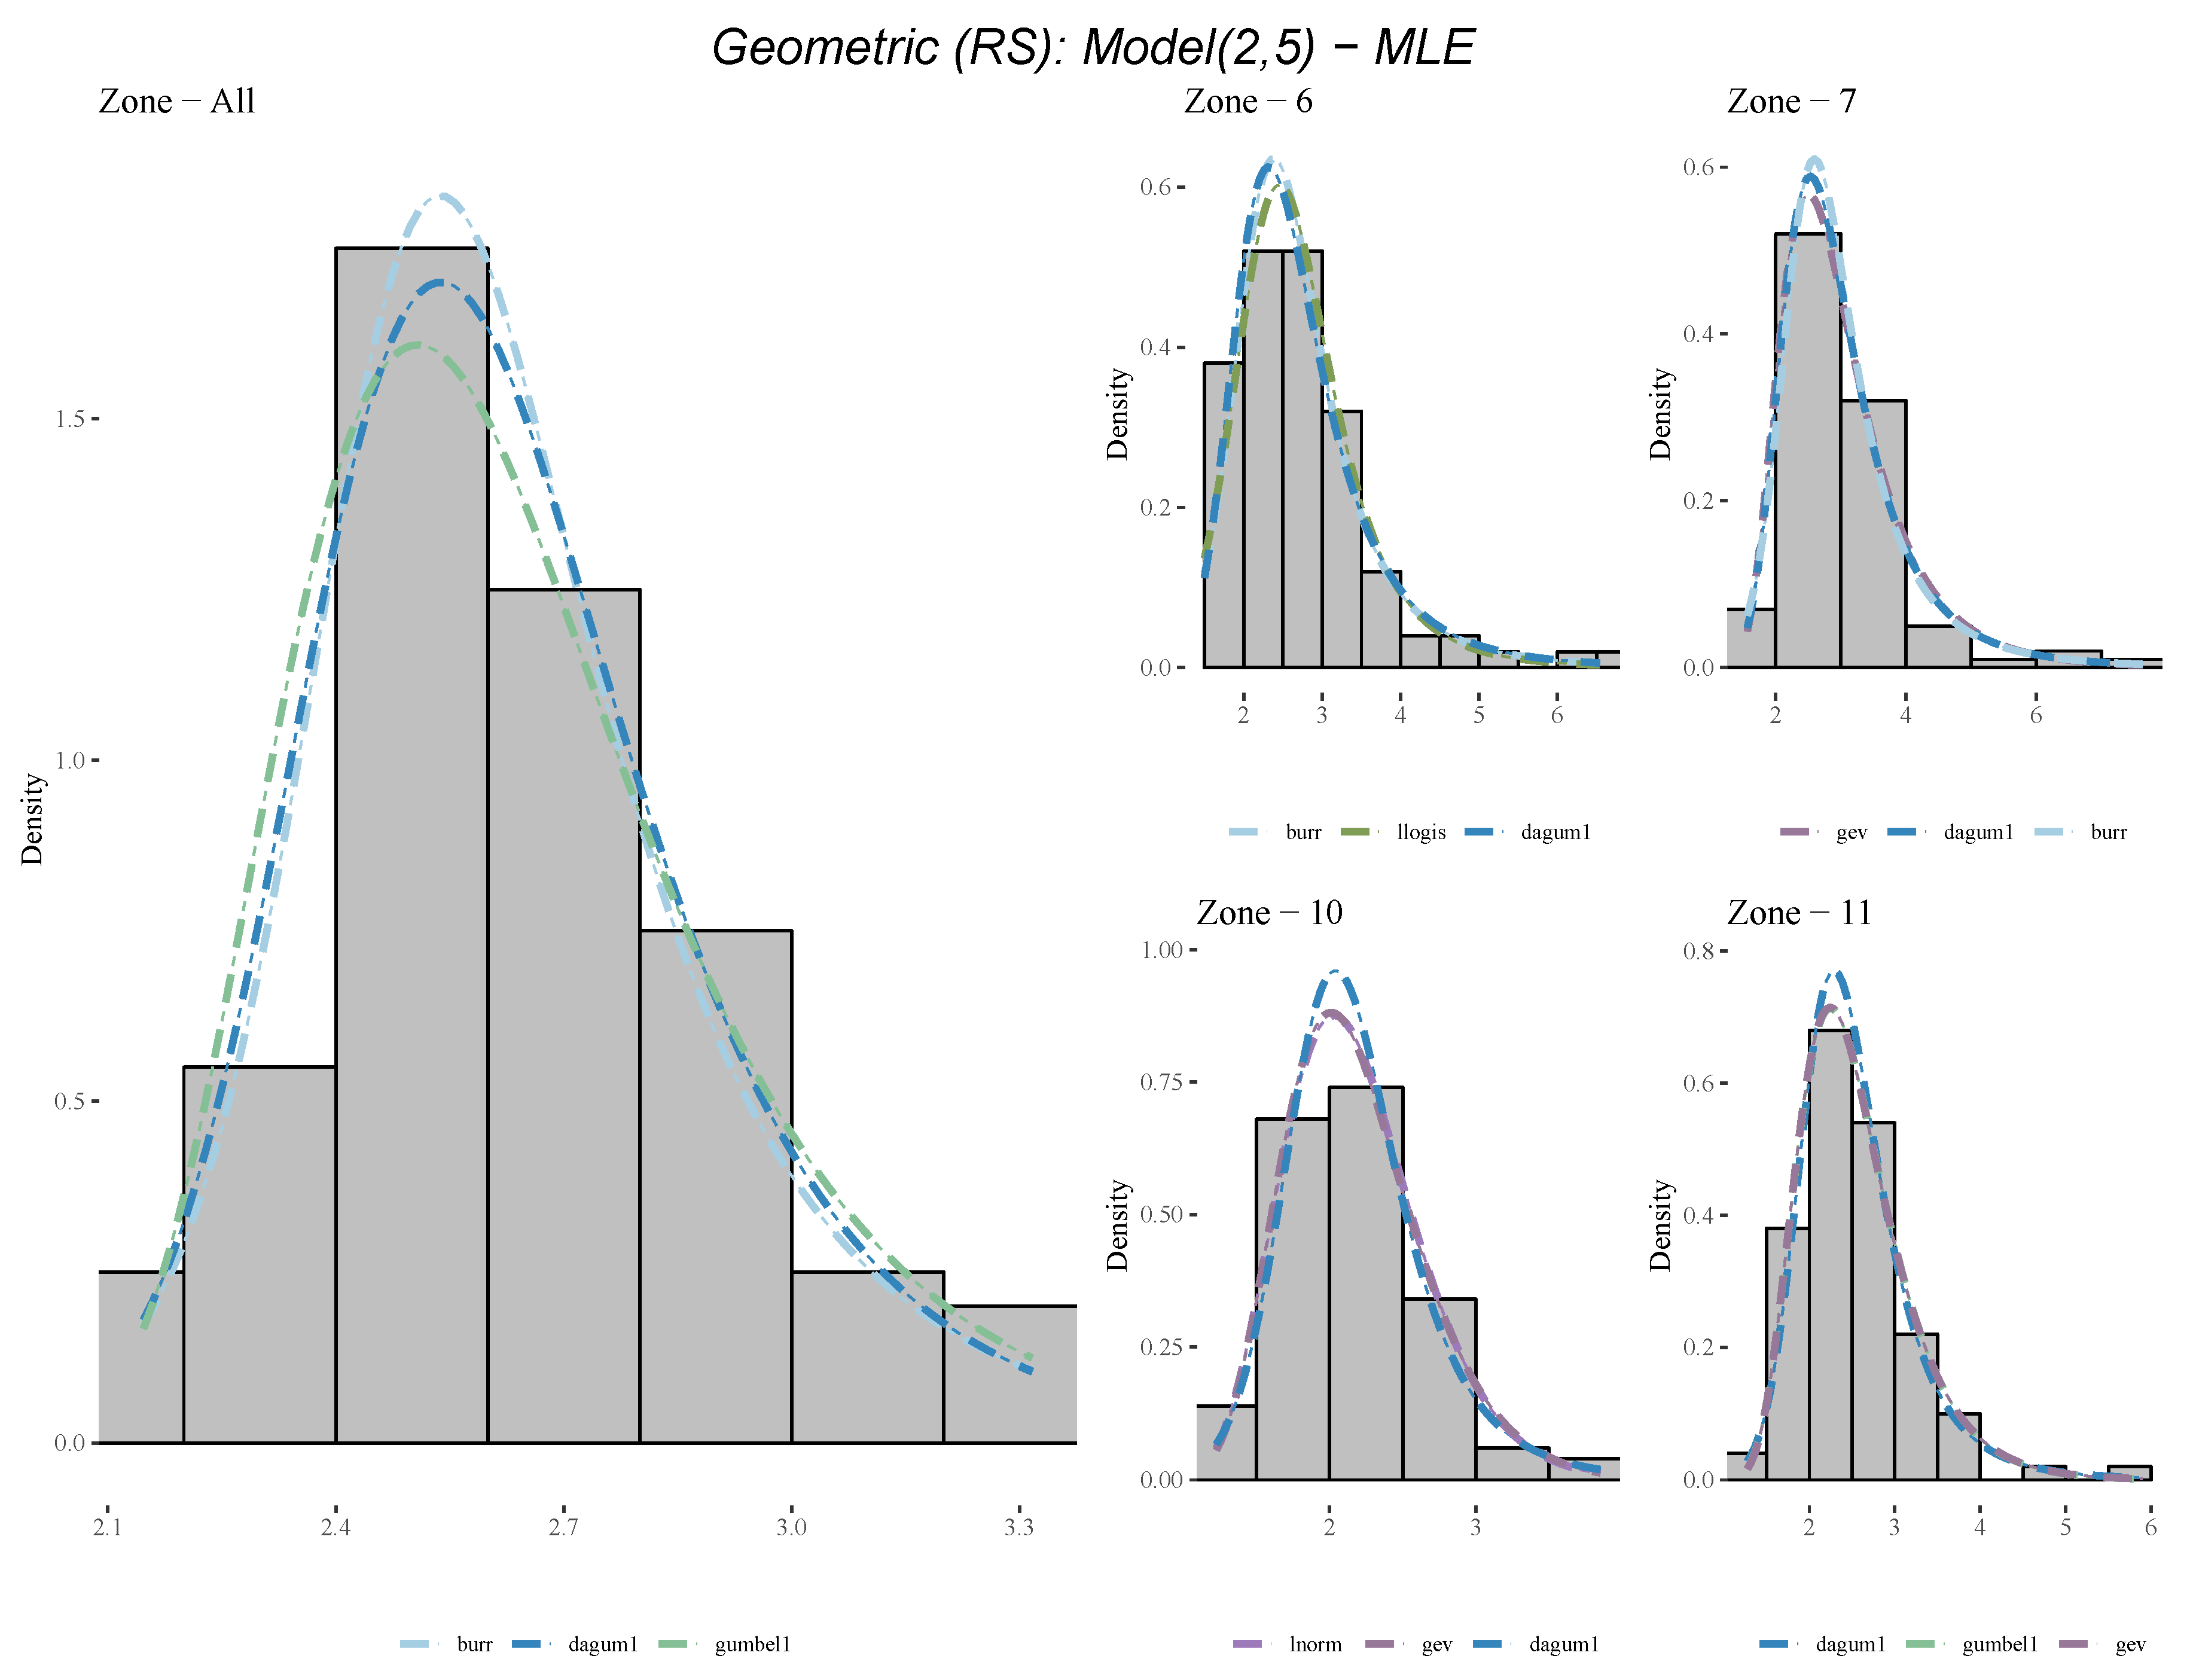
Considering the geometric (RS) case for the initial rod lengths distribution, in Figure 8, we present histograms of the trimmed average gap size distribution and the top three proposal distributions ranked according to Anderson–Darling criterion for the entire assembled mesh (all) and for each of the four central zones (z6, z7, z10, and z11). We can observe that, for this case, i.e., when the initial distribution of the rod lengths is truncated right skewed geometric, the Dagum distribution is a suitable candidate to model the distribution of the trimmed average gap size when O / R = 5 and d = 2 .
Similar numerical results were obtained for each model and each initial rod length distribution by considering the top five fitted distributions ranked according to Anderson–Darling statistic for each central zone as well as for the whole structure; Table A2 in the Appendix summarizes our findings for the case of d = 2 and O / R = 5 . Based on these results, in Table 2, we synthesize our findings and we present the most significant fitted distribution evaluated according to a weighted scheme.

4. Discussion

The combination of structural and dynamical modelling of biochemical systems, particularly those generated from a self-assembly construct, is known as a very challenging and complex computational task. One has to deal with the combinatorial explosion of the different expected species on one hand and to link the dynamical interaction process by the constantly changing structural state of the system on the other. In order to handle the above two challenging tasks, in this study, we employed two modeling methodologies, both with specific advantages and weaknesses. The rule-based modelling methodology, represented in this study by the BioNetGen modelling formalism and the NFsim numerical simulation platform, is specifically design in order to capture systems with a profound local interaction mechanism. This makes it well adjusted to capture the local structural constraints but has its shortcomings in accounting for those subsequent structural interactions developing further away from the local threshold established by the modeller. In the case of our self-assembly dynamical system, the developed numerical model is able to capture its time dynamics; it is governed by the Mass Action kinetics laws; and its simulations have acceptable run times, even for larger settings, e.g., when the fibril length is 40. On the other hand, the model cannot keep track of subsequent R object overlapping and, moreover, it is not able to disable the O docking sites on these overlapped sites. Thus, new R attachments have an abnormally high probability to attach to already agglomerated (and multiple overlapped) areas; this behavior can be observed for example also in Figure 3b, where we record values of up to 30+ overlaps on a single discrete position. As a consequence, lateral growth of the assembly is inhibited to some extent.
Within the tailored stochastic model, we have more control over the underlying structure, and thus, we can de-activate the unreachable docking positions. As seen in Figure 6, the assemblies obtained here are larger and with less overlaps. However, in this setting, we lose any notion of time dynamics, as the model does not take time into consideration. Additionally, for this computational model, simulation time becomes quickly prohibitive.
Another unexpected difference between our two computational implementations concerns the layout features of the meshes generated by the two models. As a direct consequence of the rod representation within the coarse-grained approach, i.e., as a linear sequence of equally spaced docking sites, within this model, the R fibrils never crosses the inter-docking spaces, thus generating meshes with a minimum gap of size 1 on every other position. On the tailored stochastic model, on the other hand, the requirement for consecutive O docking sites is that they should be at least d-positions apart. Thus, even for the d = 1 model, we could have some odd (≥3) distances in between consecutive placed O objects, which could make some (or, as it can be seen in Figure 6 many) of the (even, even)-type positions within the mesh crossed by R fibrils. Deciding which of the two situations better predicts the real assembly process can be determined only after experimentally implementing the system, a task which we are currently working on.
Although our objective is to design a multi-filament mesh by use of DNA origami construct assembly, one aspect of our approach seems not to benefit our ultimate goal. Particularly, in the current setting, one could argue that the origamis themselves might block the openings of the mesh, thus “clogging” the entire structure. We see the approach described here as a first step in generating such a mesh. After the rods are positioned within the structure with the help of the origamis, the mesh further transforms as the rods clamp each other and fix themselves in their current position while the nucleic acids proceed towards a process of denaturation. This could be achieved both by treating the network with a rod-ligand substance, e.g., as sericin does for silk-fibroin filaments [38], and by considering the native entanglement of the rods generated during the mesh assembly. In this latter direction, the fact that, during the mesh assembly, the origamis might bind in flipped orientations and form irregular stacks of Os and Rs is unexpectedly further advantageous.

Author Contributions

Conceptualization, A.A., M.P., A.R.-P., R.T., and E.C.; data curation, A.A., G.B., F.S., A.-M.P., and I.T.; formal analysis, A.A., A.P., and E.C.; investigation, A.-M.G., C.I., and I.T.; methodology, A.A., G.B., A.P., M.P., R.T., and E.C.; software, A.A., F.S., and M.P.; validation, A.-M.G., A.-M.P., and C.I.; visualization, A.A. and M.P.; writing—original draft, A.A., A.P., M.P., R.T., and E.C.; writing—review and editing, A.A., A.P., M.P., A.R.-P., and E.C. All authors have read and agreed to the published version of the manuscript.

Funding

This research was funded by the Romanian National Authority for Scientific Research and Innovation through the POC grant P_37_257 and by the Academy of Finland through grant 311371/2017.

Institutional Review Board Statement

Not applicable.

Informed Consent Statement

Not applicable.

Acknowledgments

The authors wish to thank the anonymous reviewers for their careful reading of the manuscript and their helpful suggestions and comments, which led to improvement of the paper.

Conflicts of Interest

The authors declare no conflict of interest.

Appendix A

Appendix A.1. Table of Reference Distributions

Table A1. List of the fifteen reference distributions with positive support used to test the goodness of fit for the empirical distribution of the trimmed mean gap size.
DistributionAcronymPDFParameters
Betabeta f ( x ) = Γ ( α + β ) Γ ( α ) Γ ( β ) x α 1 ( 1 x ) β 1 α , β > 0
Burrburr f ( x ) = α k x β α 1 β 1 + x β α k + 1 x 0 , α , β , k > 0
Dagumdagum1 f ( x ) = α k x β α k 1 β 1 + x β α k + 1 x 0 , α , β , k > 0
Gumbelgumbel f ( x ) = 1 σ e ( x μ σ + e x μ σ ) μ R , σ > 0
Logisticlogis f ( x ) = e x μ σ σ 1 + e x μ σ 2 μ R , σ > 0
Log-Logisticllogis f ( x ) = β x α β 1 α 1 + x α β 2 α , β > 0
Gammagamma f ( x ) = 1 Γ ( α ) β α x α 1 e x β α , β > 0
Pareto 1pareto1 f ( x ) = α β α x α + 1 x > β , α , β > 0
Weibullweibull f ( x ) = α β x β α 1 e x β α , x > 0 α , β > 0
Inverse Weibullinvweibull f ( x ) = α β x α e β x α x , x > 0 α , β > 0
Normalnorm f ( x ) = 1 2 π σ e ( x μ ) 2 2 σ 2 μ R , σ > 0
Log-Normallnorm f ( x ) = 1 x σ 2 π e ( log x μ ) 2 2 σ 2 μ , σ > 0
Generalized Extreme Valuegev f ( x ) = 1 σ e ( 1 + ξ x μ σ ) 1 ξ ( 1 + ξ x μ σ ) 1 1 ξ , ξ 0 1 σ e x μ σ e x μ σ , ξ = 0 1 + ξ x μ σ > 0 , ξ 0 x R , ξ = 0 ; μ , ξ R , σ > 0
Nakagaminaka f ( x ) = 2 m m Γ ( m ) Ω m x 2 m 1 e m Ω x 2 x 0 , m 0.5 , Ω > 0
Rayleighrayleigh f ( x ) = x σ 2 e x 2 2 σ 2 x 0 , σ > 0
Note: In the above probability density functions we have used Γ(x) to denote the Gamma function, i.e., Γ ( x ) = 0 t x 1 e t d t for x > 0.

Appendix A.2. Table of Top Ranked Fitted Distributions

Table A2. Top five fitted distributions according to Anderson–Darling statistic on each of the four central zones and the entire assembly differentiated by the initial distribution of the rod length.
DistributionZonesRank_Dist_1Rank_Dist_2Rank_Dist_3Rank_Dist_4Rank_Dist_5
Uniformz6gumbelgevlnormbetadagum1
Uniformz7dagum1burrgumbelllogislnorm
Uniformz10burrdagum1gevgumbelllogis
Uniformz11gumbeldagum1lnormburrllogis
Uniformallgammalnormnakagamiburrnormal
Geometric (RS)z6burrllogisdagum1gumbellnorm
Geometric (RS)z7gevdagum1burrgumbelllogis
Geometric (RS)z10lnormgevdagum1llogisburr
Geometric (RS)z11dagum1gumbelgevburrllogis
Geometric (RS)allburrdagum1gumbelllogisinvweibull
Geometric (LS)z6gevgumbeldagum1lnormburr
Geometric (LS)z7gevlnormgumbelgammadagum1
Geometric (LS)z10burrgumbeldagum1llogislnorm
Geometric (LS)z11llogisburrdagum1lnormgamma
Geometric (LS)allgammalnormnakagaminormalburr
Binomialz6dagum1burrllogisgumbelgev
Binomialz7gumbelgevlnormdagum1burr
Binomialz10gumbelgevlnormdagum1burr
Binomialz11dagum1gumbellnormburrllogis
Binomialallgumbeldagum1invweibullburrlnorm
Beta-binomialz6gevlnormgammadagum1llogis
Beta-binomialz7burrdagum1gevinvweibullgumbel
Beta-binomialz10burrdagum1gumbelllogislnorm
Beta-binomialz11gevlnormgumbeldagum1llogis
Beta-binomialallgevlnormburrllogisdagum1

References

  1. Ding, L.; Wei, Y.; Li, L.; Zhang, T.; Wang, H.; Xue, J.; Ding, L.X.; Wang, S.; Caro, J.; Gogotsi, Y. MXene molecular sieving membranes for highly efficient gas separation. Nat. Commun. 2018, 9, 155. [Google Scholar] [CrossRef]
  2. Xiong, G.; He, P.; Lyu, Z.; Chen, T.; Huang, B.; Chen, L.; Fisher, T.S. Bioinspired leaves-on-branchlet hybrid carbon nanostructure for supercapacitors. Nat. Commun. 2018, 9, 790. [Google Scholar] [CrossRef] [Green Version]
  3. Zhang, K.; Lin, S.; Feng, Q.; Dong, C.; Yang, Y.; Li, G.; Bian, L. Nanocomposite hydrogels stabilized by self-assembled multivalent bisphosphonate-magnesium nanoparticles mediate sustained release of magnesium ion and promote in-situ bone regeneration. Acta Biomater. 2017, 64, 389–400. [Google Scholar] [CrossRef]
  4. Jang, Y.; Choi, W.T.; Johnson, C.T.; García, A.J.; Singh, P.M.; Breedveld, V.; Hess, D.W.; Champion, J.A. Inhibition of Bacterial Adhesion on Nanotextured Stainless Steel 316L by Electrochemical Etching. ACS Biomater. Sci. Eng. 2018, 4, 90–97. [Google Scholar] [CrossRef] [Green Version]
  5. Chen, W.T.; Zhu, A.Y.; Sanjeev, V.; Khorasaninejad, M.; Shi, Z.; Lee, E.; Capasso, F. A broadband achromatic metalens for focusing and imaging in the visible. Nat. Nanotechnol. 2018, 13, 220–226. Available online: https://www.nature.com/articles/s41565-017-0034-6 (accessed on 8 February 2021). [CrossRef] [PubMed] [Green Version]
  6. Park, J.H.; Rutledge, G.C. Ultrafine high performance polyethylene fibers. J. Mater. Sci. 2018, 53, 3049–3063. [Google Scholar] [CrossRef] [Green Version]
  7. Ware, C.S.; Smith-Palmer, T.; Peppou-Chapman, S.; Scarratt, L.R.; Humphries, E.M.; Balzer, D.; Neto, C. Marine Antifouling Behavior of Lubricant-Infused Nanowrinkled Polymeric Surfaces. ACS Appl. Mater. Interfaces 2018, 10, 4173–4182. [Google Scholar] [CrossRef]
  8. Snow, R.J.; Bhatkar, H.; Diaye, A.T.N.; Arenholz, E.; Idzerda, Y.U.; Snow, R.J.; Bhatkar, H.; Diaye, A.T.N.; Arenholz, E.; Idzerda, Y.U. Large moments in bcc FexCoyMnz ternary alloy thin films. Appl. Phys. Lett. 2018, 112, 1–5. [Google Scholar] [CrossRef]
  9. Picker, A.; Nicoleau, L.; Burghard, Z.; Bill, J.; Zlotnikov, I.; Labbez, C.; Nonat, A.; Cölfen, H. Mesocrystalline calcium silicate hydrate: A bioinspired route toward elastic concrete materials. Sci. Adv. 2017, 3. Available online: https://advances.sciencemag.org/content/3/11/e1701216 (accessed on 8 February 2021). [CrossRef] [PubMed] [Green Version]
  10. Yuan, C.; Wu, Q.; Li, Q.; Duan, Q.; Li, Y.; Wang, H.G. Nanoengineered Ultralight Organic Cathode Based on Aromatic Carbonyl Compound/Graphene Aerogel for Green Lithium and Sodium Ion Batteries. ACS Sustain. Chem. Eng. 2018, 6, 8392–8399. [Google Scholar] [CrossRef]
  11. Kuzyk, A.; Laitinen, K.T.; Törmä, P. DNA origami as a nanoscale template for protein assembly. Nanotechnology 2009, 20, 235305:1–235305:5. [Google Scholar] [CrossRef]
  12. Kuzyk, A.; Schreiber, R.; Fan, Z.; Pardatscher, G.; Roller, E.M.; Högele, A.; Simmel, F.C.; Govorov, A.O.; Liedl, T. DNA-based self-assembly of chiral plasmonic nanostructures with tailored optical response. Nature 2012, 483, 311–314. Available online: https://www.nature.com/articles/nature10889 (accessed on 8 February 2021). [CrossRef] [Green Version]
  13. Tikhomirov, G.; Petersen, P.; Qian, L. Fractal assembly of micrometre-scale DNA origami arrays with arbitrary patterns. Nature 2017, 552, 67–71. Available online: https://www.nature.com/articles/nature24655 (accessed on 8 February 2021). [CrossRef] [PubMed] [Green Version]
  14. Benson, E.; Mohammed, A.; Gardell, J.; Masich, S.; Czeizler, E.; Orponen, P.; Högberg, B. DNA rendering of polyhedral meshes at the nanoscale. Nature 2015, 523, 441–444. Available online: https://www.nature.com/articles/nature14586 (accessed on 8 February 2021). [CrossRef] [PubMed] [Green Version]
  15. Zhang, X.; Ding, X.; Zou, J.; Gu, H. A proximity-based programmable DNA nanoscale assembly line. Methods Mol. Biol. 2017, 1500, 257–268. Available online: https://pubmed.ncbi.nlm.nih.gov/27813014/ (accessed on 8 February 2021).
  16. Lund, K.; Manzo, A.J.; Dabby, N.; Michelotti, N.; Johnson-Buck, A.; Nangreave, J.; Taylor, S.; Pei, R.; Stojanovic, M.N.; Walter, N.G.; et al. Molecular robots guided by prescriptive landscapes. Nature 2010, 465, 206–209. [Google Scholar] [CrossRef] [Green Version]
  17. Koh, L.D.; Cheng, Y.; Teng, C.P.; Khin, Y.W.; Loh, X.J.; Tee, S.Y.; Low, M.; Ye, E.; Yu, H.D.; Zhang, Y.W.; et al. Structures, mechanical properties and applications of silk fibroin materials. Prog. Polym. Sci. 2015, 46, 86–110. [Google Scholar] [CrossRef]
  18. Charrier, E.E.; Janmey, P.A. Chapter Two—Mechanical Properties of Intermediate Filament Proteins. Methods Enzymol. 2016, 568, 35–57. [Google Scholar] [CrossRef] [Green Version]
  19. Pal, S.; Deng, Z.; Ding, B.; Yan, H.; Liu, Y. DNA-Origami-Directed Self-Assembly of Discrete Silver-Nanoparticle Architectures. Angew. Chem. Int. Ed. 2010, 49, 2700–2704. [Google Scholar] [CrossRef]
  20. Scharnweber, D.; Bierbaum, S.; Wolf-Brandstetter, C. Utilizing DNA for functionalization of biomaterial surfaces. FEBS Lett. 2018, 592, 2181–2196. [Google Scholar] [CrossRef] [Green Version]
  21. Alarcon, L.P.; Baena, Y.; Manzo, R.H. Interaction between DNA and Drugs Having Protonable Basic Groups: Characterization through Affinity Constants, Drug Release Kinetics, and Conformational Changes. Sci. Pharm. 2017, 85, 1. [Google Scholar] [CrossRef] [Green Version]
  22. Inoue, Y.; Fukushima, T.; Hayakawa, T.; Takeuchi, H.; Kaminishi, H.; Miyazaki, K.; Okahata, Y. Antibacterial characteristics of newly developed amphiphilic lipids and DNA–lipid complexes against bacteria. J. Biomed. Mater. Res. Part A 2003, 65A, 203–208. [Google Scholar] [CrossRef]
  23. Maune, H.T.; Han, S.P.; Barish, R.D.; Bockrath, M.; Iii, W.A.; Rothemund, P.W.; Winfree, E. Self-assembly of carbon nanotubes into two-dimensional geometries using DNA origami templates. Nat. Nanotechnol. 2010, 5, 61–66. [Google Scholar] [CrossRef] [Green Version]
  24. Eskelinen, A.P.; Kuzyk, A.; Kaltiaisenaho, T.K.; Timmermans, M.Y.; Nasibulin, A.G.; Kauppinen, E.I.; Törmä, P. Assembly of single-walled carbon nanotubes on DNA-origami templates through streptavidin-biotin interaction. Small 2011, 7, 746–750. [Google Scholar] [CrossRef]
  25. Amărioarei, A.; Barad, G.; Czeizler, E.; Dobre, A.M.; Iţcuş, C.; Mitrana, V.; Păun, A.; Păun, M.; Spencer, F.; Trandafir, R.; et al. DNA-Guided Assembly of Nanocellulose Meshes. In Theory and Practice of Natural Computing; Fagan, D., Martín-Vide, C., O’Neill, M., Vega-Rodríguez, M.A., Eds.; Springer International Publishing: Cham, Switzerland, 2018; pp. 253–265. [Google Scholar]
  26. Faeder, J.R.; Blinov, M.L.; Goldstein, B.; Hlavacek, W.S. Rule-based modeling of biochemical networks. Complexity 2005, 10, 22–41. [Google Scholar] [CrossRef]
  27. Faeder, J.R.; Blinov, M.L.; Hlavacek, W.S. Rule-based modeling of biochemical systems with BioNetGen. In Methods in Molecular Biology; Humana Press: Totowa, NJ, USA, 2009; Volume 500, pp. 113–167. Available online: https://pubmed.ncbi.nlm.nih.gov/19399430/ (accessed on 8 February 2021).
  28. Rothemund, P.W. Folding DNA to create nanoscale shapes and patterns. Nature 2006, 440, 297–302. Available online: https://www.nature.com/articles/nature04586 (accessed on 8 February 2021). [CrossRef] [PubMed] [Green Version]
  29. Woo, S.; Rothemund, P.W.K. Programmable molecular recognition based on the geometry of DNA nanostructures. Nat. Chem. 2011, 3, 620–627. [Google Scholar] [CrossRef]
  30. Sneddon, M.W.; Faeder, J.R.; Emonet, T. Efficient modeling, simulation and coarse-graining of biological complexity with NFsim. Nat. Methods 2011, 8, 177–183. [Google Scholar] [CrossRef] [PubMed]
  31. Smith, A.M. Rulebender: Integrated Modeling, Simulation and Visualization for Rule-Based Intracellular Biochemistry. BMC J. Bioinform. 2012, 13, 1–39. [Google Scholar] [CrossRef] [PubMed] [Green Version]
  32. Hogg, R.V.; McKean, J.; Craig, A.T. Introduction to Mathematical Statistics, 7th ed.; Pearson: Boston, MA, USA, 2012. [Google Scholar]
  33. D’Agostino, R.; Stephens, M. Goodness-of-Fit Techniques, 1st ed.; Marcel Dekker, Inc.: New York, NY, USA, 1986. [Google Scholar]
  34. Luceno, A. Fitting the Generalized Pareto Distribution to Data Using Maximum Goodness-of-fit Estimators. Comput. Stat. Data Anal. 2006, 51, 904–917. [Google Scholar] [CrossRef]
  35. Delignette-Muller, M.; Pouillot, R.; Denis, J.; Dutang, C. Fitdistrplus: An R Package for Fitting Distributions. J. Stat. Softw. 2015, 64, 1–34. [Google Scholar] [CrossRef] [Green Version]
  36. Dutang, C.; Goulet, V.; Pigeon, M. Actuar: An R Package for Actuarial Science. J. Stat. Softw. 2008, 25, 1–37. [Google Scholar]
  37. Yee, T. Vector Generalized Linear and Additive Models: With an Implementation in R; Springer: New York, NY, USA, 2015. [Google Scholar]
  38. Qi, Y.; Wang, H.; Wei, K.; Yang, Y.; Zheng, R.Y.; Kim, I.S.; Zhang, K.Q. A Review of Structure Construction of Silk Fibroin Biomaterials from Single Structures to Multi-Level Structures. Int. J. Mol. Sci. 2017, 18, 237. [Google Scholar] [CrossRef]
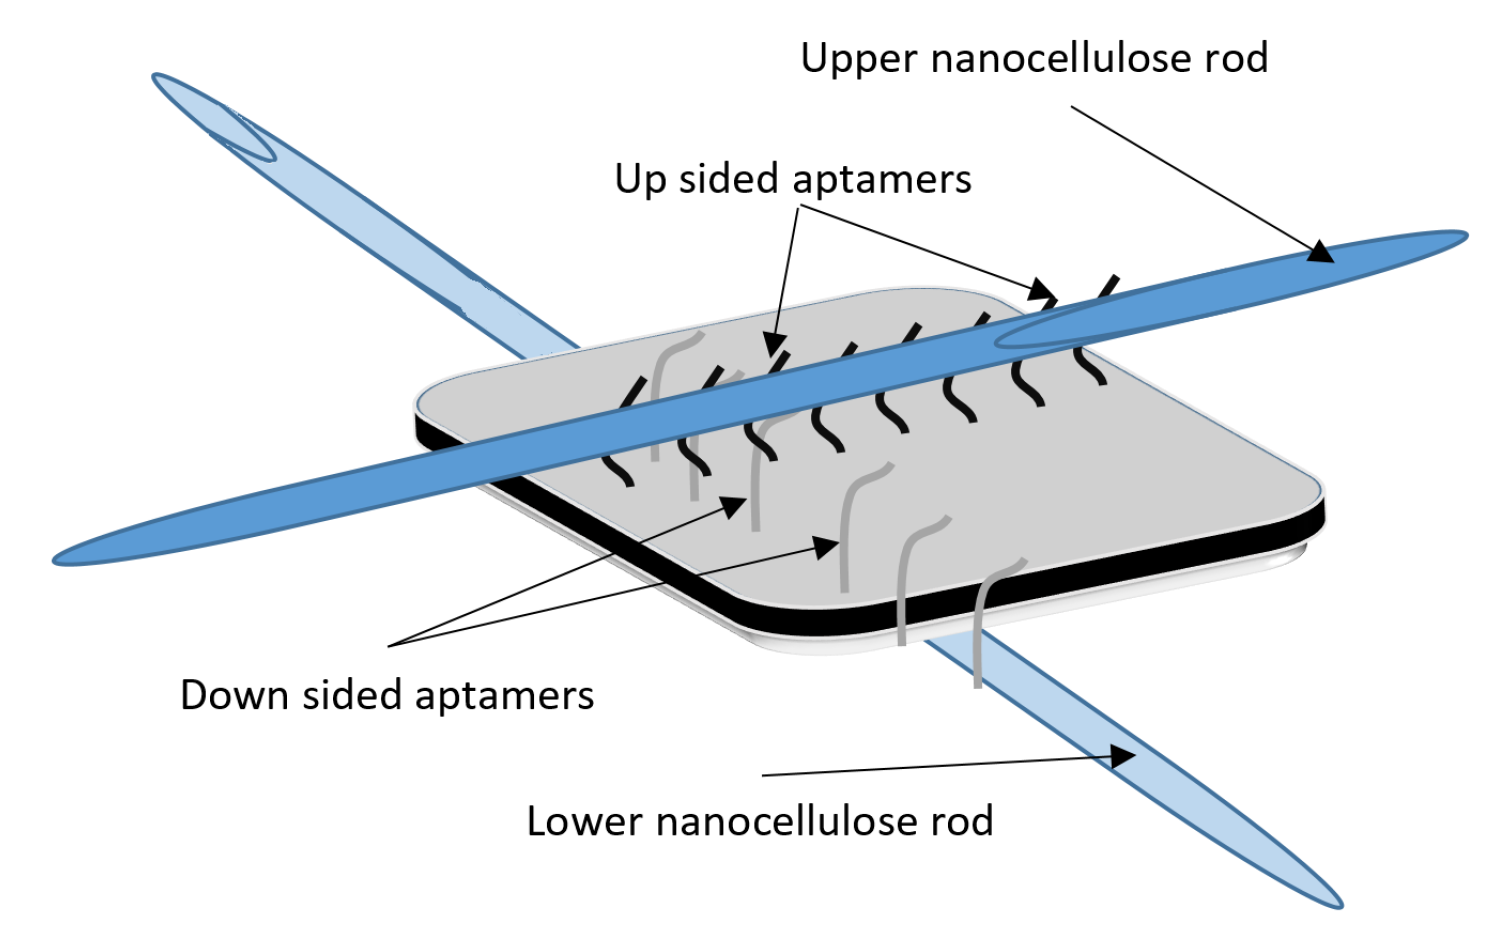
Figure 1. DNA origami functionalized by orthogonally aligned specific aptamers, placed on opposite sides, and connected to rod-like structures.
Mathematics 09 00404 g001
Figure 2. Possible origami positioning along a fibril: (a) both origamis are positioned on the same side of the fibril, in which case a minimum (one-origami wide) inter-fibril gap has to be present, and (b) the origamis are positioned on opposite sides of the fibril, in which case, in between two parallel fibrils, there could be almost no space at all.
Mathematics 09 00404 g002
Figure 3. Results of the coarse-grained model: (a) dynamics of the assembly averaged gap size per O / R and rod length variation. Each data point is a median of approximately 30 independent runs. The horizontal axes represents the O / R parameter, and the vertical one is the average size of the hole. (b) The heat map of the 2D matrix representations of the R object interconnections generated within one run instance of the coarse-grained model for the case when O / R = 0.1 and l = 10 . All assemblies contain 1000 rods.
Mathematics 09 00404 g003
Figure 4. The five initial rod lengths distributions. From left to right: uniform, truncated right skewed geometric (geometric (RS)), truncated left skewed geometric (geometric (LS)), binomial, and beta-binomial.
Mathematics 09 00404 g004
Figure 5. Loess tendency of the trimmed mean gap size for all O / R ratios differentiated by initial distribution of the rod lengths and all models characterized by the minimum gap d allowed in between two consecutive docking positions.
Mathematics 09 00404 g005
Figure 6. Heat maps of 2D representations of the mesh structure for each model and each initial rod length distribution in the case of O / R = 5 colored with respect to the intersection degree of R objects.
Mathematics 09 00404 g006
Figure 7. Time-dependent evolution of the trimmed mean gap size for the mesh assembly in the case of d = 2 and O / R = 5 , when the dynamics of the system is frozen once the total number of rods in the structure reaches 1000. The evolution is spitted for each initial distribution of the rod lengths and each of the four central zones.
Mathematics 09 00404 g007
Figure 8. Histogram representation of the trimmed mean gap size for each of the four central zones and the entire assembly along with the top three corresponding fitted distributions.
Mathematics 09 00404 g008
Table 1. Trimmed mean gap size values of 100 independent runs of the in silico experiments in the case of d = 2 and O / R = 5 evaluated for each initial rod length distribution, for each of the four central zones, as well as for the entire assembly.
Distributionz6z7z10z11All
Uniform3.26753.40933.28053.52883.5151
Geometric (RS)2.74253.02762.18102.54242.6354
Geometric (LS)3.52833.33863.41993.32753.6453
Binomial3.13542.92353.19803.00203.2363
Beta-binomial3.39833.49453.51013.41273.5035
Table 2. The most representative fitted distributions for each initial rod length distribution evaluated by employing a linear weighting scheme on the top five fitted distributions for all four central zones and for the entire structure, as presented in Table A2.
DistributionModelO/R RatioFitted Distribution
Beta-binomial25gev
Binomial25gumbel
Geometric (LS)25lnorm
Geometric (RS)25dagum1
Uniform25gumbel
Publisher’s Note: MDPI stays neutral with regard to jurisdictional claims in published maps and institutional affiliations.