
Multi-Objective Two-Stage Stochastic Programming Model for a Proposed Casualty Transportation System in Large-Scale Disasters: A Case Study


Abstract
1. Introduction
2. Literature Review
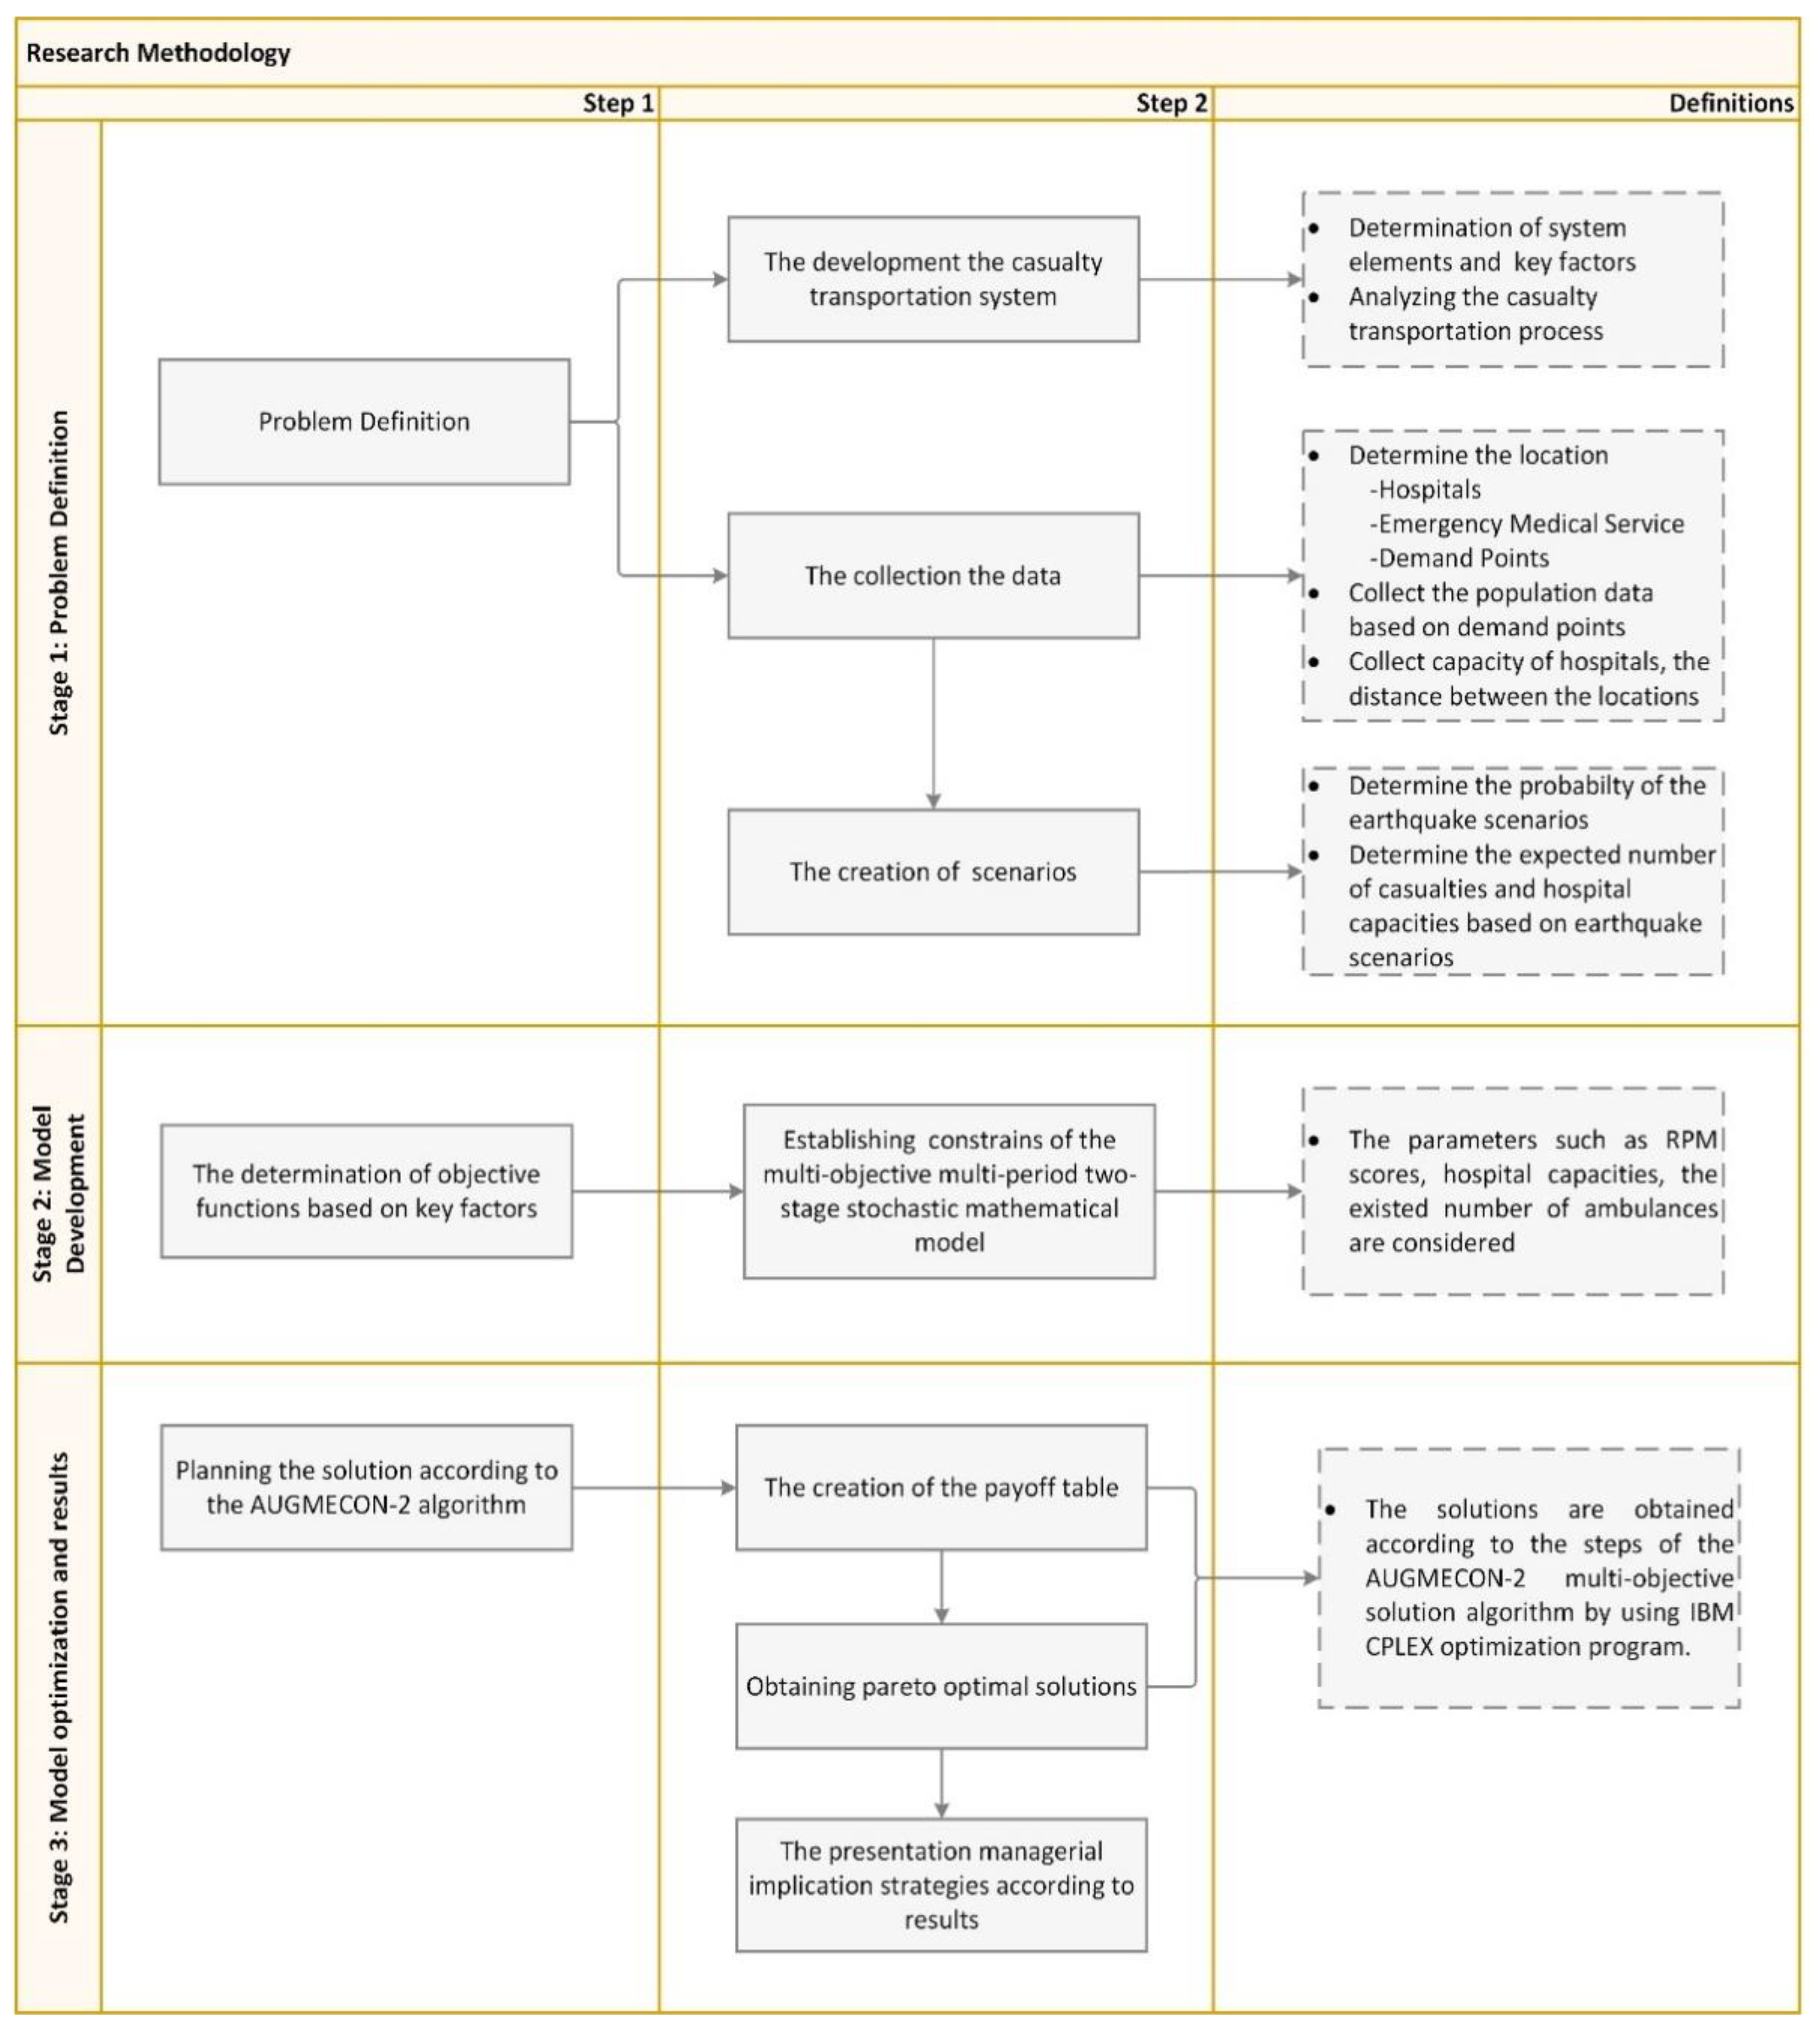
3. Methodology
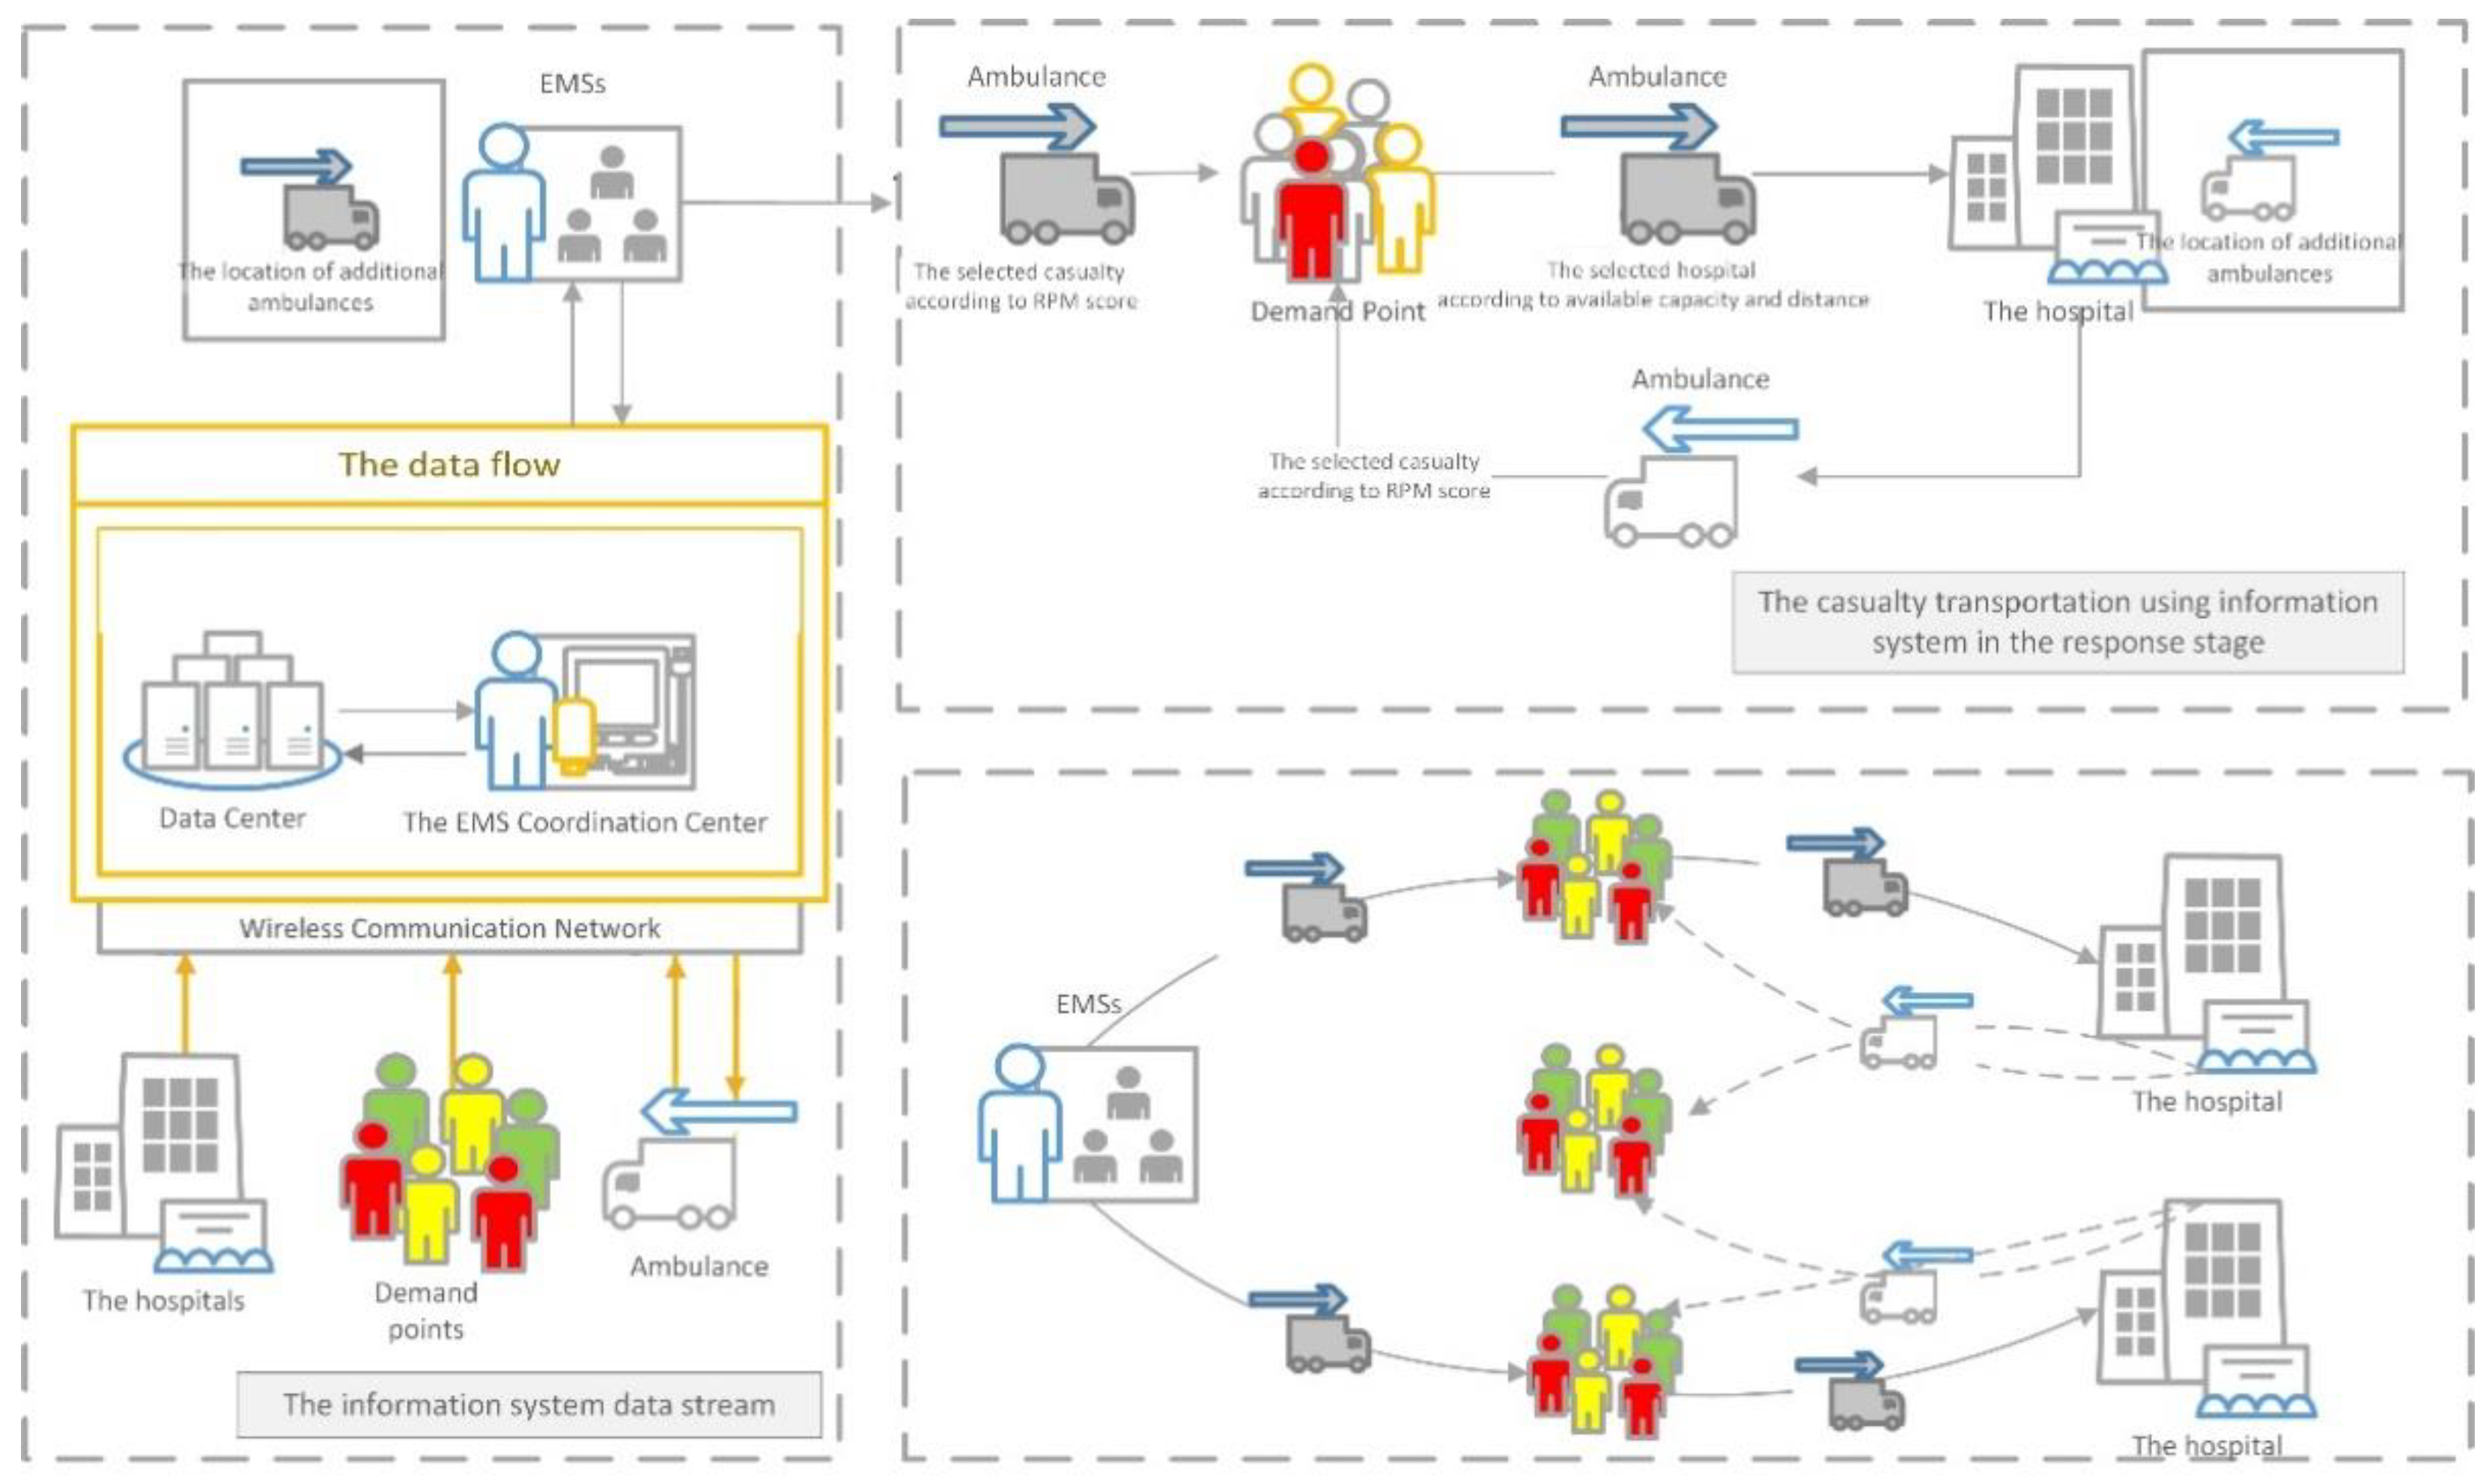
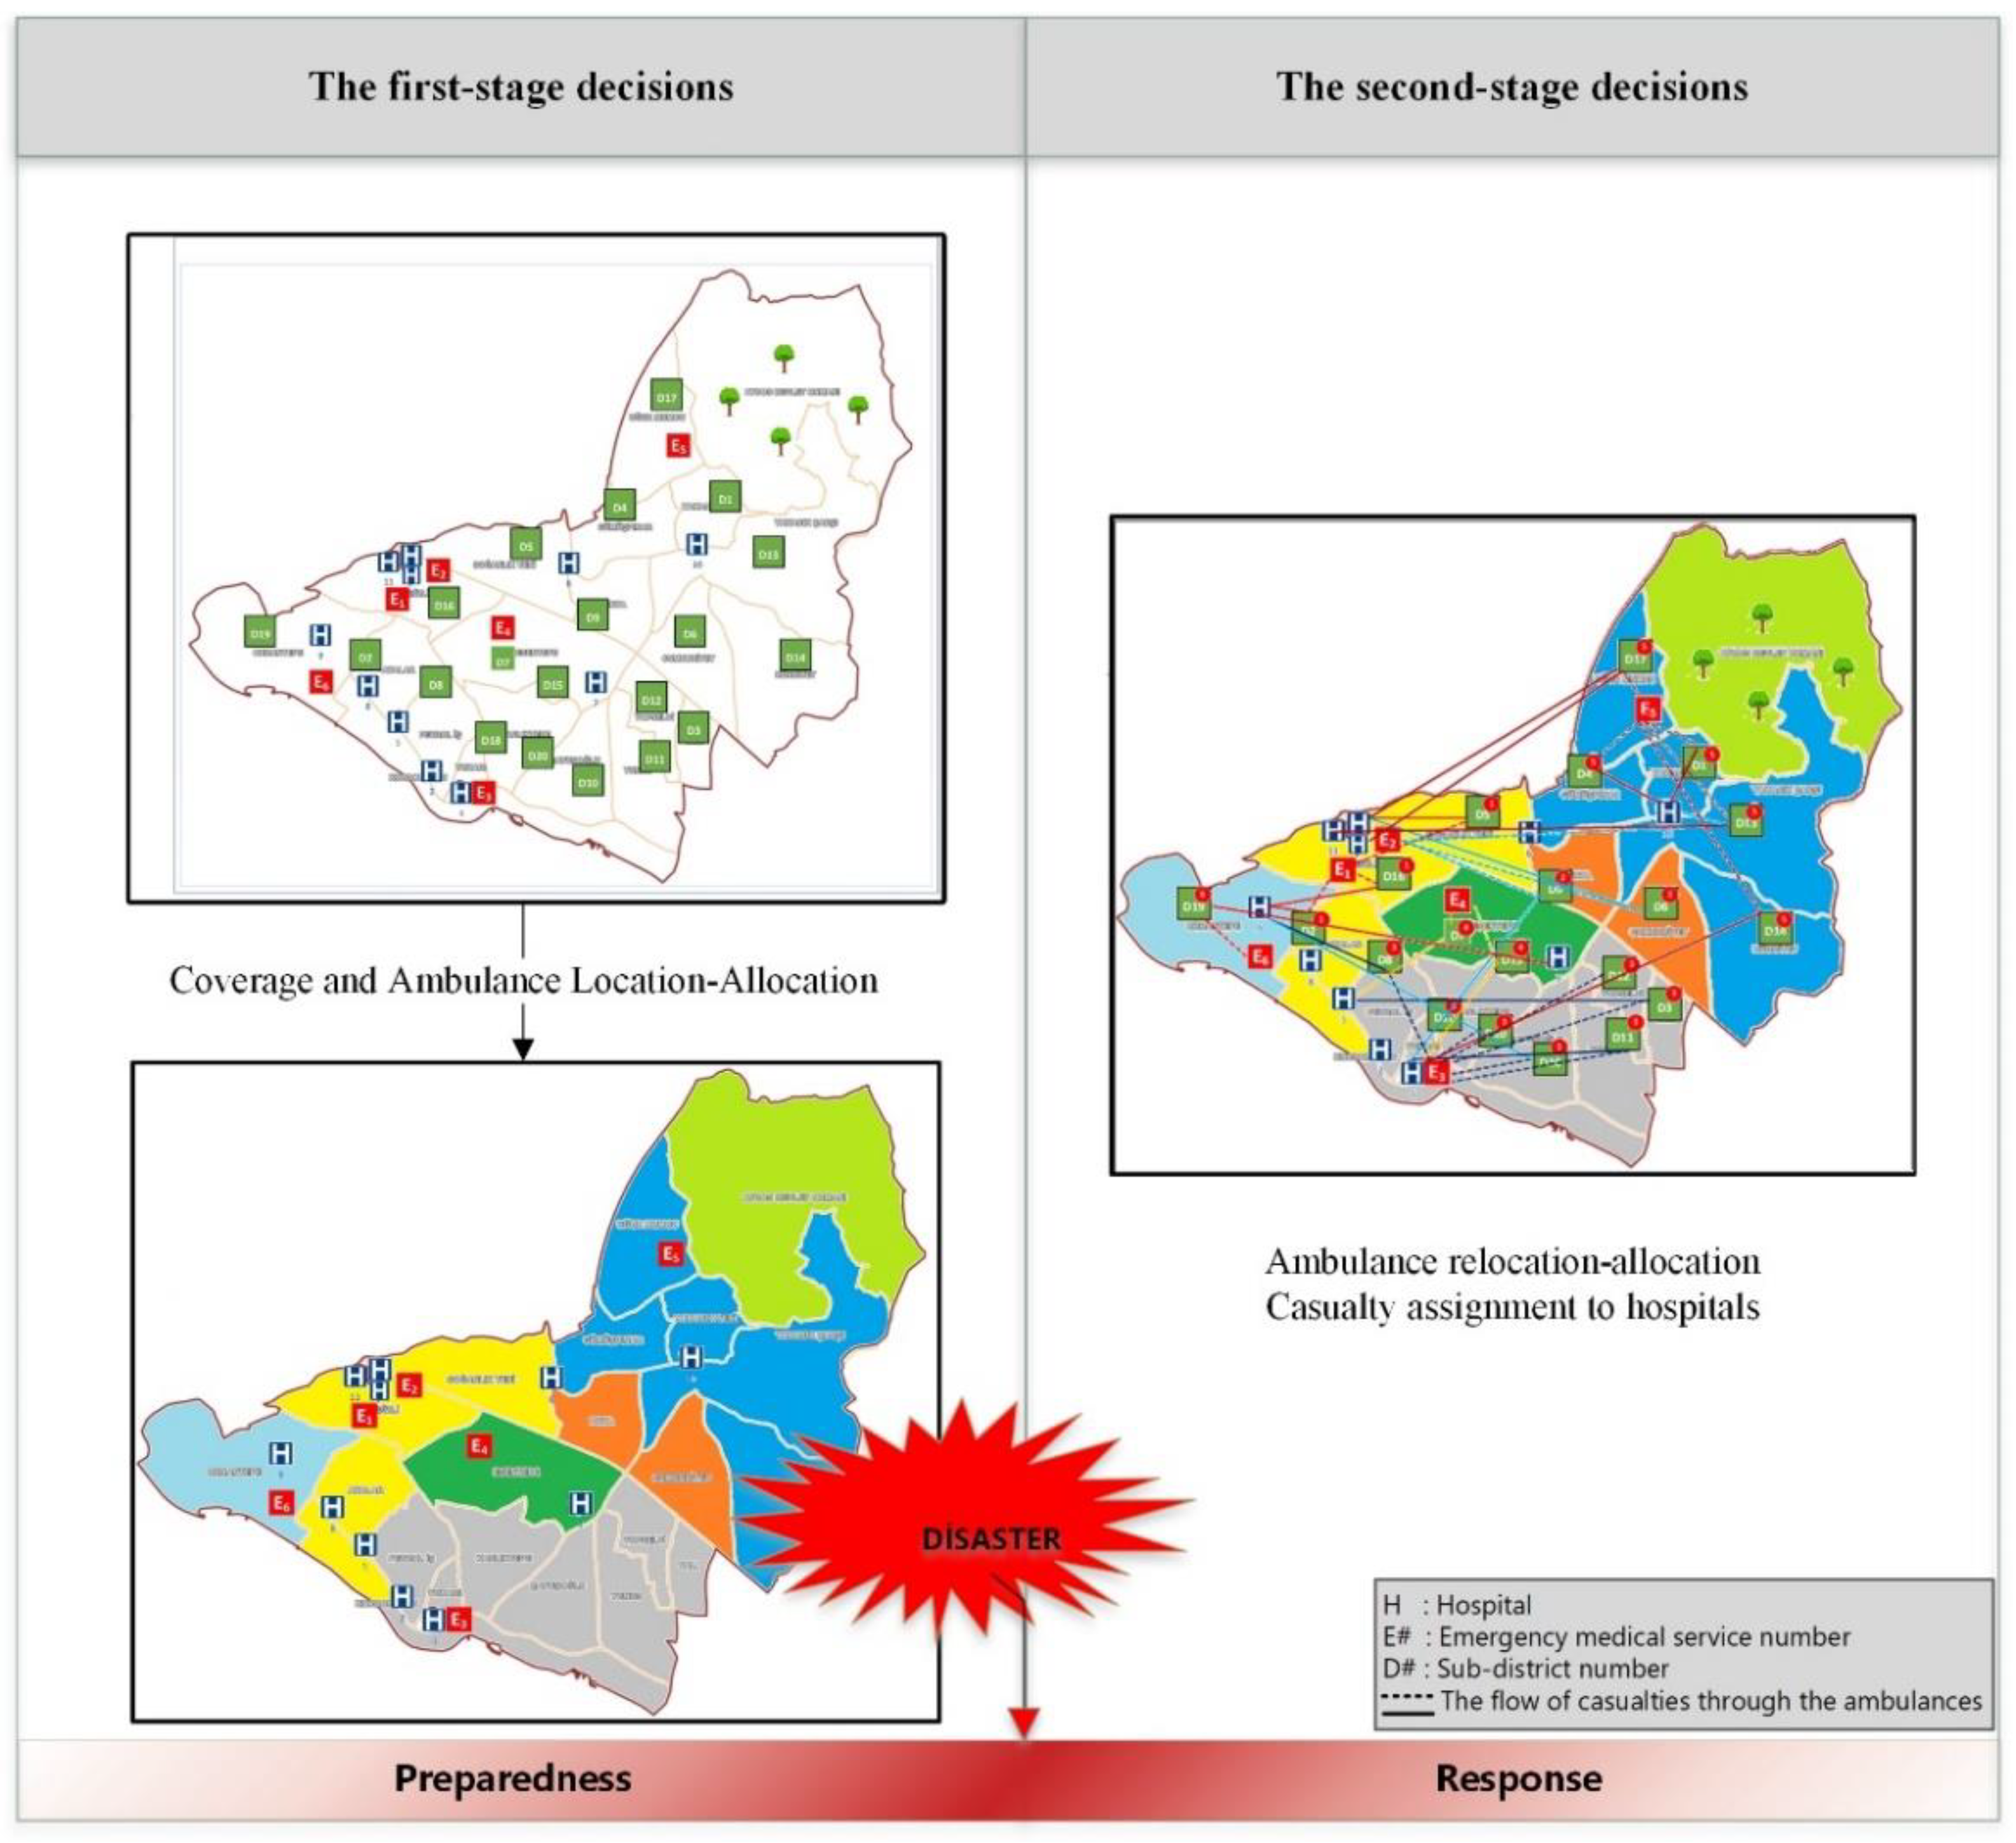
3.1. Problem Definition
3.2. A Multi-Objective Two-Stage Stochastic Programming Formulation
- In the first stage, the ambulances are assigned to the EMS according to the existing number of ambulances.
- Before the disaster, ambulances are only available at emergency stations.
- Ambulances may leave EMS, but casualties are not transported to the EMS, but to the hospitals.
- At the beginning of the first period, while emergency stations send ambulances only to the triage points assigned to the station, ambulances can serve to each point within the period and in the following periods.
- Additional ambulances can come in every period, and the arriving ambulance will serve in the next period.
- Ambulances can work throughout the periods.
- RPM scores of the patients do not change.
3.3. Solution Methodology
| Algorithm 1. | Definitions of algorithm steps |
| Create the payoff table | |
| Calculate ranges , | |
| Define = number of intervals | |
| Divide into intervals | |
| Initialize counter = 0 = 0; : the number of Pareto optimal solutions | |
| Do (Until reach to ) | |
| … | |
| Update and solve the Problem P for equations (37)-(41) | |
| If the solution is feasible then; | |
| , calculate , ; (/) | |
| If < then, | |
| repeat to | |
| else, | |
| then, | |
| If < then, | |
| repeat to | |
| else, | |
| then, | |
| If < then, | |
| repeat to | |
| else, | |
| End if | |
| End if | |
| End if | |
| End if | |
| The algorithm is completed, and the results obtained by creating the Pareto optimal solution table are evaluated. |
4. Computational Study
Case Study and Data Collection
5. Results and Discussion
- While making the coverage decisions, the population of the region, existing resources and the expected rare events must be considered. Besides, making multi objectives decisions for disaster relief will make planning more effective.
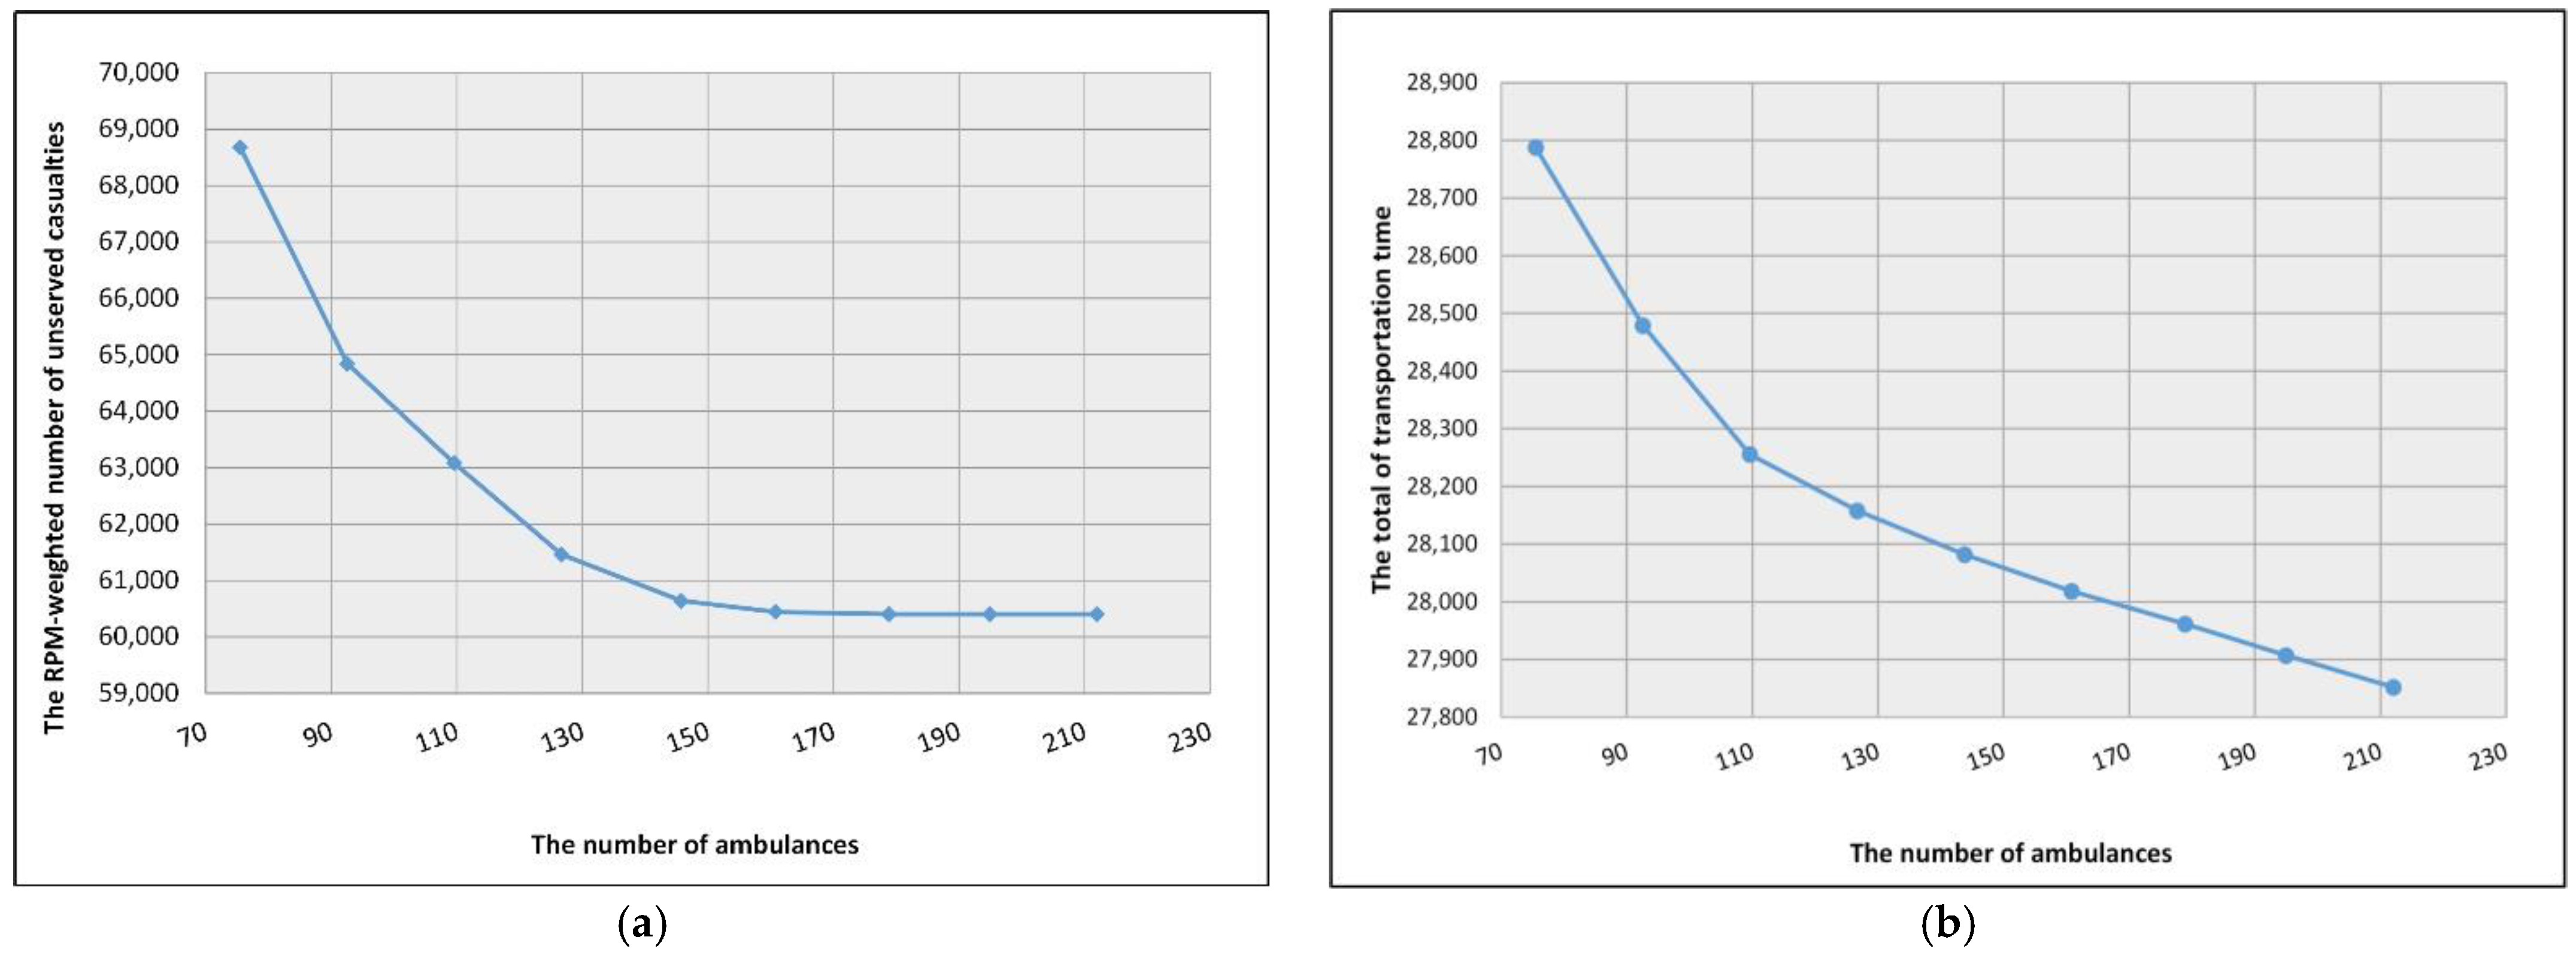
- It is necessary to plan ambulance allocation based on scenarios for disaster relief. Adding ambulances can decrease the number of unserved casualties by considering RPM scores. Because of the hospital capacities, the increasing number of ambulances cannot significantly decrease the value of the T1 and T2 casualties transported to the hospitals after a certain level.
- If the severity of the disaster is great, hospital capacities will be insufficient even in the first critical hours. A centralized transportation system will play a major role in case detection so that emergency cases can be handled with priority. The prior arrival of the most urgent cases to the hospitals prevents the usage and exhaustion of the hospital capacities by the relatively less urgent cases.
- In order to reduce the RPM-weighted number of unserved casualties, ambulances must be dispatched according to the obtained real-time data from the information/decision support system. Choosing only the nearest distances prevents both the transportation of urgent casualties and the damages the equity in service provided to the demand points.
- If the optimistic scenario occurs, all T1 and T2 group casualties can be transported to the hospitals with the number of correctly planned ambulances. However, more ambulance services and medical care points will be needed in other scenarios, especially after the second period.
- In the study, it was observed that the ambulance assignment, according to only the nearest locations, had a negative effect on the number of unserved casualties. If the dispatching strategy is developed according to the RPM of the casualties, the transportation time will increase; however, the number of transported casualties will increase. However, the number of transported casualties will be more.
6. Conclusions and Future Research
Author Contributions
Funding
Conflicts of Interest
Appendix A

| The Experiment Number | The Experiment Number | ||||||
|---|---|---|---|---|---|---|---|
| #1 | 77,792.98 | 75.49 | 31,947.17 | #20 | 60,403.07 | 177.86 | 60,602.37 |
| #2 | 63,778.53 | 109.54 | 44,229.66 | #21 | 68,471.09 | 194.93 | 31,946.71 |
| #3 | 63,763.61 | 109.48 | 52,423.86 | #22 | 64,658.91 | 194.86 | 36,032.81 |
| #4 | 69,199.93 | 126.62 | 31,947.08 | #23 | 62,154.57 | 194.90 | 40,137.83 |
| #5 | 65,225.87 | 126.68 | 36,041.47 | #24 | 60,915.48 | 194.92 | 44,231.90 |
| #6 | 68,761.43 | 143.75 | 31,947.17 | #25 | 60,409.34 | 194.92 | 48,327.80 |
| #7 | 60,642.11 | 143.75 | 52,424.20 | #26 | 60,401.57 | 183.60 | 52,420.97 |
| #8 | 60,642.00 | 143.73 | 60,614.98 | #27 | 60,402.71 | 194.87 | 56,519.15 |
| #9 | 68,532.64 | 160.79 | 31,946.00 | #28 | 60,401.57 | 194.92 | 60,610.92 |
| #10 | 64,648.71 | 160.73 | 36,042.06 | #29 | 79,871.20 | 212.00 | 27,851.75 |
| #11 | 62,353.25 | 160.80 | 40,137.88 | #30 | 68,348.07 | 212.00 | 31,941.25 |
| #12 | 61,030.86 | 160.80 | 44,232.76 | #31 | 64,550.41 | 212.00 | 36,039.83 |
| #13 | 68,375.21 | 177.84 | 31,947.12 | #32 | 62,069.27 | 212.00 | 40,136.89 |
| #14 | 64,493.62 | 177.85 | 36,042.49 | #33 | 60,875.88 | 212.00 | 44,232.77 |
| #15 | 62,250.23 | 177.74 | 40,137.26 | #34 | 60,407.61 | 212.00 | 48,325.51 |
| #16 | 60,969.67 | 177.81 | 44,232.74 | #35 | 60,402.65 | 212.00 | 52,423.90 |
| #17 | 60,582,86 | 177.87 | 48,328.79 | #36 | 60,401.57 | 212.00 | 56,519.20 |
| #18 | 60,413.51 | 177.83 | 52,420.47 | #37 | 60,401.57 | 212.00 | 60,610.15 |
| #19 | 60,419.43 | 177.78 | 56,517.04 |
References
- Oksuz, M.K.; Satoglu, S.I. A Two-Stage Stochastic Model for Location Planning of Temporary Medical Centers for Disaster Response. Int. J. Disaster Risk Reduct. 2020, 44, 101426. [Google Scholar] [CrossRef]
- Lettieri, E.; Masella, C.; Radaelli, G. Disaster Management: Findings from a Systematic Review. Disaster Prev. Manag. 2009, 18, 117–136. [Google Scholar] [CrossRef]
- Caunhye, A.M.; Nie, X.; Pokharel, S. Optimization Models in Emergency Logistics: A Literature Review. Socio-Econ. Plan. Sci. 2012, 46, 4–13. [Google Scholar] [CrossRef]
- Rawls, C.G.; Turnquist, M.A. Pre-Positioning and Dynamic Delivery Planning for Short-Term Response Following a Natural Disaster. Socio-Econ. Plan. Sci. 2012, 46, 46–54. [Google Scholar] [CrossRef]
- Flores, I.; Ortuño, M.T.; Tirado, G.; Vitoriano, B. Supported Evacuation for Disaster Relief through Lexicographic Goal Programming. Mathematics 2020, 8, 648. [Google Scholar] [CrossRef]
- Monzón, J.; Liberatore, F.; Vitoriano, B. A Mathematical Pre-Disaster Model with Uncertainty and Multiple Criteria for Facility Location and Network Fortification. Mathematics 2020, 8, 529. [Google Scholar] [CrossRef]
- Safeer, M.; Anbuudayasankar, S.P.; Balkumar, K.; Ganesh, K. Analyzing Transportation and Distribution in Emergency Humanitarian Logistics. Procedia Eng. 2014, 97, 2248–2258. [Google Scholar] [CrossRef]
- Jin, S.; Jeong, S.; Kim, J.; Kim, K. A Logistics Model for the Transport of Disaster Victims with Various Injuries and Survival Probabilities. Ann. Oper. Res. 2015, 230, 17–33. [Google Scholar] [CrossRef]
- Bozorgi-Amiri, A.; Jabalameli, M.S.; Al-e-Hashem, S.M.J.M. A Multi-Objective Robust Stochastic Programming Model for Disaster Relief Logistics under Uncertainty. OR Spectr. 2013, 35, 905–933. [Google Scholar] [CrossRef]
- Tlili, T.; Abidi, S.; Krichen, S. A Mathematical Model for Efficient Emergency Transportation in a Disaster Situation. Am. J. Emerg. Med. 2018, 36, 1585–1590. [Google Scholar] [CrossRef] [PubMed]
- Talarico, L.; Meisel, F.; Sörensen, K. Ambulance Routing for Disaster Response with Patient Groups. Comput. Oper. Res. 2015, 56, 120–133. [Google Scholar] [CrossRef]
- Jotshi, A.; Gong, Q.; Batta, R. Dispatching and Routing of Emergency Vehicles in Disaster Mitigation Using Data Fusion. Socio-Econ. Plan. Sci. 2009, 43, 1–24. [Google Scholar] [CrossRef]
- Altay, N.; Labonte, M. Challenges in Humanitarian Information Management and Exchange: Evidence from Haiti. Disasters 2014, 38, S50–S72. [Google Scholar] [CrossRef]
- Wamba, S.F.; Akter, S.; Edwards, A.; Chopin, G.; Gnanzou, D. How ‘Big Data’ Can Make Big Impact: Findings from a Systematic Review and a Longitudinal Case Study. Int. J. Prod. Econ. 2015, 165, 234–246. [Google Scholar] [CrossRef]
- Bharosa, N.; Lee, J.; Janssen, M. Challenges and Obstacles in Sharing and Coordinating Information during Multi-Agency Disaster Response: Propositions from Field Exercises. Inf. Syst. Front. 2010, 12, 49–65. [Google Scholar] [CrossRef]
- Bélanger, V.; Ruiz, A.; Soriano, P. Recent Optimization Models and Trends in Location, Relocation, and Dispatching of Emergency Medical Vehicles. Eur. J. Oper. Res. 2019, 272, 1–23. [Google Scholar] [CrossRef]
- Zhou, L.; Wang, S.; Xu, Z. A Multi-Factor Spatial Optimization Approach for Emergency Medical Facilities in Beijing. ISPRS Int. J. Geo-Inf. 2020, 9, 361. [Google Scholar] [CrossRef]
- Brotcorne, L.; Laporte, G.; Semet, F. Ambulance Location and Relocation Models. Eur. J. Oper. Res. 2003, 147, 451–463. [Google Scholar] [CrossRef]
- Andersson, T.; Värbrand, P. Decision Support Tools for Ambulance Dispatch and Relocation. J. Oper. Res. Soc. 2007, 58, 195–201. [Google Scholar] [CrossRef]
- Yuangyai, C.; Nilsang, S.; Cheng, C.-Y. Robust Ambulance Base Allocation Strategy with Social Media and Traffic Congestion Information. J. Ambient Intell. Hum. Comput. 2020, 1–14. [Google Scholar] [CrossRef]
- Gendreau, M.; Laporte, G.; Semet, F. A Dynamic Model and Parallel Tabu Search Heuristic for Real-Time Ambulance Relocation. Parallel Comput. 2001, 27, 1641–1653. [Google Scholar] [CrossRef]
- Gong, Q.; Batta, R. Allocation and Reallocation of Ambulances to Casualty Clusters in a Disaster Relief Operation. IIE Trans. 2007, 39, 27–39. [Google Scholar] [CrossRef]
- Knight, V.A.; Harper, P.R.; Smith, L. Ambulance Allocation for Maximal Survival with Heterogeneous Outcome Measures. Omega 2012, 40, 918–926. [Google Scholar] [CrossRef]
- Salman, F.S.; Gül, S. Deployment of Field Hospitals in Mass Casualty Incidents. Comput. Ind. Eng. 2014, 74, 37–51. [Google Scholar] [CrossRef]
- Na, H.S.; Banerjee, A. A Disaster Evacuation Network Model for Transporting Multiple Priority Evacuees. IIE Trans. 2015, 47, 1287–1299. [Google Scholar] [CrossRef]
- Zhang, Z.; Liu, M.; Lim, A. A Memetic Algorithm for the Patient Transportation Problem. Omega 2015, 54, 60–71. [Google Scholar] [CrossRef]
- Schneeberger, K.; Doerner, K.F.; Kurz, A.; Schilde, M. Ambulance Location and Relocation Models in a Crisis. Cent. Eur. J. Oper. Res. 2016, 24, 1–27. [Google Scholar] [CrossRef]
- Fancello, G.; Mancini, S.; Pani, C.; Fadda, P. An Emergency Vehicles Allocation Model for Major Industrial Disasters. Transp. Res. Procedia 2017, 25, 1164–1179. [Google Scholar] [CrossRef]
- Dean, M.D.; Nair, S.K. Mass-Casualty Triage: Distribution of Victims to Multiple Hospitals Using the SAVE Model. Eur. J. Oper. Res. 2014, 238, 363–373. [Google Scholar] [CrossRef]
- Jacobson, E.U.; Argon, N.T.; Ziya, S. Priority Assignment in Emergency Response. Oper. Res. 2012, 60, 813–832. [Google Scholar] [CrossRef]
- Paul, J.A.; Batta, R. Improving Hurricane Disaster Preparedness: Models for Optimal Reallocation of Hospital Capacity. Int. J. Oper. Res. 2011, 10, 194–213. [Google Scholar] [CrossRef]
- Mills, A.F.; Argon, N.T.; Ziya, S. Dynamic Distribution of Patients to Medical Facilities in the Aftermath of a Disaster. Oper. Res. 2018, 66, 716–732. [Google Scholar] [CrossRef]
- Shin, K.; Lee, T. Emergency Medical Service Resource Allocation in a Mass Casualty Incident by Integrating Patient Prioritization and Hospital Selection Problems. IISE Trans. 2020, 52, 1141–1155. [Google Scholar] [CrossRef]
- Farahani, R.Z.; Lotfi, M.M.; Baghaian, A.; Ruiz, R.; Rezapour, S. Mass casualty management in disaster scene: A systematic review of OR&MS research in humanitarian operations. Eur. J. Oper. Res. 2020, 287, 787–819. [Google Scholar] [CrossRef]
- Sacco, W.J.; Navin, D.M.; Fiedler, K.E.; Ii, R.K.W.; Long, W.B.; Buckman, R.F. Precise Formulation and Evidence-Based Application of Resource-Constrained Triage. Acad. Emerg. Med. 2005, 12, 759–770. [Google Scholar] [CrossRef]
- Mavrotas, G.; Florios, K. An Improved Version of the Augmented ε-Constraint Method (AUGMECON2) for Finding the Exact Pareto Set in Multi-Objective Integer Programming Problems. Appl. Math. Comput. 2013, 219, 9652–9669. [Google Scholar] [CrossRef]
- Mavrotas, G. Effective Implementation of the ε-Constraint Method in Multi-Objective Mathematical Programming Problems. Appl. Math. Comput. 2009, 213, 455–465. [Google Scholar] [CrossRef]
- The Population Data, The Turkish Statistical Institute. Available online: https://biruni.tuik.gov.tr/medas/?kn=95&locale=tr. (accessed on 16 December 2020).
- JICA. The Study on A Disaster Prevention/Mitigation Basic Plan in Istanbul Including Seismic Microzonation in the Republic of Turkey; Volume II; Final Report; Japan International Cooperation Agency: Tokyo, Japan, 2002. [Google Scholar]
- İstanbul İli Olası Deprem Kayıp Tahminlerinin Güncellenmesi Projesi | Deprem ve Zemin İnceleme Müdürlüğü. Available online: https://depremzemin.ibb.istanbul/calismalarimiz/tamamlanmis-calismalar/istanbul-ili-olasi-deprem-kayip-tahminlerinin-guncellenmesi-projesi/ (accessed on 16 December 2020).
- Kalemoglu, M. Emergency Department Management in Bombing and Blast Incidents. Internet J. Rescue Disaster Med. 2004, 5, 1. [Google Scholar]
- Ball, M.O.; Lin, F.L. A Reliability Model Applied to Emergency Service Vehicle Location. Oper. Res. 1993, 41, 18–36. [Google Scholar] [CrossRef]
- McCord, G.C.; Liu, A.; Singh, P. Deployment of Community Health Workers across Rural Sub-Saharan Africa: Financial Considerations and Operational Assumptions. Bull. World Health Organ. 2012, 91, 244–253B. [Google Scholar] [CrossRef]


| Scenario | Occurrence Probability of Scenarios | Magnitude of Earthquake | Proportion of Expected Type-T1 Casualty (%) | Proportion of Expected Type-T2 Casualty (%) | Proportion of Expected Type-T3 Casualty (%) | Expected Damage of Road | Expected Damage of Hospital |
|---|---|---|---|---|---|---|---|
| Scenario 1 | 0.06 | 7.7 | 2 | 2.7 | 3.3 | 65% | 35% |
| Scenario 2 | 0.08 | 7.7 | 1.8 | 2.4 | 3 | 62% | 33% |
| Scenario 3 | 0.09 | 7.7 | 1.7 | 2.3 | 2.8 | 60% | 32% |
| Scenario 4 | 0.1 | 7.7 | 1.5 | 2 | 2.5 | 60% | 30% |
| Scenario 5 | 0.16 | 7.5 | 1.3 | 1.7 | 2.2 | 55% | 27% |
| Scenario 6 | 0.11 | 7.4 | 1.1 | 1.4 | 1.9 | 45% | 25% |
| Scenario 7 | 0.1 | 6.9 | 0.9 | 1.1 | 1.6 | 30% | 7% |
| Scenario 8 | 0.16 | 7.5 | 0.09 | 0.42 | 0.74 | 25% | 18% |
| Scenario 9 | 0.14 | 7.5 | 0.054 | 0.264 | 0.502 | 20% | 10% |
| The Minimized Objective Function | |||
|---|---|---|---|
| Min (The number of unserved casualties) | 60,401.57 | 212 | 60,615 |
| Min (The number of ambulances) | 85,069 | 75.49 | 28,873 |
| Min (The total time) | 91,342 | 212 | 27,851.78 |
| Emergency Medical Service Stations | Assigned Demand Points | Located Number of Ambulances |
|---|---|---|
| EMS-1 | D2-D5-D16 | 2 |
| EMS-2 | D15 | 1 |
| EMS-3 | D3-D8-D10-D11-D12-D18-D20 | 3 |
| EMS-4 | D7 | 1 |
| EMS-5 | D1-D4-D6-D9-D13-D14-D17 | 4 |
| EMS-6 | D19 | 1 |
| Scenario | Number of Unserved Casualties (RPM Score 1–4) | Number of Unserved Casualties (RPM Score 5–8) | Number of Unserved Casualties (RPM Score 9–12) | |||||||||
|---|---|---|---|---|---|---|---|---|---|---|---|---|
| t = 1 | t = 2 | t = 3 | % | t = 1 | t = 2 | t = 3 | % | t = 1 | t = 2 | t = 3 | % | |
| Scenario 1 | 0 | 1150 | 2766 | 20.8 | 1544 | 3812 | 5940 | 60.0 | 2352 | 5176 | 7836 | 81.6 |
| Scenario 2 | 0 | 873 | 2321 | 18.8 | 1260 | 3296 | 5220 | 57.7 | 2112 | 4648 | 7060 | 81.5 |
| Scenario 3 | 0 | 708 | 2064 | 17.4 | 1122 | 3038 | 4846 | 56.5 | 1992 | 4380 | 6644 | 81.7 |
| Scenario 4 | 0 | 557 | 1761 | 16.4 | 722 | 2418 | 4018 | 50.7 | 1764 | 3880 | 5880 | 81.6 |
| Scenario 5 | 0 | 140 | 1180 | 10.8 | 526 | 1966 | 3326 | 47.5 | 1560 | 3424 | 5184 | 83.1 |
| Scenario 6 | 0 | 0 | 884 | 8.5 | 247 | 1251 | 2375 | 37.4 | 1348 | 2952 | 4472 | 84.7 |
| Scenario 7 | 0 | 0 | 549 | 6.5 | 0 | 242 | 1126 | 16.1 | 904 | 2260 | 3532 | 79.0 |
| Scenario 8 | 0 | 0 | 0 | 0.0 | 0 | 0 | 0 | 0.0 | 0 | 0 | 54 | 1.8 |
| Scenario 9 | 0 | 0 | 0 | 0.0 | 0 | 0 | 0 | 0.0 | 0 | 0 | 0 | 0.0 |
| Scenario | To Minimize the Number of Unserved Casualties (According to 26th Solution) | |||
|---|---|---|---|---|
| t = 1 | t = 2 | t = 3 | Total | |
| Scenario 1 | 200 | 0 | 0 | 200 |
| Scenario 2 | 200 | 0 | 0 | 200 |
| Scenario 3 | 194 | 0 | 0 | 194 |
| Scenario 4 | 200 | 0 | 0 | 200 |
| Scenario 5 | 187 | 0 | 0 | 187 |
| Scenario 6 | 176 | 24 | 0 | 200 |
| Scenario 7 | 171 | 18 | 11 | 200 |
| Scenario 8 | 96 | 26 | 21 | 143 |
| Scenario 9 | 53 | 15 | 13 | 81 |
Publisher’s Note: MDPI stays neutral with regard to jurisdictional claims in published maps and institutional affiliations. |
© 2021 by the authors. Licensee MDPI, Basel, Switzerland. This article is an open access article distributed under the terms and conditions of the Creative Commons Attribution (CC BY) license (http://creativecommons.org/licenses/by/4.0/).
Share and Cite
Caglayan, N.; Satoglu, S.I. Multi-Objective Two-Stage Stochastic Programming Model for a Proposed Casualty Transportation System in Large-Scale Disasters: A Case Study. Mathematics 2021, 9, 316. https://doi.org/10.3390/math9040316
Caglayan N, Satoglu SI. Multi-Objective Two-Stage Stochastic Programming Model for a Proposed Casualty Transportation System in Large-Scale Disasters: A Case Study. Mathematics. 2021; 9(4):316. https://doi.org/10.3390/math9040316
Chicago/Turabian StyleCaglayan, Nadide, and Sule Itir Satoglu. 2021. "Multi-Objective Two-Stage Stochastic Programming Model for a Proposed Casualty Transportation System in Large-Scale Disasters: A Case Study" Mathematics 9, no. 4: 316. https://doi.org/10.3390/math9040316
APA StyleCaglayan, N., & Satoglu, S. I. (2021). Multi-Objective Two-Stage Stochastic Programming Model for a Proposed Casualty Transportation System in Large-Scale Disasters: A Case Study. Mathematics, 9(4), 316. https://doi.org/10.3390/math9040316