The concepts of health and disease are fundamental in medicine at all stages of its development. The WHO definition of health works well to differentiate between health and disease. However, the transition from one state to another is not instantaneous. Consequently the definition proposed by G. N. Kryzhanovsky [
1]—“health is the state ensuring optimal performance of body functions to the extent necessary for productive interaction with the environment”—seems to be the most promising to assess the state of the body under the influence of environmental factors. To achieve this state, specialized systems in the body analyze the changing situation inside and outside the body and adjust the latter to the optimal level of interaction with the environment. Thus, the state of health is primarily provided by the resource of functions spent for adaptation. There are practically no functional states of the whole organism, the sufficiency of which solely depends on only a single system. An important task is to determine the limits of resilience (i.e., ability of a system to perform its functions under the influence of variable external factors) [
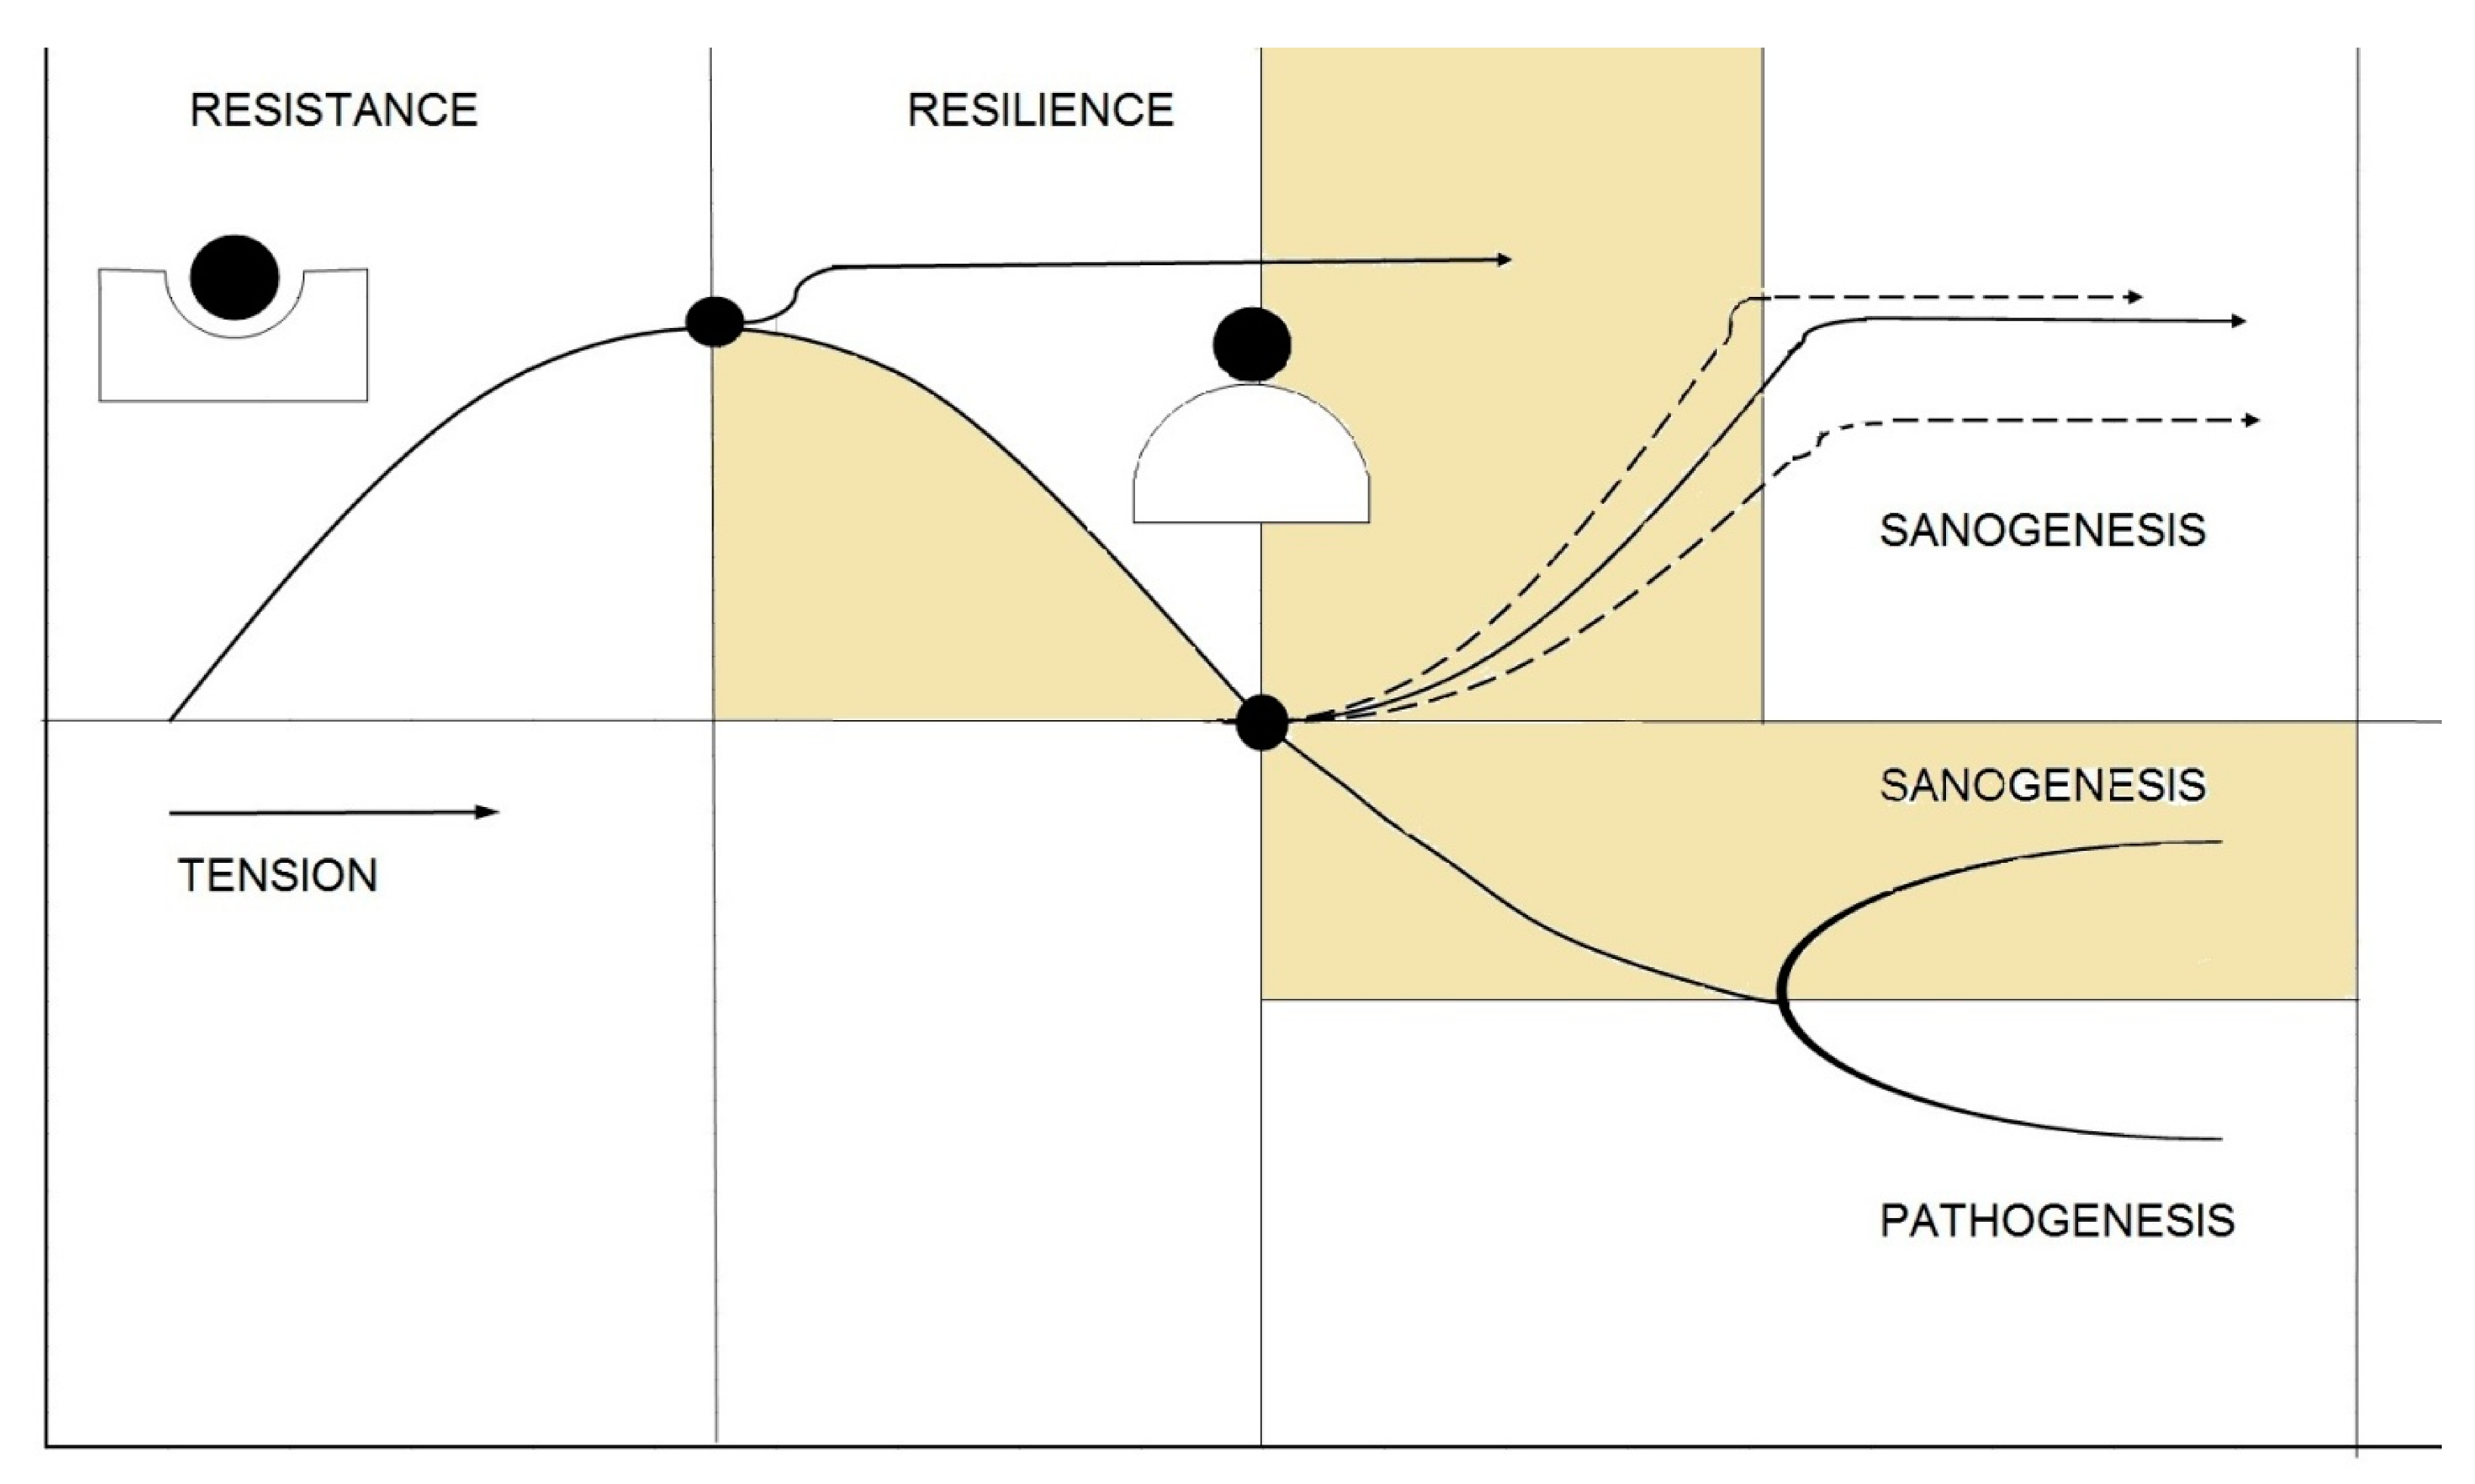
2]. This gave rise to the “tipping point” concept (i.e., a point corresponding to a transition of a self-maintaining system to a different state, just as slowly cooling water turns into ice) [
3]. Here, different stages of adaptation should be distinguished: before and after the tipping point (
Figure 1). The resistance mechanisms prevent the system from reaching the tipping point, while resilience mechanisms come into action after the system passed this critical point [
4,
5,
6].
In experimental studies, it is quite difficult to distinguish between the resistance and resilience stages due to activation of repair mechanisms in response to damage. For separate analysis of these phenomena, special conditions should be created. For instance, the resistance of mammalian genetic apparatus to cosmic radiation can be evaluated only in dried cells [
6]. The stability of DNA exposed to irradiation with fast heavy ions was also evaluated in dry specimens to exclude the influence of free radicals formed from water molecules [
7]. The resilience stage can be studied under more natural conditions—in living cells with preserved reparative mechanisms.
A relatively simple approach is evaluation of the radioadaptive response of human lymphocytes. It is known that human lymphocytes irradiated in a low dose become more resistant to higher doses of radiation or to other damaging factors. We have previously demonstrated that individuals with or without this response that indirectly characterizes reparative capacity of the body differ by functional parameters of the cardiorespiratory system under conditions of mild stress [
8]. This attests to either a genetically determined degree of organism’s resilience at different levels of its organization, or the presence of poorly studied mechanisms of interaction between the systems.
It should be noted that resilience is an interdisciplinary concept that attracts steadily growing interest [
2]. To describe abrupt changes in the dynamical systems, the theory of catastrophes (i.e., a program for predicting system instability) was developed [
9]. In this case, the catastrophe means loss of resilience, even if it does not lead to system death or destruction, but only causes transition to a different trajectory of its development. Dynamic systems are characterized by a number of features: current state of the system depends on the way how it came to it; the system maintains its state as long as possible (the principle of maximum delay); trajectories of the system can be irreversible. Physiological systems are complex, that is, their properties are not confined to characteristics of their components and some new properties can emerge. Thus, fluctuations of individual elements and their combinations under the influence of gradual changes in conditions affecting these elements can lead to a qualitative change of the system in the point of bifurcation, where it switches from one to another more stable mode of functioning.
This brings us to the task of quantifying the proximity of the tipping point, which allows us to take measures to avoid transition or, on the contrary, to encourage it in case of initially unfavorable state of the system.
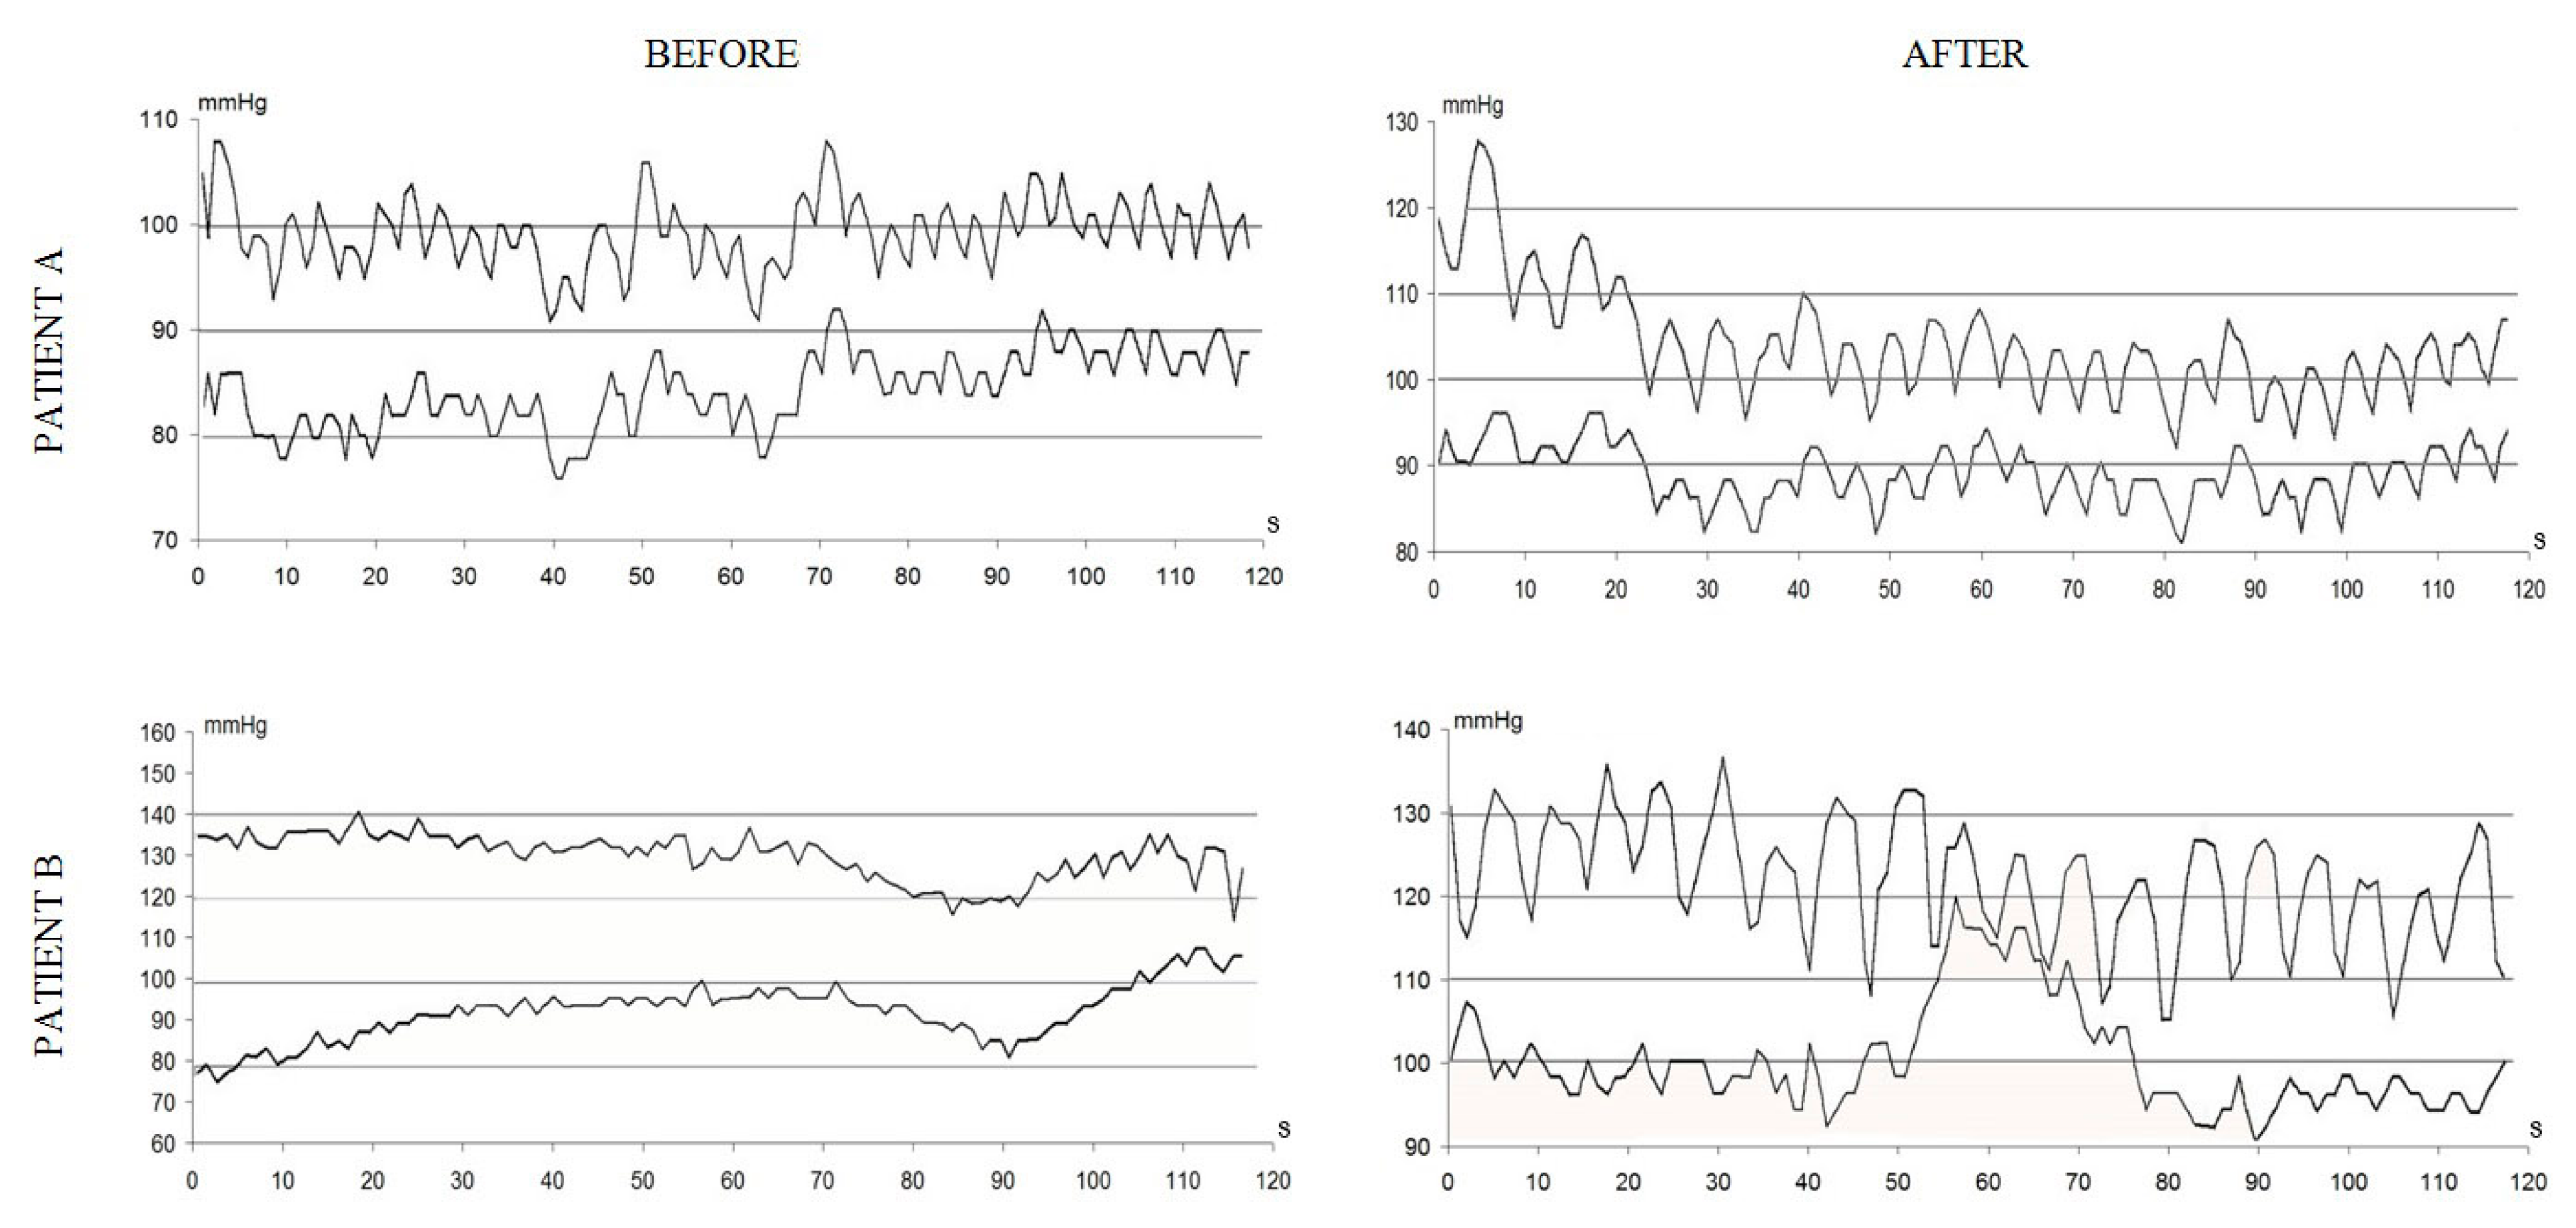
One of the early markers of approaching the tipping point is the critical slowing down phenomenon [
10,
11]. In physiology and medicine, functional tests are widely used for this studying of the adaptive capacities of the body. These tests are based on the use of “perturbing influences”, such as physical activity, changes in spatial body position, breath holding, administration of various substances, etc., while the analyzed parameters are recorded before (at rest), during, and after the test (which is most important in this case). Changes in the pattern of system fluctuations manifesting itself in an increase in temporal autocorrelation, describing the status of the system in successive time points and an increase in variance of its parameters, can be a warning signal of critical slowing down (
Figure 2).
Based on these indicators, so-called dynamic indicators of resilience (DIORs), an algorithm for assessing the risk of catastrophe for ecological systems has been proposed [
11]. In clinical practice, an anticipatory care system for patients approaching a tipping point stage has been successfully tested [
12]. To determine the risk groups in the population exposed to unfavorable anthropogenic influences, we have to identify groups demonstrating dramatically increased frequency of fixation of certain pathological processes. Biological aftereffects of the detected shifts can reflect either favorable (development of resistance) or unfavorable (fixation of certain pathologies) outcomes. In most cases, epidemiological approaches allow assessing the shifts caused by relatively high doses/concentrations of anthropogenic factors and are unapplicable for mild influences. The most probable pathological outcomes can be predicted by polysystemic monitoring that detects signs of dysregulation in various systems of the body (cardiorespiratory, psychomotor, and metabolism systems). The decrease in health reserve impairs adaptive capacities of the organism, which indicates the first (prenosological) stage of transition from health to disease, when functional parameters remain within the normal range, but at the expense of the strained work of the adaptation mechanisms aimed at the maintenance of health parameters at the required level.
The organism is a complex of interacting and mutually influencing systems and subsystems that form a network, the components of which depend on each other. Impaired resilience of some components can lead to strengthening of cross-correlation relationships with peaks in activity of other parts of the system [
13]. For collecting data array on the functional state of the main body systems (cardiorespiratory, psychomotor, and metabolic), a software-and-hardware complex suitable for mass surveys was developed. The correlations between the parameters of different systems revealed by the methods employed by us are not always obvious. The revealed correlation between the content of toxic metals and shifts in the subfractional composition of biological fluids seems to be quite reasonable [
14].
Due to individual variability of physiological balance processes, an anthropogenic factor of the same strength (dose, concentration, etc.) can induce shifts in some organisms sensitive to it, but not causes in others, while the thirds can become resistant to this factor.
At the population level, low-dose and low-concentration exposure leads to the formation of three subpopulations: sensitive, neutral, and super resistant. The proportions between these subpopulations reflect the population risk from this exposure.
The monitoring of physiological balance of the body is carried out using computerized measurement instrumentation and data processing systems. The following three major instruments adapted to non-invasive screening survey are used:
- −
A spiro-arterio-cardio-rhythmo graph with a highly sensitive ultrasonic transducer for continuous non-invasive recording of blood pressure, expiration and inspiration air flows, and electrocardiogram;
- −
A computer-aided device for express-evaluation of psychomotor activity during motor tests;
- −
A laser correlation spectrometer intended for identification of the pattern of regulation of metabolic and immune processes.
In physiological systems, around fifty parameters are recorded during screening studies and, for analysis of these systems, unified ranking methods for the recorded values should be developed [
15]. The need in this stage is dictated by the concept of dysregulation diagnosis based on discordance between the functions of individual systems, the parameters of which can be compared only if they are presented in universal units of deviation. The sizes of age subgroups are chosen with consideration of sample representativeness for providing proper 5th and 95th centiles and peculiarities of the age-related dynamics of the parameter [
16]. The centile table is corrected as the number of measurements increases. The parameters are ranked using the hypo-hyperfunction scale and the centile boundaries correspond to certain scores. The measured parameter is compared with the previously determined (reference) values for persons of different age/gender and then, its correspondence to a particular centile and, thereby, its score is determined. In the expert system, the scores k
0–k
5 take on the following values: −2.5, −1.5, −0.5, 0.5, 1.5, 2.5; all parameters will be scored in the range from −2.5 to 2.5.
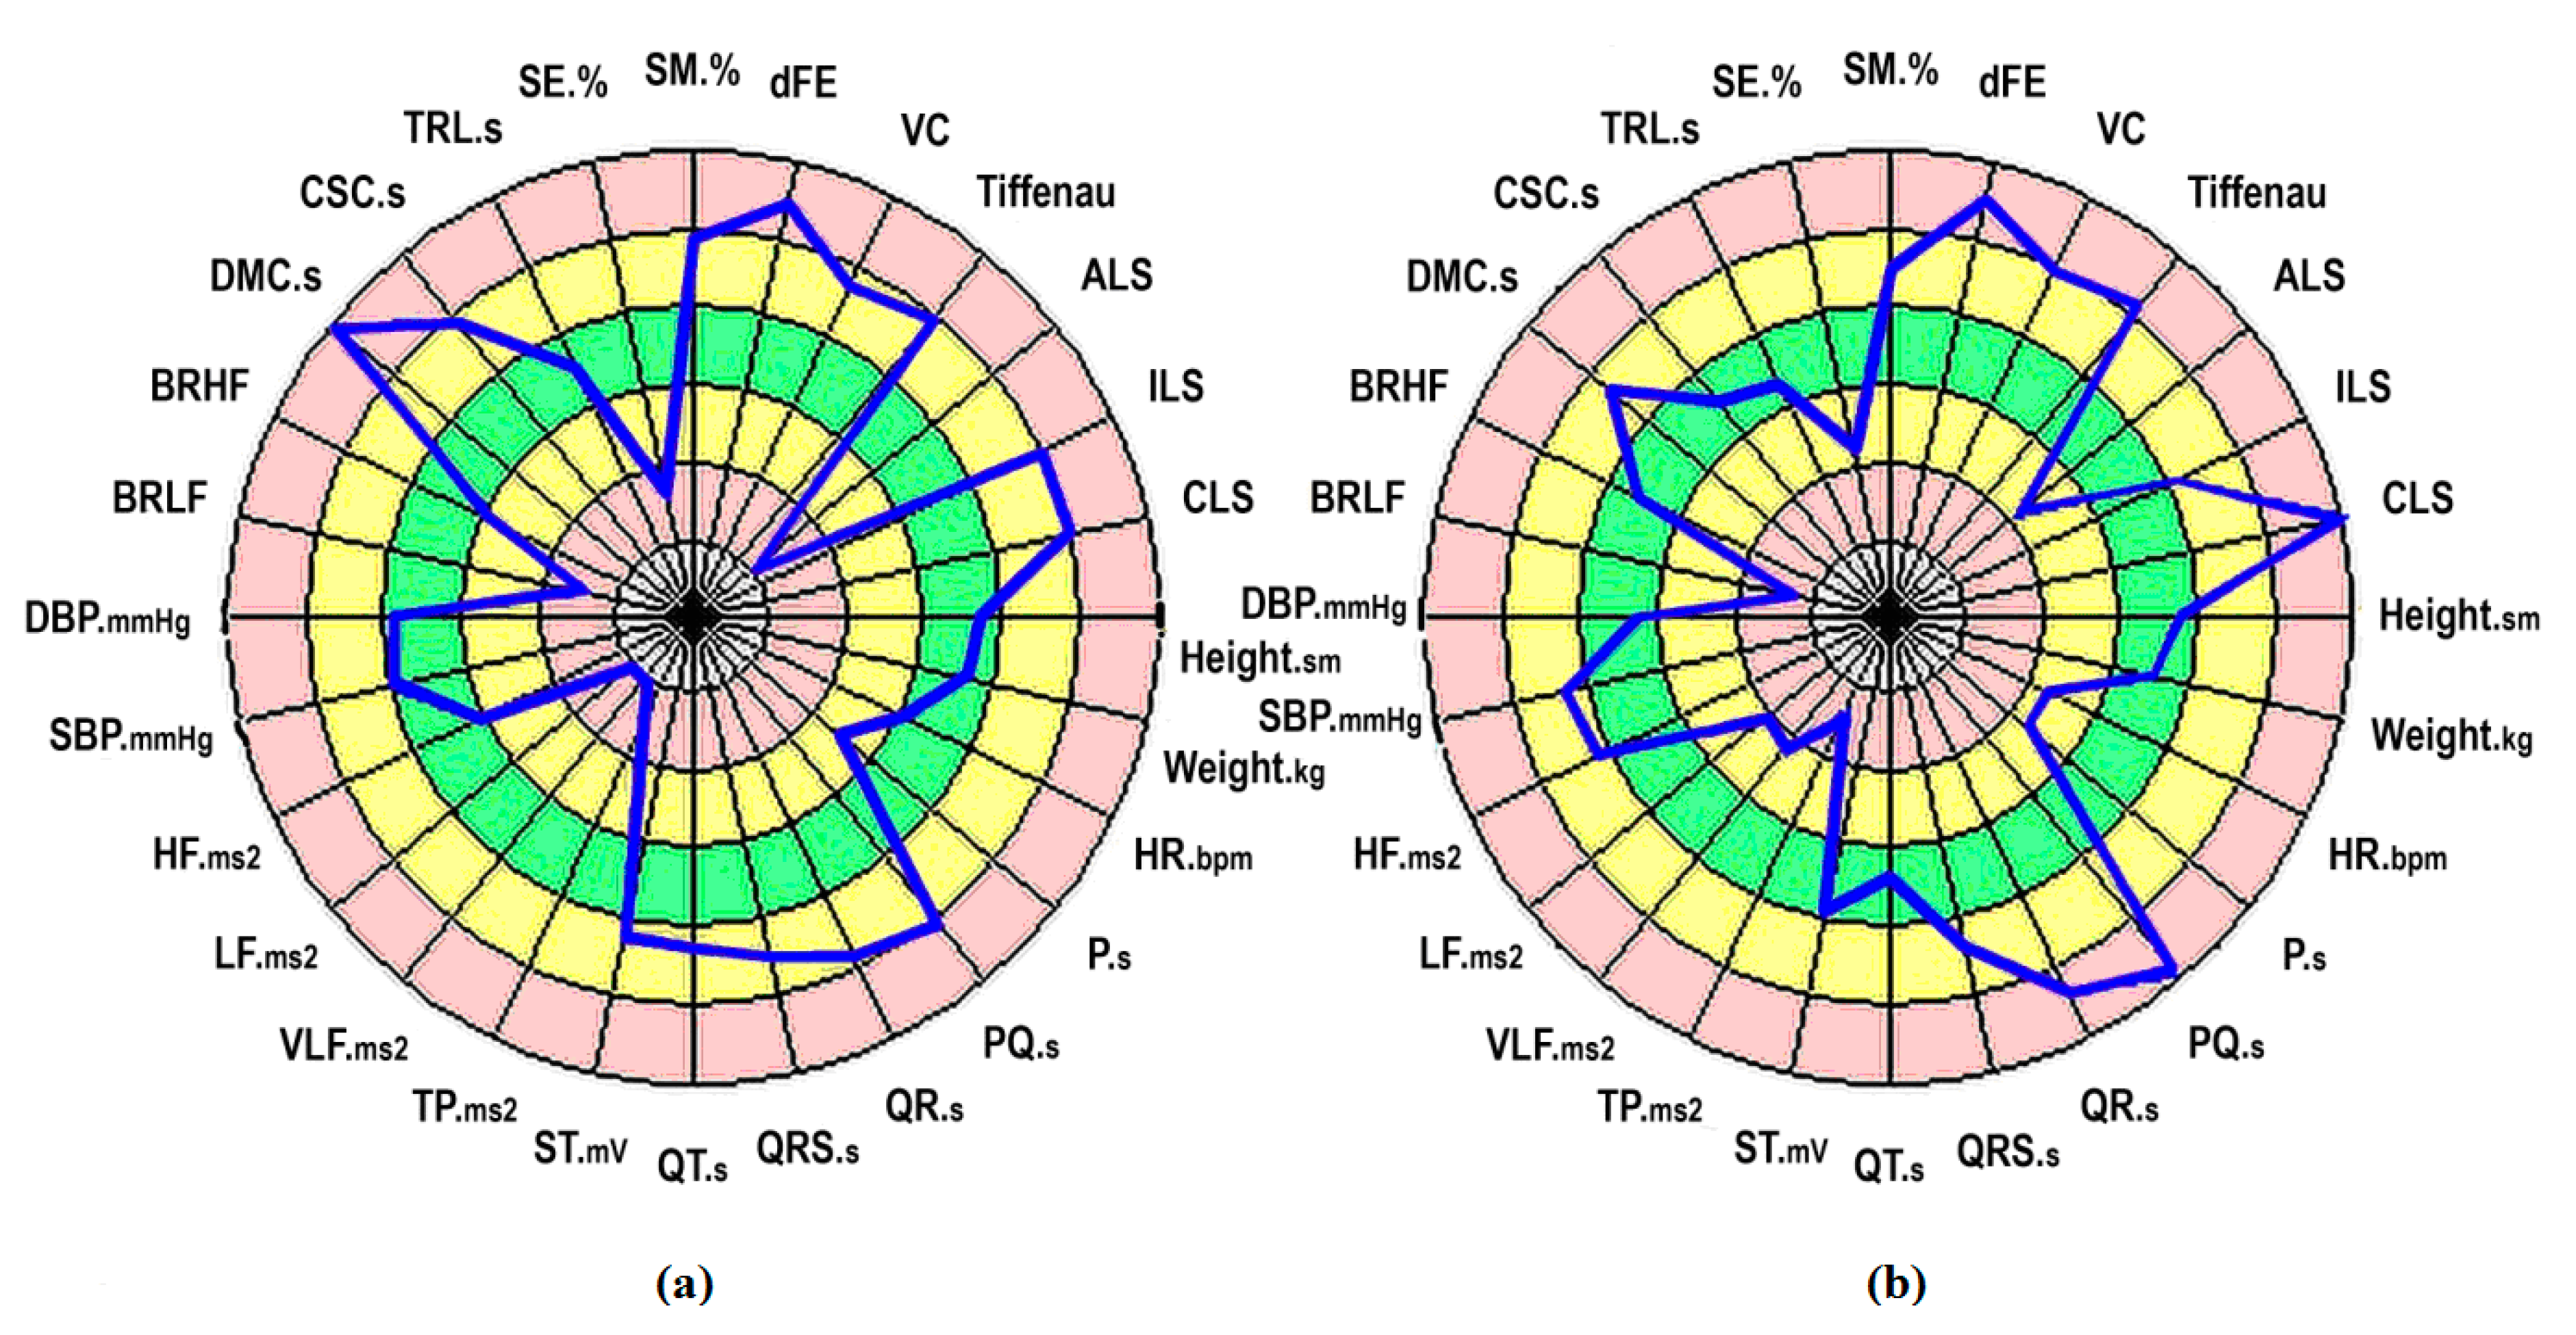
Thus, the scores calculated using the above-described method immediately show whether the recorded value of a certain parameter corresponds to the most common range of the same parameter in the population of the same age and gender or deviate towards the of area hypo- or hyperfunction (
Figure 3a).
For example, we examined 130 workers (76% men and 24% women) of a shipyard; 77% workers were at the age of 25–54 years; 52% had continuous service length from three to 15 years. By the degree of contact with potential hazard sources, the sample population was divided into three groups. Group 1 (n = 24) included storekeepers, cloakroom attendants, cleaners, engineers, and other technical workers, who had minimum contact with hazardous factors. Group 2 (n = 53) consisted of crane operators, painters, electricians, strapper, maintenance men, and vessel trolley-transporter men who indirectly contacted with hazardous factors. Group 3 (n = 53) comprised welders, burners, riveters, fitters, and other workers on the vessel hull who are directly exposed to hazardous factors.
This necessitates creation of an expert algorithm that takes into account the interaction between the parameters and their mutual influence under conditions of a weakly structured task. If this relationship is not taken into consideration, the deviations from the population mean in some cases can be erroneously interpreted as stress state of the studied physiological system, and vice versa, other parameters can be viewed as balanced, though they are not. A way of solving this problem during analysis of multivariate measurements in the absence of physiologically based equations of functional interrelationship is the use of multiple regression analysis that allows computing partial correlations. Analysis of interdependencies of these coupled processes is of particular importance when studying regulatory processes constantly inducing dynamic restructuring of physiological systems. To avoid errors in attribution of changed parameters of physiological systems to a particular centile, the most probable functional relationship between the parameters in conditionally healthy population should be deduced and mutual deviations of the parameters from the population mean should be computed; this will serve as the basis for constructing “dynamic individual norm”. Unfortunately, physiologically-based equations (especially multivariate equations) of functional interrelationship for most parameters of body systems are unknown, so they should be deduced using statistical methods. When interpreting interdependence, apparent correlation between two variables can be just a reflection of the fact that they are both correlated with some third variable or a set of variables not included in the model. The situation can be clarified by computation of partial correlations between the two variables, while other variables are removed (partial correlations). It should be emphasized that even in case of high partial correlation coefficients, the causality between the analyzed variables should always be based on knowledge of physiology, but not exclusively on statistical relationships.
Considering the above, the algorithm for calculation of the balance between the parameters of the body systems includes the following steps:
Calculation of the matrix of partial correlations for scores of all parameters and for the entire population;
Selection of pairs of parameters with significant partial correlations;
Expert evaluation of significant correlations for their physiological feasibility and construction of a subgroup with physiologically based correlations;
Calculation of the matrix of multiple linear regression coefficients;
Calculation of the scores of “dynamic individual norm” indicators based on the scores of measured parameters.
The above calculations yield a vector that contains the scores
for each measured parameter obtained with considerations for the individual characteristics of the body; the score k
2 ≤
≤ k3 indicates that body condition by this parameter is satisfactory and correspond to the most common values for the conditionally healthy population, while at
and
it corresponds to the initial stress, and at
and
—to pre-pathological and, possibly, pathological stress (
Figure 3b). It should be taken into account that the same value of the studied parameter can be normal for one individual and a pathological symptom for another.
Functional sufficiency for each system was scored using a three-point scale, where 1 corresponded to balanced, 2 to sufficient, and 3 to strained state of the system. In a population not burdened by verified pathologies and intoxications, the proportion between these groups is 50%—40%—10% [
15].
The integral functional balance was determined by the summary score for seven regulatory systems (each evaluated using a three-point scale):
The integral value of functional strain (38%) attests to a high burden of the studied population. The decisive contribution of the psychomotor regulation system is worthy of note: this system worked in a strained mode in 75% workers. In groups 1, 2, and 3, the functional state of the psychomotor regulation was interpreted as strained in 42%, 70%, and 96% cases, respectively. Taking into account occupational specific of these groups, we can assume that working conditions in group 3 promote aggravation of functional strain in the psychomotor system.
The use of the described algorithm made it possible to identify risk groups in mass surveys of employees exposed to potentially dangerous climate, geographical and occupational factors and to determine the degree of proximity to the tipping points for body systems in participants of an Arctic expedition [
17].
An example of an effective application of this approach is described previously [
12]. The development of methods for predicting catastrophic changes at the cellular level is in progress [
18,
19]. This trend seems to be very promising, because it allows identifying the patterns of interaction between the systems. This, in turn, makes it possible to use empirical data on the interaction between body systems during modeling and prediction of physiological balance level. Monitoring of the main body systems by using functional tests and applying the developed algorithms for detection of approaching the tipping points, followed by correction of the detected deviations, will lead to an increase in the duration of active life.


