
A Mathematical Model for Early HBV and -HDV Kinetics during Anti-HDV Treatment

 ,
,  and
and 
Abstract
1. Introduction
2. Background
3. Materials and Methods
4. Results
5. Discussion and Conclusions
Supplementary Materials
Author Contributions
Funding
Institutional Review Board Statement
Informed Consent Statement
Data Availability Statement
Acknowledgments
Conflicts of Interest
References
- Noureddin, M.; Gish, R. Hepatitis delta: Epidemiology, diagnosis and management 36 years after discovery. Curr. Gastroenterol. Gastroenterol. Rep. 2014, 16, 365. [Google Scholar] [CrossRef]
- Chen, H.-Y.; Shen, D.-T.; Ji, D.-Z.; Han, P.-C.; Zhang, W.-M.; Ma, J.-F.; Chen, W.-S.; Goyal, H.; Pan, S.; Xu, H.-G. Prevalence and Burden of Hepatitis D Virus Infection in the Global Population: A Systematic Review and Meta-Analysis. Gut 2018, 68, 512–521. [Google Scholar] [CrossRef] [PubMed]
- Rizzetto, M.; Canese, M.G.; Gerin, J.L.; London, W.T.; Sly, D.L.; Purcell, R.H. Transmission of the Hepatitis B Virus-Associated Delta Antigen to Chimpanzees. J. Infect. Dis. 1980, 141, 590–602. [Google Scholar] [CrossRef]
- Rizzetto, M.; Hoyer, B.; Canese, M.G.; Shih, J.W.; Purcell, R.H.; Gerin, J.L. Delta Agent: Association of Delta Antigen with Hepatitis B Surface Antigen and RNA in Serum of Delta-Infected Chimpanzees. Proc. Natl. Acad. Sci. USA 1980, 77, 6124–6128. [Google Scholar] [CrossRef]
- Farci, P. Delta Hepatitis: An Update. J. Hepatol. 2003, 39 (Suppl. S1), 212–219. [Google Scholar] [CrossRef]
- Fattovich, G.; Boscaro, S.; Noventa, F.; Pornaro, E.; Stenico, D.; Alberti, A.; Ruol, A.; Realdi, G. Influence of Hepatitis Delta Virus Infection on Progression to Cirrhosis in Chronic Hepatitis Type B. J. Infect. Dis. 1987, 155, 931–935. [Google Scholar] [CrossRef] [PubMed]
- Fattovich, G.; Giustina, G.; Christensen, E.; Pantalena, M.; Zagni, I.; Realdi, G.; Schalm, S.W. Influence of hepatitis delta virus infection on morbidity and mortality in compensated cirrhosis type B. The European Concerted Action on Viral Hepatitis (Eurohep). Gut 2000, 46, 420–426. [Google Scholar] [CrossRef] [PubMed]
- Wedemeyer, H.; Yurdaydin, C.; Ernst, S.; Caruntu, F.A.; Curescu, M.G.; Kendal, Y.; Akarca, U.S.; Gurel, S.; Zeuzem, S.; Erhardt, A.; et al. 96 Weeks Of Pegylated-Interferon-Alfa-2a Plus Tenofovir or Placebo for the Treatment of Hepatitis Delta: The HIDIT-2 Study. Hepatology 2013, 58, 222A–223A. [Google Scholar]
- Heller, T.; Rotman, Y.; Koh, C.; Clark, S.; Haynes-Williams, V.; Chang, R.; McBurney, R.; Schmid, P.; Albrecht, J.; Kleiner, D.E.; et al. Long-term therapy of chronic delta hepatitis with peginterferon alfa. Aliment. Pharmacol. Ther. 2014, 40, 93–104. [Google Scholar] [CrossRef] [PubMed]
- Guedj, J.; Rotman, Y.; Cotler, S.J.; Koh, C.; Schmid, P.; Albrecht, J.; Haynes-Williams, V.; Liang, T.J.; Hoofnagle, J.H.; Heller, T.; et al. Understanding Early Serum Hepatitis D Virus and Hepatitis B Surface Antigen Kinetics During Pegylated Interferon-Alpha Therapy via Mathematical Modeling. Hepatology 2014, 60, 1902–1910. [Google Scholar] [CrossRef]
- Shekhtman, L.; Cotler, S.J.; Hershkovich, L.; Uprichard, S.L.; Bazinet, M.; Pantea, V.; Cebotarescu, V.; Cojuhari, L.; Jimbei, P.; Krawczyk, A.; et al. Modelling Hepatitis D Virus RNA and HBsAg Dynamics during Nucleic Acid Polymer Monotherapy Suggest Rapid Turnover of HBsAg. Sci. Rep. 2020, 10, 7837. [Google Scholar] [CrossRef] [PubMed]
- De Sousa, B.C.; Cunha, C. Development of Mathematical Models for the Analysis of Hepatitis Delta Virus Viral Dynamics. PLoS ONE 2010, 5, e12512. [Google Scholar] [CrossRef]
- Packer, A.; Forde, J.; Hews, S.; Kuang, Y. Mathematical Models Of The Interrelated Dynamics of Hepatitis D and B. Math. Biosci. 2014, 247, 38–46. [Google Scholar] [CrossRef]
- Asselah, T.; Loureiro, D.; Le Gal, F.; Narguet, S.; Brichler, S.; Bouton, V.; Abazid, M.; Boyer, N.; Giuly, N.; Gerber, A.; et al. Early Virological Response in Six Patients with Hepatitis D Virus Infection and Compensated Cirrhosis Treated with Bulevirtide In Real-Life. Liver Int. 2021, 41, 1509–1517. [Google Scholar] [CrossRef]
- Yurdaydin, C.; Keskin, O.; Kalkan, Ç.; Karakaya, F.; Çalişkan, A.; Karatayli, E.; Karatayli, S.; Bozdayi, A.M.; Koh, C.; Heller, T.; et al. Optimizing Lonafarnib Treatment for the Management of Chronic Delta Hepatitis: The LOWR HDV-1 Study. Hepatology 2017, 67, 1224–1236. [Google Scholar] [CrossRef]
- Kadelka, S.; Dahari, H.; Ciupe, S.M. Understanding the Antiviral Effects of RNAi-Based Therapy in HBeAg-Positive Chronic Hepatitis B Infection. Sci. Rep. 2021, 11, 200. [Google Scholar] [CrossRef] [PubMed]
- Koh, C.; Canini, L.; Dahari, H.; Zhao, X.; Uprichard, S.L.; Haynes-Williams, V.; A Winters, M.; Subramanya, G.; Cooper, S.L.; Pinto, P.; et al. Oral Prenylation Inhibition with Lonafarnib in Chronic Hepatitis D Infection: A Proof-of-Concept Randomised, Double-Blind, Placebo-Controlled Phase 2A Trial. Lancet Infect. Dis. 2015, 15, 1167–1174. [Google Scholar] [CrossRef]
- Reinharz, V.; Ishida, Y.; Tsuge, M.; Durso-Cain, K.; Chung, T.L.; Tateno, C.; Perelson, A.S.; Uprichard, S.L.; Chayama, K.; Dahari, H. Understanding Hepatitis B Virus Dynamics and the Antiviral Effect of Interferon Alpha Treatment in Humanized Chimeric Mice. J. Virol. 2021, 95. [Google Scholar] [CrossRef] [PubMed]
- Rohatgi, A. Webplotdigitizer: Web Based Tool to Extract Data from Plots, Images, and Maps. V 4.1. 2017. Available online: https://automeris.io/WebPlotDigitizer/ (accessed on 12 November 2021).
- Barash, D. Nonlinear Diffusion Filtering on an Extended Neighborhood. Appl. Num. Math. 2005, 52, 1–11. [Google Scholar] [CrossRef]
- Reinharz, V.; Dahari, H.; Barash, D. Numerical Schemes for Solving and Optimizing Multiscale Models with Age of Hepatitis C Virus Dynamics. Math. Biosci. 2018, 300, 1–13. [Google Scholar] [CrossRef]
- Williams, V.; Brichler, S.; Radjef, N.; Lebon, P.; Goffard, A.; Hober, D.; Fagard, R.; Kremsdorf, D.; Deny, P.; Gordien, E. Hepatitis Delta Virus Proteins Repress Hepatitis B Virus Enhancers and Activate the Alpha/Beta Interferon-Inducible Mxa Gene. J. Gen. Virol. 2009, 90, 2759–2767. [Google Scholar] [CrossRef] [PubMed]
- Da, B.L.; Heller, T.; Koh, C. Hepatitis D Infection: From Initial Discovery to Current Investigational Therapies. Gastroenterol. Rep. 2019, 7, 231–245. [Google Scholar] [CrossRef] [PubMed]
- Braga, W.S.; de Oliveira, C.M.; de Araujo, J.R.; Castilho Mda, C.; Rocha, J.M.; Gimaque, J.B.; Silva, M.L.; Vasconcelos, H.L.; Ramasawmy, R.; Parana, R. Chronic HDV/HBV Co-Infection: Predictors of Disease Stage—A Case Series of HDV-3 Patients. J. Hepatol. 2014, 61, 1205–1211. [Google Scholar] [CrossRef] [PubMed]


| x(t) | the number of uninfected cells at time t |
| y1(t) | the number of HBV-infected cells at time t |
| y2(t) | the number of HDV-infected cells at time t |
| y3(t) | the number of infected cells with both HBV and HDV at time t |
| v1(t) | the HBV viral load at time t |
| v2(t) | the HDV viral load at time t |
| λ | production rate of uninfected cells (day−1) |
| δ | death rate of uninfected cells (day−1) |
| b1 | infection rate of HBV-infected cells (day−1) |
| b2 | infection rate of HDV-infected cells (day−1) |
| d1 | death rate of HBV-infected cells (day−1) |
| d2 | death rate of HDV-infected cells (day−1) |
| u1 | clearance rate of HBV virions (day−1) |
| u2 | clearance rate of HDV virions (day−1) |
| k1 | production rate of HBV virions (day−1) |
| k2 | production rate of HDV virions (day−1) |
| k3 | production rate of HBV virions (?) |
| η | therapy efficacy of inhibiting new virus infections as a result of virus clearance |
| ε | therapy efficacy of inhibiting viral production from infected cells |
| x(t) | uninfected cells |
| y(t) | HBV-only-infected cells |
| z(t) | HDV-only-infected cells |
| w(t) | HBV-HDV-coinfected cells |
| r | maximum proliferation rate (day−1) |
| K | homeostatic liver size (number of cells) |
| α | infected cells death rate (day−1) |
| c | HBV inhibition coefficient |
| σ | HBV infection rate (day−1) |
| δ | HDV infection rate (day−1) |
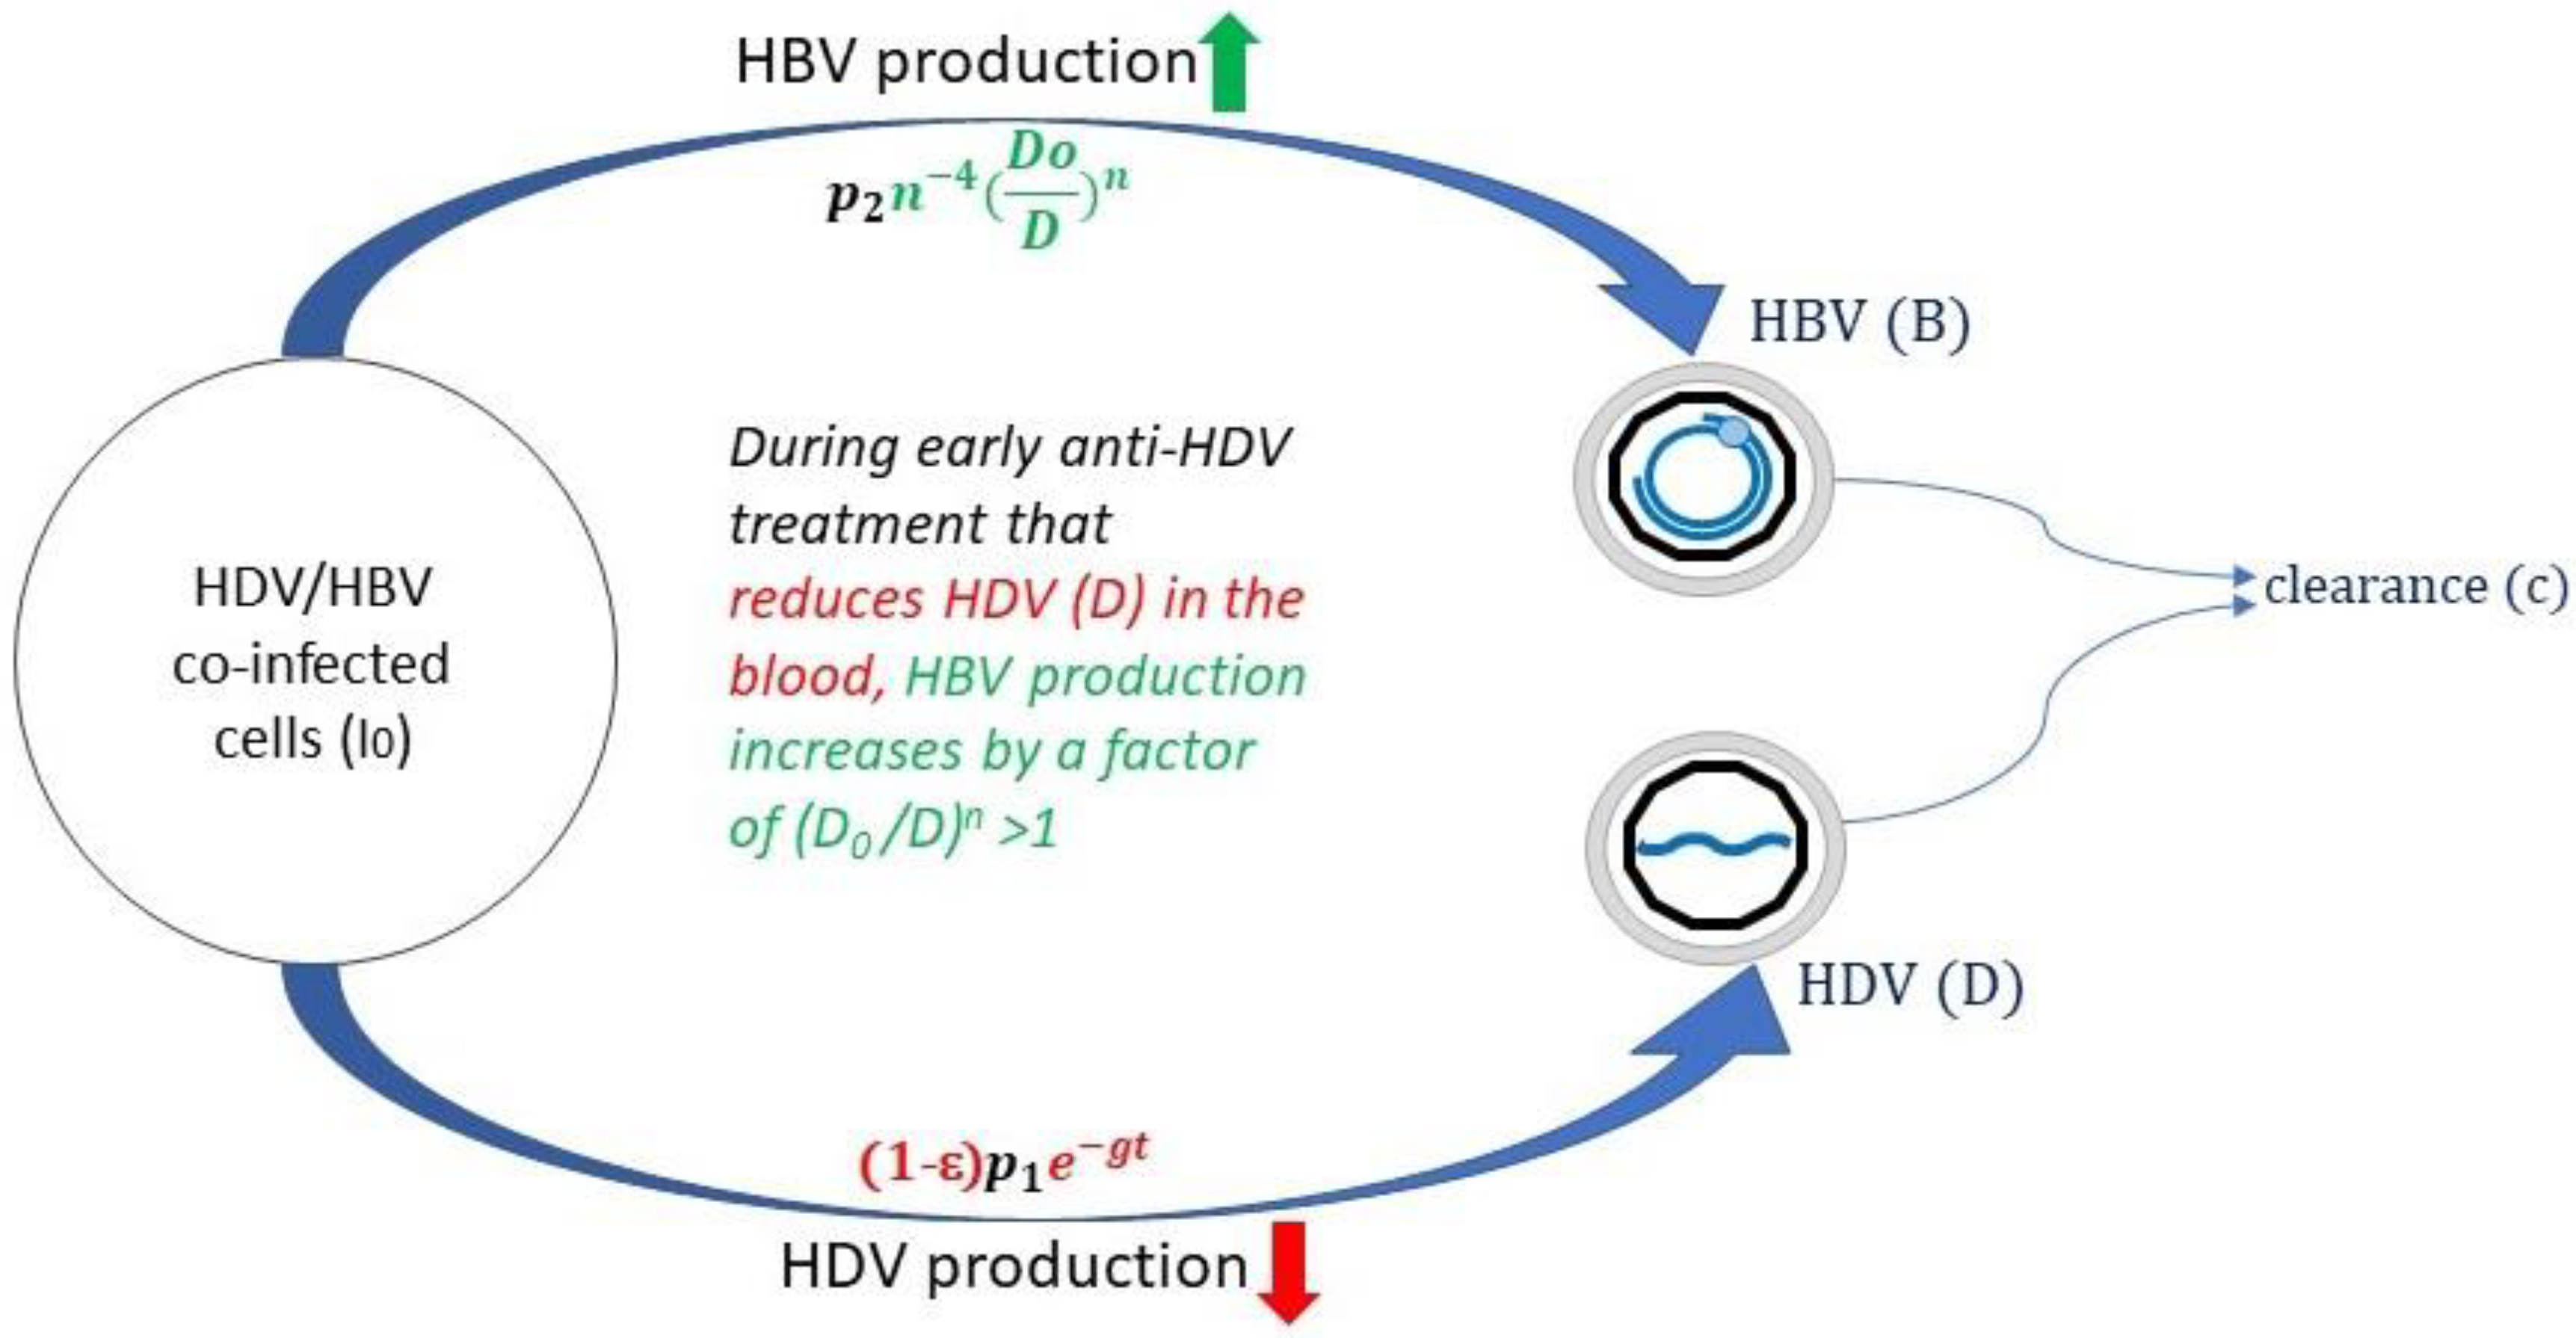
| D | HDV viral load (IU/mL) |
| D0 | HDV viral load before treatment (IU/mL) |
| B | HBV viral load (IU/mL) |
| B0 | HBV viral load before treatment (IU/mL) |
| I0 | Number of HBV-HDV-coinfected cells |
| p1 | Production rate constant of HDV |
| p2 | Production rate constant of HBV |
| g | Additional treatment inhibitory effect in blocking HDV production (day−1) |
| ε | Treatment efficacy in blocking viral production (between 0 and 1) |
| n | HBV exponent that governs the rate increase in HBV |
| c | HDV and HBV clearance constant from blood (day−1) |
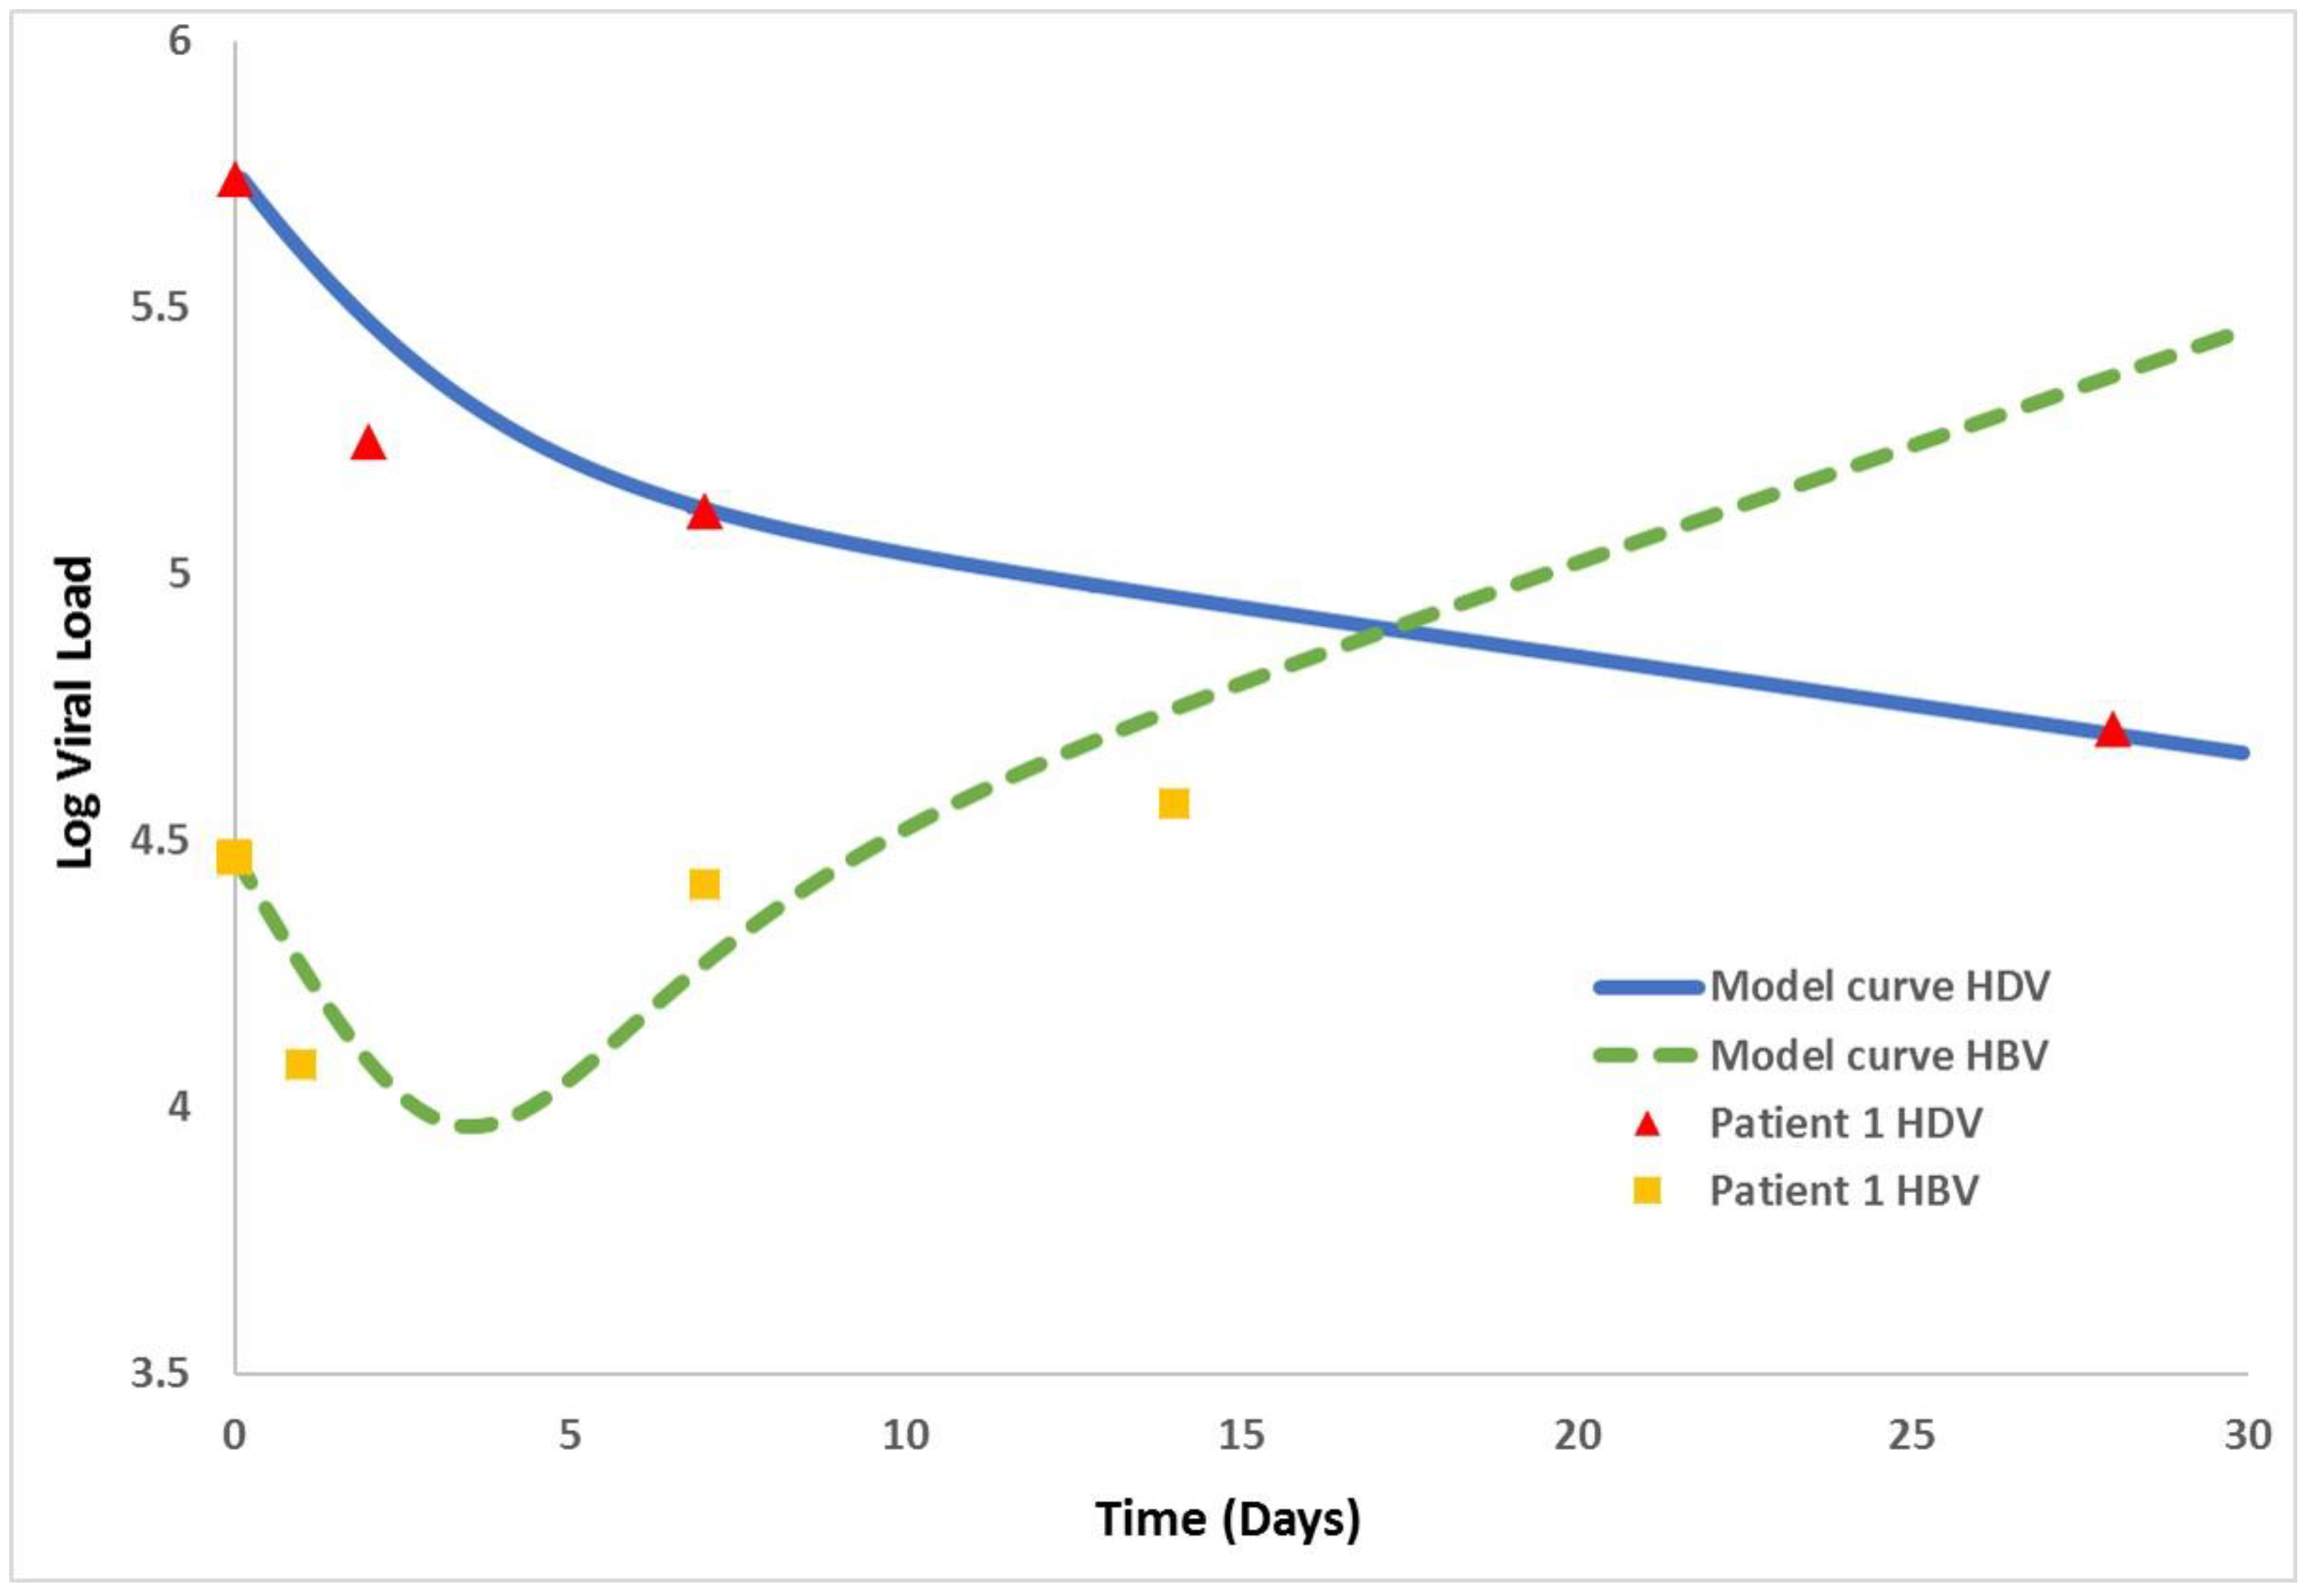
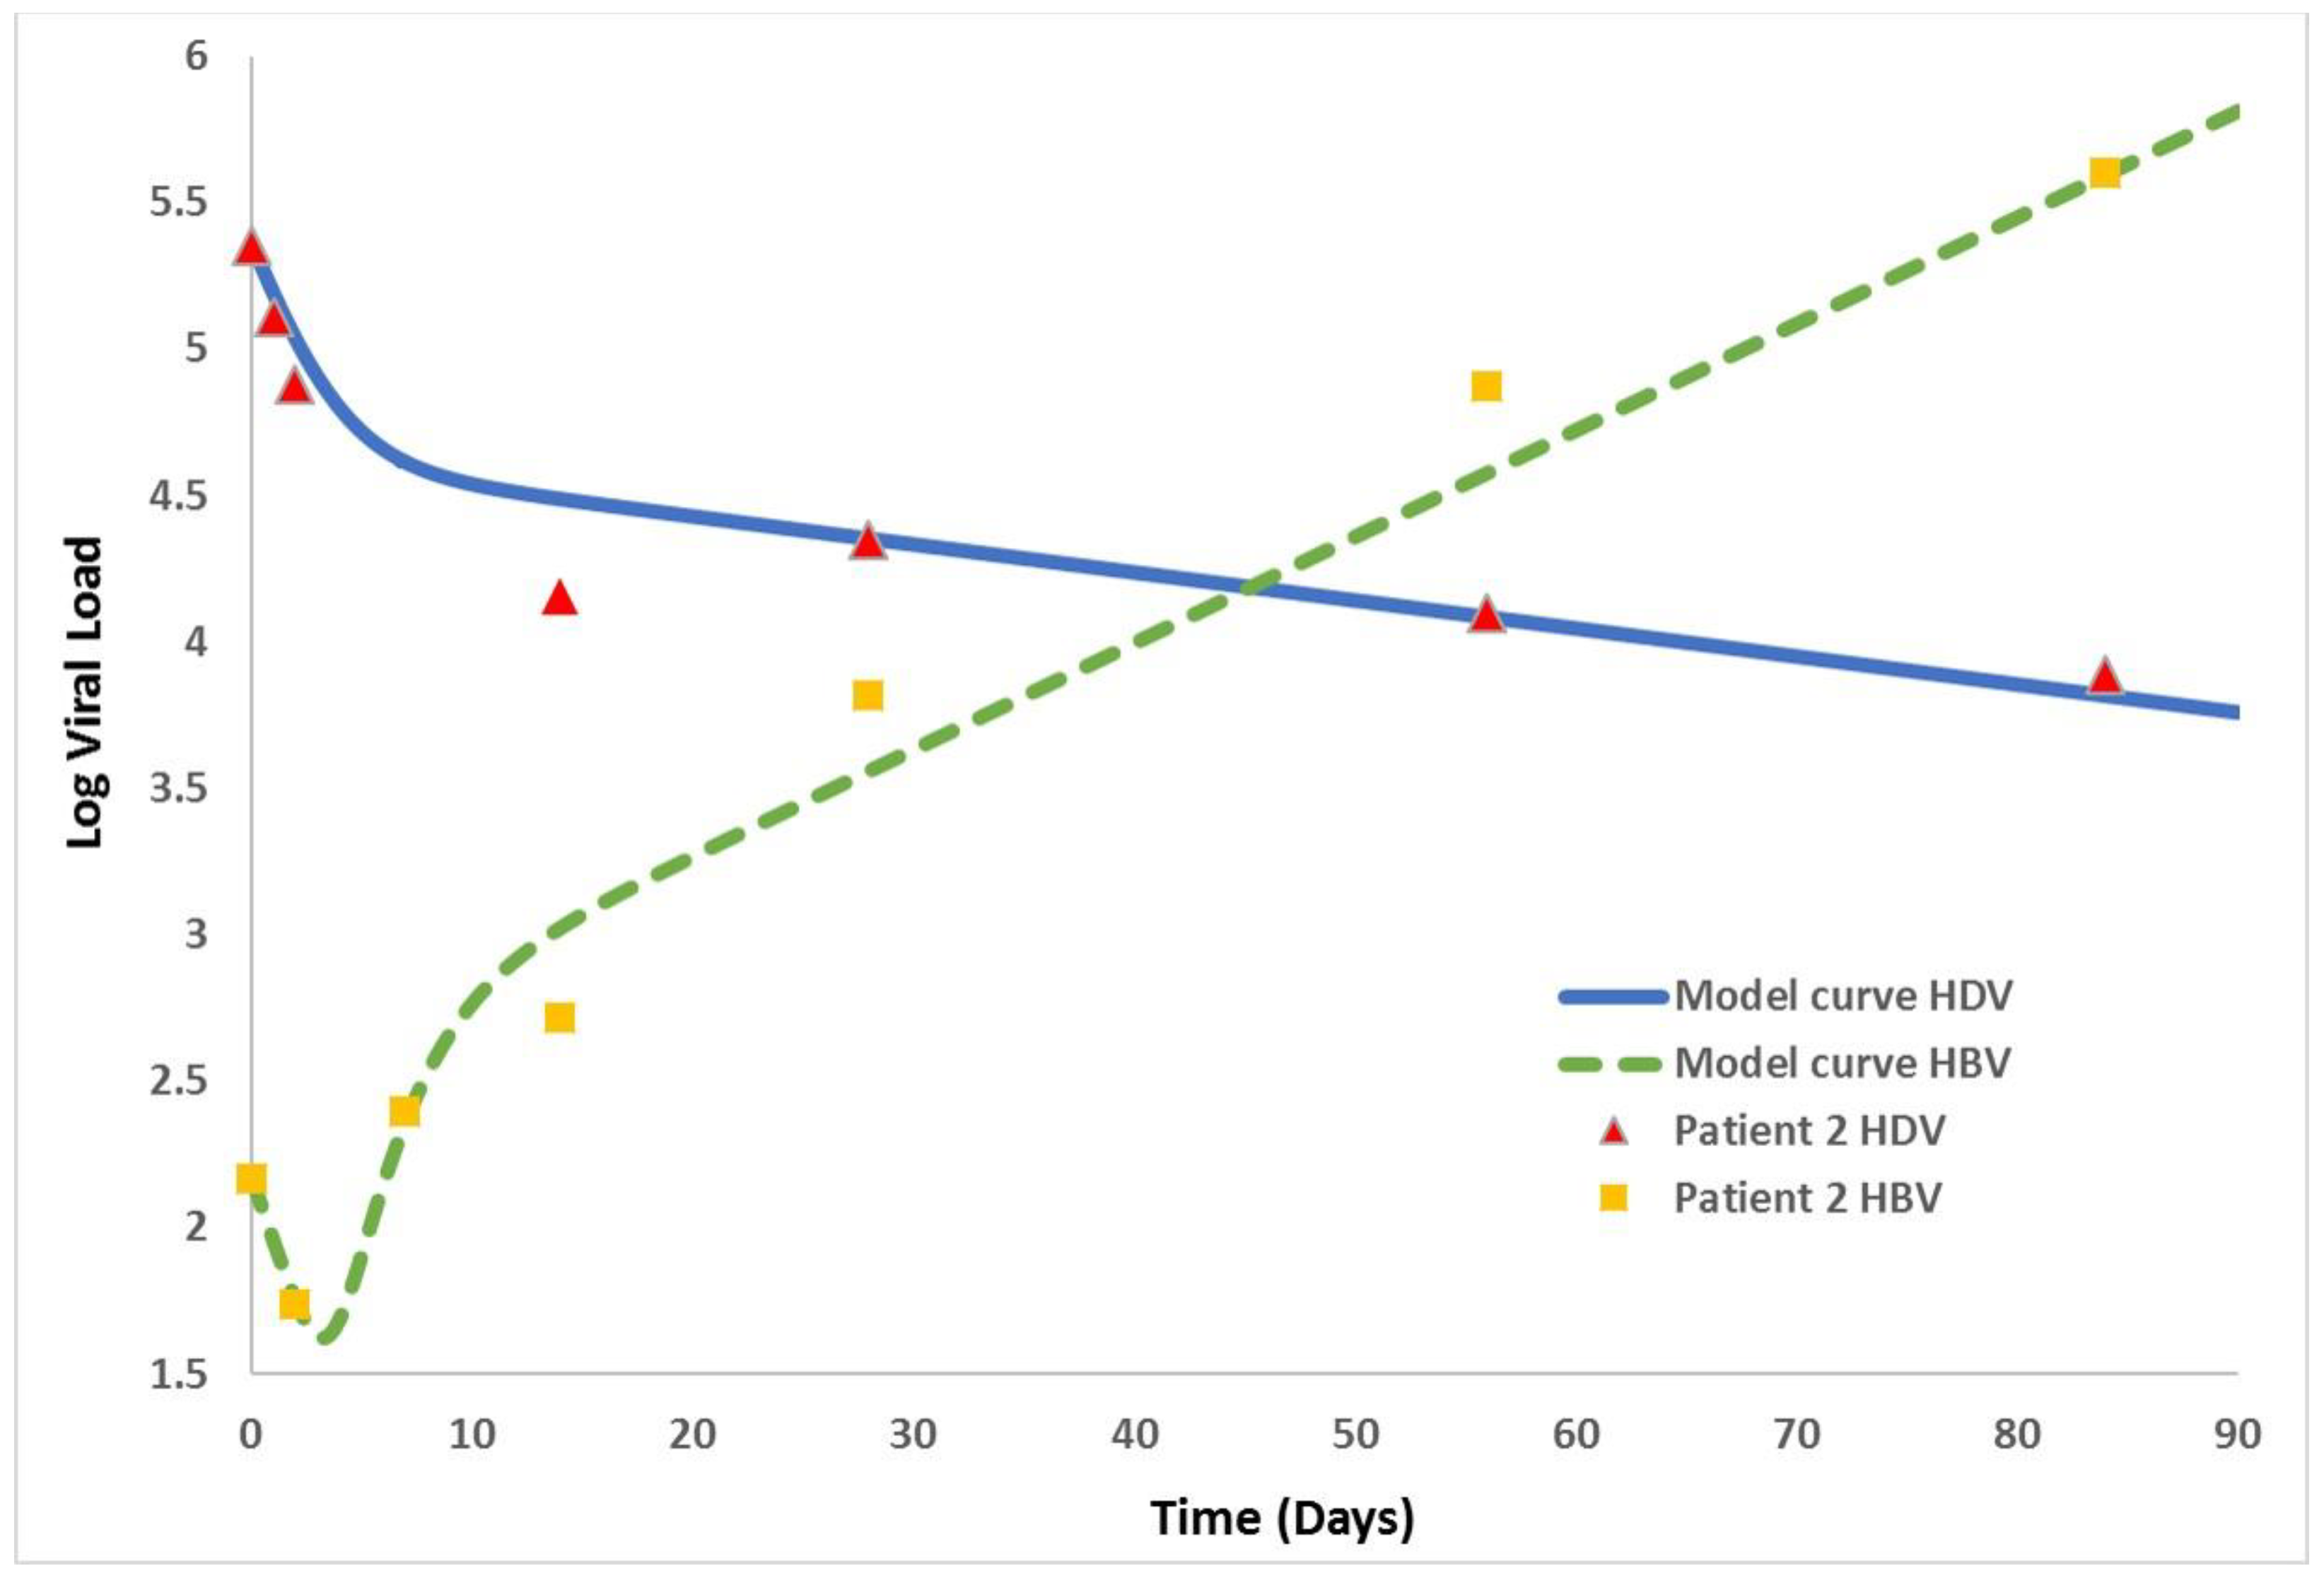
| B0 | D0 | g | ε | n | τ | c | |
|---|---|---|---|---|---|---|---|
| Patient 1 | 29,512 | 5.5 × 10⁵ | 0.042 | 0.73 | 2.4 | 0.1 | 0.51 |
| Patient 2 | 148 | 2.2 × 10⁵ | 0.023 | 0.82 | 3.8 | 0.1 | 0.51 |
Publisher’s Note: MDPI stays neutral with regard to jurisdictional claims in published maps and institutional affiliations. |
© 2021 by the authors. Licensee MDPI, Basel, Switzerland. This article is an open access article distributed under the terms and conditions of the Creative Commons Attribution (CC BY) license (https://creativecommons.org/licenses/by/4.0/).
Share and Cite
Zakh, R.; Churkin, A.; Bietsch, W.; Lachiany, M.; Cotler, S.J.; Ploss, A.; Dahari, H.; Barash, D. A Mathematical Model for Early HBV and -HDV Kinetics during Anti-HDV Treatment. Mathematics 2021, 9, 3323. https://doi.org/10.3390/math9243323
Zakh R, Churkin A, Bietsch W, Lachiany M, Cotler SJ, Ploss A, Dahari H, Barash D. A Mathematical Model for Early HBV and -HDV Kinetics during Anti-HDV Treatment. Mathematics. 2021; 9(24):3323. https://doi.org/10.3390/math9243323
Chicago/Turabian StyleZakh, Rami, Alexander Churkin, William Bietsch, Menachem Lachiany, Scott J. Cotler, Alexander Ploss, Harel Dahari, and Danny Barash. 2021. "A Mathematical Model for Early HBV and -HDV Kinetics during Anti-HDV Treatment" Mathematics 9, no. 24: 3323. https://doi.org/10.3390/math9243323
APA StyleZakh, R., Churkin, A., Bietsch, W., Lachiany, M., Cotler, S. J., Ploss, A., Dahari, H., & Barash, D. (2021). A Mathematical Model for Early HBV and -HDV Kinetics during Anti-HDV Treatment. Mathematics, 9(24), 3323. https://doi.org/10.3390/math9243323