Article

A Mathematical Model for Early HBV and -HDV Kinetics during Anti-HDV Treatment

1
Department of Computer Science, Ben-Gurion University, Beer-Sheva 8410501, Israel
2
Department of Software Engineering, Sami Shamoon College of Engineering, Beer-Sheva 8410501, Israel
3
Stritch School of Medicine, Loyola University Chicago, Maywood, IL 60153, USA
4
Campus Lev, Jerusalem College of Technology, Jerusalem 91160, Israel
5
Department of Molecular Biology, Princeton University, Princeton, NJ 08544, USA
*
Authors to whom correspondence should be addressed.
Mathematics 2021, 9(24), 3323; https://doi.org/10.3390/math9243323
Submission received: 27 November 2021 / Revised: 16 December 2021 / Accepted: 16 December 2021 / Published: 20 December 2021

Abstract

:
Hepatitis delta virus (HDV) is an infectious subviral agent that can only propagate in people infected with hepatitis B virus (HBV). HDV/HBV infection is considered to be the most severe form of chronic viral hepatitis. In this contribution, a mathematical model for the interplay between HDV and HBV under anti-HDV treatment is presented. Previous models were not designed to account for the observation that HBV rises when HDV declines with HDV-specific therapy. In the simple model presented here, HDV and HBV kinetics are coupled, giving rise to an improved viral kinetic model that simulates the early interplay of HDV and HBV during anti-HDV therapy.

1. Introduction

Globally, ~15–72 million people are currently infected with the hepatitis delta virus (HDV) [1,2]. HDV is an infectious subviral agent that can only propagate in individuals infected with hepatitis B virus (HBV), which supplies the necessary envelope proteins needed to assemble infectious HDV progeny virions. HDV was recognized as a distinct agent in 1977 [3,4], and is the smallest known viral genome that infects humans. HDV causes an accelerated course of liver disease compared to HBV alone [1] and is the most severe form of chronic viral hepatitis in humans [5,6,7].
There is currently no FDA-approved therapy for HDV. Pegylated interferon-α (IFN), which is the recommended treatment by the American Association for the Study of Liver Diseases (AASLD) is associated with very low response rates and high relapse rates, even when administered for 5 years [8,9]. There is little information on the kinetics of HDV infection or the critical interplay between HDV, HBV, and the host, which are needed to understand the mechanism of action and optimize emerging antiviral therapies for HDV. Importantly, the recent development of new HDV experimental systems and anti-HDV drugs that are now in clinical trials provide a unique opportunity to study, for the first time, the dynamic interaction between HDV and HBV. Herein, we describe a simple model for the HDV and HBV interplay under anti-HDV treatment.

2. Background

A mathematical model for HDV kinetics during antiviral treatment was described in [10,11] without considering HBV dynamics. Subsequently, mathematical models were developed that account for both HDV and HBV [12,13]. These mathematical models for HBV-HDV dynamics aimed to theoretically simulate acute infection or antiviral treatment with nucleos(t)ides analogs or IFN after chronic infection established in silico [12,13]. The existing models were not designed to explain anti-HDV drugs that solely affect HDV.
The model of de Sousa and Cunha [12] was the first HDV-HBV model, which included viral load dynamics in response to therapy by lamivudine and/or IFN, where both HBV and HDV viral loads decrease post-therapy as depicted in Figures 11–13 of [12]. The model contains six equations:
d x d t = λ δ x t 1 η [ b 1 v 1 t + b 2 v 2 t + b 1 b 2 min v 1 t , v 2 t ] x t
d y 1 d t = 1 η b 1 v 1 t x t d 1 y 1 t 1 η b 2 v 2 t y 1 t
d y 2 d t = 1 η b 2 v 2 t x t d 2 y 2 t 1 η b 1 v 1 t y 2 t
d y 3 d t = 1 η [ b 2 v 2 t y 1 t + b 1 v 1 t y 2 t + b 1 b 2 min v 1 t , v 2 t x t ] d 3 y 3 t
d v 1 d t = 1 ε [ k 1 y 1 t + k 3 y 3 t ] u 1 v 1 t
d v 2 d t = k 2 y 3 t u 2 v 2 t
where x(t) is the number of uninfected cells at time t, y1(t) is the number of HBV-infected cells at time t, y2(t) is the number of HDV-infected cells at time t, y3(t) is the number of infected cells with both HBV and HDV at time t, v1(t) is the HBV viral load at time t, and v2(t) is the HDV viral load at time t. Both the variables and all of the parameters of the model are shown in Table 1.
The model of Packer et al. [13] followed the model described above. Packer et al. devised a model for coexistent HBV and HDV, which portrayed the dynamics of reaching possible steady states. However, treatment post-steady-state was not in the scope of their work. Nevertheless, the Packer et al. model equations provide a good starting place for the development of more sophisticated models. Packer et al. provided five equations:
d x d t = r x t 1 T t K σ y t + c w t x t T t δ w t x t T t
d y d t = σ y t + c w t x t T t δ w t x t T t α y t
d z d t = δ w t x t T t σ y t + c w t z t T t α z t
d w d t = σ y t + c w t z t T t + δ w t y t T t α w t
T t = x t + y t + z t + w t
where x(t) is the number of uninfected cells at time t, y(t) is the number of HBV-only-infected cells at time t, z(t) is the number of HDV-only-infected cells at time t, w(t) is the number of HBV-HDV-coinfected cells at time t, and T(t) is the sum of all these cells at time t. Both the variables and all of the parameters of the model are shown in Table 2.
At the time both the above models were published, therapy to suppress HDV alone was not available. Bulevirtide (also known as Myrcludex B or Hepcludex), an HDV entry inhibitor, can profoundly suppress HDV RNA and was recently approved by the European regulatory bodies for the treatment of chronic hepatitis delta [14]. In addition, the prenylation inhibitor Lonafarnib (LNF), an investigational oral HDV drug in clinical trials, was shown to suppress HDV in a proof-of-concept phase 2A study. Our new mathematical model, presented here, incorporates the observation that HBV viral loads can increase under LNF monotherapy [15].

3. Materials and Methods

Based on newly published empirical results [15], we present a new mathematical model for the interaction between HBV and HDV that can explain the coinfection pattern of HBV increasing as HDV decreases. A schematic diagram for the model is depicted in Figure 1.
The model comprises only two equations:
dD dt = 1 ε p 1 I 0 e gt cD t
dB dt = p 2 I 0 n 4 D 0 D t n cB ( t )
where D is the HDV viral load and B is the HBV viral load. Both the variables and all of the parameters of the model are shown in Table 3. We keep the number of infected cells, I0, constant, i.e., ignoring the dynamics of infected cells, such as infection of susceptible cells and/or infected cell proliferation and/or death (assuming a long-infected cell life-span as previously performed [16,17]). Treatment is assumed to solely block HDV production rate p1 by (1 − ε), where 0 ≤ ε ≤ 1 represents its efficacy. To account for the biphasic HDV RNA decay in the absence of infected cell dynamics, we assume that treatment has additional time-dependent inhibitory effects on HDV production and we model it by decreasing p1 further by e−gt, where g ≥ 0 is a constant and t is the time in days post-treatment initiation, as previously performed [16,18].
To accommodate the steady-state solution, the following two equations hold:
p 1 = cD 0 I 0
p 2 = cB 0 I 0
where it should also be noted that, prior to treatment onset, ε = 0 , g = 0 , n = 1 .
It is possible to obtain an analytical solution for D(t). The exact solution can be derived as follows:
dD dt = 1 ε p 1 I 0 e gt cD t
Multiplying both sides of the equation by e c t , one obtains:
dD dt e c t + cD t e c t = 1 ε p 1 I 0 e gt e c t
Therefore, the following equation is obtained:
d dt ( De c t ) = 1 ε p 1 I 0 e gt e c t
Integrating both sides yields:
De c t = 1 ε p 1 I 0 e gt e c t dt
The solution for the integral is:
De c t = 1 ε p 1 I 0 c g e gt e c t + C 1
It then follows that the general solution for D is:
D = 1 ε p 1 I 0 c g e gt + C 1 e c t
In order to find C1, at time t = 0, D = D0, one plugs in the initial condition and C1 is obtained:
C 1 = D 0 1 ε p 1 I 0 c g
Therefore, the exact solution for D can now be written in full by the following expression:
D t = 1 ε p 1 I 0 c g e gt + ( D 0 1 ε p 1 I 0 c g ) e c t
It could be possible to extract the exact solution for B(t) as well, by a formidable derivation using hypergeometric functions, as was preliminary checked with Mathematica by Wolfram Research, but the result is likely less intuitive, and this is left for future work. In practice, the numerical solution can be used for simulations with the model as performed next.

4. Results

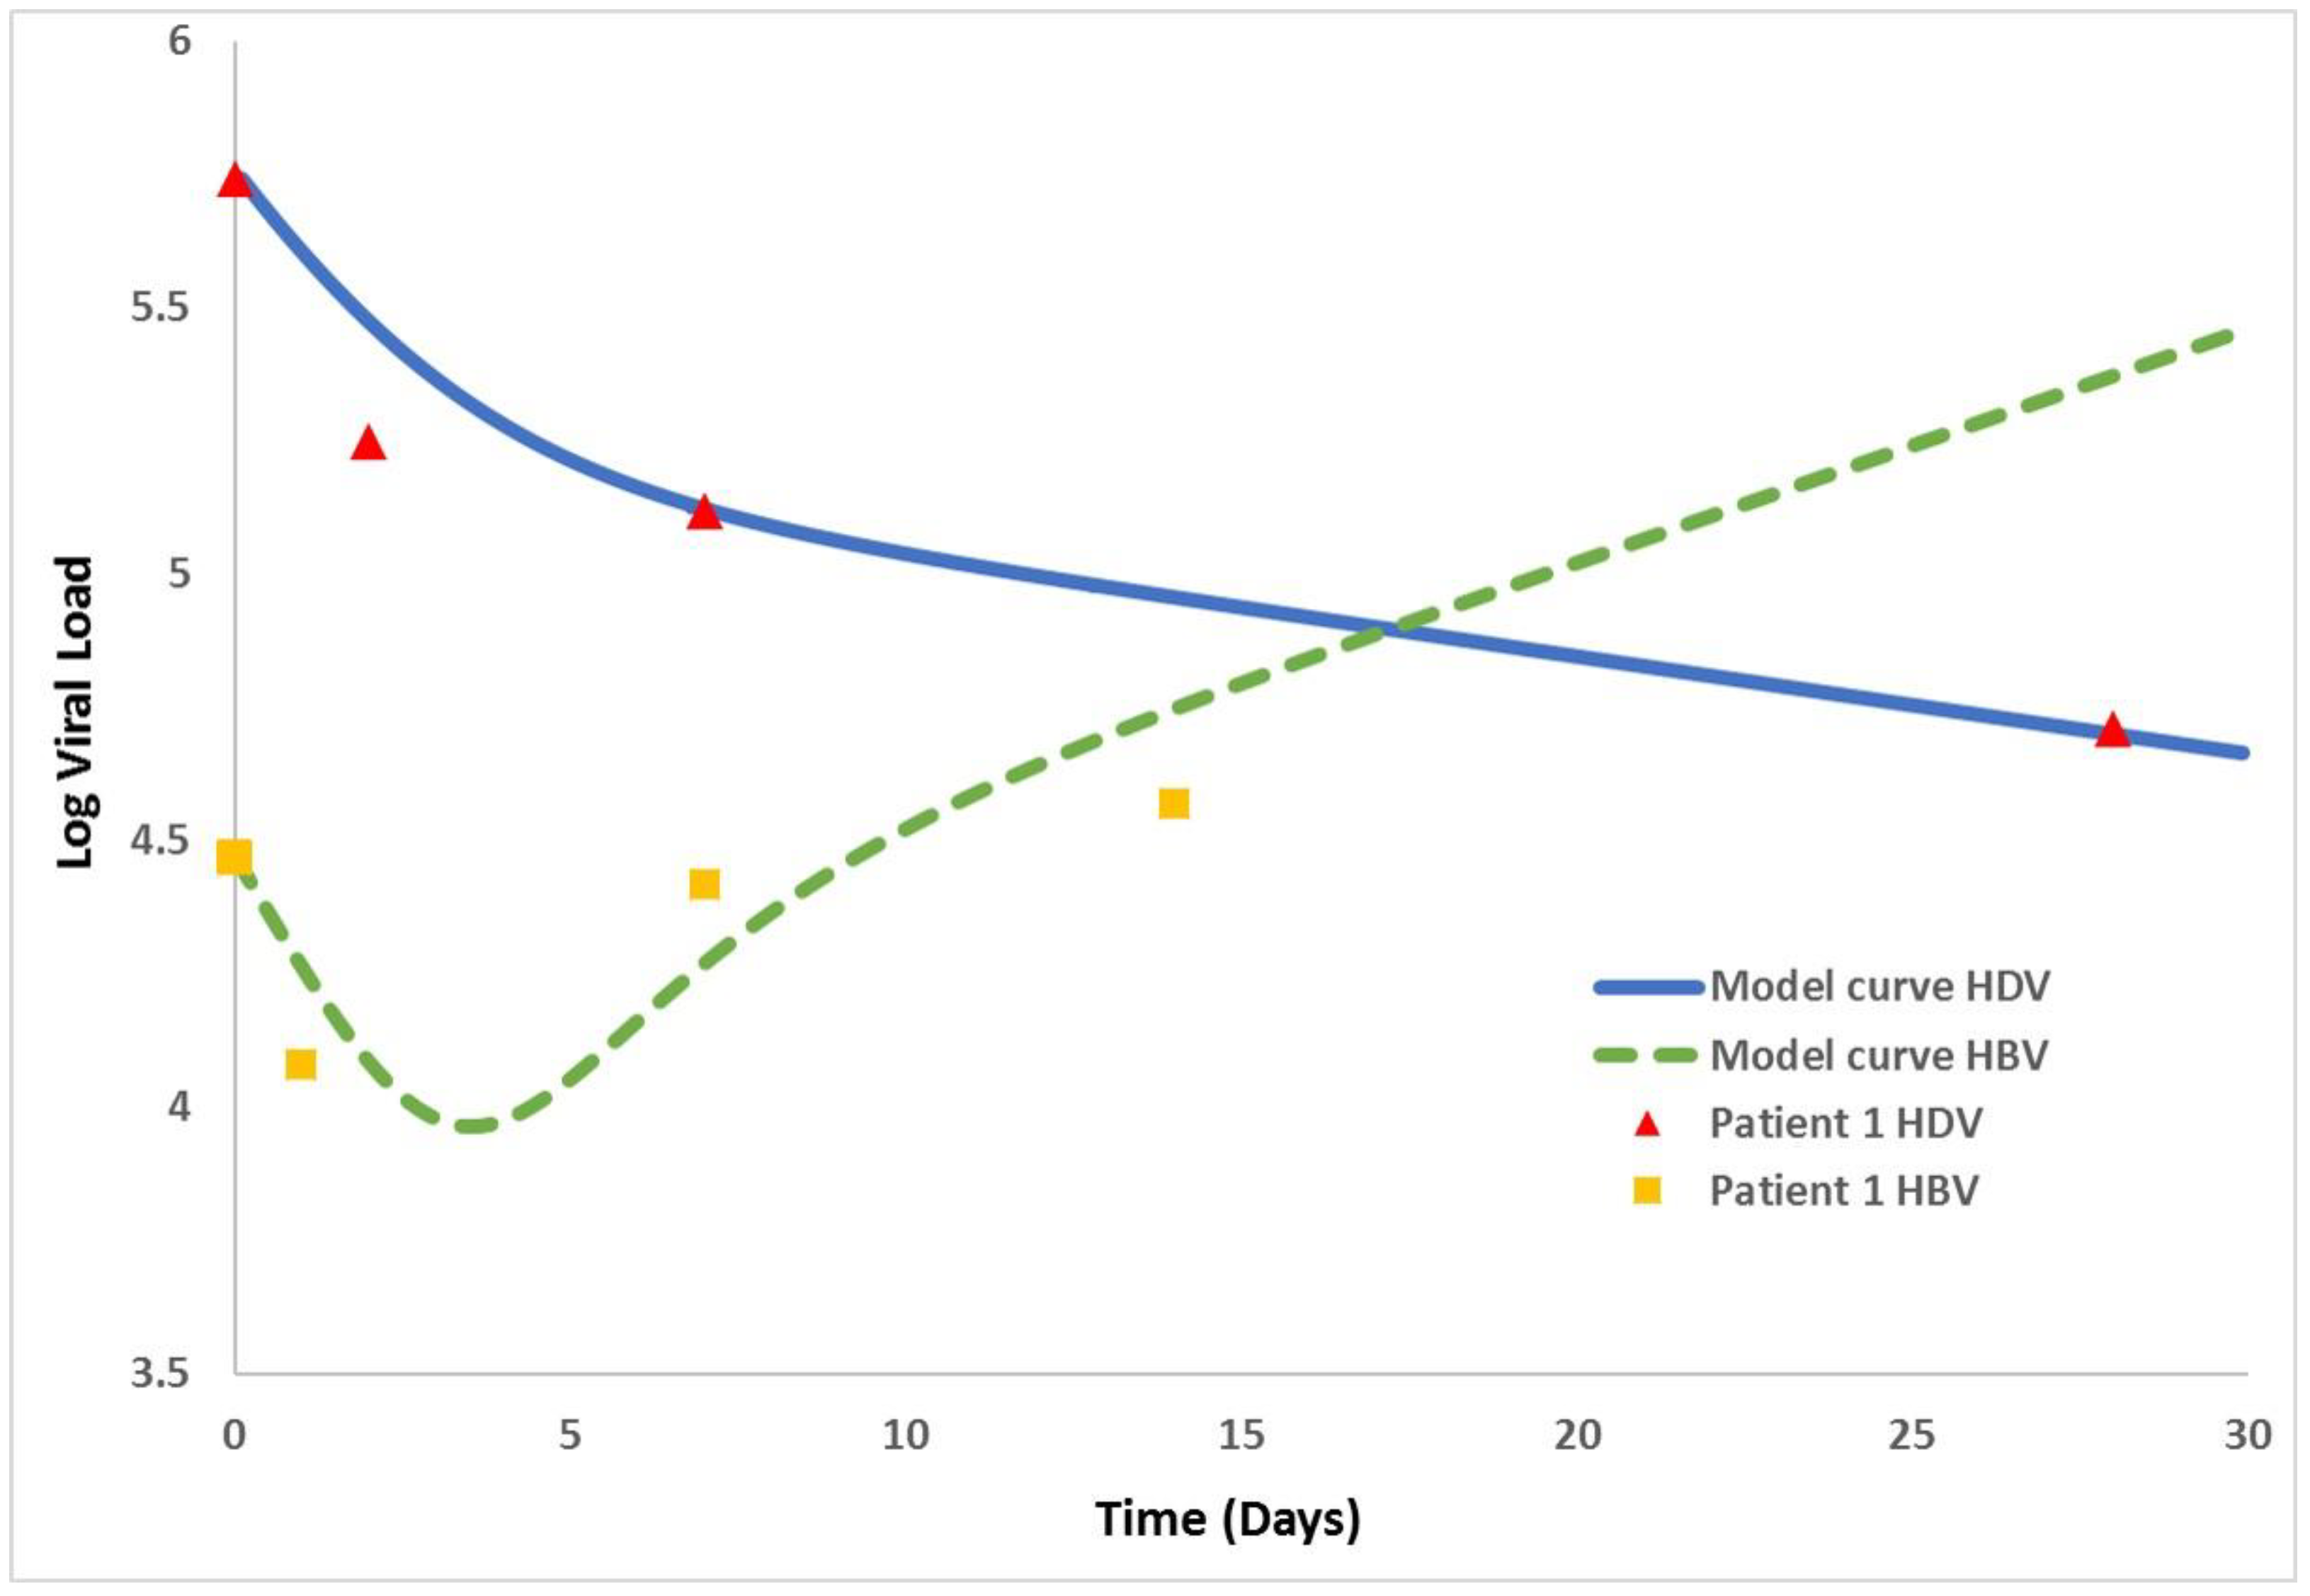
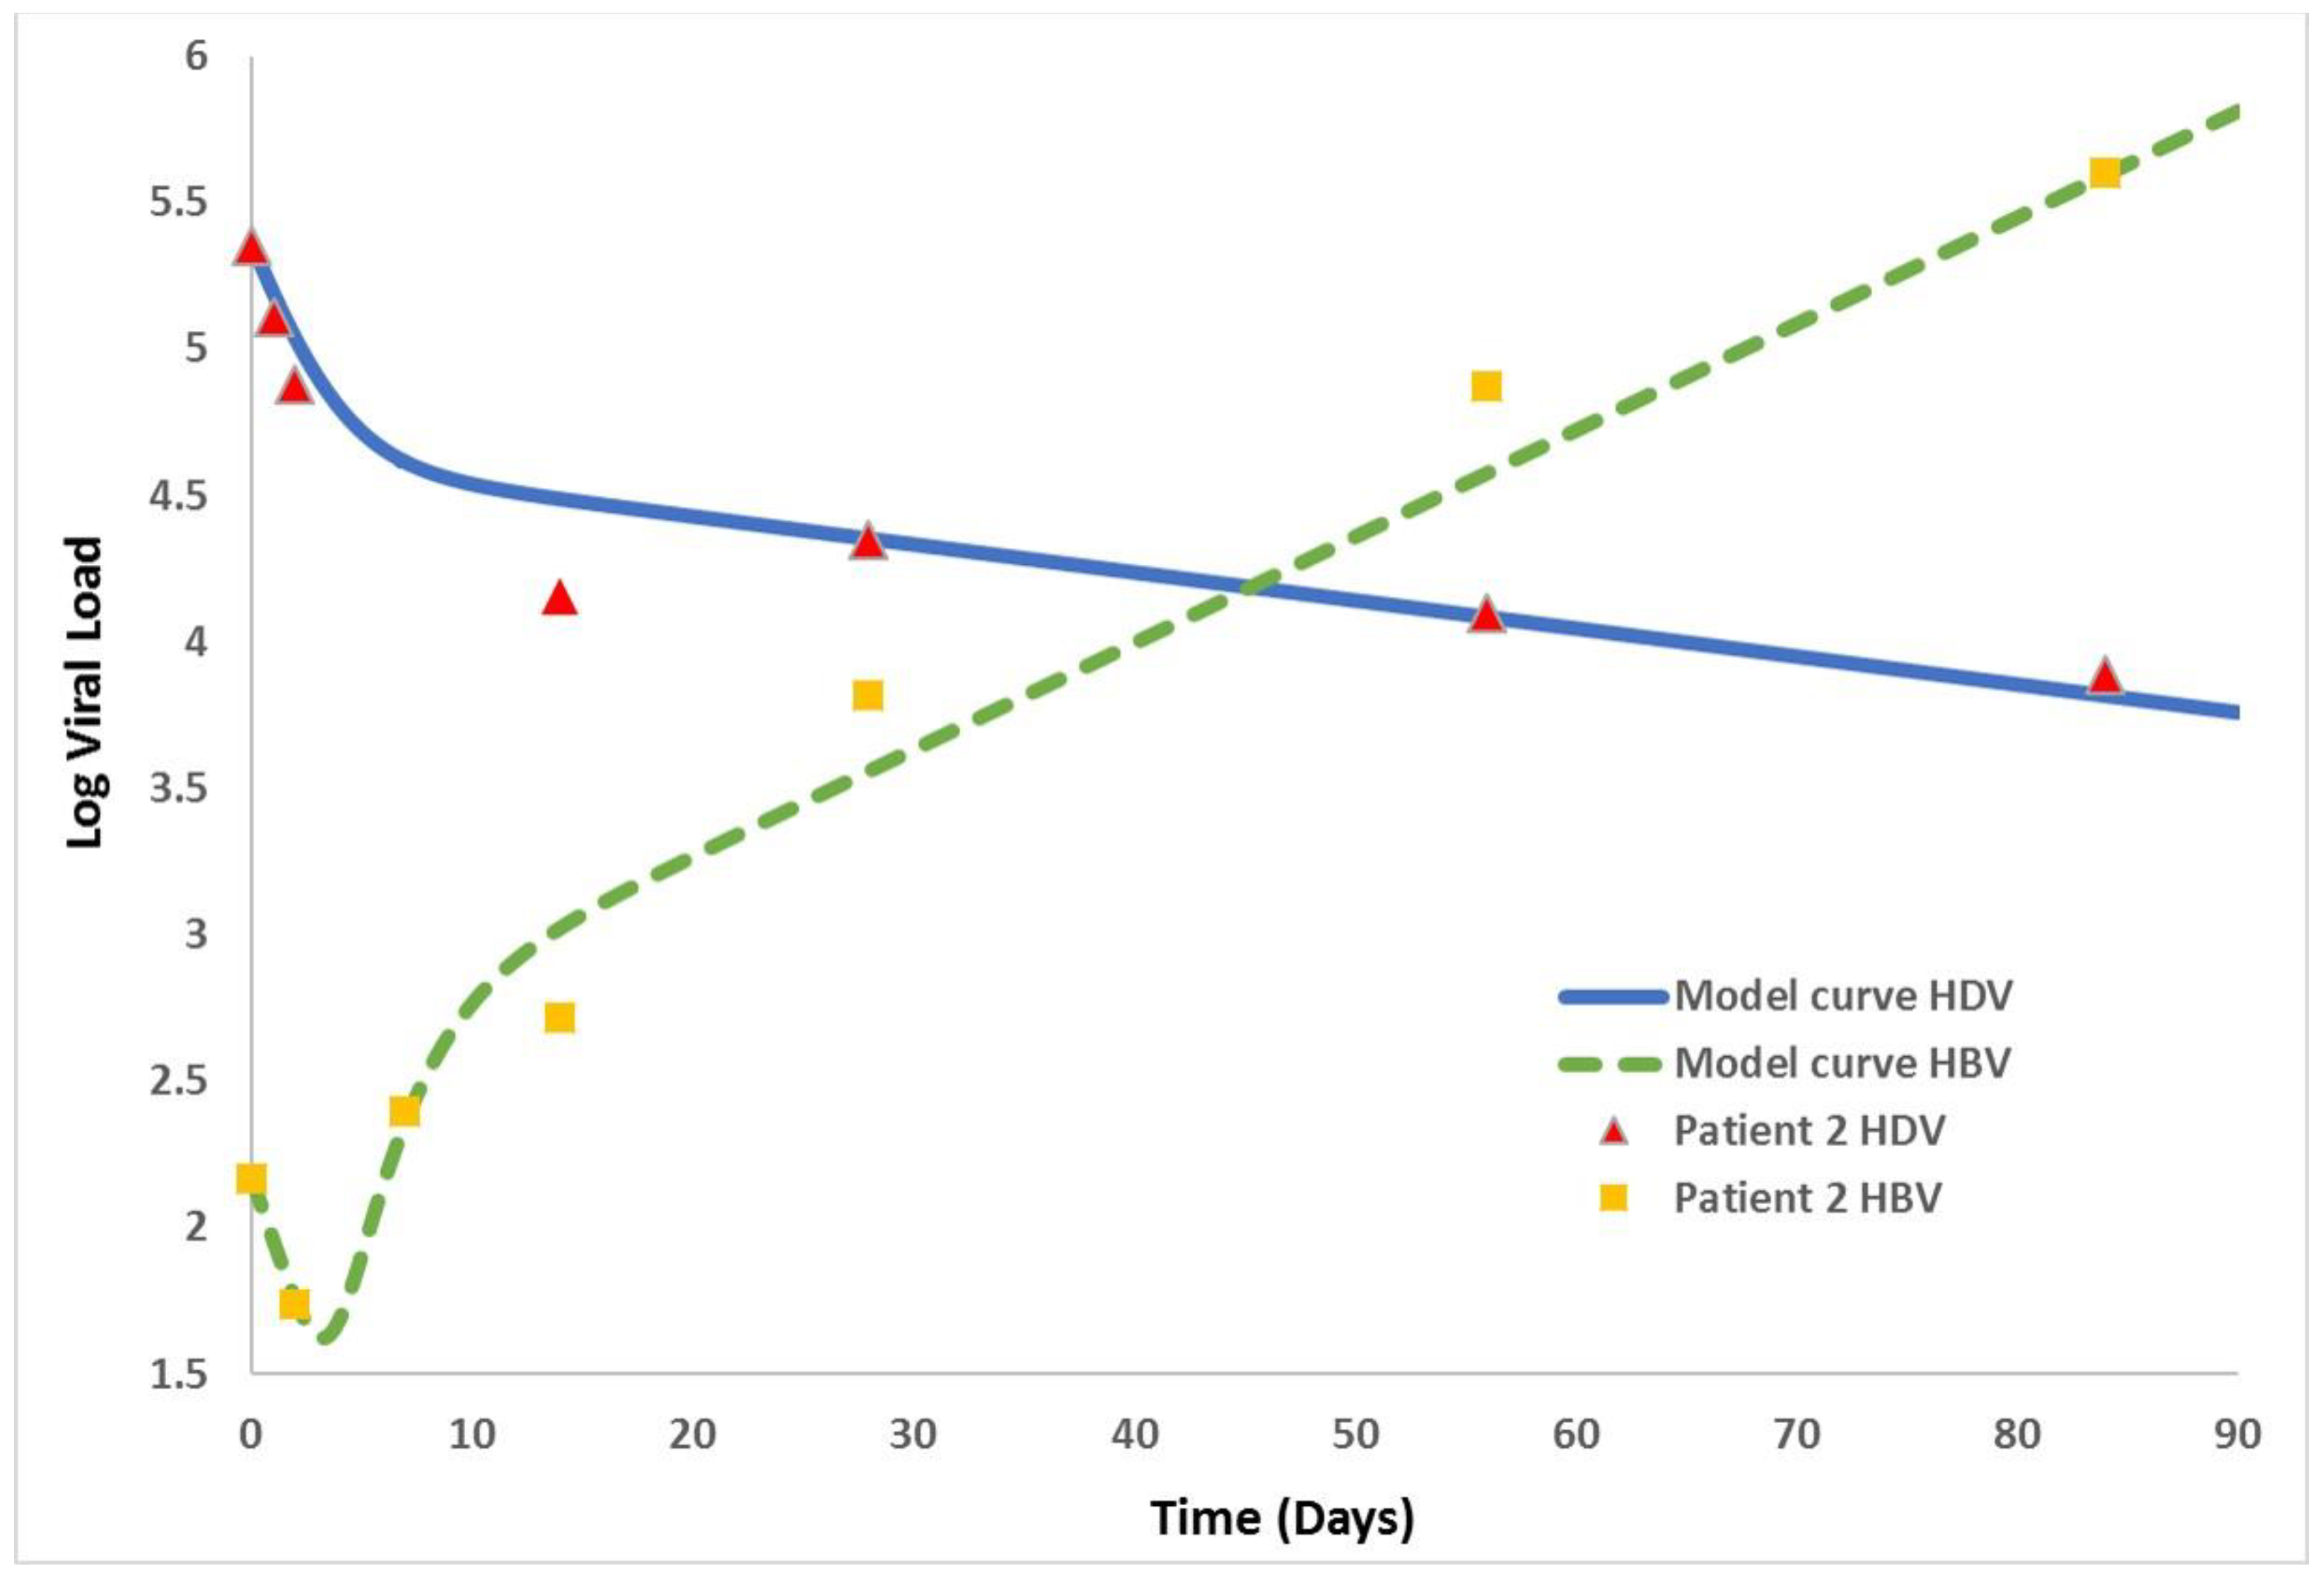
Given the data shown in Figure 5 by Yurdaydin et al. [15], we digitized the data points with [19] and performed simulations with our new model. Unlike applications such as in [20,21] where more sophisticated numerical methods are needed to solve the differential equations, here, the model is simple enough to utilize a standard Runge–Kutta scheme of the fourth order where numerical simulations are performed using Berkeley Madonna version 8.3.18. More specifically, Patient 1 (Figure 2) was treated with LNF 200 mg twice a day (BID) and Patient 2 (Figure 3) was treated with LNF 300 mg BID (Figure 5A,B in [15], see digitized data in the supplementary material Tables S1 and S2). Model parameter values for Patient 1 and Patient 2 show in Table 4.
Figure 2 and Figure 3 depict the HBV/HDV levels after LNF treatment initiation and are in agreement with [15]. While HDV decreases, HBV increases, which is not captured in previous models [12,13].

5. Discussion and Conclusions

A new model is presented for HBV-HDV interaction, which captures the kinetics seen during anti-HDV treatment with LNF. These observations are in agreement with data showing that the HBV viral load is suppressed by the presence of HDV [22]. The model is a simplified one and contains only two equations for HDV and HBV dynamics. The HDV equation contains an exponent not included in the HBV equation (i.e., e−gt), which represents the time-dependent blocking of viral production that explains the second-phase decline observed with LNF. The HBV equation is inversely dependent on HDV as per the empirical results, and includes patient-specific variables. The clearance rate of HDV and HBV from circulation is considered similar to that in [11]. We assume that the number of infected cells is constant, a feature that we intend to relax in future models.
Most studies in chronically infected patients show the levels of both viruses to be in a steady state. Typically, three HDV/HBV steady-state profiles are observed, including predominant HDV replication, similar rates of replication for both viruses, and less commonly, predominant HBV replication. Patients exhibiting predominant HDV replication before treatment initiation (as the two patients shown in Figure 2 and Figure 3) comprise the majority of cases [23,24].
The model presented here was made possible by the development of new antiviral agents for HDV. The model provides an important first step toward understanding the dynamic interaction between HDV and HBV, which is needed to achieve a detailed understanding of viral kinetics and treatment response in patients with HDV/HBV infection. In future work, our simplified model can be augmented to address additional features such as immune response and uninfected and infected cell dynamics. Moreover, the previous models [12,13] can be further developed to account for the interplay between HDV and HBV incorporated in the new model presented in the current study.

Supplementary Materials

The following are available online at https://www.mdpi.com/article/10.3390/math9243323/s1, Table S1: Supplementary material to Figure 2—Digitized data for Patient 1, Table S2: Supplementary material to Figure 3—Digitized data for Patient 2.

Author Contributions

Conceptualization, H.D. and D.B.; methodology, R.Z., A.C., H.D. and D.B.; software, R.Z.; investigation, R.Z., A.C., W.B., M.L., H.D. and D.B.; writing—original draft preparation, R.Z., A.C., W.B., M.L., S.J.C., A.P., H.D. and D.B.; writing—review and editing, R.Z., A.C., W.B., M.L., S.J.C., A.P., H.D. and D.B.; supervision, A.C., H.D. and D.B.; funding acquisition, H.D., D.B. and A.P. All authors have read and agreed to the published version of the manuscript.

Funding

This research was funded by the NIH grants R01AI144112 and R01AI146917.

Institutional Review Board Statement

Not applicable.

Informed Consent Statement

Not applicable.

Data Availability Statement

The data presented in this study are available in the supplementary material (digitized data is provided in Tables S1 and S2).

Acknowledgments

R.Z. and D.B. would like to acknowledge SimReC—The research center for simulation in healthcare at Ben-Gurion University; and the Lynne and William Frankel Center for Computer Science at Ben-Gurion University.

Conflicts of Interest

The authors declare no conflict of interest. The funders had no role in the design of the study; in the collection, analyses, or interpretation of data; in the writing of the manuscript, or in the decision to publish the results.

References

  1. Noureddin, M.; Gish, R. Hepatitis delta: Epidemiology, diagnosis and management 36 years after discovery. Curr. Gastroenterol. Gastroenterol. Rep. 2014, 16, 365. [Google Scholar] [CrossRef] [Green Version]
  2. Chen, H.-Y.; Shen, D.-T.; Ji, D.-Z.; Han, P.-C.; Zhang, W.-M.; Ma, J.-F.; Chen, W.-S.; Goyal, H.; Pan, S.; Xu, H.-G. Prevalence and Burden of Hepatitis D Virus Infection in the Global Population: A Systematic Review and Meta-Analysis. Gut 2018, 68, 512–521. [Google Scholar] [CrossRef] [PubMed]
  3. Rizzetto, M.; Canese, M.G.; Gerin, J.L.; London, W.T.; Sly, D.L.; Purcell, R.H. Transmission of the Hepatitis B Virus-Associated Delta Antigen to Chimpanzees. J. Infect. Dis. 1980, 141, 590–602. [Google Scholar] [CrossRef]
  4. Rizzetto, M.; Hoyer, B.; Canese, M.G.; Shih, J.W.; Purcell, R.H.; Gerin, J.L. Delta Agent: Association of Delta Antigen with Hepatitis B Surface Antigen and RNA in Serum of Delta-Infected Chimpanzees. Proc. Natl. Acad. Sci. USA 1980, 77, 6124–6128. [Google Scholar] [CrossRef] [Green Version]
  5. Farci, P. Delta Hepatitis: An Update. J. Hepatol. 2003, 39 (Suppl. S1), 212–219. [Google Scholar] [CrossRef]
  6. Fattovich, G.; Boscaro, S.; Noventa, F.; Pornaro, E.; Stenico, D.; Alberti, A.; Ruol, A.; Realdi, G. Influence of Hepatitis Delta Virus Infection on Progression to Cirrhosis in Chronic Hepatitis Type B. J. Infect. Dis. 1987, 155, 931–935. [Google Scholar] [CrossRef] [PubMed]
  7. Fattovich, G.; Giustina, G.; Christensen, E.; Pantalena, M.; Zagni, I.; Realdi, G.; Schalm, S.W. Influence of hepatitis delta virus infection on morbidity and mortality in compensated cirrhosis type B. The European Concerted Action on Viral Hepatitis (Eurohep). Gut 2000, 46, 420–426. [Google Scholar] [CrossRef] [PubMed] [Green Version]
  8. Wedemeyer, H.; Yurdaydin, C.; Ernst, S.; Caruntu, F.A.; Curescu, M.G.; Kendal, Y.; Akarca, U.S.; Gurel, S.; Zeuzem, S.; Erhardt, A.; et al. 96 Weeks Of Pegylated-Interferon-Alfa-2a Plus Tenofovir or Placebo for the Treatment of Hepatitis Delta: The HIDIT-2 Study. Hepatology 2013, 58, 222A–223A. [Google Scholar]
  9. Heller, T.; Rotman, Y.; Koh, C.; Clark, S.; Haynes-Williams, V.; Chang, R.; McBurney, R.; Schmid, P.; Albrecht, J.; Kleiner, D.E.; et al. Long-term therapy of chronic delta hepatitis with peginterferon alfa. Aliment. Pharmacol. Ther. 2014, 40, 93–104. [Google Scholar] [CrossRef] [PubMed]
  10. Guedj, J.; Rotman, Y.; Cotler, S.J.; Koh, C.; Schmid, P.; Albrecht, J.; Haynes-Williams, V.; Liang, T.J.; Hoofnagle, J.H.; Heller, T.; et al. Understanding Early Serum Hepatitis D Virus and Hepatitis B Surface Antigen Kinetics During Pegylated Interferon-Alpha Therapy via Mathematical Modeling. Hepatology 2014, 60, 1902–1910. [Google Scholar] [CrossRef]
  11. Shekhtman, L.; Cotler, S.J.; Hershkovich, L.; Uprichard, S.L.; Bazinet, M.; Pantea, V.; Cebotarescu, V.; Cojuhari, L.; Jimbei, P.; Krawczyk, A.; et al. Modelling Hepatitis D Virus RNA and HBsAg Dynamics during Nucleic Acid Polymer Monotherapy Suggest Rapid Turnover of HBsAg. Sci. Rep. 2020, 10, 7837. [Google Scholar] [CrossRef] [PubMed]
  12. De Sousa, B.C.; Cunha, C. Development of Mathematical Models for the Analysis of Hepatitis Delta Virus Viral Dynamics. PLoS ONE 2010, 5, e12512. [Google Scholar] [CrossRef] [Green Version]
  13. Packer, A.; Forde, J.; Hews, S.; Kuang, Y. Mathematical Models Of The Interrelated Dynamics of Hepatitis D and B. Math. Biosci. 2014, 247, 38–46. [Google Scholar] [CrossRef]
  14. Asselah, T.; Loureiro, D.; Le Gal, F.; Narguet, S.; Brichler, S.; Bouton, V.; Abazid, M.; Boyer, N.; Giuly, N.; Gerber, A.; et al. Early Virological Response in Six Patients with Hepatitis D Virus Infection and Compensated Cirrhosis Treated with Bulevirtide In Real-Life. Liver Int. 2021, 41, 1509–1517. [Google Scholar] [CrossRef]
  15. Yurdaydin, C.; Keskin, O.; Kalkan, Ç.; Karakaya, F.; Çalişkan, A.; Karatayli, E.; Karatayli, S.; Bozdayi, A.M.; Koh, C.; Heller, T.; et al. Optimizing Lonafarnib Treatment for the Management of Chronic Delta Hepatitis: The LOWR HDV-1 Study. Hepatology 2017, 67, 1224–1236. [Google Scholar] [CrossRef] [Green Version]
  16. Kadelka, S.; Dahari, H.; Ciupe, S.M. Understanding the Antiviral Effects of RNAi-Based Therapy in HBeAg-Positive Chronic Hepatitis B Infection. Sci. Rep. 2021, 11, 200. [Google Scholar] [CrossRef] [PubMed]
  17. Koh, C.; Canini, L.; Dahari, H.; Zhao, X.; Uprichard, S.L.; Haynes-Williams, V.; A Winters, M.; Subramanya, G.; Cooper, S.L.; Pinto, P.; et al. Oral Prenylation Inhibition with Lonafarnib in Chronic Hepatitis D Infection: A Proof-of-Concept Randomised, Double-Blind, Placebo-Controlled Phase 2A Trial. Lancet Infect. Dis. 2015, 15, 1167–1174. [Google Scholar] [CrossRef] [Green Version]
  18. Reinharz, V.; Ishida, Y.; Tsuge, M.; Durso-Cain, K.; Chung, T.L.; Tateno, C.; Perelson, A.S.; Uprichard, S.L.; Chayama, K.; Dahari, H. Understanding Hepatitis B Virus Dynamics and the Antiviral Effect of Interferon Alpha Treatment in Humanized Chimeric Mice. J. Virol. 2021, 95. [Google Scholar] [CrossRef] [PubMed]
  19. Rohatgi, A. Webplotdigitizer: Web Based Tool to Extract Data from Plots, Images, and Maps. V 4.1. 2017. Available online: https://automeris.io/WebPlotDigitizer/ (accessed on 12 November 2021).
  20. Barash, D. Nonlinear Diffusion Filtering on an Extended Neighborhood. Appl. Num. Math. 2005, 52, 1–11. [Google Scholar] [CrossRef]
  21. Reinharz, V.; Dahari, H.; Barash, D. Numerical Schemes for Solving and Optimizing Multiscale Models with Age of Hepatitis C Virus Dynamics. Math. Biosci. 2018, 300, 1–13. [Google Scholar] [CrossRef]
  22. Williams, V.; Brichler, S.; Radjef, N.; Lebon, P.; Goffard, A.; Hober, D.; Fagard, R.; Kremsdorf, D.; Deny, P.; Gordien, E. Hepatitis Delta Virus Proteins Repress Hepatitis B Virus Enhancers and Activate the Alpha/Beta Interferon-Inducible Mxa Gene. J. Gen. Virol. 2009, 90, 2759–2767. [Google Scholar] [CrossRef] [PubMed]
  23. Da, B.L.; Heller, T.; Koh, C. Hepatitis D Infection: From Initial Discovery to Current Investigational Therapies. Gastroenterol. Rep. 2019, 7, 231–245. [Google Scholar] [CrossRef] [PubMed]
  24. Braga, W.S.; de Oliveira, C.M.; de Araujo, J.R.; Castilho Mda, C.; Rocha, J.M.; Gimaque, J.B.; Silva, M.L.; Vasconcelos, H.L.; Ramasawmy, R.; Parana, R. Chronic HDV/HBV Co-Infection: Predictors of Disease Stage—A Case Series of HDV-3 Patients. J. Hepatol. 2014, 61, 1205–1211. [Google Scholar] [CrossRef] [PubMed]
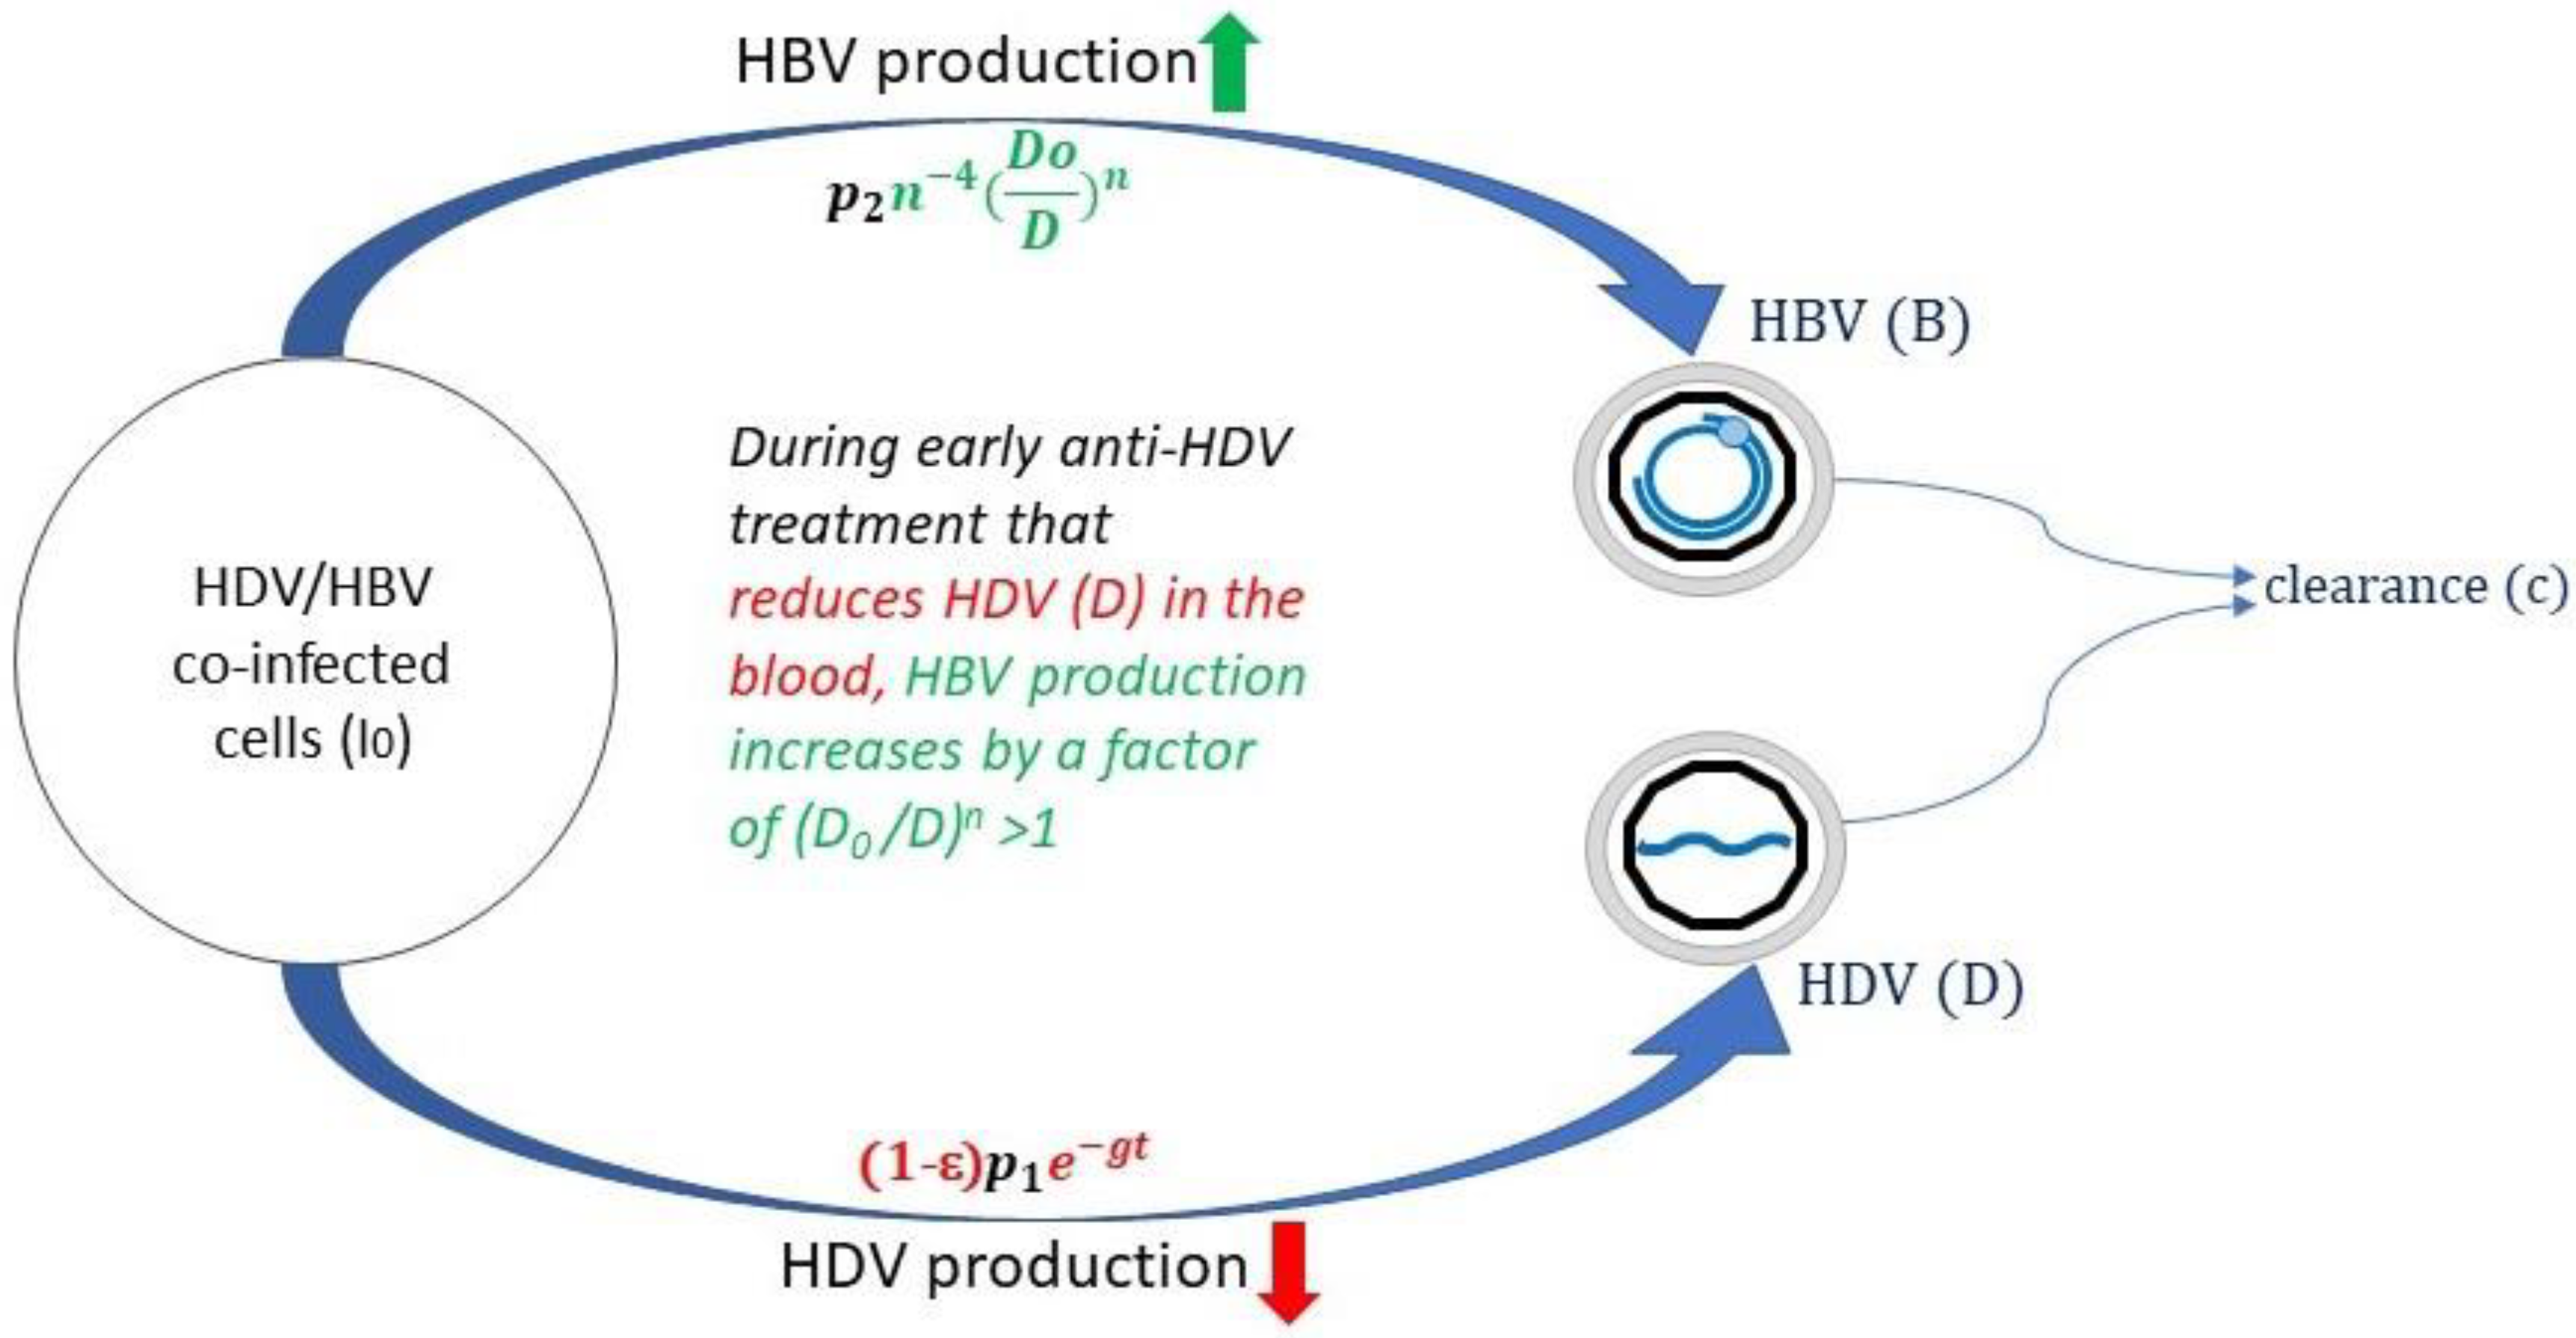
Figure 1. A schematic diagram of our new model. The figure relates to the phase where HDV declines and HBV increases.
Mathematics 09 03323 g001
Figure 2. Patient 1 HDV/HBV levels after LNF treatment initiation (first 28 days).
Mathematics 09 03323 g002
Figure 3. Patient 2 HDV/HBV levels after initiation of LNF treatment (first 84 days).
Mathematics 09 03323 g003
Table 1. The variables and the parameters in the model of de Sousa and Cunha [12].
x(t)the number of uninfected cells at time t
y1(t)the number of HBV-infected cells at time t
y2(t)the number of HDV-infected cells at time t
y3(t)the number of infected cells with both HBV and HDV at time t
v1(t)the HBV viral load at time t
v2(t)the HDV viral load at time t
λproduction rate of uninfected cells (day−1)
δdeath rate of uninfected cells (day−1)
b1infection rate of HBV-infected cells (day−1)
b2infection rate of HDV-infected cells (day−1)
d1death rate of HBV-infected cells (day−1)
d2death rate of HDV-infected cells (day−1)
u1clearance rate of HBV virions (day−1)
u2clearance rate of HDV virions (day−1)
k1production rate of HBV virions (day−1)
k2production rate of HDV virions (day−1)
k3production rate of HBV virions (?)
ηtherapy efficacy of inhibiting new virus infections as a result of virus clearance
εtherapy efficacy of inhibiting viral production from infected cells
Table 2. The variables and the parameters in the model of Packer et al. [6].
x(t)uninfected cells
y(t)HBV-only-infected cells
z(t)HDV-only-infected cells
w(t)HBV-HDV-coinfected cells
rmaximum proliferation rate (day−1)
Khomeostatic liver size (number of cells)
αinfected cells death rate (day−1)
cHBV inhibition coefficient
σHBV infection rate (day−1)
δHDV infection rate (day−1)
Table 3. The variables and the parameters of our new model (along with their units).
DHDV viral load (IU/mL)
D0HDV viral load before treatment (IU/mL)
BHBV viral load (IU/mL)
B0HBV viral load before treatment (IU/mL)
I0Number of HBV-HDV-coinfected cells
p1Production rate constant of HDV
p2Production rate constant of HBV
gAdditional treatment inhibitory effect in blocking HDV production (day−1)
εTreatment efficacy in blocking viral production (between 0 and 1)
nHBV exponent that governs the rate increase in HBV
cHDV and HBV clearance constant from blood (day−1)
Table 4. Model parameter values for Patient 1 and Patient 2 of [7].
B0D0gεnτc
Patient 129,5125.5 × 1050.0420.732.40.10.51
Patient 21482.2 × 1050.0230.823.80.10.51
Where it is noted that τ is the pharmacological delay (in days, patient-specific).
Publisher’s Note: MDPI stays neutral with regard to jurisdictional claims in published maps and institutional affiliations.