1. Introduction
The modern system for frequency and active power mode control in Russia should, to a great extent, agree with the international requirements [
1]. This is due to the need to create opportunities for expanding the wholesale electricity market.
The formation of interstate electrical connections and the creation of regional and continental interstate energy networks is a primary development trend of world energy [
2,
3]. The integration process gives rise to numerous interstate energy associations in America and Europe, Southeast Asia, and some regions of Africa. The promising possibilities of the global energy interconnection are considered at the conceptual level of [
2].
The most significant benefits that can be obtained through the integration of power systems are both technological and economic. First of all, the integration ensures a high level of reliability and fault tolerance, the ability to provide mutual assistance in emergency situations and a reduction in the overall maximum load on power systems. It also optimizes load distribution between power plants in order to reduce fuel consumption, optimize backup allocation and the use of generating facilities and primary energy resources.
To attain these and other advantages, it is necessary to ensure the synchronous operation of the Unified Energy System (UES) of Russia with power interconnections of other regions, in particular, Europe (UCTE and Nordel). This conclusion was made as early as 2008 as a result of a large-scale study undertaken by a group of experts from Russia and Europe [
4]. It was also noted that the synchronous unification is technically possible and very promising.
It should also be noted that in modern conditions, frequency and power regulation, which solves both general and local problems, requires the automation of technological processes and the involvement of various backup types, which also makes it necessary to improve the overall quality of regulation.
The AC frequency is an indicator of power quality in power system performance analysis. In Russia, power quality indicators and standards for 50 Hz three-phase and single-phase electrical networks of power supply systems are regulated by the inter-state standard [
5] at the points where networks are connected with other networks or with users’ equipment. According to the guidelines, the frequency in Russian electric grids must be maintained with an accuracy of ±0.2 Hz during 95% of the day. Short-term (up to 72 min per day) frequency deviation within ±0.4 Hz is admissible.
AC frequency is directly related with the rotation speed of the machines converting mechanical energy into electricity, i.e., generators, and the machines converting electricity into mechanical energy, i.e., motors. A change in the rotation speed, even a slight one, significantly affects the operating mode of the rotating mechanisms. It may result in poor performance of pumps and other rotating equipment.
Frequency is not only an indicator of the quality of electricity but also the most important parameter of the power system mode. The stability of electricity production, the inability to store energy and the permanent change in consumption require respective continuous monitoring of the balance between production and consumption. Frequency is just the parameter characterizing this correspondence.
The frequency in a power system is determined by the overall balance of generated and consumed active power. There are models developed for maintaining energy supply and demand. For example, in [
6], such a model is presented for a micro smart grid containing equipment whose power consumption could be controlled. However, in the conditions of the UES of Russia, where most consumers need a permanent power supply, such models could not be applied. In [
7], such aspects of energy system security are addressed as energy loss and energy consumption by unauthorized users. These problems, unfortunately, still take place in the UES of Russia too and could also lead to frequency fluctuations.
If the balance between the energy supply and demand is maintained, then the frequency is unchanged. When the power balance is off, a frequency transient occurs. The rate and direction of the frequency change can be used for judging the magnitude and sign of the active power imbalance.
If the frequency in the power system decreases, then in order to restore the nominal frequency, it is necessary to increase the active power, which, in the power system, is carried out by a variety of power plants whose generating equipment meets certain certification requirements. The frequency control process in the power system is divided into three interrelated steps:
primary frequency control (PFC), which ensures frequency stability, i.e., the admission of frequency deviation only within the specified limits in case of power balance violation in any part of the power system;
secondary regulation ensuring the restoration of the normal frequency level and planned modes of power exchange between the power system parts or the country regions;
tertiary regulation, which can be understood as the operational adjustment of regional power balances in order to provide mutual assistance of regions and prevent dangerous overloads of interregional power lines.
PFC is carried out by regulatory speed controllers of turbines. Each turbine is equipped with a speed controller. When the turbine unit’s speed is to be changed, the speed controllers of its turbines take action and affect the respective handles (such as extraction valves of heat turbines or guide vanes of hydraulic ones), thus changing the intake of the energy carrier (steam or water). When the rotational speed increases, speed controllers decrease energy carrier intake, and when the frequency falls, they increase it respectively. The increase in power is proportional to the rated power of the unit and depends on the constant-error response. If it is necessary for the unit to take a greater part in the primary frequency control, it is necessary for this unit to have more power and a lower constant-error response.
The regulation process is also significantly affected by the speed controller’s dead band, which aims at filtering small high-frequency load fluctuations. The primary control’s dead band is the maximum span of the turbine speed change relative to its initial value (both for increase or decrease), at which the participation of the generating equipment in the primary control is not guaranteed.
The power consumed by various types of electrical receivers depends on the frequency in different ways. For example, the power consumed by filament bulbs and other thermal appliances almost does not depend on the frequency. However, the power consumed by electric motors of metal-working machines, pumps, or fans is highly frequency dependent.
With the increase in the load power, the frequency decreases; then, due to the response of automatic turbine speed governors, the generated power increases, and the power balance is restored, but at a reduced frequency. The steeper the curve of the generation characteristic is, the more effective is the primary control, and the less is the frequency deviation from the target, i.e., the more stable is the frequency in the power system.
Maintaining the frequency of the power system is important in terms of both the power quality and the stability of the entire power system operation as a whole. Therefore, it is important to control not only the participation of generating equipment in the frequency control process but also its operation performance. Frequency control in a power system is a complex distributed process. Its quality is affected by many things on both the generation and consumption sides.
According to [
5], the identification of the power plant or unit participation in the general primary frequency control (GPFC) is carried out when frequency deviations exceed 0.2 Hz. A qualitative assessment of the generating equipment’s participation in the GPFC is carried out in the cases of severe frequency deviations in the UES (in the range from 0.05 to 0.2 Hz).
Unfortunately, many generating facilities of many Russian thermal power plants (TPP) still do not participate in the primary control. Due to their large number (about 2000), the expert assessment of the participation in the GPFC is rather laborious. Therefore, the identification of generation guideline violations should be carried out regularly and in automatic mode.
In literature, different aspects of PFC itself are mostly considered [
8,
9,
10], while the assessment of the degree of different power units’ participation in PFC is rarely discussed. A tool [
11] based on regression analysis was developed for the U.S. Department of Energy for the purpose of frequency response performance analysis. In this paper, we propose an algorithm for assessing the degree of participation of the generating facilities in the GPFC based on the analysis of cases of abrupt and relatively large frequency deviations in the power system.
The algorithm employs identification techniques based on inductive learning. The analysis procedure enables the assessment of the degree of generating facilities’ participation in the GPFC using frequency and power time series. The technique allows the algorithm to rank generation facilities according to the probability of regulation violations.
For assessing the participation degree of various power plants in the GPFC, the System Operator (SO, the Central Dispatch Office of the Russian Unified Energy System) has an archive of frequency and power realizations over a time span around the significant frequency jump. Only this scanty information far from all pieces of equipment can be obtained in the automatic mode.
Therefore, it is important for the SO to obtain an estimate of the participation degree of the generating equipment in the GPFC. The estimate should be sufficiently reliable for further expert analysis of the power system’s state.
The influence of various power system’s elements on each other is carried out through common power distribution channels and is expressed as a statistical relationship between their output characteristics. The model allows for the influence of the units’ power on the power grid frequency. The paper also discusses the state assessment of the generating equipment in terms of the compliance of its parameters with the requirements related to possible participation in PFC.
The participation of a specific power unit in the PFC is determined by a set of parameters that can change during the operation. If the characteristics of the equipment do not meet the requirements, this can result in stability loss of the entire power system during significant frequency fluctuations. Therefore, the diagnostics of the current state of the units, as well as the predictive diagnostics, are relevant for the operation of the whole power system.
Today, there is only one diagnostic technique: the control test. It requires temporary withdrawal of the equipment from the generation and is thus too expensive. For example, the results of such tests for photovoltaic power plants are presented in [
12]. The tests were performed for a new type of generating facilities before the beginning of its exploitation, so the problem of the unit withdrawal from the generation did not exist in this case.
A methodology has been developed for automatic remote diagnostics of the readiness of generating facilities for PFC. The power units’ responses to significant frequency jumps are analyzed based on the real-time operation statistics with the case study of thermal generating plants.
In the paper,
Section 2 presents the algorithm for identifying the degree of generating equipment participation in the PFC.
Section 2.1 provides a description of the algorithm, and
Section 2.2. is devoted to the description of the use of identification models in the operation of the System Operator of the UES of Russia.
Section 3 sets out a methodology for determining the availability of power plants generation equipment in the GPFC. The advantage of this technique, based on the use of a knowledge base and real-time identification models, is noted in comparison with the frequently conducted expensive control tests.
2. The Algorithm for Identifying the Degree of Generating Equipment Participation in the PFC
Power system’s behavior is nonlinear. To analyze its operation, an identification algorithm with continuous self-tuning in real-time based on virtual models is, therefore, used [
13].
2.1. Knowle Base Identification Algorithm
At any time instant selected for the analysis, a new model is created (instead of approximating the real process in time). To build the model, a temporary database of historical and current process information is formed. After the output value is predicted on the basis of the plant’s current state, the virtual database is deleted without storing.
The linear dynamic model is as follows:
where:
is the forecast of the object’s output at the time instant . For this task, the frequency is considered as the output; is the input vector (its components represent the powers of specific generating units), m is the memory depth at the output, n is the memory depth at the input and S is the dimension of the input vector.
The identification algorithm consists of creating, at each time instant, an approximating hypersurface of the space of input vectors and the corresponding one-dimensional outputs. For building a virtual model for a certain instant, input vectors are selected from the process history, in a certain sense, close to the current input vector. The proximity criterion for vector selection is described below. Then, based on the least squares method, the output value at the next time instant is calculated.
It should be emphasized that such an algorithm does not build a single approximating process model. Rather, it builds a new model for each time instant, being, at the same time, an effective identification algorithm since the parameter estimates at any moment are the best ones subject to the mean square error. Moreover, each point of the global nonlinear regression surface is obtained as a result of applying linear “local” models.
Unlike classical regression models, for each fixed time instant, input vectors are selected from the process history. They are close to the current input vector subject to a certain criterion (and not in chronological sequence). Thus, in Formula (1), n is the number of vectors from the archive (from instant 1 to the instant N) selected by the associative search criterion.
At each time interval {N − 1, N}, a certain set of n vectors is selected, 1 ≤ n ≤ N. The criterion for selecting input vectors from the archive for building a virtual model at a specified time instant based on the current plant’s state can look as follows.
As the distance (norm in
) between the points of the
S-dimensional input space, we will take the value:
where
are the components of the input vector at the current time instant
N. According to the triangle inequality, we have:
For the current inputs vector
, let:
To construct an approximating hypersurface for
, let us select from the input data archive such vectors
that, for some given
, meet the following condition:
where
can be selected, for example, according to the condition:
If there are not enough inputs in the selected area for the LSM application, i.e., the corresponding system of linear equations turns out to be insoluble, then the criterion chosen for points selection in the input space can be weakened by increasing the threshold .
The proposed procedure for constructing the approximating surface is faster than the usual search since the values
All time instants preceding N can be determined and ranked once at the training stage, and, as a new input arrives, the series is replenished with a new term.
The indices of specific units’ participation in the PFC for each specific case of a significant frequency deviation are calculated as follows.
Let
P types of generating facilities (thermal, nuclear, hydroelectric power plants, a more detailed categorization is possible) be analyzed:
A specific nonlinear model is built for each generating facility type:
where
is the frequency value,
is the number of units of the given (
p-th) type and
j is the number of frequency and power readings (“realizations”) underlying the model.
The model is developed using identification algorithms based on virtual models and the associative search procedure described above.
Further, the model is reduced to a normalized form:
where
is the normalized frequency realization,
are the coefficients of the normalized model and
are the normalized power realizations. Normalized values are understood as values with zero mathematical expectation and unit variance.
The coefficients of the normalized model allow for the normalized relationship between the units’ power and the power system’s frequency. These coefficients can be used for assessing the participation degree of specific units in GPFC.
For analysis purposes, all generating facilities can be ranked according to the values of these coefficients. Thus, we have obtained a quantitative assessment of the units’ participation in the GPFC process.
2.2. Application
On the basis of this algorithm, a software package was developed, “Software analyzer of the dynamics of the generation facilities participation of the global power system in the GPFC based on associative search methods”, used in practical work of the Scientific and Technical Center of the Federal Grid Company for the Russian System Operator of the Unified Energy System. This software product allows using real data coming from the power system to assess the degree of participation of the units in the GPFC.
The operation of the complex was tested on several test examples. The behavior of 198 aggregates of various types was analyzed. Of these, the program noted 15 units as participating in the GPFC. Four aggregates were mistakenly marked in terms of participation rates. Additionally, not a single unit has been identified that participated in the GPFC and was not marked with the algorithm.
Thus, we can state the high (according to the data of the experiment) reliability of screening out the aggregates that did not participate in the GPFC using this software package.
The system’s operation is illustrated by the following example.
At some point, there was an unplanned shutdown of a power unit at an A-plant in Central Asia, which resulted in a frequency drop. In accordance with the contractual obligations, several power plants of the Unified Energy System of Russia had to change the level of generated power in order to stabilize the frequency.
As a result of the historical data analysis, the following coefficients of the actual participation of various power plants in the GPFC were calculated:
PG_254 − 0.762260488917587
PG_1207 − 0.551220204012048
PG_1183 − 0.806588013032245
PG_1189 − 0.737848317382276
PG_4058 − 0.815849216795668
PG_9594 − 0.594723789365262
PG_9600 − 0.739532909645267
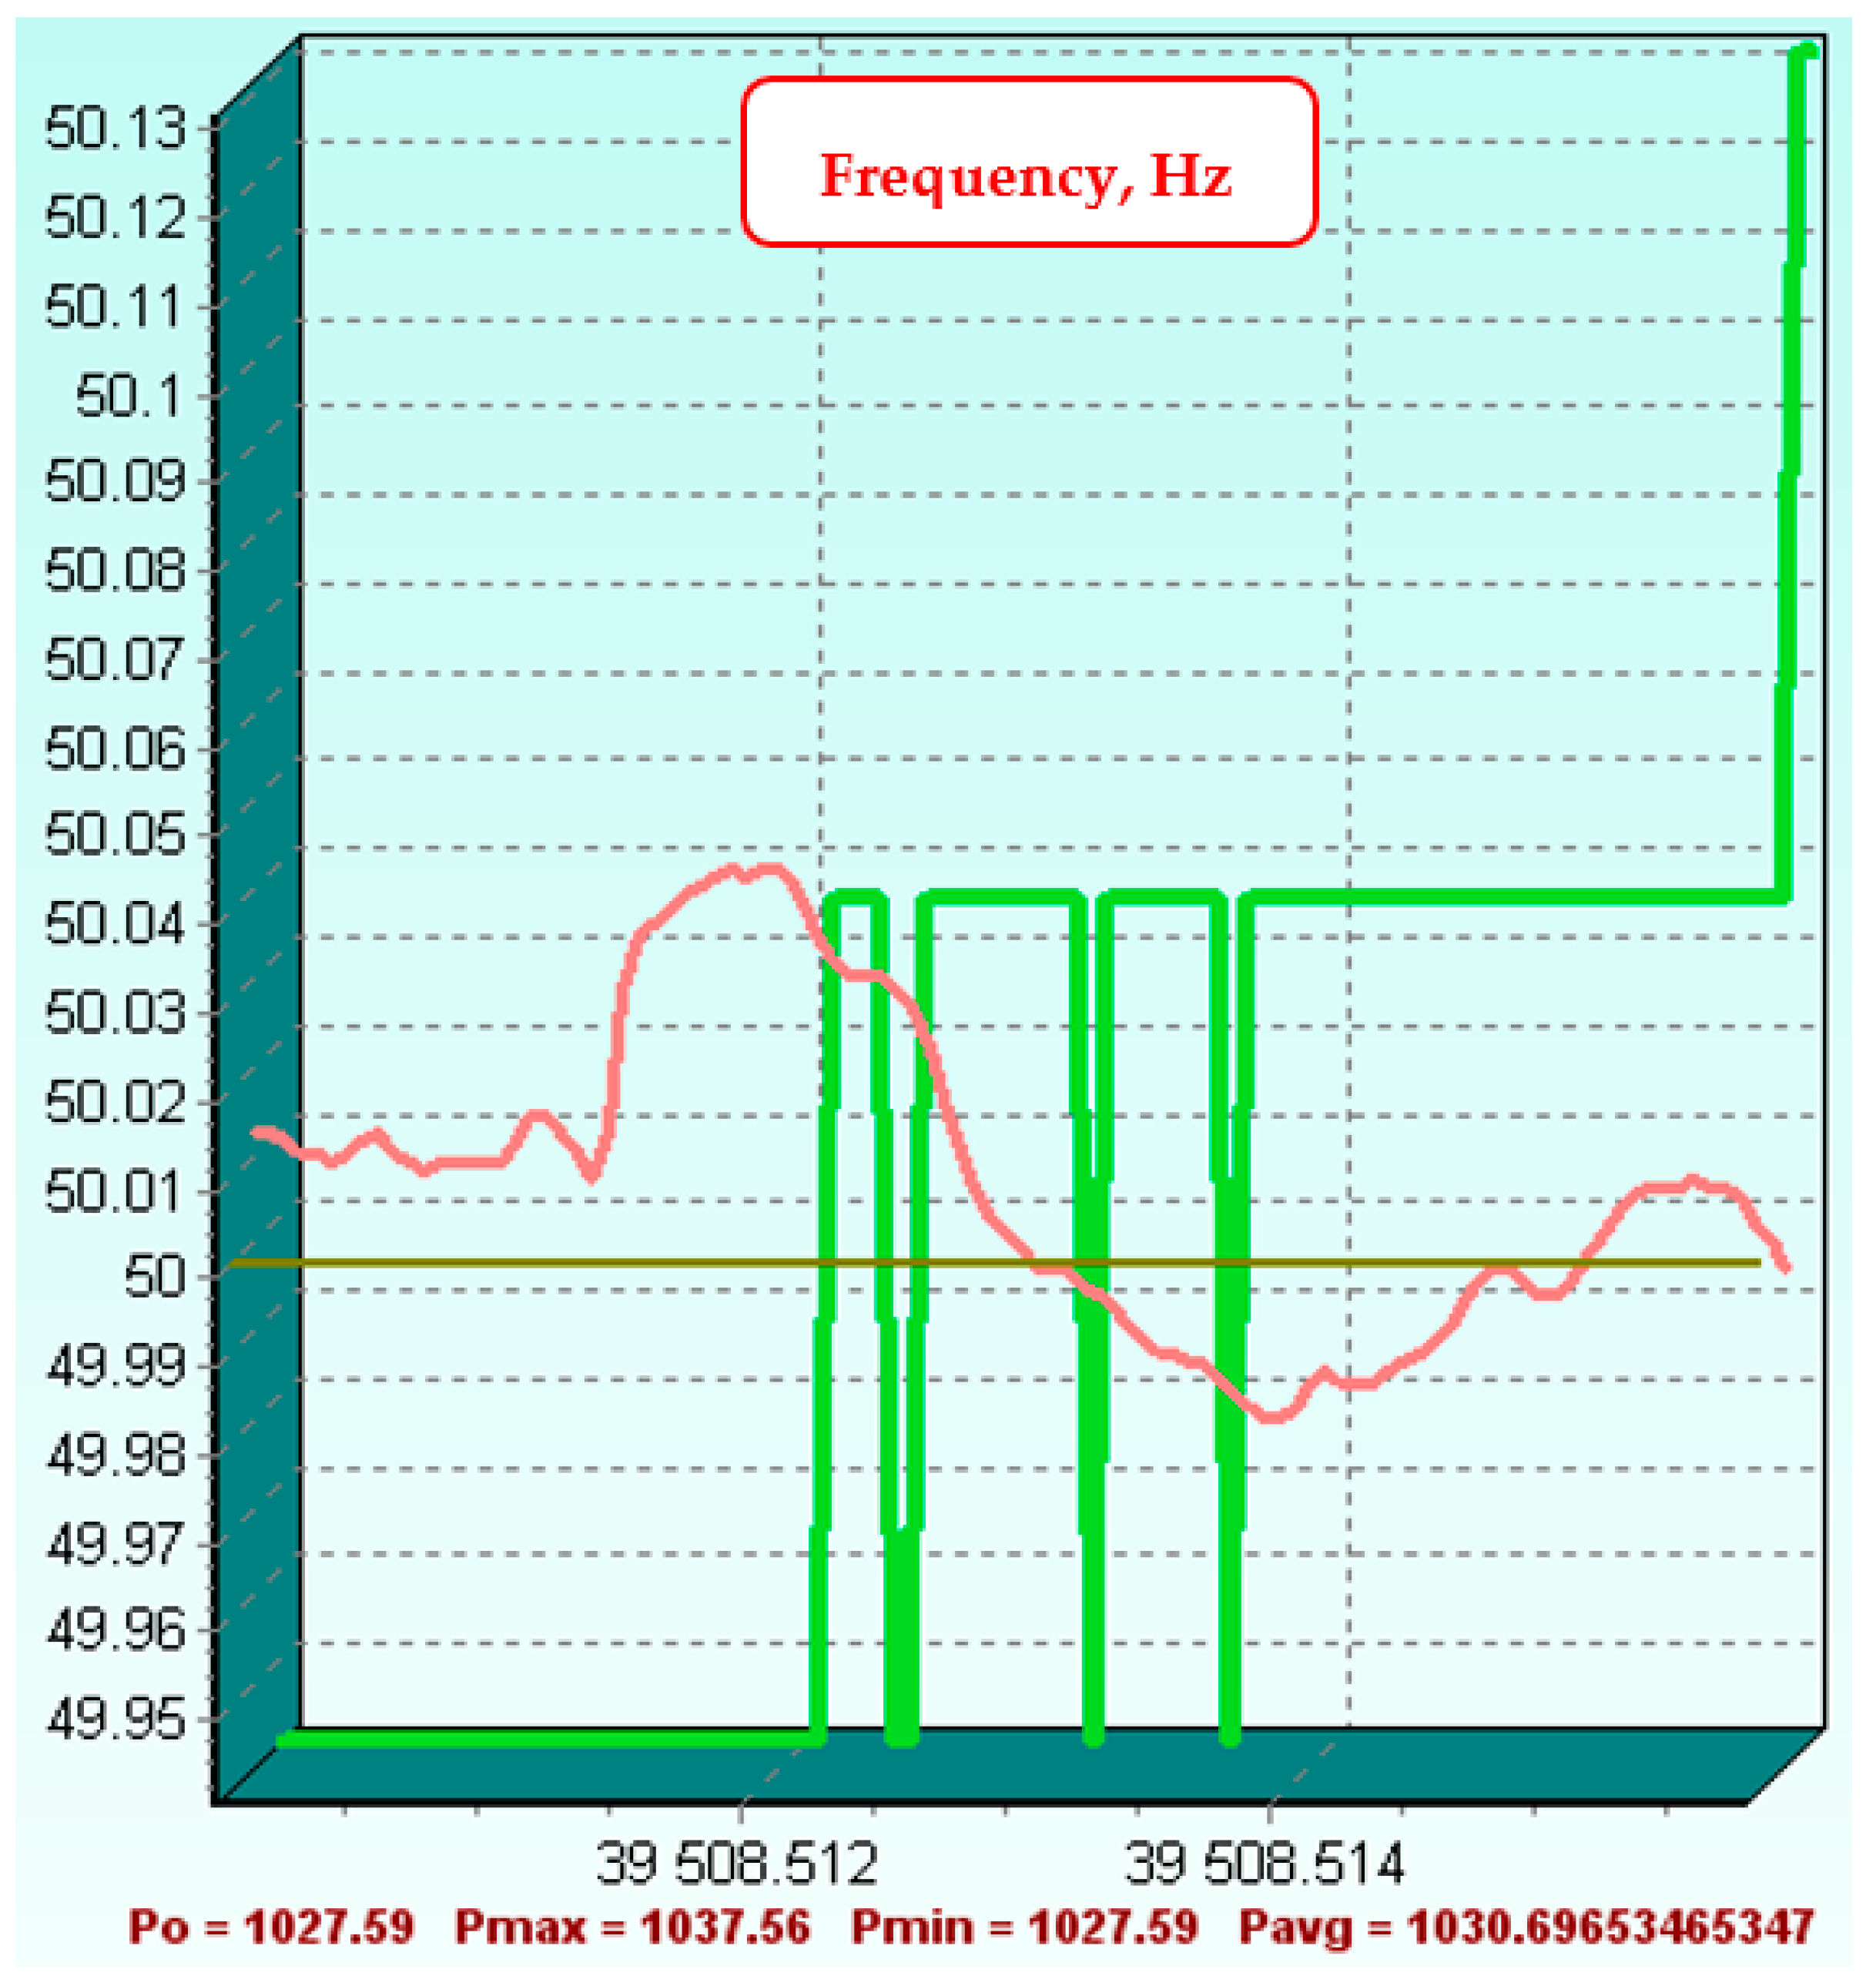
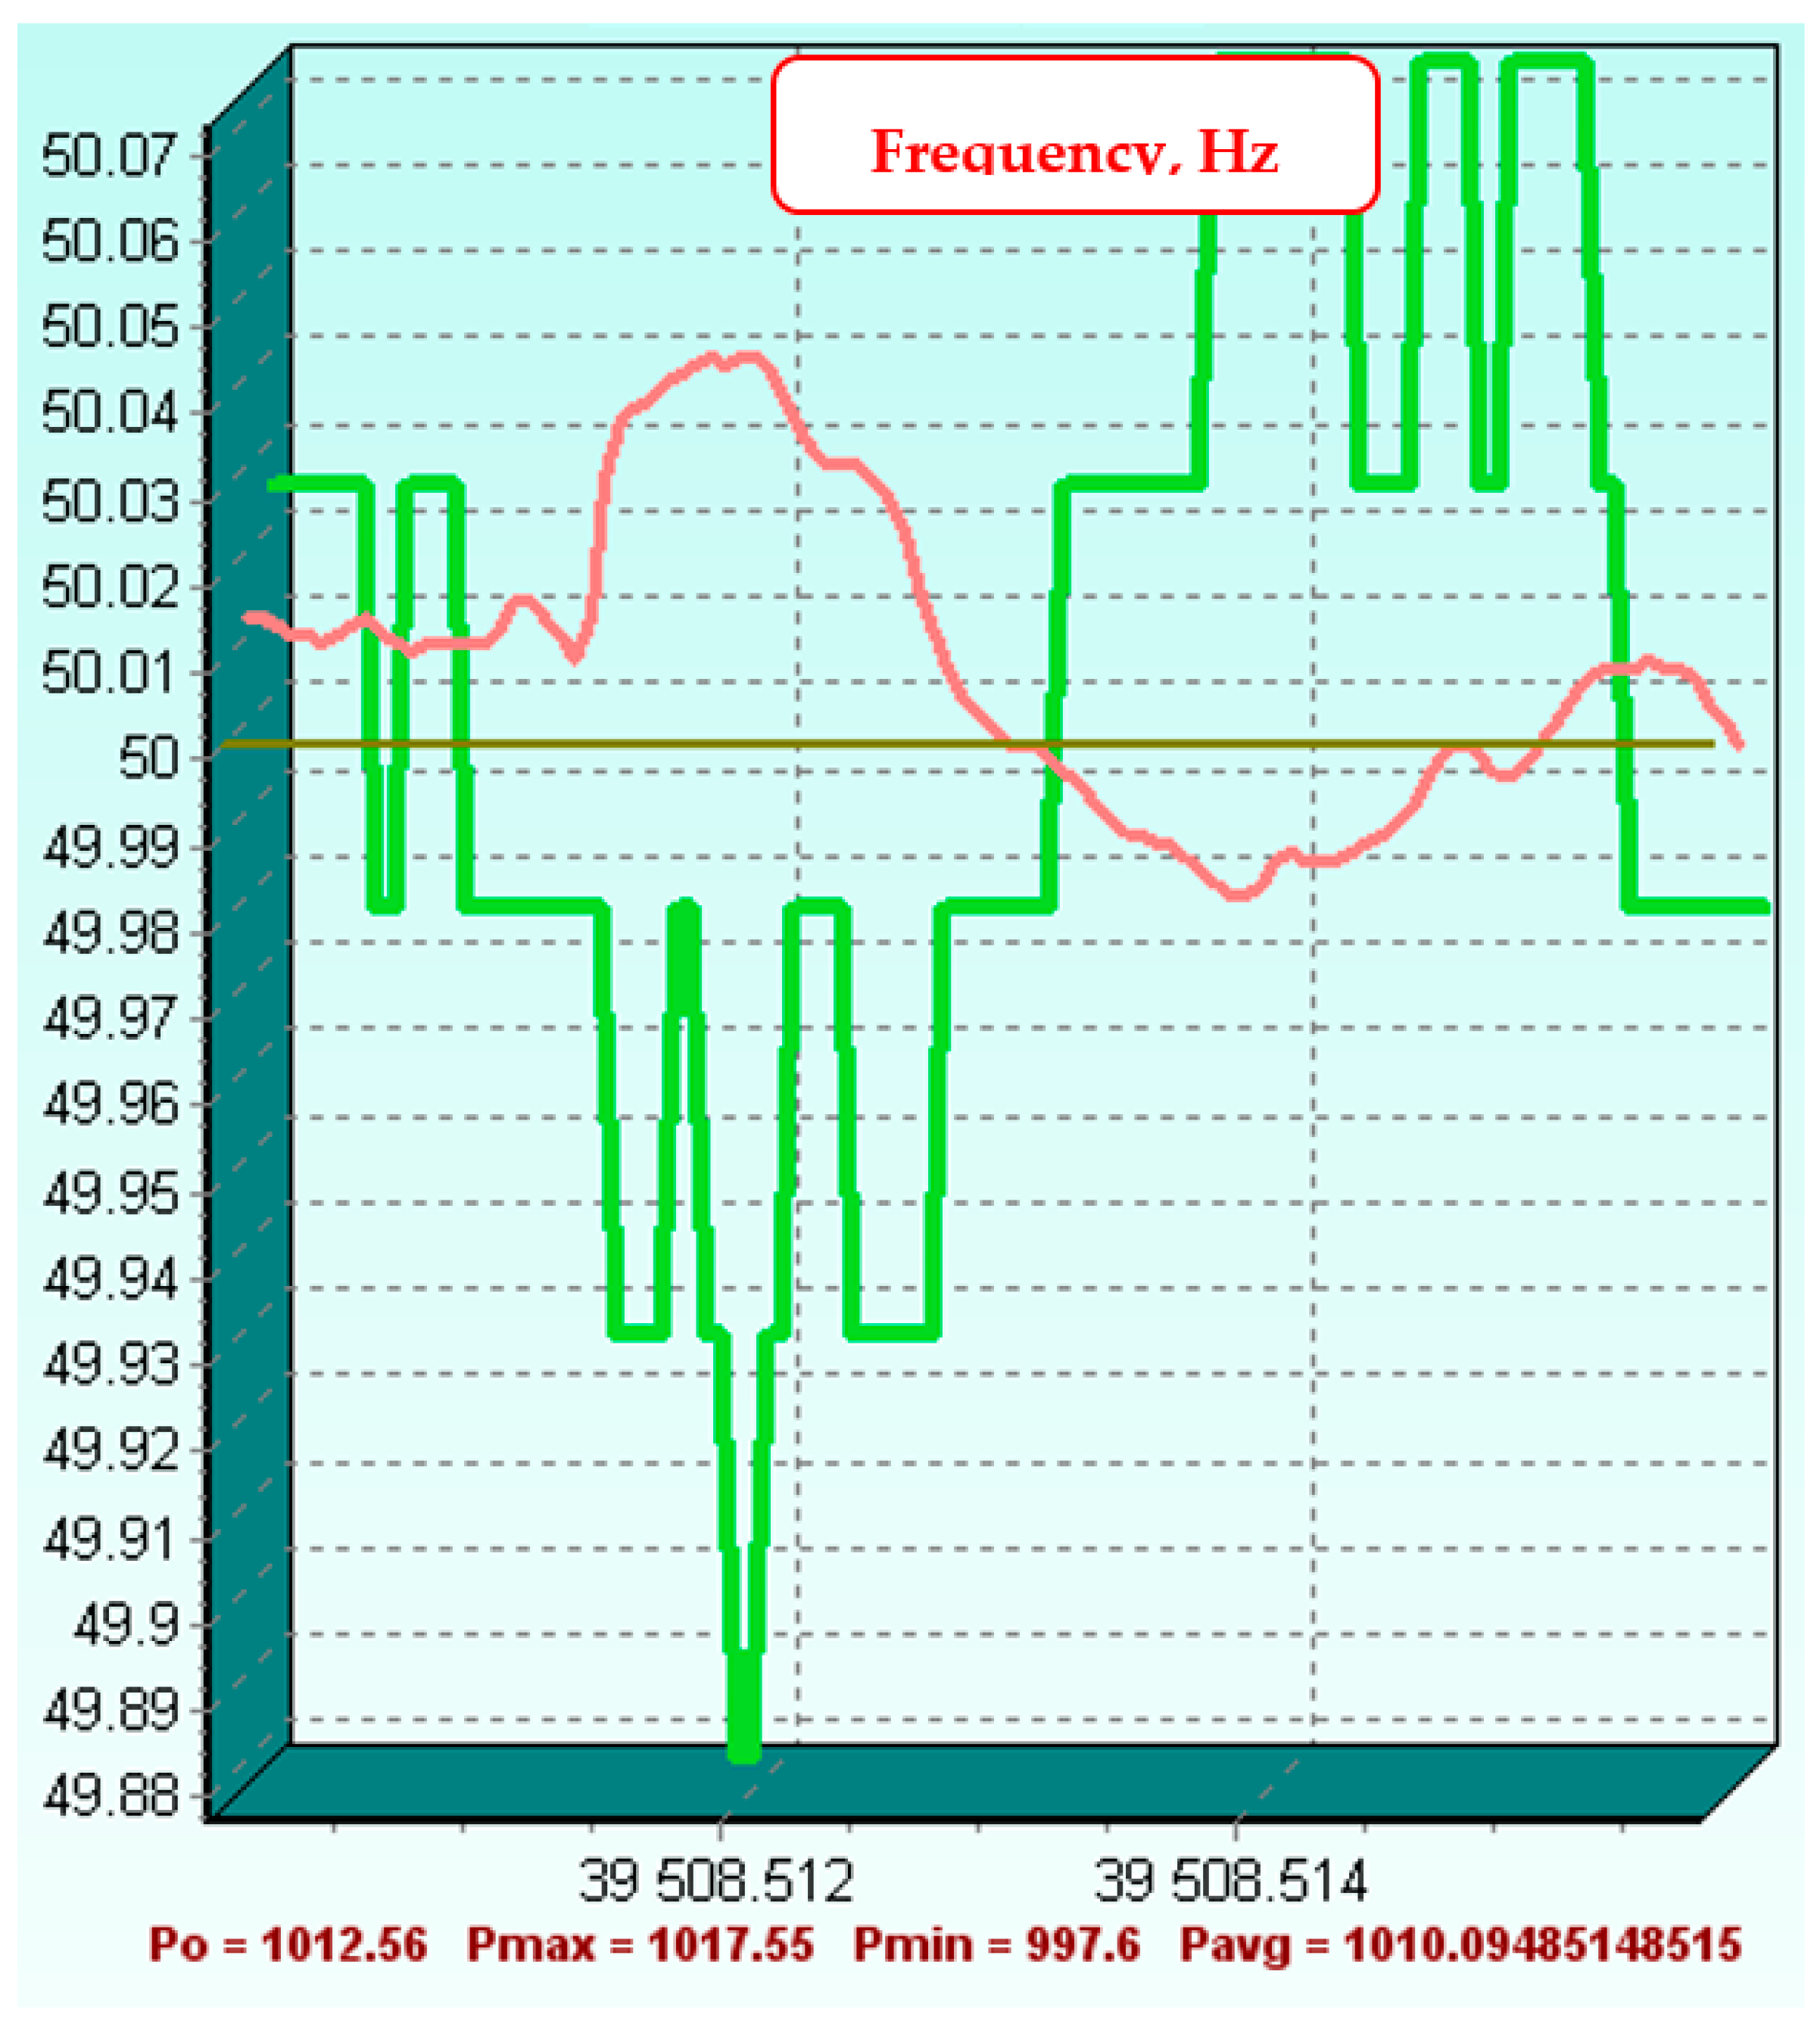
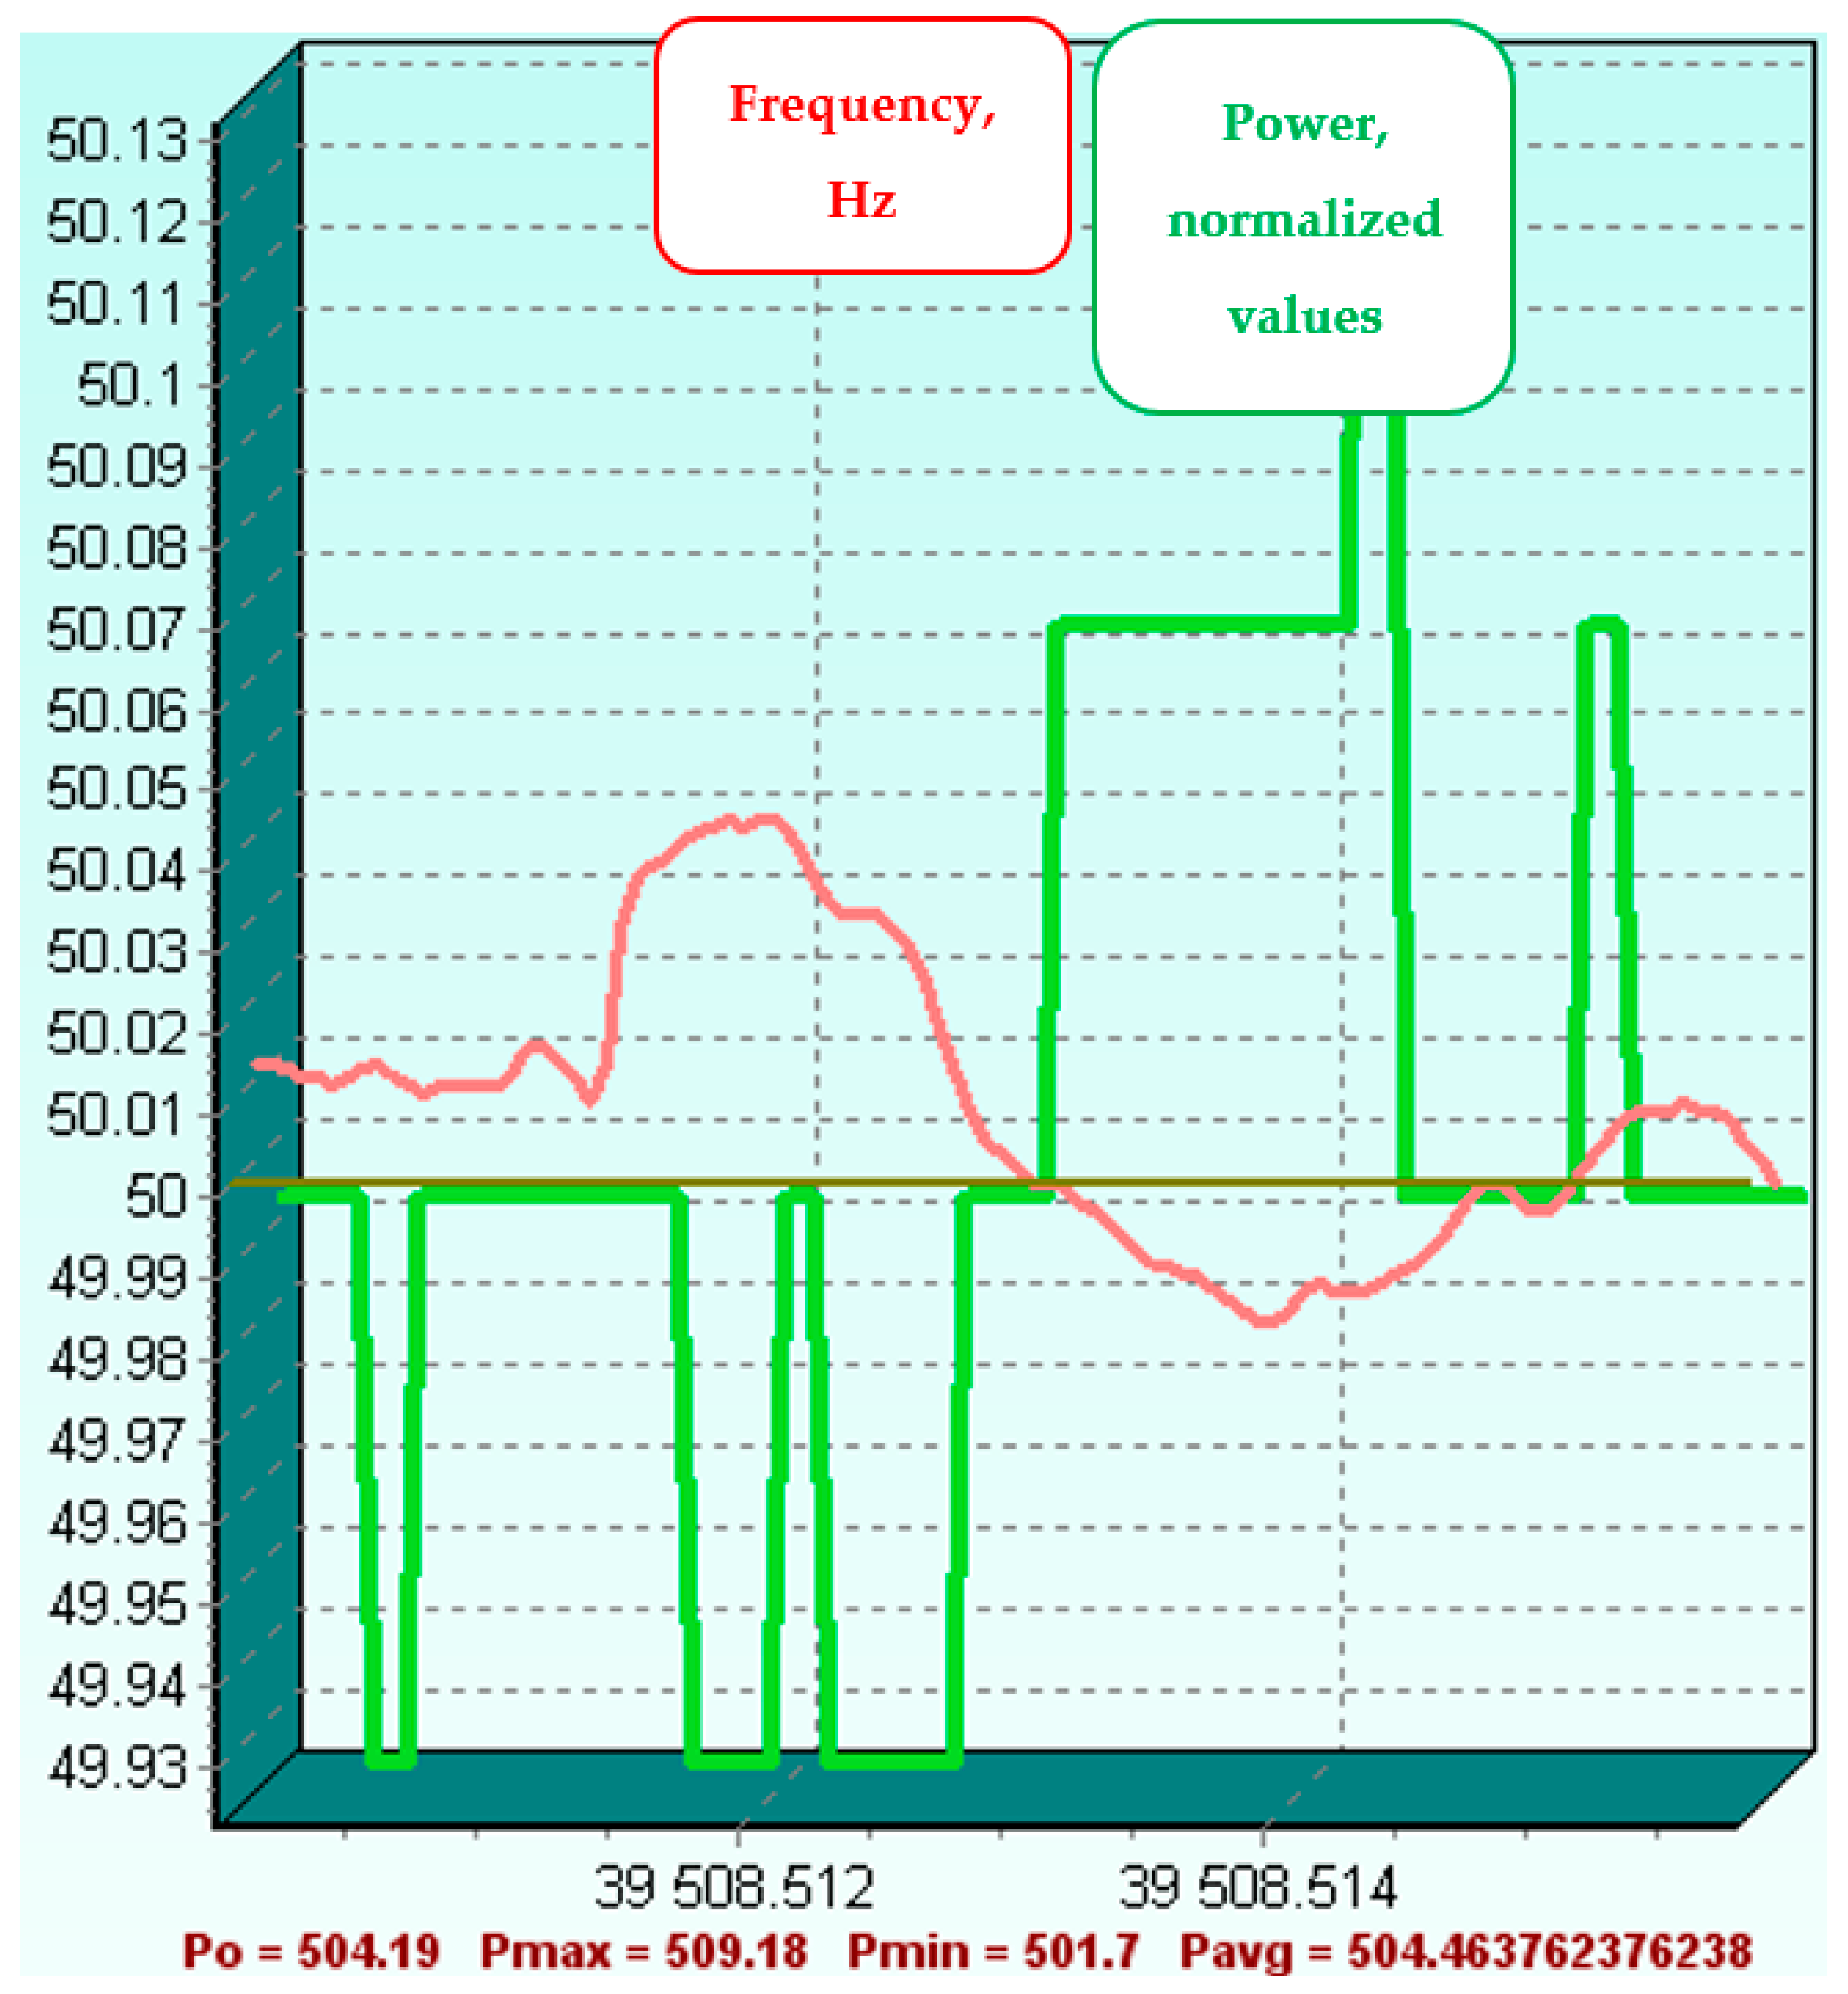
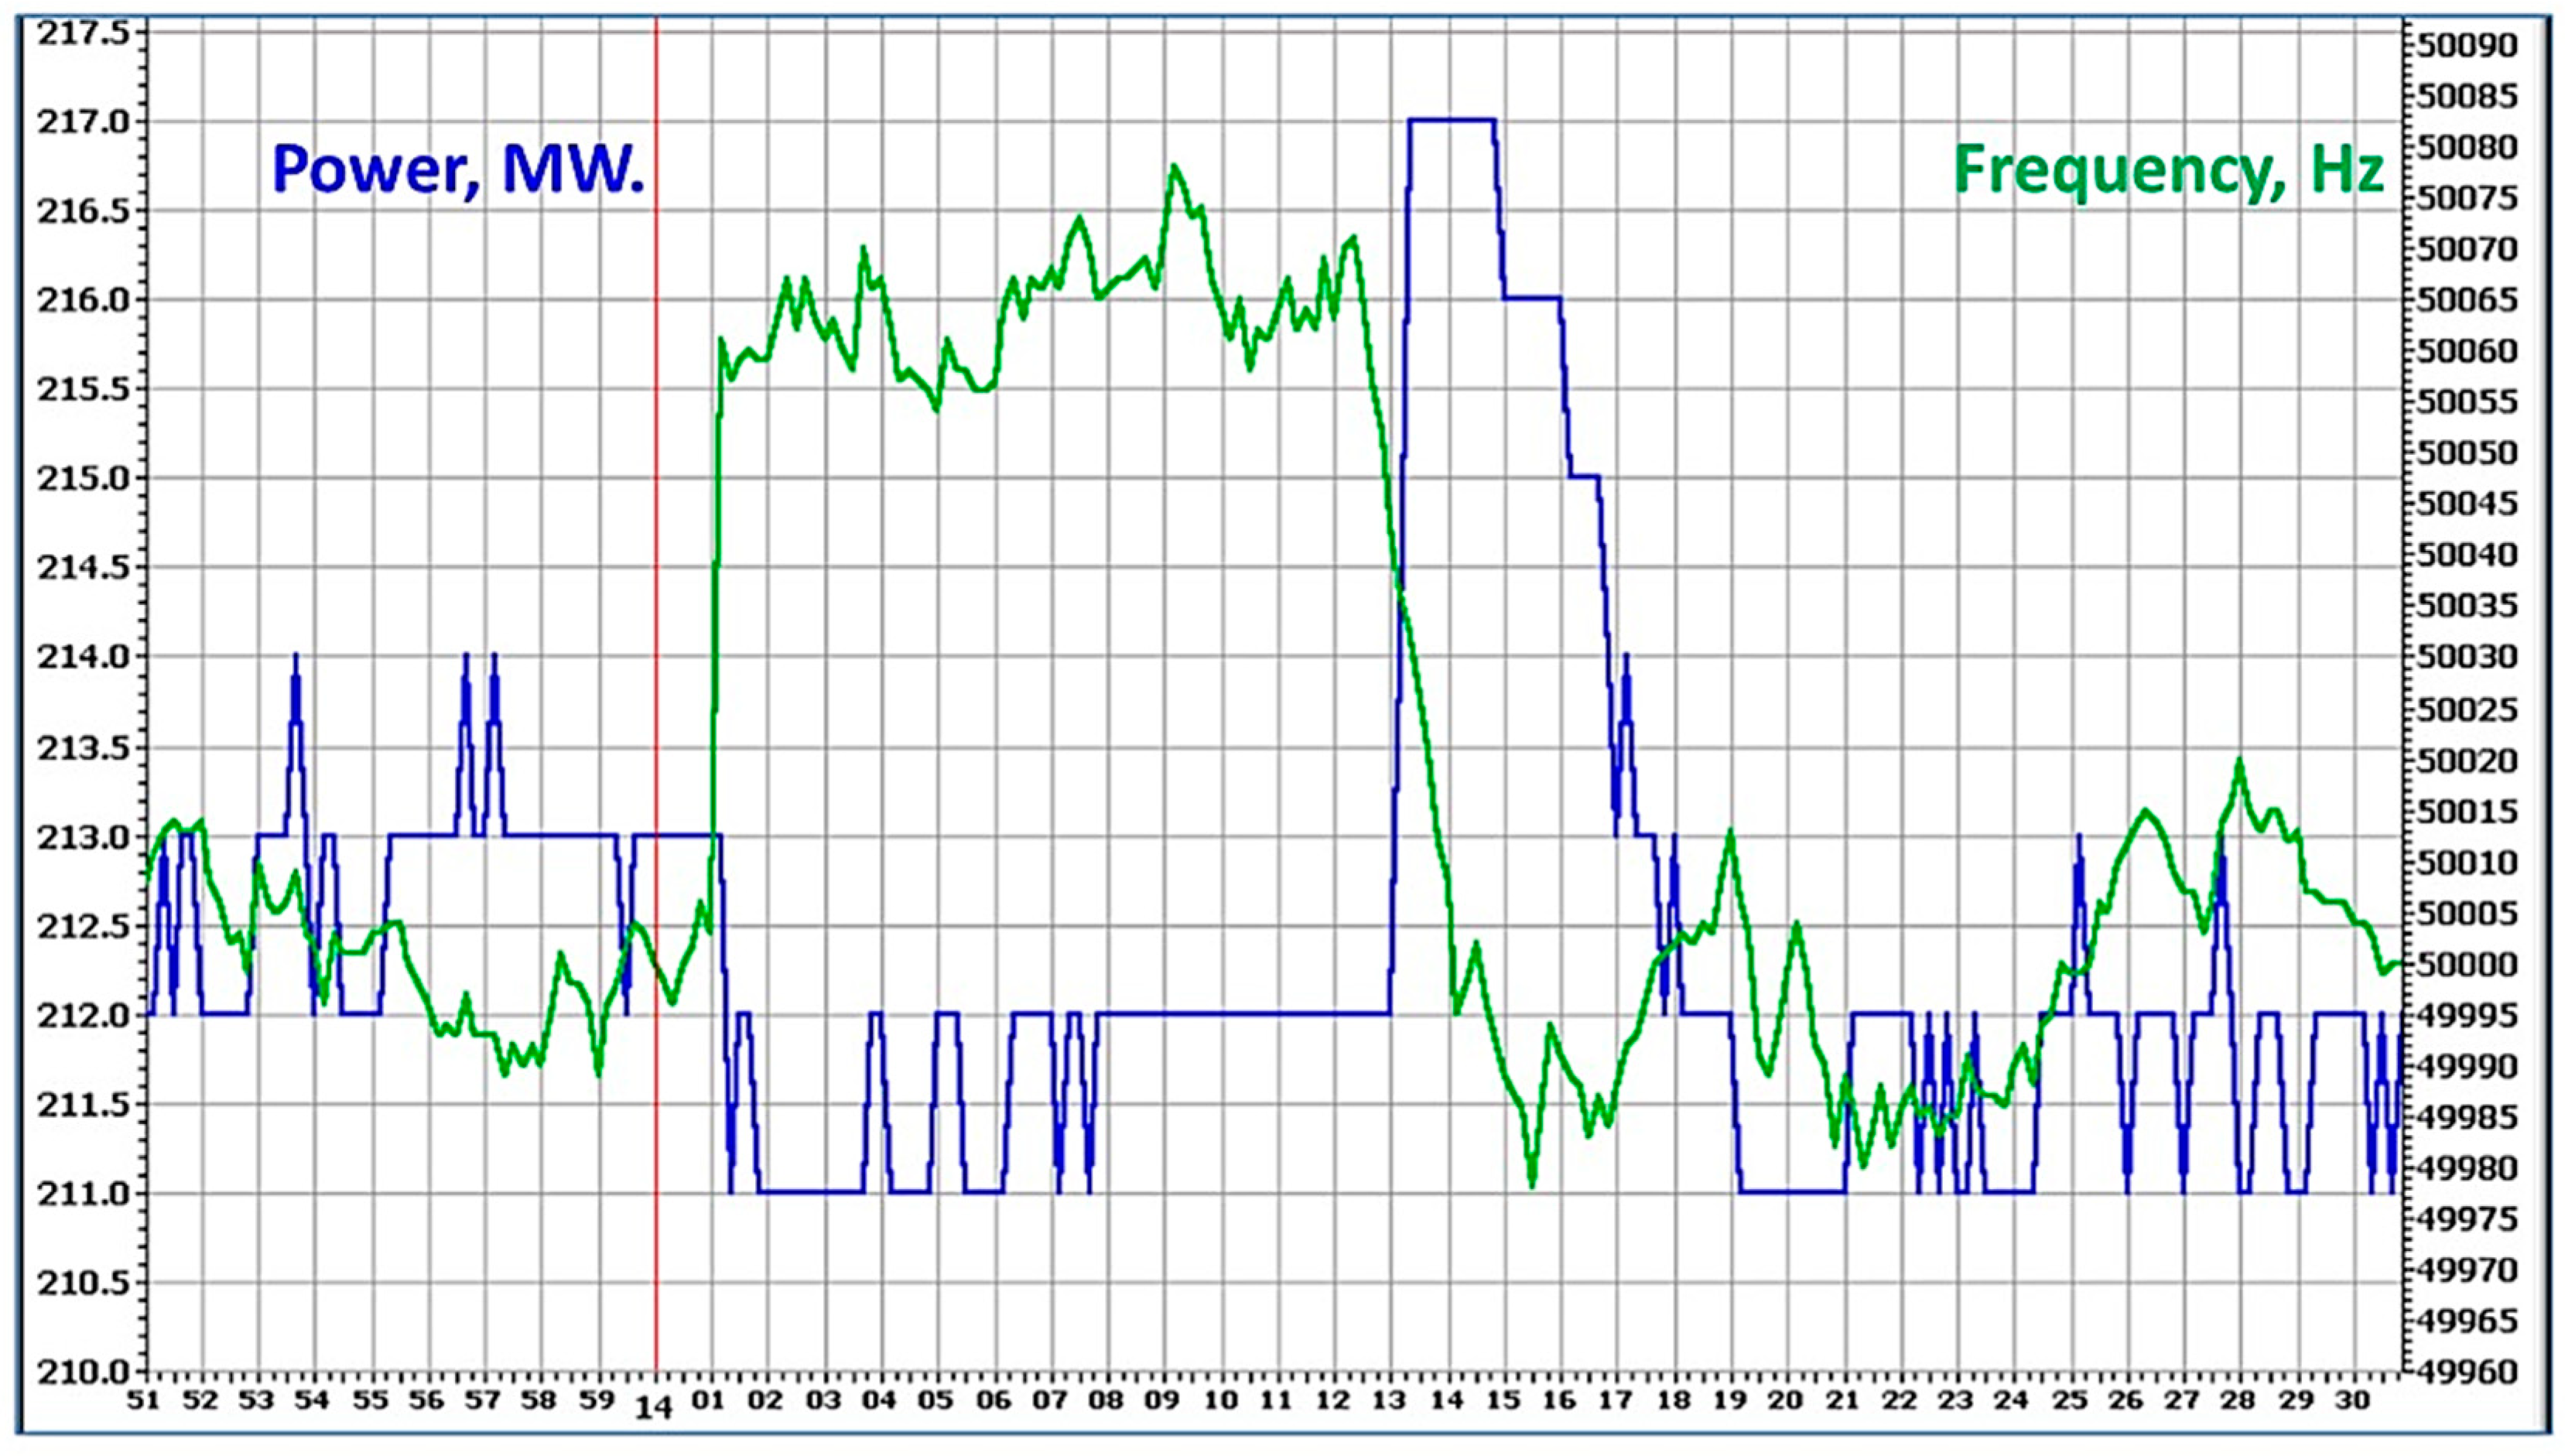
The operation of these power plants for the corresponding time lag is shown in
Figure 1,
Figure 2 and
Figure 3. For clarity, the diagrams also show the system’s frequency dynamics (red line). Power dynamics (green line) are presented in conventional units.
The initial (prior to the incident, P0), maximum (Pmax), minimum (Pmin) and average (Pavg) values of the power generated by this unit over the investigated time lag are also provided.
The analysis of the graphs showed that one of the analyzed units, namely PG_1207, did not participate in the GPFC.
In total, the work of 45 power units was analyzed. Two units were noted that generated less power than was contracted. The analysis of the operation of all other units showed that the system has not missed any units that had participated in the GPFC.
3. Intelligent System Development for Assessing and Predicting the Current State of Generating Facilities Based on Process Data Mining
General primary frequency control in the UES of the Russian Federation should be carried out by all power plants of the power grid by adjusting the power with the help of base-level controls, such as the turbine speed governor, available handles of steam boilers, A-plants, etc. Normalized primary frequency control should be carried out by the dedicated power plants (or their dedicated power units) that have the required technical characteristics.
During the operation, the equipment state may change. Purposeful changes of the controller settings are also possible in order to attain additional benefits by decreasing the degree of the facility’s participation in the GPFC against the contract target.
In the previous section, the algorithms were proposed for assessing the participation of individual generating facilities in the GPFC. Such an assessment can only be used to identify gross violations of process guidelines. For the stable operation of the power system, in addition to the participation, it is necessary to be able to assess and predict the state of generating facilities in terms of the quality of their participation in the GPFC process.
Currently, the assessment of the equipment state is carried out mainly when the equipment is put into operation or after major repairs. For this purpose, control tests are carried out according to specially approved procedures. It is practically impossible to carry out such tests in the course of plant operation because they require long-term equipment withdrawal from the generation process. Moreover, the testing is quite expensive. Therefore, re-testing is carried out only in exceptional cases.
We propose a methodology for the development of an intelligent system for assessing and predicting the current state of generating equipment in terms of the readiness of this equipment to participate in the PFC. The use of such a system created on the basis of process data mining will provide effective support for the power system mode control during large frequency deviations. The use of such a system will enable equipment state assessment based on the design operation data in near real-time without expensive control tests.
3.1. Control Tests. Methodology and List of Parameters for Recording
Control tests of the power plant for its readiness to participate in the primary frequency control (PFC) include:
The generating equipment should meet the following basic requirements:
over the specified regulatory load range, a power plant’s/power unit’s operation modes should allow maintaining the primary control range (PCR) within 20% of the rated power;
with a single change in the power of the turbine unit within the PCR by ±10% of the rated power under the impact of the speed controller, the transient process must comply with a specified guideline.
The readiness of certain generating facilities to participate in the primary frequency control (PFC) is determined [
5] as a result of testing the PFC of the units: control tests for the units of the general PFC and certification tests for the units of the normalized PFC. During the tests, the correspondence of the transient responses of the primary power of the controlled units, obtained as a result of experiments, to the rated transient responses is checked under frequency disturbances of the power system.
Compliance of the “experimental” transient response of the PFC system to the regulated one for the specific equipment type is ensured by correct settings of base-level controls: the position of the turbine speed actuator, steam pressure at the turbine inlet, fuel consumption and the generator’s electric power.
Comprehensive tests are carried out in accordance with the work program approved by the power plant’s engineering manager. The comprehensive testing program must be coordinated with the SO.
For each load, transient graphs are determined:
by active power and steam pressure at the turbine inlet of each power unit;
by the total active power of the operating turbine units and the steam pressure in the common steam header of this section of the TPP under disturbing impacts towards increasing or decreasing the load by ±10% of the rated value.
Before each experiment, key process variables and fuel consumption should be stabilized and remain unchanged within 5–10 min before the disturbance is applied.
In each experiment, the following should be recorded:
the values of disturbing impacts with time stamps
active power of the turbine generator of the power unit; the total capacity of all operating turbine generators of the TPP train (or each separately);
steam pressure at the turbine inlet and in the common steam header of the TPP;
minimum and maximum oxygen content in flue gases (according to the analyzer readings);
turbine control valve positions of the power unit when operating in the sliding pressure zone.
Each experiment must end with the stabilization of the active power at a new level, the restoration of the initial value of the working steam pressure in experiments at the rated pressure or pressure stabilization at a new level in the experiments with sliding pressure.
3.2. Process Knowledgebase Development Procedure
The Process Knowledgebase contains the knowledge necessary to solve the above problem of assessing the state of generating equipment from the viewpoint of its readiness for GPFC. In this context, knowledge is a set of formalized patterns that characterizes the process. These patterns are extracted by analyzing plant operation data. This way of knowledge acquisition is called inductive learning [
14].
According to the procedure proposed, the process knowledgebase should be comprised of several levels.
Level 1. Basic knowledge
After the control tests, the following results are stored into the knowledge base:
transient responses obtained;
values (“realizations”) of parameters (ParR) of the unit;
turbine type/model;
constant-error response and frequency deadband for each base-level controller;
turbine speeds, constant-error response and frequency deadband of power controllers (if any).
From the viewpoint of inductive learning, this knowledge can be considered basic.
Level 2. This level of the knowledgebase consists of the sets of instrument readings (“realizations”) of frequency (FR) with a significant deviation (frequency changes during the realization by more than 10 MHz for a time interval of less than one minute).
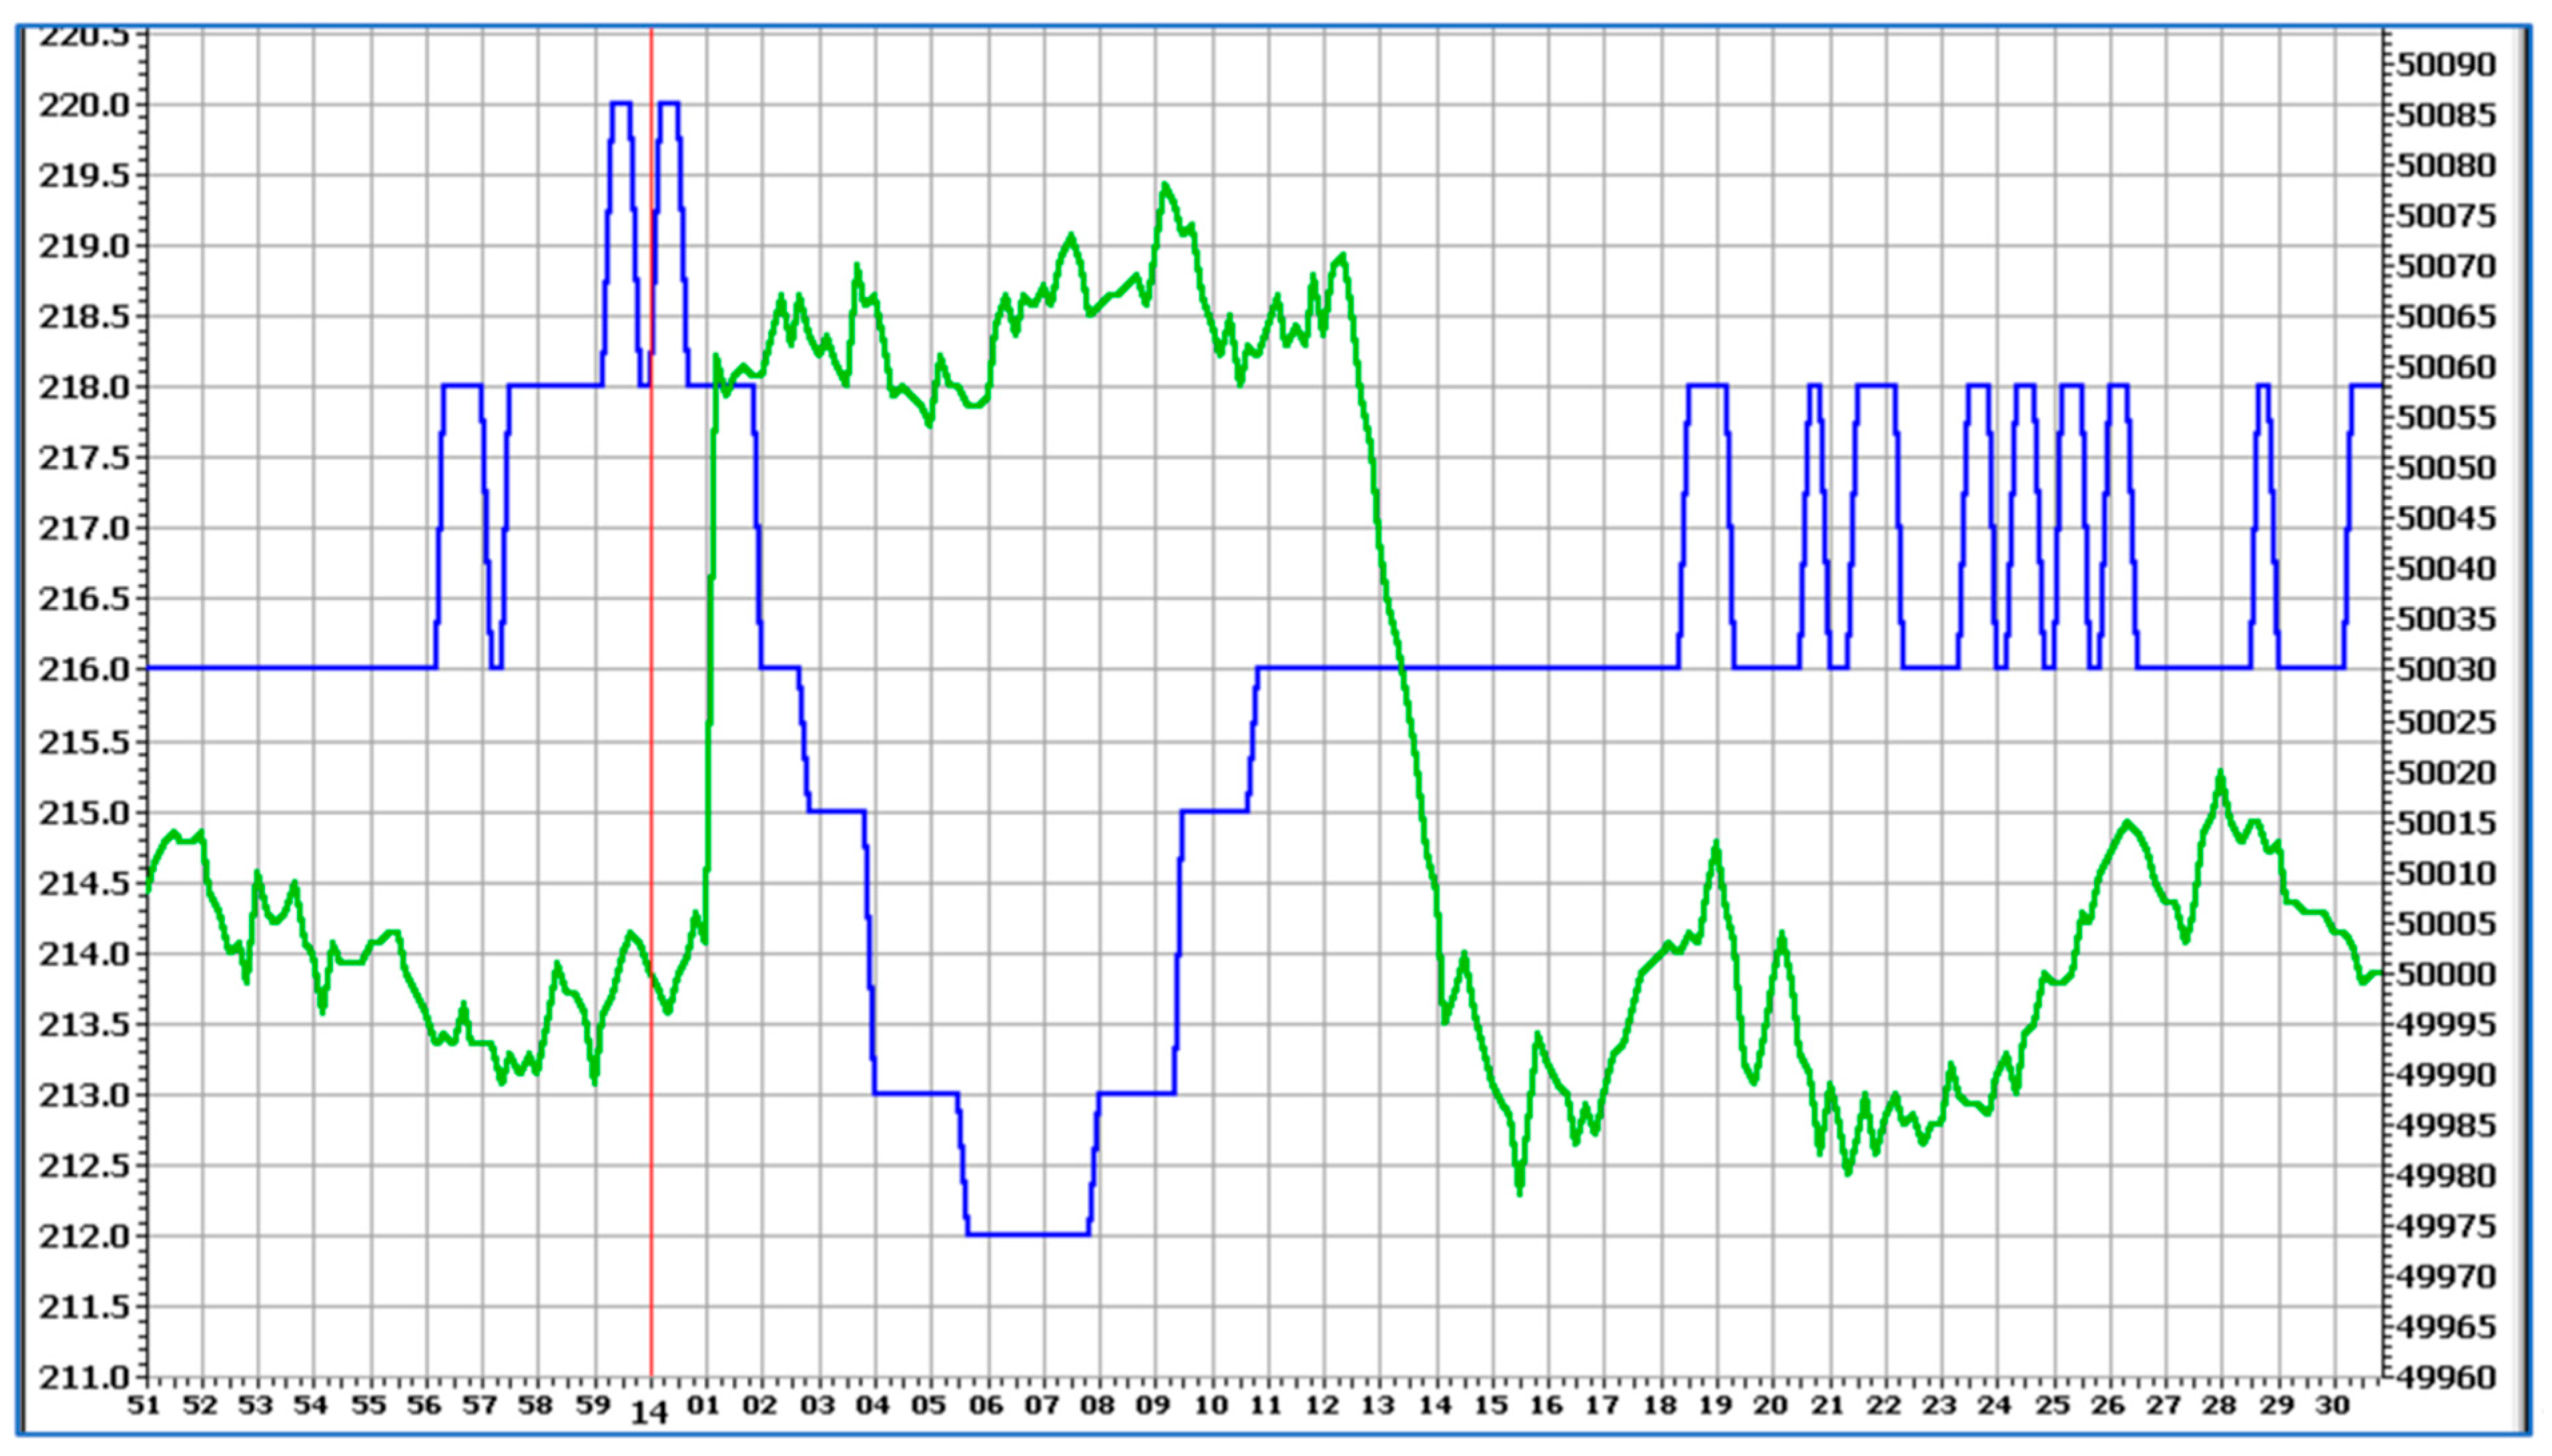
The realization is recorded at a time interval of 10 min from the moment of the frequency jump. Examples of FR and power realizations (PR) obtained from process monitoring during significant real-life frequency changes are presented in the following diagrams
Figure 4 and
Figure 5.
For clarity, one picture shows both frequency changes (displayed in green; the values are in Hz on the right vertical axis) and power values (blue line, the values are displayed on the left vertical axis in MW).
The above graphs show that the response of the units of one power plant to the same FR can be completely different, and it is impossible to visually determine the degree of “correctness” of the operation during the GPFC.
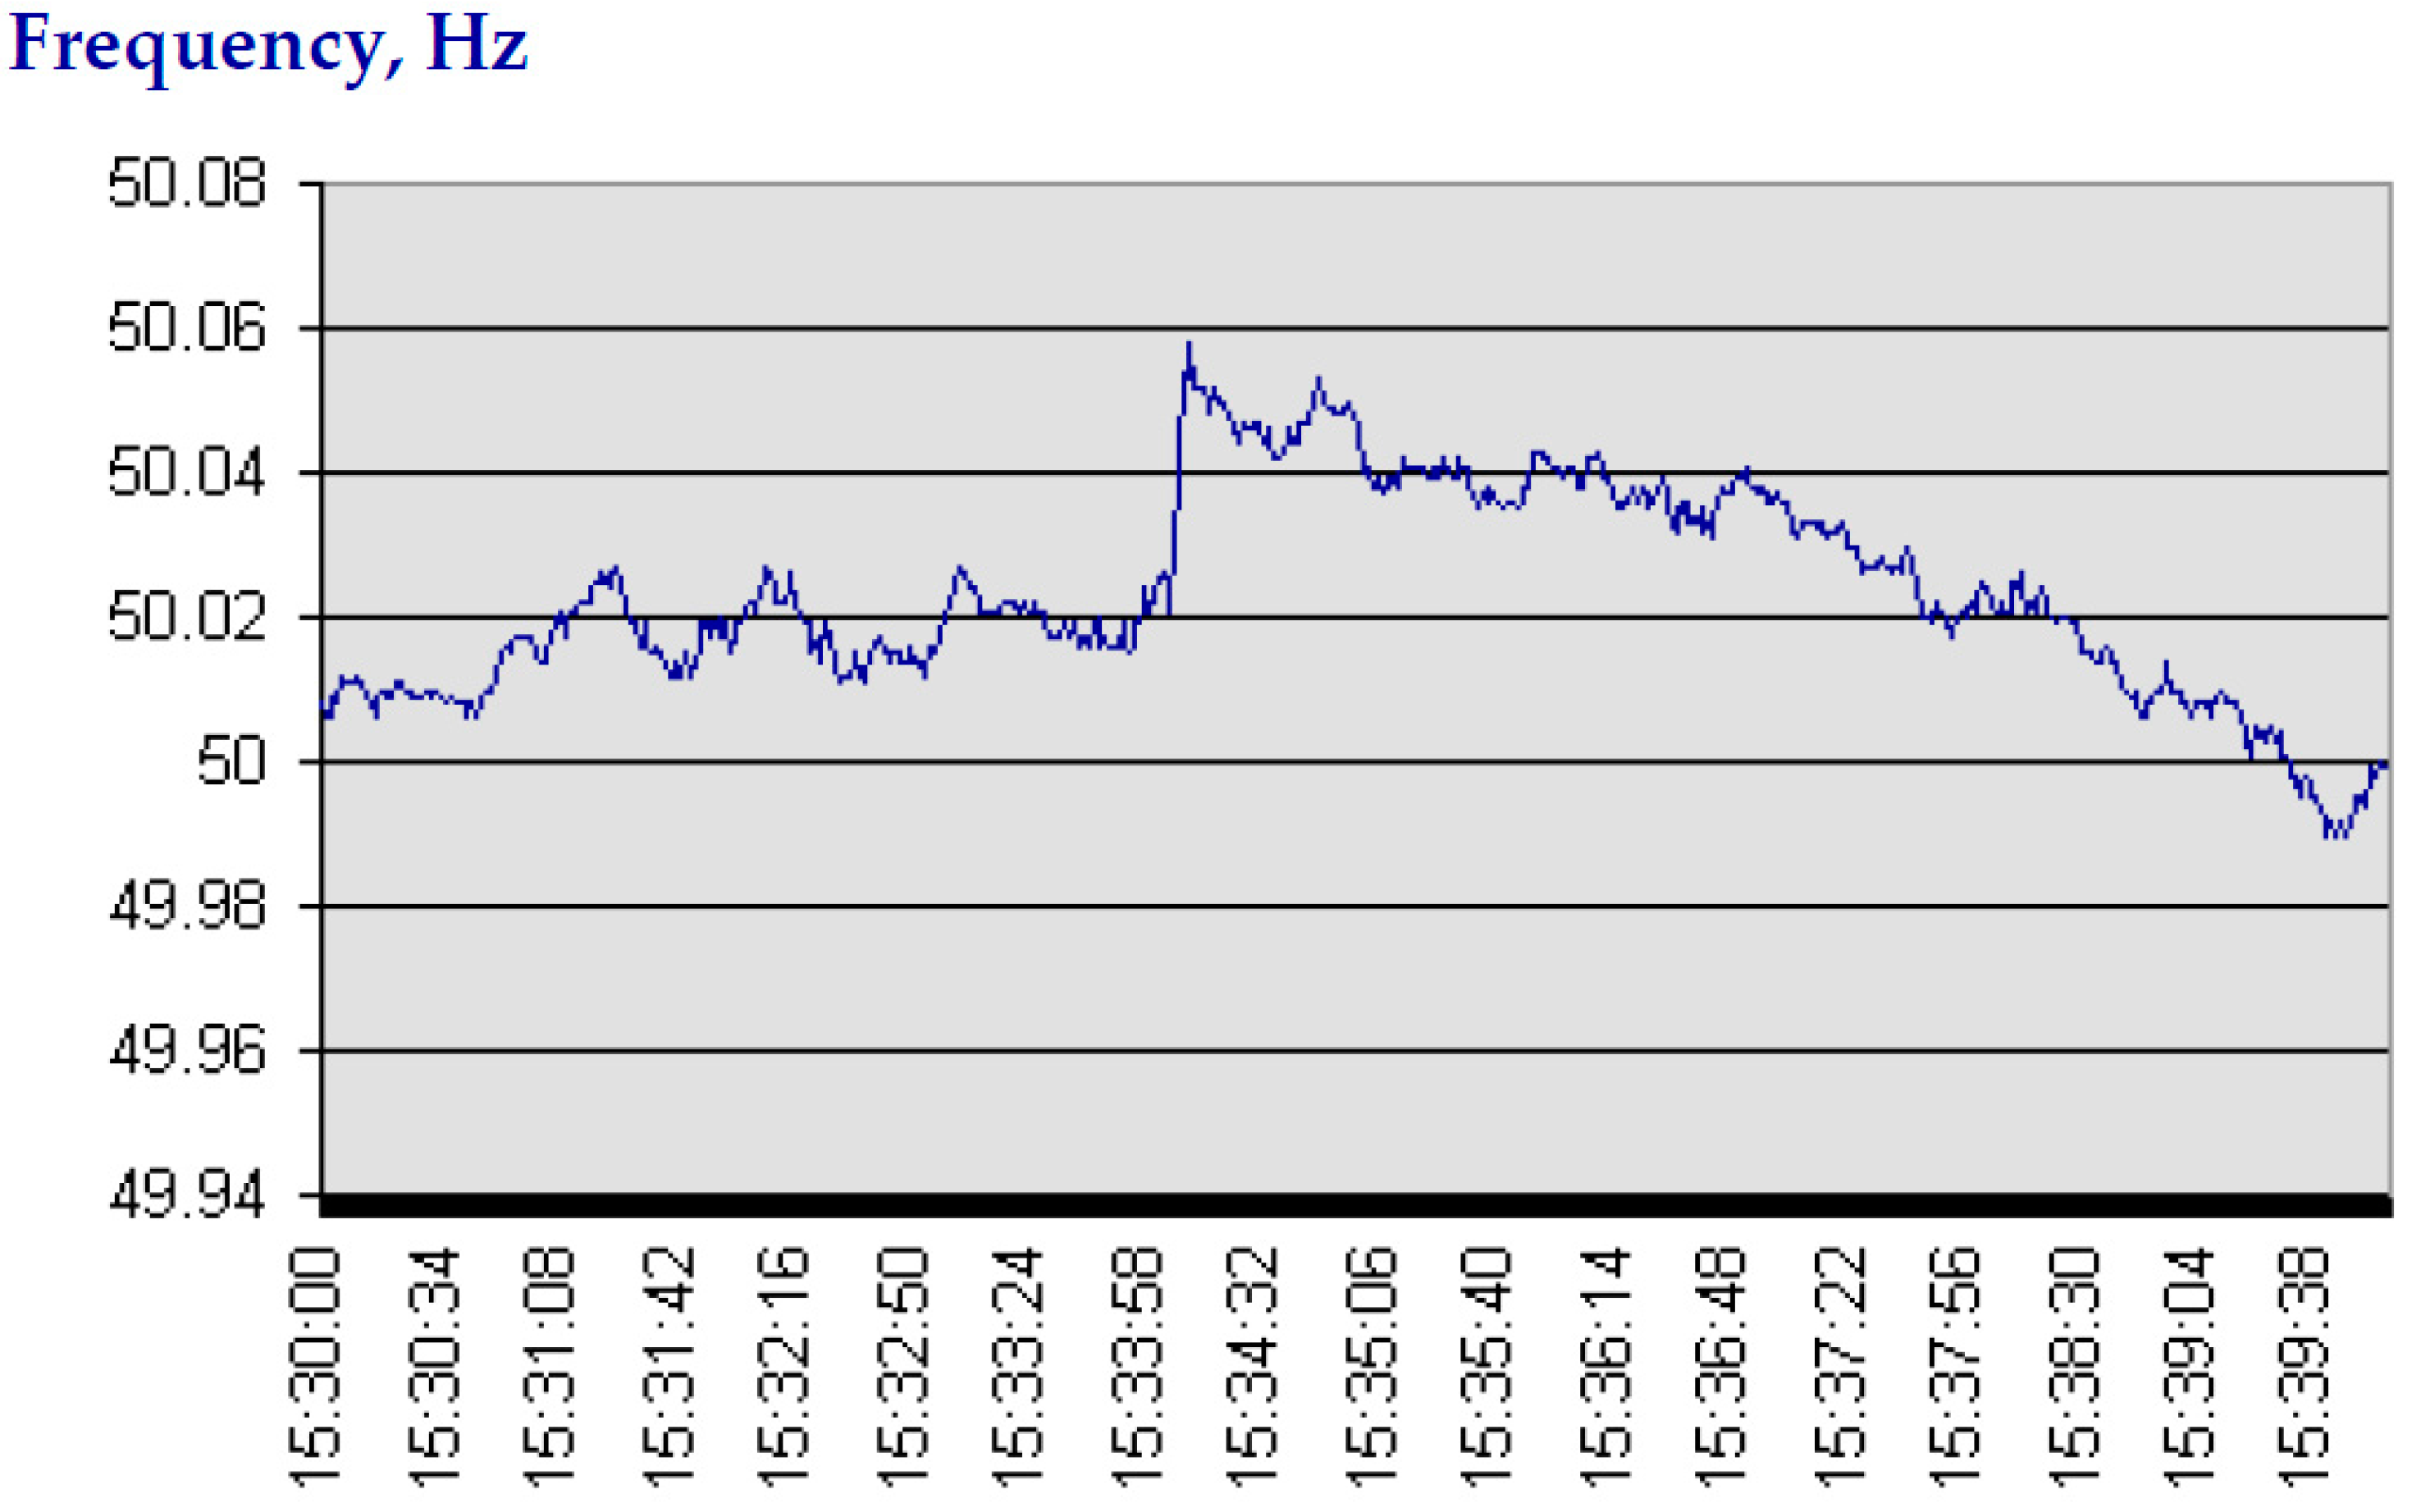
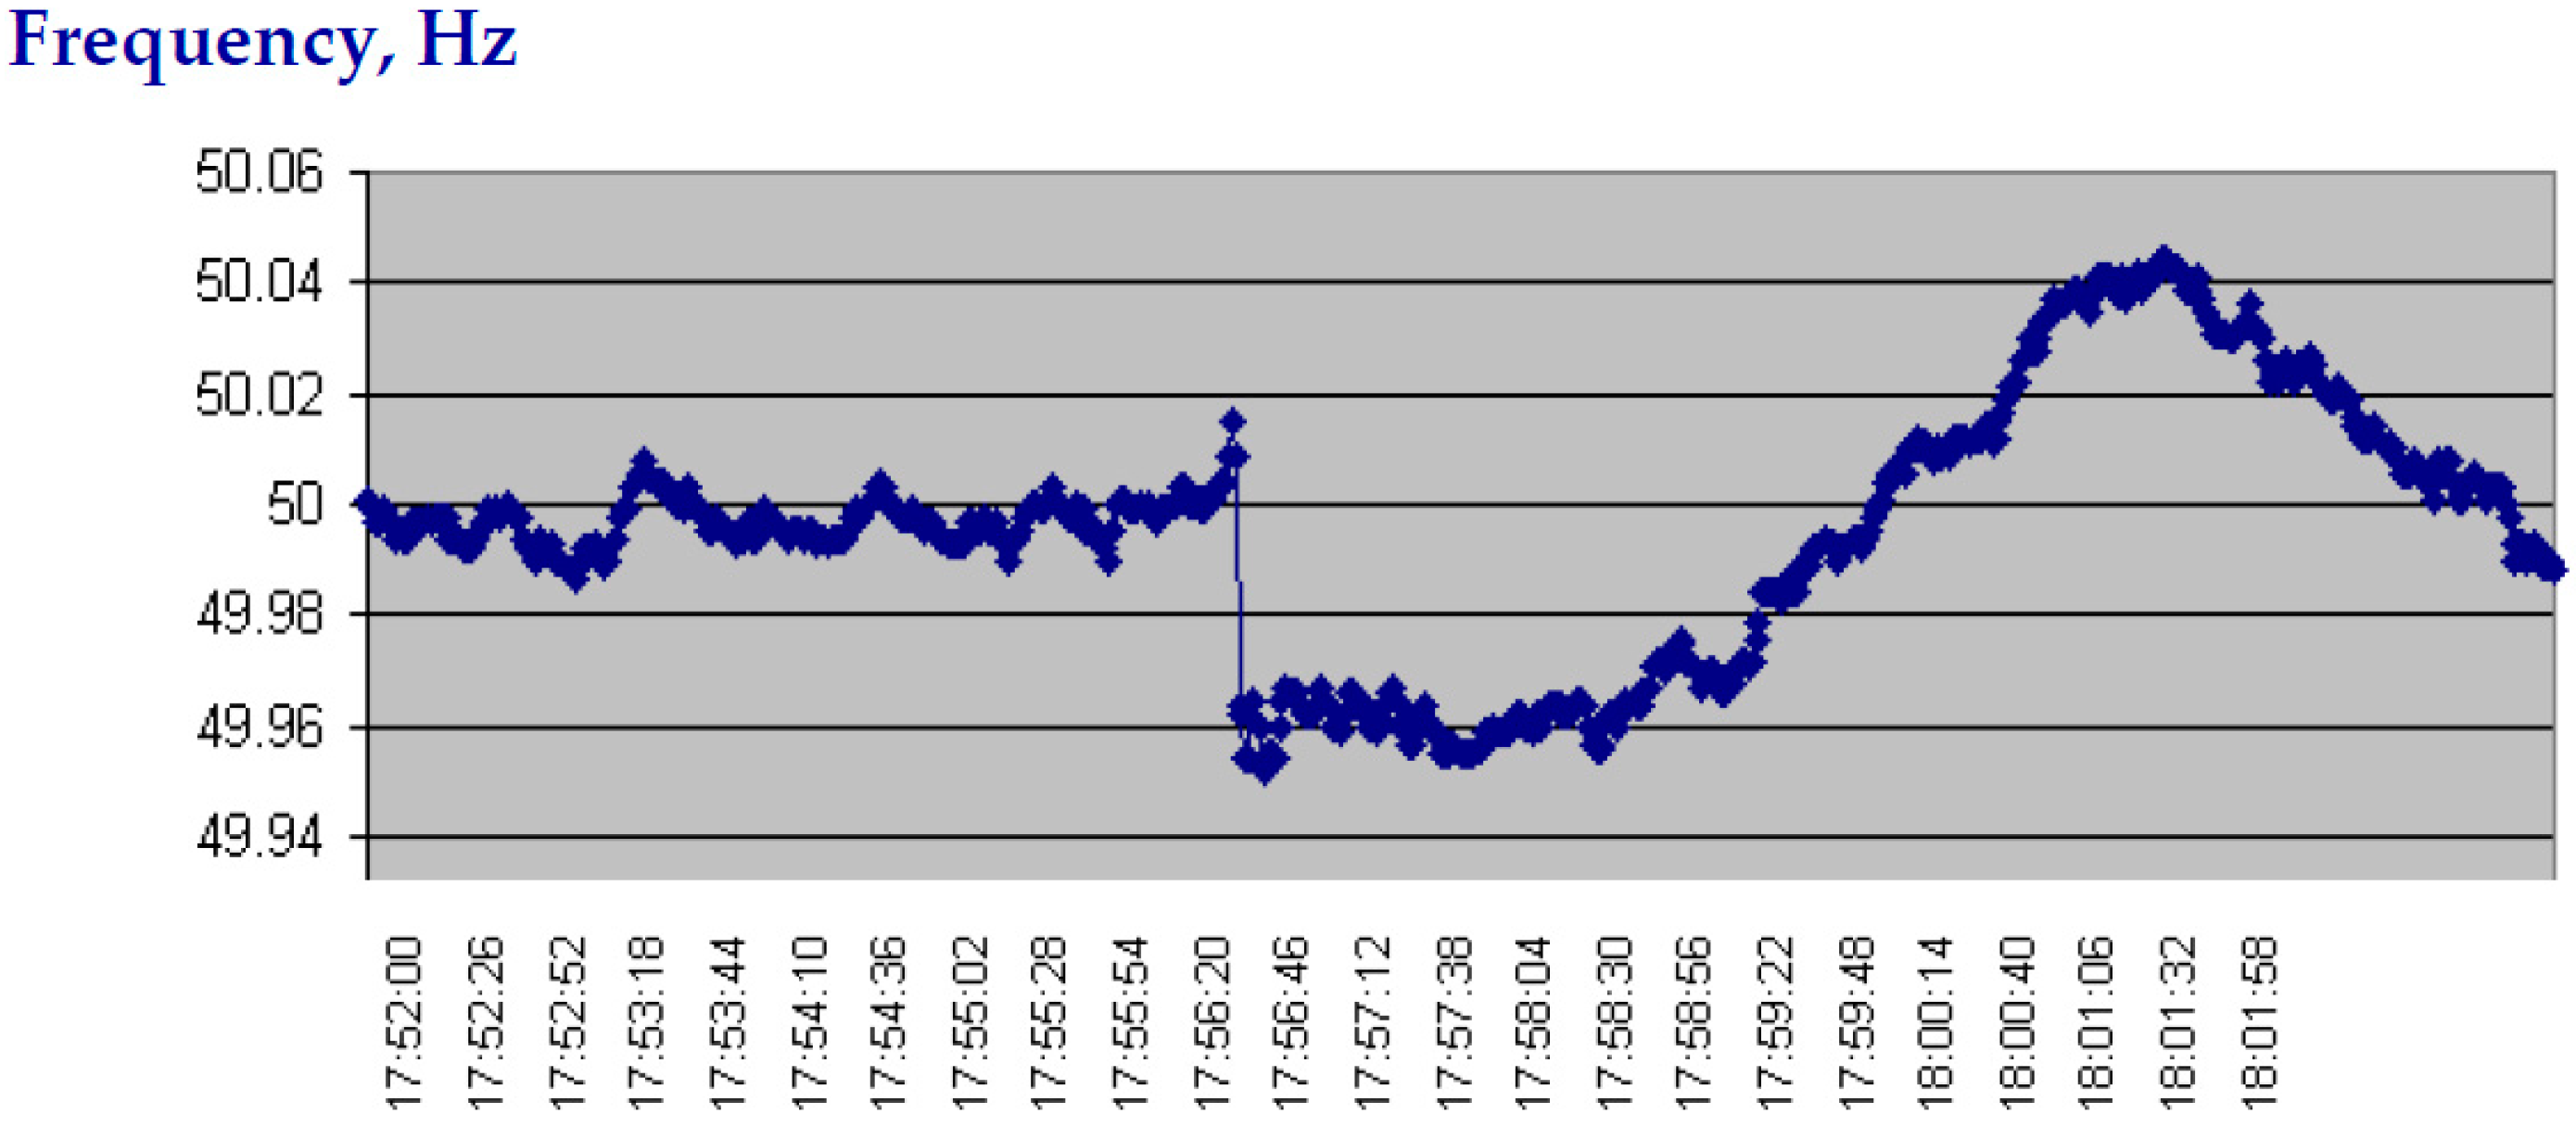
The next two figures show that the values (realizations) of the frequency in the same network section can undergo significant fluctuations over time:
Figure 6 and
Figure 7 illustrate frequency changes in the same section of the system at different time intervals, which is taken into account in the real-time identification model.
A set of frequency realizations (FR) is entered into the knowledgebase.
Level 3. The next step in building the Process Knowledgebase is to determine the set of input parameters to simulate the behavior of the unit in various operation modes using the so-called “equivalent” model (EM).
Currently, EMs have been developed for almost every common type of generation unit. Both the theoretical background for the development of such models and models for specific types of units were created. They form the basis of training simulators [
15,
16] for power plant personnel and consistently describe the unit’s behavior in various operating modes. The models underlying present-day simulators can be used as digital twins (DTs).
DTs may help in detecting instrument or control system flaws during plant operation. Some steady-state parameters of the plant and of its DTs may differ, and it often happens that the DTs show the right responses, whereas the operating plant experiences instrumentation problems [
17].
It should be noted that these models also make it possible to determine parameters that cannot be measured at the plant but significantly affect the unit’s dynamics. For example, for an automatic speed controller (ASC), which provides the unit’s response to a frequency change in the power system, these are the servo motor’s speed and response time. These parameters are not measured by instruments but have a significant impact on the unit’s transient characteristics.
As a result of an expert analysis of real factors that can affect the transient response of the unit (power change, boiler state, control system’s settings, etc.), a list of the most influencing factors, the range and discreteness of their change are created in the knowledgebase. For each factor from the resulting list, a set of possible values for this factor is determined. The number of values should be neither too large nor too small to make sure that the influence of changes in this factor on the transient response is allowed for with sufficient adequacy. The sets of the values obtained represent, e.g., a set of values of the time constant in the turbine speed control loop or the sets of possible values of the unit power or steam pressure at the turbine inlet.
Actuator positions against the deadband (top, zero and bottom) are also included in the knowledgebase. It should be noted that the set of parameters affecting the unit’s behavior is much wider than the set of process variables measured directly at the operating unit. This wider set includes, for example, the value of the time constant in the turbine speed control loop, the stroke time of the turbine controller, etc.
Level 4. A set of parameters is further formed on the basis of the operation of the unit when simulated using the calculated (“reference”) model. Simulation results (first of all, the unit’s FR and PR) and the elements of the parameter set are stored in the knowledgebase.
All of the above steps ensure the pre-filling of the Knowledgebase. During the operation of the system, the knowledgebase is replenished with specific values of FR, PR and ParR of units, as well as the results of their intelligent state analysis during operation.
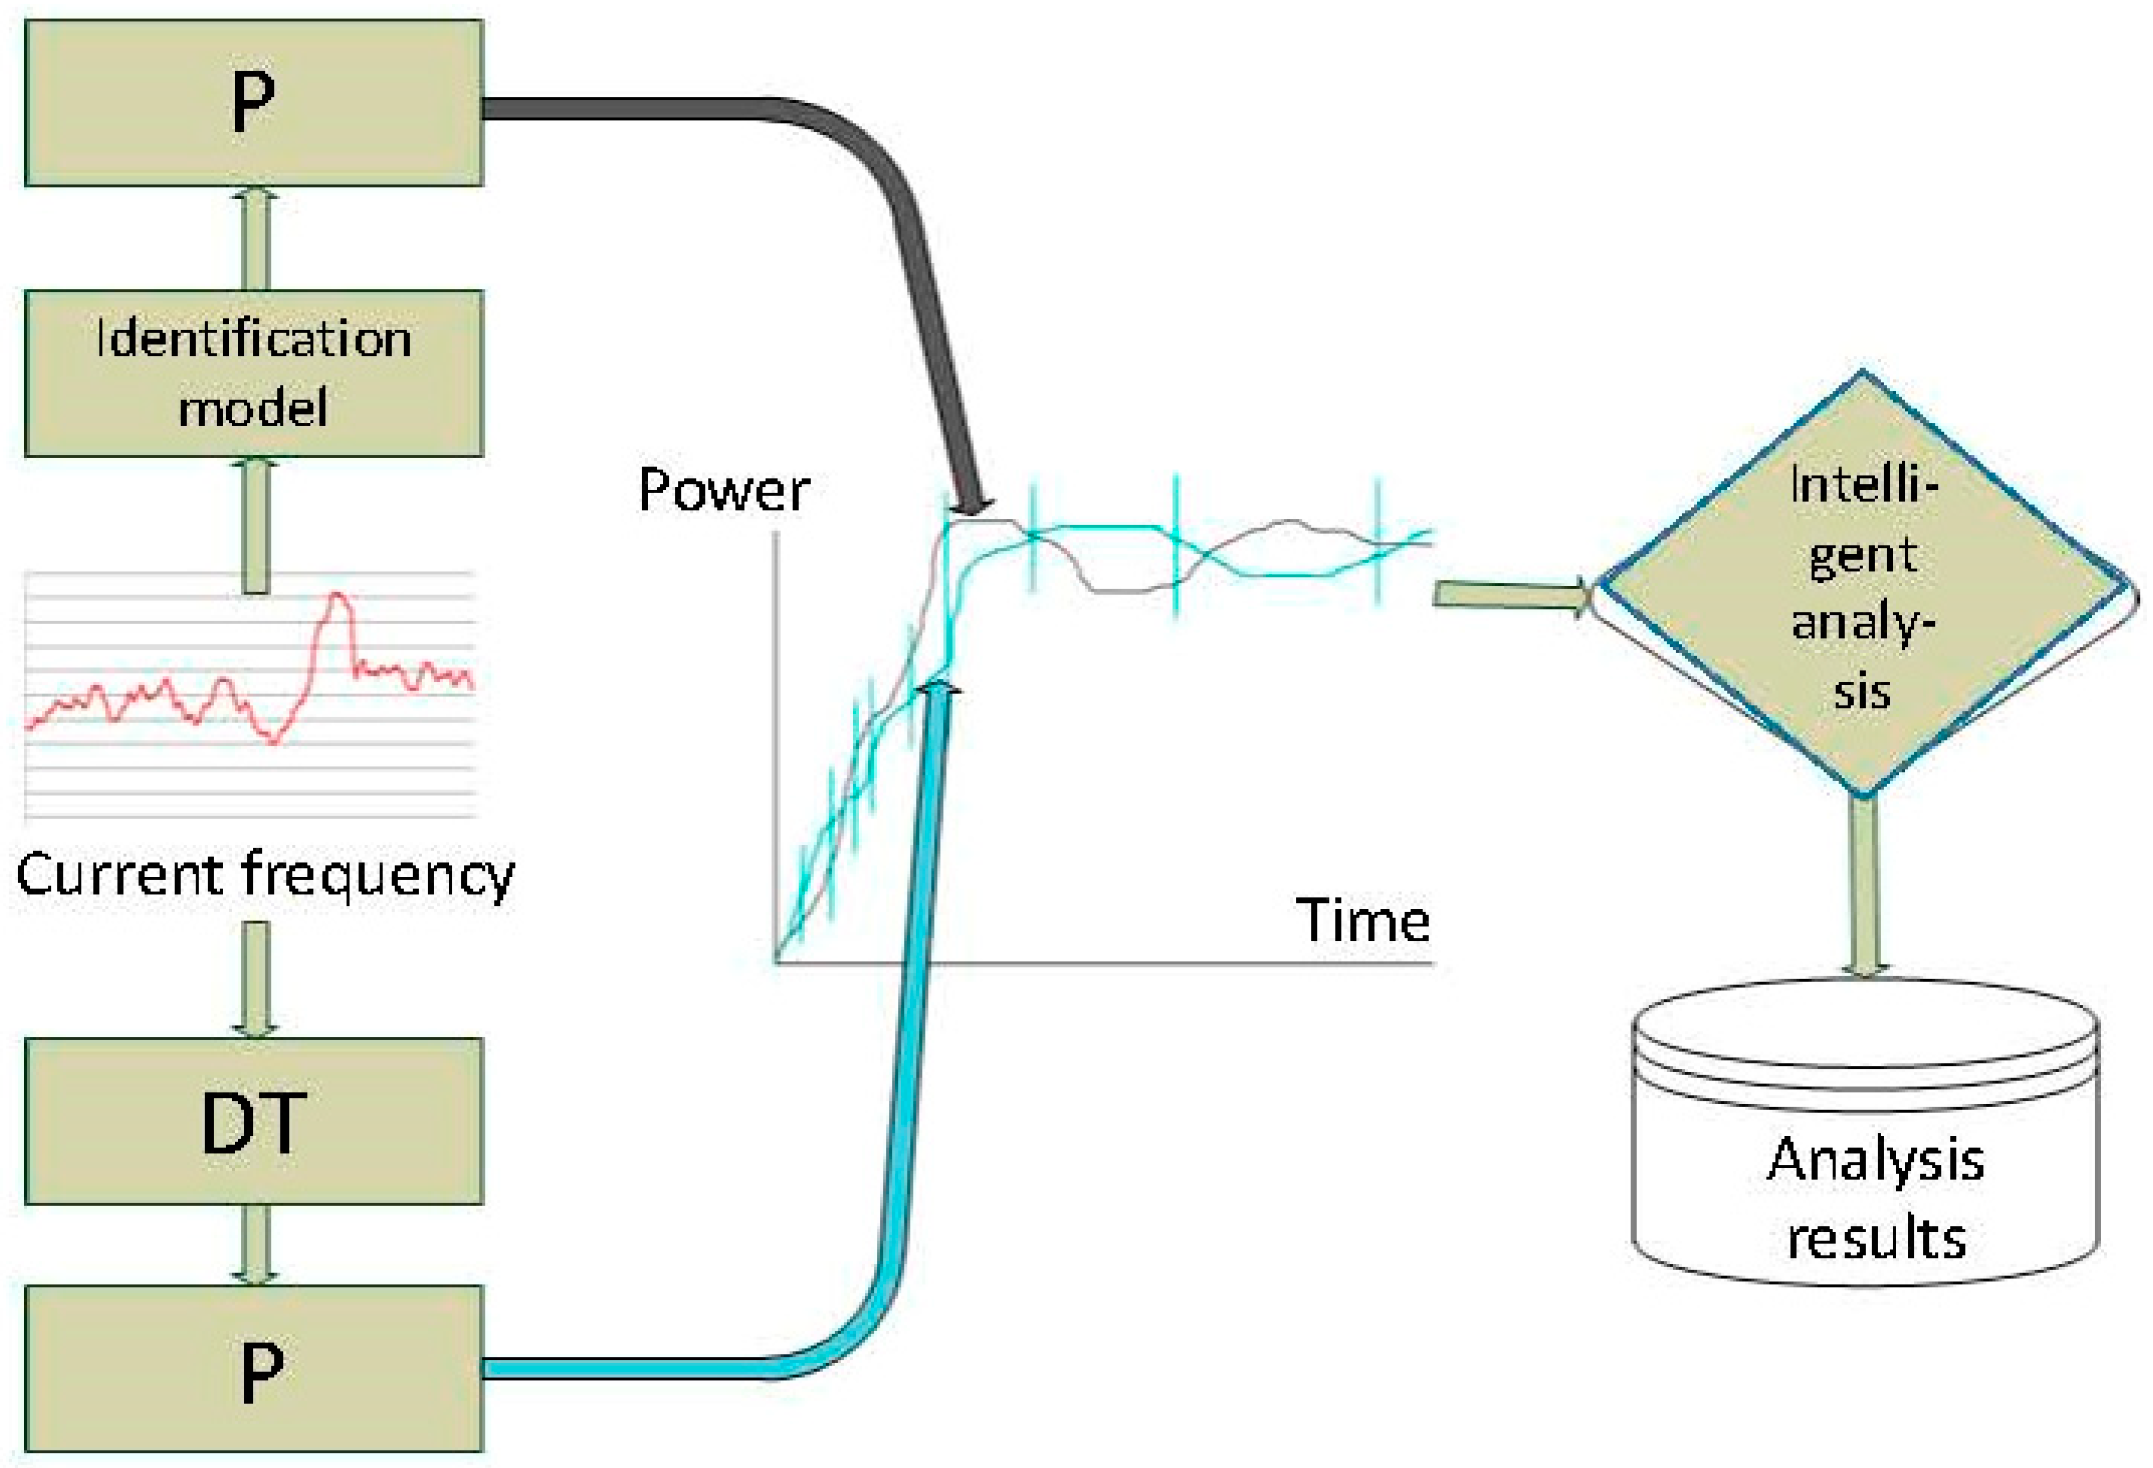
3.3. Development of Identification Models of Generation Units Using Associative Search Algorithms
At the beginning of this stage of the operation of the intelligent system, a preliminary analysis of the knowledgebase content is carried out, i.e., the system training. The analysis consists in assessing the statistical dynamic properties of the realizations of individual parameters and the relationship between the parameters. Based on this analysis, the type and individual parameters are selected for the development of an associative search algorithm, which will be used to build an “adequate” identification (and not a calculated simulation) model of the aggregate. This model is constructed using the associative search procedure described in
Section 2. For the problem of assessing and predicting the state of an individual unit, considered in
Section 3, elements of the knowledgebase of all the presented levels are used.
In this case, the adequacy of the unit model is understood as the acceptable (specified in process manuals) accuracy of the model’s reproduction of the unit’s transient characteristics under the same input signals (RM and RF) as were used for model development. When building the identification model, the plant nonlinearity should be allowed for. Therefore, when developing a soft sensor, it is advisable to use methods based on dynamic associative analysis of augmentable process knowledge.
The development of such models rests upon the simulation of the operator’s decision-making process comprising the analysis of both the current process situation and the prehistory. With regard to this problem, the model is built on the basis of the “association” with operation modes and input actions, which are contained in the knowledgebase [
18]. Data sets are selected from the archive that are close to the current set of inputs subject to a certain criterion.
In our case, we analyze the proximity of the actual FR and PR of the unit and the FR and PR available from the knowledgebase. As a proximity criterion, the standard deviation of FR and PR can be used at a selected time interval of the FPFC at several selected time instants at each of the two time intervals. The first interval is the first 60 s of the transient process, and the second one is the rest of the transient. This partition is caused by the utterly different nature of the factors affecting the transient response over these intervals.
The model’s adequacy criterion for the associative search algorithm can be the similarity of the transient response obtained from the unit’s model and the one obtained during control tests. The model resulting from the training and the associative search algorithm looks as follows:
where:
- -
is the power of a specific generating unit (“power realization”) obtained as a result of tracking the realization of the frequency ;
- -
are frequency values (realizations);
- -
are the parameters affecting the transient response of the unit (power mode, inlet steam pressure, turbine speed actuator position, fuel consumption, etc.);
- -
are key configurable parameters, such as constant-error response and frequency deadband of turbine speed governors.
Our point model, in contrast to the classical linearized models, focuses on taking into account the deadband.
To study the reaction of generating units and the changes of their parameters under non-stationary load conditions with different frequency spectra (from seasonal fluctuations to sharp jumps caused by emergency situations), it makes sense to apply wavelet analysis of dynamic processes for developing identification models.
3.4. Wavelet Approach in Non-Stationary Process Analysis
In recent years, wavelet analysis has been widely used for the analysis of non-stationary processes. The wavelet transform provides time-frequency information about a function. Unlike the Fourier transform, it uses the so-called wavelets, soliton-like functions localized in a bounded region, to form the orthonormal basis in the L2 space.
To obtain a transform at a single frequency, all the time information is no longer required, as for the windowed Fourier transform (WFT). The WFT does not enable the investigation of the signal’s local properties, in particular, under sufficiently quick time changes of its spectral composition.
Wavelet analysis methods were first used to study the properties of time (spatial) series with pronounced heterogeneity [
19]. Based on these studies, the theory of bursts was created, as well as its many applications.
Wavelet analysis is currently used in various fields, where its capabilities for simultaneous analysis of signals in time and frequency domains and the ability to localize signal processing are in demand. The greatest efficiency of the method is shown in the study of signals that are non-stationary in time and inhomogeneous in space. Wavelet analysis allows not only obtaining a frequency distribution of signal power but also investigating the localization of the properties of frequency components. Wavelets can also be used in problems of synthesizing functions poorly approximated by other methods.
The most common present-day applications of wavelet analysis are: information compression and coding, analysis and synthesis of non-stationary signals, image processing and pattern recognition, including areas such as geophysical field properties, meteorological time series, earthquake prediction, and healthcare.
It is of undoubted interest to study the possible application of wavelet analysis to solve identification problems [
20]. Wavelets have shown their effectiveness in the identification of nonlinear systems with unknown time-varying coefficients, which can be represented as a linear combination of basis wavelet functions [
21].
Wavelets may be used in different ways to identify linear systems. In particular, identification methods based on spline wavelets and their derivatives are presented in [
22]. In [
23], the application of the least squares method for retrieving useful information from raw data is demonstrated.
3.5. Conditions of the Associative Model Stability in the Perspective of the Analysis of the Spectrum of Multi-Scale Wavelet Expansion
Let a predictive associative model of a nonlinear time-varying plant meet Equation (9). For the selected detail level , we obtain a multiple-scale wavelet decomposition shown below.
For the current values of the variables included in Equation (9):
for all
k input variables
, and for all their values
selected on
:
for all control variables
, and for all their values
selected on
:
and for all values (realizations) of frequency:
Next, we make a substitution into Equation (9) and compose a system of linear equations of this kind for sets of input variables close to the current set in terms of the selected criterion.
The coefficients of multi-scale wavelet expansions are determined in advance using the Mallat’s algorithm [
24] (and can be stored in the knowledgebase).
The resulting system of equations is solved in accordance with the least squares method, with the preliminary application of the Moore–Penrose procedure [
25,
26] for obtaining a solution even in the case of the statistical dependence of variables.
As a result, we obtain the values: , which allows us to predict the values of the transient response.
After each significant (in terms of the need for the power unit’s participation in the GPFC) frequency jump, an identification model is developed for the unit by the associative search method, which can be used to assess how much the unit’s state has changed against its state at the time of control tests.
A qualitative comparison can be made by comparing the transient responses of the unit at the time of control tests and the transient responses obtained from the operating plant data. In particular, it is possible to compare the corresponding transient characteristics of the unit obtained by applying the most recent significant frequency jump, as
Figure 8.


