Article

Anatomical Model of Rat Ventricles to Study Cardiac Arrhythmias under Infarction Injury

by
Roman Rokeakh
1,2,3,*,†,
Tatiana Nesterova
1,2,3,†,
Konstantin Ushenin
2,3,
Ekaterina Polyakova
1,
Dmitry Sonin
1,
Michael Galagudza
1,
Tim De Coster
4,
Alexander Panfilov
1,3,4,5,* and
Olga Solovyova
2,3,*
1
Almazov National Medical Research Centre, 197341 Saint-Petersburg, Russia
2
Institute of Immunology and Physiology, Ural Branch of Russian Academy of Sciences, 620049 Ekaterinburg, Russia
3
Institute of Natural Sciences and Mathematics, Ural Federal University, 620075 Ekaterinburg, Russia
4
Department of Cardiology, Leiden University Medical Center, 2300 RC Leiden, The Netherlands
5
Department of Physics and Astronomy, Ghent University, Krijgslaan 281, 9000 Gent, Belgium
*
Authors to whom correspondence should be addressed.
These authors contributed equally to this work.
Mathematics 2021, 9(20), 2604; https://doi.org/10.3390/math9202604
Submission received: 8 September 2021 / Revised: 4 October 2021 / Accepted: 8 October 2021 / Published: 15 October 2021
(This article belongs to the Special Issue Mathematical Modelling in Biomedicine II)

Abstract

:
Species-specific computer models of the heart are a novel powerful tool in studies of life-threatening cardiac arrhythmias. Here, we develop such a model aimed at studying infarction injury in a rat heart, the most common experimental system to investigate the effects of myocardial damage. We updated the Gattoni2016 cellular ionic model by fitting its parameters to experimental data using a population modeling approach. Using four selected cellular models, we studied 2D spiral wave dynamics and found that they include meandering and break-up. Then, using an anatomically realistic ventricular geometry and fiber orientation in the rat heart, we built a model with a post-infarction scar to study the electrophysiological effects of myocardial damage. A post-infarction scar was simulated as an inexcitable obstacle surrounded by a border zone with modified cardiomyocyte properties. For cellular models, we studied the rotation of scroll waves and found that, depending on the model, we can observe different types of dynamics: anchoring, self-termination or stable rotation of the scroll wave. The observed arrhythmia characteristics coincide with those measured in the experiment. The developed model can be used to study arrhythmia in rat hearts with myocardial damage from ischemia reperfusion and to examine the possible arrhythmogenic effects of various experimental interventions.

1. Introduction

The contraction of the heart is controlled by propagating nonlinear waves of electrical excitation. Abnormal regimes of such cardiac excitation lead to life-threatening cardiac arrhythmias. The most dangerous of these arrhythmias are ventricular tachycardia (VT) and ventricular fibrillation (VF), which frequently occur as a result of myocardial infarction. Myocardial infarction is an acute condition characterized by local cardiomyocyte necrosis due to an insufficient regional oxygen supply. This lack of oxygen is a result of ischemia, i.e., a restricted blood supply to the myocardial tissue. The reperfusion of the myocardium, i.e., recovery of blood supply to the ischemic region, causes further myocardial damage due to an acute change in intracellular homeostasis. Acute and longterm consequences of these two processes are widely studied in animal models of myocardial ischemiareperfusion injury [1,2,3,4]. Rats are the most commonly used laboratory animal for assessing ischemiareperfusion injury in experiments. They are used to study the mechanisms of postinfarction pathology and to develop approaches reducing adverse cardiac events following ischemiareperfusion injury in the myocardium [5,6,7]. In addition to experimental studies, an anatomically accurate computer modeling of the heart has become a valuable process for investigations of cardiac arrhythmia mechanisms. In recent years, many computational models have been proposed for the human heart [8,9,10] and animal hearts of different species [11,12,13]. Animal cardiac models are mainly used to support physiological experiments and to predict and study processes which cannot be examined experimentally. Human heart models are mainly aimed to reproduce arrhythmia formation, study their mechanisms and mimic possible clinical interventions to terminate arrhythmia [8,9].
Considering animal cardiac models, models of rabbit [11,14], dog [12], and swine [15] hearts already exist. Despite the rat being the most widely used laboratory animal, species-specific computer models of the rat heart are limited [13,16,17]. In most cases, existing computational models describe healthy normal hearts. However, there is a need for the development of animal cardiac models with pathological changes, particularly those including myocardial ischemiareperfusion injury. Structural and functional remodeling in postinfarction myocardium results in great heterogeneity in the tissue, which in turn causes excitation abnormalities. The injury consists of two regions: a postinfarction scar and a border zone. The postinfarction scar region contains inexcitable cells which act as an obstacle for waves of electrical excitation in myocardial tissue. The border zone around the scar contains the surviving cardiomyocytes with modified electrical properties along with inclusions of fibrosis and other cells occupying the area. The role of the size, structure and functional heterogeneity of the damaged area in arrhythmia induction and maintenance is poorly studied, especially in cardiac computer models.
The aim of this paper is to develop speciesspecific multiscale computational models of the electrical activity in rat myocardium from the cellular to organ level. For the first time, the models will be utilized in an anatomically detailed model of rat ventricles with a realistic geometry of infarction injury in myocardium to study the dynamics of the electrical waves in such pathological conditions.

2. Materials and Methods

2.1. Gattoni2016 Ionic Model of Ventricular Rat Cardiomyocytes

In this study, we used the Gattoni2016 ionic model [18] of a rat ventricular cardiomyocyte. This model combines the Pandit ionic model of the rat ventricular cardiomyocyte [19] with the updated description of sodium-potassium exchanger from [20] and the Hinch model of intracellular Ca 2 + handling [21]. The combined model was developed to reproduce experimental data on the frequency dependence of the Ca 2 + transient features in rat cells and was fitted to specific data of rat cardiomyocytes at 37 C. This model describes the generation of a cellular action potential which takes twelve transmembrane ionic currents into account: fast ( I N a ) and background ( I b N a ) sodium currents; L-type ( I C a , L ) and background ( I b C a ) calcium currents, as well as a calcium pump current ( I p C a ); transient outward ( I t o ), inward rectifier ( I K 1 ), steady state outward ( I s s ) and background ( I b K ) potassium currents; a hyperpolarized activated current ( I f ); and, finally, sodium-potassium ( I N a K ) and sodium-calcium ( I N C X ) exchange currents.
Intracellular calcium dynamics is described using a singlecompartment sarcoplasmic reticulum (SR). It consists of a model of the interaction between I C a , L channels with nearby ryanodine receptors (RyR) within a dyadic space (calcium release unit) providing a nonlinear Ca 2 + release from the SR to the cytosol, and the SR Ca 2 + -ATPase (SERCA) pumping out Ca 2 + from the cytosol back to the SR. There are also cytosolic Ca 2 + binding ligands, troponin C and calmodulin, in this model. An advantage of this model is that, in comparison with the previous models of rat ventricular cardiomyocytes, fewer data from other animals and for nonphysiological temperatures have been used for fitting its components.
In [18], the authors validated their cellular ionic model using experimental recordings of action potential and calcium transients for a reference pacing rate of 1 Hz and a higher frequency of 6 Hz (corresponding baseline cycle lengths (BCL) of 1000 ms and 170 ms) [18]. They assigned two different values for the maximal velocity of the SERCA pump ( g S E R C A ), one for each of the two BCLs. The shorter BCL of 170 ms yielded a 45% higher value with respect to the longer BCL of 1000 ms (see Table 1).
When we tested the original Gattoni2016 cellular model with BCLs shorter than 170 ms, we discovered that in most cases it shows action potential disturbances (early afterdepolarization (EAD)-like behavior) and further calculation failure after 100 or even fewer cycles. The instability was independent of the time-step set for the numerical solution of model equations, revealing an inherent property of the model itself. The calculation failure appeared in the SR Ca 2 + release block and was closely associated with the very fast Ca 2 + leak from the dyadic space to the cytosol, not allowing Ca 2 + inactivation of ryanodine receptors to prevent spontaneous releases at a high pacing frequency. As we needed a robust cellular model for calculations during a long time interval at a high frequency to study the dynamics of excitation waves underlying VT, we had to update the Gattoni2016 cellular model before using it for tissue models of the rat ventricle.
The cellular model we sought had to meet the following general requirements:
  • It had to be stable during long-term execution over one hundred beats.
  • It had to be able to reproduce a positive action potential duration (APD) restitution curve.
We used the CVODE solver (absolute tolerance = 10 6 , relative tolerance = 10 4 ) [22] and the software package Myokit [23] to solve cellular model equations and obtain restitution curves of APD for our adapted ionic cellular models.

2.2. Cellular APD Restitution Curve

To obtain APD restitution curves for different sets of varied parameters in the Gattoni2016 cellular model, we used a dynamic protocol similar to the one used in in vitro studies [24,25]. The first step of the protocol at every sampled parameter configuration started from a series of beats at a BCL of 1000 ms to reach a steady state. Here, initial conditions were the initial conditions from the reference Gattoni model, which could be far away from the steady state for a particular parameter configuration. Thus, 100 cycles (generating 100 action potentials) were used to guarantee the required steady state was achieved. Then, cardiomyocyte models were paced periodically with a progressively decreasing BCL, from 1000 ms to 200 ms in steps of 50 ms and from 200 ms to 80 ms in steps of 10 ms. For each consequent BCL, 40 stimuli (generating 40 action potentials) were applied to reach a new steady state starting from the steady state at the previous BCL. Here, fewer beats were required as the steady states were close to each other at successive BCLs. This protocol guaranteed that premature conduction block was prevented when changing BCL, resulting in successful model calculation at high frequencies. APD was determined as the duration between a relative depolarization threshold of 0.1 of the action potential amplitude and a relative threshold of 0.5 or 0.1 during the repolarization phase. APD 50 , 90 is the time required for 50 or 90% repolarization. Where not specially indicated, APD = APD 90 .
When calculating restitution curves, two fixed values for g S E R C A were assigned to the BCLs of 1000 ms and 170 ms to simulate frequency dependence in the handling of intracellular Ca 2 + . In between these two frequencies and for frequencies larger than 6 Hz, we assumed the linear dependence of g S E R C A on the frequency.

2.3. Population-of-Models Approach

To find appropriate model samples, we implemented a population-of-models approach, generating simulation results (outputs) for a spacefilling design of parameters (inputs) from the Gattoni2016 cellular model.
To choose particular parameters forming a parametric space to sample the population of models, we performed an analysis of the effects of single-parameter variation on the APD in the original Gattoni2016 cellular model. Overall, 16 parameters of the ionic conductances for transmembrane currents and intracellular Ca 2 + flows were subjected to uniparametric variation in a range of 0–200% of the reference values from [18]. The effects of each single-parameter variation on APD at three different BCLs were evaluated and ranged (see Appendix A.1 for detail). Variation in 10 out of these 16 parameters showed an effect greater than 10% on APD, and 6 parameters were then arbitrarily chosen for a population parametric space (see also Appendix A.1 for rationality and justification of the choice). To create appropriate model samples, we restricted the dimension of our parametric space to this smaller number of 6. This provided a sufficiently large population of models for choosing multiple model samples with physiologically nonimplausible action potential characteristics and APD restitution curves for using in tissue simulations.
In total, six parameters were selected: maximal velocity of SERCA ( g S E R C A ), permeability of a single L-type calcium channel ( J L ), pump rate of I N C X ( g N C X ), maximum conductance parameters of I t o ( g t o ) and I s s ( g s s ), and maximum I N a K current ( I N a K m a x ). We generated a Latin hypercube design [26] of 10,000 “points” in a parameter space with each of these six parameters varied in the range of 0–200% of the 1000 ms BCL reference value in the Gattoni2016 cellular model. In the resulting models we set the Ca 2 + flux rate from the dyadic space to the cytosol ( g D ) to a value of 0.0396 μ m 3 /ms by decreasing the reference value from the original model by 60% to make these models more stable at high frequencies.
For each parameter vector, the sample model was paced at a BCL of 1000 ms to achieve a steady state. Simulated outputs from the last cycle of the series were compared with the calibration ranges based on the experimental data to exclude model samples with implausible predictions. The models have to meet the following criteria: APD from 33 ms [27] to 100 ms [24], action potential overshoot from 23.1 to 38.9 mV [18,28], resting membrane potential from −88.81 to −74.9 mV [18,28], peak intracellular Ca 2 + concentration from 1 to 3 μ M [18], diastolic intracellular Ca 2 + concentration from 0.089 to 0.121 μ M [18], and diastolic concentration of the SR calcium of less than 3 mM [18].
Out of the 10,000 tested ionic cellular models, 1083 models met the calibration criteria and were used further for the simulation of APD restitution curves. Out of these, 39 models which showed positive APD restitution curves within the experimental ranges reported by Hardy and co-authors [27] were selected (see Figure A1 in Appendix A.2). Finally, from this subpopulation of 39 models, we arbitrary selected four representative models whose APD restitution curves lie within the curve band for the sub-population (see colored lines in Figure A1; two lines lie close to the center line, the third line lies above, and the fourth line lies below the center line). Each selected model demonstrates a positive restitution curve with a flat interval of the curve at high frequencies, i.e., with a BCL of less than 170 ms. Moreover, this selection was made in such a way that there was a varying combination of parameters present. Parameter values of these models, shown as percentages, of the reference values from [18] are shown in Table 1. Although the models differ from the original Gattoni2016 cellular model only in terms of parameter configurations (no equations of the model have been replaced or changed), we hereafter refer to them as “updated models” to emphasize that a specific selection of appropriate parameter configurations has been performed and a new family of Gattoni2016 cellular models has been created, not including the reference model itself.

2.4. Cellular Model for the Border Zone of the Post-Infarction Scar

To simulate consequences of the postinfarction remodeling in the electrical function of cardiomyocytes in the scar border zone, we reduced the maximum conductance values for the following ionic currents: g t o by 45% and g s s by 39%. These modifications correspond to the changes in the current density shown in [29]. In each of the four selected models, this caused a significant increase in APD (more than 30%). However, for Model 2, APD increase was rather unrealistic (APD > 300 ms), so we limited g t o reduction to 35% and g s s to 29%.

2.5. Restitution Curves in Myocardial Tissue Models

To be sure that our cellular models can be run within myocardial tissue models, we performed simulations on a thin strip of myocardial tissue. This allowed for the simulation of restitution curves for APD as well as measurement of conduction velocity in the tissue similar to how it is measured in the intact heart. Propagation of excitation waves in myocardial tissue is described by the monodomain equation:
V t = · ( D V ) I ion C m ,
where V is the transmembrane potential, ∇ is the gradient operator, D is the diffusion tensor, I ion is the total ionic current, and C m is the membrane capacitance.
Initial conditions were set as the resting potential V = V r e s t for the cardiac tissue. Boundary conditions were formulated as having no flux through the boundaries:
n V = 0 ,
where n is the vector normal to the boundary.
These simulations used a 20 mm 1D tissue strip with no-flux boundary conditions, which were solved using the Myokit package. We used the parallel forward-Euler solver [23] with a spacial step of 0.1 mm and a time step of 0.005 ms.
In 1D tissue models, APD restitution curves representing the variation of APD with respect to pacing BCL in range from 80 to 200 mswere obtained by pacing from one end of the tissue strip using the pacing protocol starting from BCL of 200 ms and gradually reducing BCL as described earlier. APD was determined by averaging over 100 cells in the central region of the strip. Conduction velocity was determined in this central region of the strip from activation times obtained using a relative threshold of 0.1 of the transmembrane potential amplitude.

2.6. Excitation Waves in 2D and 3D Myocardial Tissue Models

To simulate excitation wave propagation in the 2D generic models of myocardial tissue and 3D anatomical models of rat ventricles, we solved problems (1) and (2) using original software written in C with a Cuda extension. The system of Equations (1) and (2) was integrated in time using the forward-Euler method, with a time step of δ t = 0.005 ms, and in space, using the centered finite difference method with a space step of δ s = 0.1 mm. This space step corresponds to the resolution of the DT MRI image of the rat ventricles.
For 2D simulations, we used a sheet of 50 × 50 mm 2 isotropic tissue with a constant diffusion coefficient D of 0.1544 mm 2 /ms, which provided conduction velocities of 0.5–0.57 m/s depending on the cellular model. Each of the four selected cellular models for the normal tissue (baseline models) and the border zone (modified models) were used in 2D simulations of spiral waves initiated using an S1–S2 protocol. The models were pre-paced with a BCL of 170 ms and various S1–S2 intervals between 60 and 100 ms were used to start the wave rotation. Spiral wave periods and core trajectories were measured. Here, we used an algorithm from Fenton and Karma [30] for detecting spiral core trajectory. The core size was measured as the length of the largest side of the rectangle bordering the spiral core trajectory.
For 3D simulations, we used the anatomical model of the rat ventricular geometry and the fiber orientation from [16] (https://github.com/DGWhittaker/Rat-FK3V-files/tree/master/Geometry-files accessed on 26 September 2021.) MH1 fiber orientation). Additionally, this rat ventricular geometry was manually refined to remove DT imaging artifacts and nonventricular parts of the heart. The fiber orientation was interpolated within the refined ventricular geometry using nearest neighbor interpolation. The diffusion tensor D was defined according to this fiber orientation. Diffusion coefficient along the fibers was set as 0.1544 mm 2 /ms (same as in 2D case) and 6.25 times smaller across the fibers, thus defining tissue anisotropy.
To build a model of the infarction injury in rat ventricles, we used data from ischemia/reperfusion experiments, in which an infarction was induced by 30 min occlusion of the coronary artery followed by 120 min reperfusion. The study was performed according to the policies and procedures approved by the Institutional Animal Care and Use Committee, and was submitted to and approved by the Committee for the Control of the Maintenance and Use of Laboratory Animals of the V. A. Almazov National Medical Research Center, under the application number 20-01. Standard procedure and histological markers were used to identify the compact scar and the border zone region [2,3]. The regions were segmented manually with ImageJ software and size of the scar was determined (see Figure 1 for the segmentation example). After this, we built a generic geometrical model of the postinfarction scar and the border zone around the scar. The scar was created as the intersection of an ellipsoid with dimensions of 7.29 mm × 5.15 mm × 1.82 mm with the left ventricular (LV) free wall. We simulated a transmural scar extending to the entire depth of the LV wall, as it was more frequently observed in our experiments on ischemiareperfusion in rats. A border zone area was simulated as an intersection of the LV with an ellipsoid of dimensions 11.8 mm × 9.96 mm × 4.59 mm centered at the same point as the scar ellipsoid. The placement and size of the ellipsoids were manually chosen so that the resulting regions would approximately match those seen in experiment (Figure 2). The resulting scar volume was 10% of the LV volume and the border zone was 20% of the LV volume, which is consistent with our experimental data.
Equations (1) and (2) were solved in a 3D cuboid of 12.8 mm 3 labeled as myocardial tissue. Scar elements of the tissue were simulated as non-conducting inexcitable obstacles and considered as the boundaries (no flux) for the myocardial elements. For each type of LV tissue (healthy myocardium and border zone of the scar), its own electrophysiological properties were set. Baseline parameter values for cellular models were used to simulate a healthy myocardium. For the border zone area, we used the cellular models with modified parameters.
Scroll waves in the 3D anatomical ventricular model were simulated with and without the post-infarction scar using two (Models 1 and 2) of the four cellular models showing qualitatively different behaviors in the 2D tissue. Initial conditions for Cellular Models 1 and 2 used in 2D and 3D simulations are shown in Table A2 of Appendix A.2.

3. Results

3.1. APD Restitution Curves in Updated Gattoni2016 Cellular Ionic Models

Figure 3 shows time-dependent action potential signals at three BCLs (1000, 170, 130 ms), simulated by our four selected Gattoni2016 cellular models with parameter configurations indicated in Table 1. The superpositions of the action potential signals in all four models at 170 and 1000 ms BCL is also shown in Figure 4. It is seen that the models reproduce typical triangular shapes of rat cardiomyocyte action potentials at every pacing rate. Slightly slower repolarization is observed at a BCL of 1000 ms. No visual difference in the action potential shape is seen between BCLs of 170 and 130 ms.
Figure 5, left panel, shows simulated APD restitution curves in the four selected cellular models against Hardy et al.’s [27] experimental data recorded in single-cell experiments, which were used for model selection. These four computational curves complemented by the original Gattoni2016 restitution curve and superimposed with experimentally measured values are also shown in Figure A2 in Appendix A.2. APDs at different BCLs recorded in experiments and generated in the models are shown in Table 2. It is seen that simulated APD values from selected cellular models at different BCL paces are close to those reported in the articles [27,31], showing a smooth increase in APD with a BCL increase in experiments. Consistent with the experimental data, in the range of frequencies higher than 6 Hz (BCL < 170 ms), there is almost a plateau of the APD restitution curve with no significant variations in APD depending on the pacing rate (absolute difference in APD at shorter BCL is not larger than 2 ms as compared with APD at 170 ms BCL, i.e., less than 3% of the latter).
As the models were selected using experimental data from Hardy et al. [27], the simulated restitution curves are at the lower range of the experimental data bandwidth. Notethat there is a significant difference between experimental data measured using microelectrode techniques and monophasic action potential recordings on the one hand and those recorded using optical mapping (OM) techniques on the other hand. For the data-set displayed in Figure A2, APDs derived from optical mapping recordings are longer in most of the cases except the data from Benoist et al. [32], where APDs are independent of the techniques. It is seen that our simulations are closer to the electrode recordings. Note that the procedure of OM requires electromechanical uncoupling, which can potentially affect the APD’s restitution properties.
Similar to the original Gattoni2016 cellular model, the restitution curves in Figure 5 were simulated using a frequency-dependent g S E R C A parameter linearly changing between the two different values assigned to the pacing rates of 1 and 6 Hz (see Table 1). Rates of about 6 Hz are physiologically relevant to the normal heart rate in rats. The spiral waves we studied could have even higher frequencies. For such high rates (BCL < 170 ms), we compared the restitution curves modeled in two ways, with either g S E R C A being linearly dependent on BCL or a constant g S E R C A value assigned to 6 Hz (see Figure A3 in Appendix A.2). However, the simulation results did not change significantly between these two ways (less than 3 ms difference in APDs). Such a small difference in the restitution curves could hardly affect excitation wave behavior. Therefore, for our further simulations in myocardial tissue and LV, we used the fixed 6 Hz parameter value for tissue model calculations.
We found no essential difference between the APD restitution curves in 1D tissue models and those calculated in the single-cell models at pacing rates higher than 6 Hz for each of the four selected cellular models (compare restitution curves in Models 1–2 in Figure 5, central and right panels). The highest difference is less than 3 ms. Figure 5 also shows the conduction velocity restitution curves in Model 1 and Model 2. We see that the conduction velocity restitution curves are monotonically increasing functions, saturating at a BCL of 150–250 ms depending on the model. Conduction velocity values vary between 0.49 and 0.83 m/s for different BCL and different models. These results are consistent with experimental data on the rat myocardium [24,25].

3.2. Action Potential in the Cardiomyocyte Models for the Border Zone of the Post-Infarction Scar

Figure 4 compares action potentials at BCLs of 170 and 1000 ms in the four cellular models in the normal tissue and in the border zone of post-infarction scar (see also Figure A4 in Appendix A.2). In all models, the modulation of the model parameters in the border zone causes an increase in APD at the 50% and 90% repolarization levels compared to normal tissue. Relative APD prolongation in the border zone is demonstrated in Table 3. The results on APD elongation in the border zone are qualitatively consistent with the experimental data reported at a BCL of 1000 ms [29]. In contrast to the experimental data, our simulations reveal higher relative change in APD 50 compared to the change in APD 90 . In the experimental data, such differences are less pronounced. However, in our generic models, we were satisfied with the qualitative elongation of the action potential in the border zone that was sufficient to analyze the effects of cellular heterogeneity on wave propagation in the tissue. Moreover, no data on the action potential change in the border zone at high pacing rates were available for rat myocardium. Model simulations predict relatively less pronounced effects of ionic remodeling on APD at the shorter BCL of 170 ms.
Restitution curves calculated in cells from the border zone are shown in Figure 4 in comparison with the curves in normal tissue. The border zone curves lay above the curves for normal tissue and the degree of APD dependency on BCL is higher in the border zone.

3.3. 2D Dynamics

For the four selected Gattoni2016 cellular models, we performed 2D simulations to study the dynamics of spiral waves. As our aim is to study arrhythmia dynamics in the presence of the post-infarction scar, surrounded by a border zone, we studied 2D dynamics in tissue models where we made modifications of ionic currents responsible for tissue remodeling in the border zone. The results of our simulations are shown in Figure 6. Videos of spiral waves appearing in the figure can be found in the Supplementary Materials (videos with the prefix 2D_). We see that for Model 1 in normal tissue (row 1N, video 2D_1N), there is a small meandering core with a size measuring approximately 6.9 mm. For the border zone parameters in this model (row 1R, video 2D_1R), we see an increase in meandering and the size of the core increases to 8.8 mm. For Model 2, we have qualitatively different dynamics. In normal tissue (row 2N, video 2D_2N), we see the pattern of a hypermeandering spiral [33] with a non-stationary core with a size of around 11.8 mm. In the border zone tissue (row 2R, video 2D_2R), meandering further increases and we observe a transient breakup. The breakup occurs due to the following mechanism. At some locations, we observe the appearance of small regions consisting of cells with prolonged action potentials (the left snapshot in row 2R), which is a result of an abnormal repolarization phase of action potential (early after-depolarization). The propagating wave collides with these spots and new wavebreaks are formed, similar to the results reported for the human tissue model in [34]. Models 3 and 4 show dynamics similar to Model 1 with slightly more pronounced meandering. The core size in Model 3 is 6.5 mm and in Model 4 it is 5.5 mm (rows 3N and 4N, videos 2D_4N and 2D_4N). For both models, the size increases in the remodeled tissue: to 12.4 mm in Model 3 and to 7.5 mm in Model 4 (rows 3R and 4R, videos 2D_3R and 2D_4R).
Time-dependent changes in the rotation period of the spiral waves for these models are shown in Figure 7. In normal tissue (Figure 7, left panel) the periods for all models are between 80 and 100 ms, which is within a typical range of periods of arrhythmia in the rat heart [35,36,37]: ECG records in Figure 5 of [24]; optical mapping videos in Supplementary Materials of [24]. In each model, the period slightly decreases before stabilization. We also see larger period variations with larger wave meandering. For example, for Model 1, with small meandering, the standard variation of the period is 2.6 ms, while for Model 2, with larger meandering, it is 4.7 ms. We observe longer rotation periods in all models with remodeled tissue in comparison with those having normal tissue (Figure 7, right panel). For example, for Model 1, the period increases by 25% and for Model 2 by 23%. We also see a substantial increase in the period variation in the remodeled tissue for Model 2 (from 4.7 ms to 7.1 ms), which is also associated with an increase in the meandering and breakup. The statistics of the periods are given in Table 4.

3.4. Wave Dynamics in an Anatomical Model of Rat Ventricles

We also studied wave dynamics in an anatomical model of the ventricles of a rat heart. Out of the four available models, we used two: Model 1 and Model 2. Model 1 was chosen because it has the smallest spiral wave rotation period and hence is closest to experimental data [24,35,36,37]. Model 2 was selected as the only model with a hypermeandering spiral so that we could also study unstable wave dynamics. Similarly to the 2D case, the supplementary materials include videos of spiral waves appearing in the figures. Figure 8 shows typical excitation patterns during arrhythmia in Model 1 and Model 2 obtained using the S1S2 stimulation protocol. In both cases, we see a stationary wave rotation with a period of 83 ms for Model 1 and a period of 93 ms for Model 2. The typical core size is about 4 mm. For Model 1, we saw a small transient drift after which the wave rotation was stabilized (video 3D_1_healthy, Figure A5 top row). For Model 2 no drift was observed (video 3D_2_healthy, Figure A5 bottom row). For both models, scroll waves were rotating at approximately the same location in the right ventricular (RV) free wall.
We have also generated an anatomical model with a post-infarction scar obtained as a result of ischemia-reperfusion injury. Figure 1 visualizes such an injury in an experiment, and Figure 2 shows our realistic model of rat ventricular geometry with a scar and associated border zone around it.
We performed two types of numerical experiments with this model. We first generated a wave rotating around the compact scar (Figure 9). For Model 1, we observed a stationary rotation with a period of 93 ms (Figure 9, upper rows; video 3D_1_around_scar). However, for Model 2, we observed a different situation. We found that the wave initially started to rotate around the obstacle and made four rotations. After that, we saw dynamical instabilities. We saw, at the time of 390 ms (Figure 9, bottom row second column; video 3D_2_around_scar) the onset of a depolarized spot, similar to the spot which we saw in Figure 6-2R. Such spots occur as a result of local abnormal repolarization of action potential known as early afterdepolarization (EAD, see the EAD-like cellular activity in this particular simulation illustrated in Figure A6 from Appendix A.2). As a result, the APD at this location will be prolonged and tissue will not recover by the time the rotating wave arrives there.Consequently, the rotating wave hits this spot at 420 ms and disappears (Figure 9, bottom rows; video 3D_2_around_scar).
In another series of simulations, we studied if the post-infarction scar can also attract spiral waves which occur elsewhere in the heart, which was shown previously in [38]. For each model, we generated a spiral wave at the side opposite to the location of the scar and studied its dynamics over the course of time. The results are shown in Figure 10. We found that, for Model 1, the spiral wave initiated at the opposite side of the scar shifted and anchored to the scar after approximately five rotations (video 3D_1_away_from_scar), similar to what was observed in [38] for a human heart. However, for Model 2, we did not observe such dynamical anchoring and the wave was rotating at approximately the same location until it self-terminated at 2330 ms (video 3D_2_away_from_scar).

4. Discussion

4.1. Main Findings

The main aim of this article was to develop a multiscale electrophysiological model of rat heart ventricles with infarction injury which includes a detailed description of the processes at the cellular, tissue and whole organ levels. The rationale for this study was that many experimental studies of ischemia and infarction injury are performed in the rat heart and anatomical modeling of these processes can be a helpful addition to these studies. This was carried out after the detailed analysis of cellular models, their study in 1D and 2D systems, the generation of a mesh for the 3D anatomical model of the rat ventricles and the study of dynamics of various excitation sources in that model. Our computational model also includes the representation of the post-infarction scar.
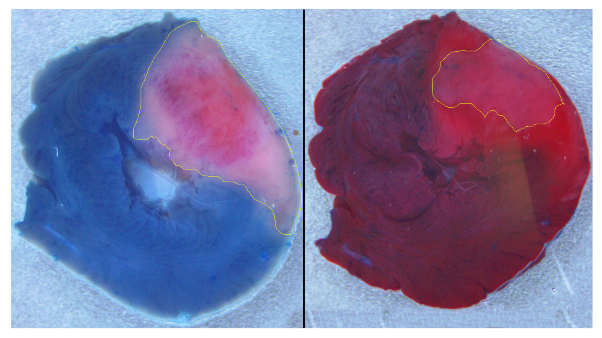
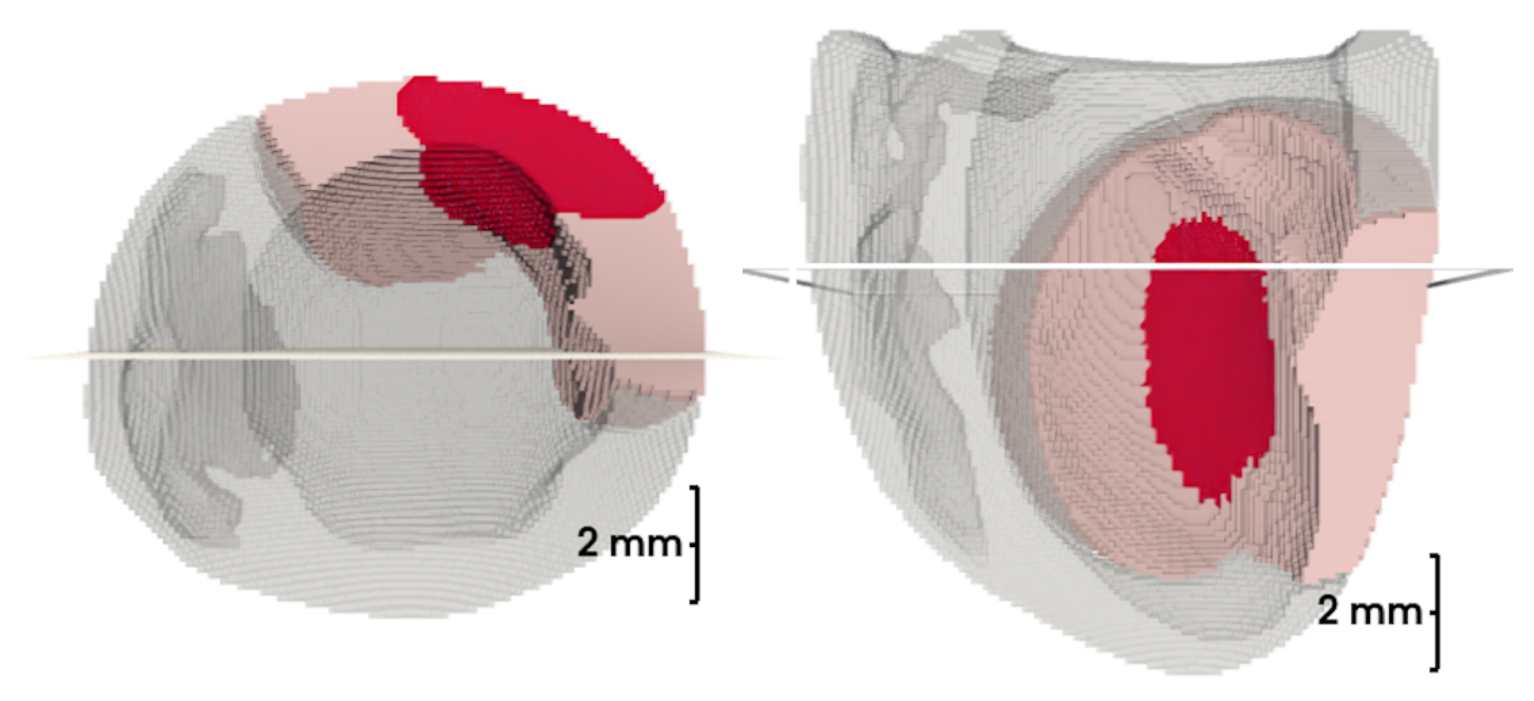
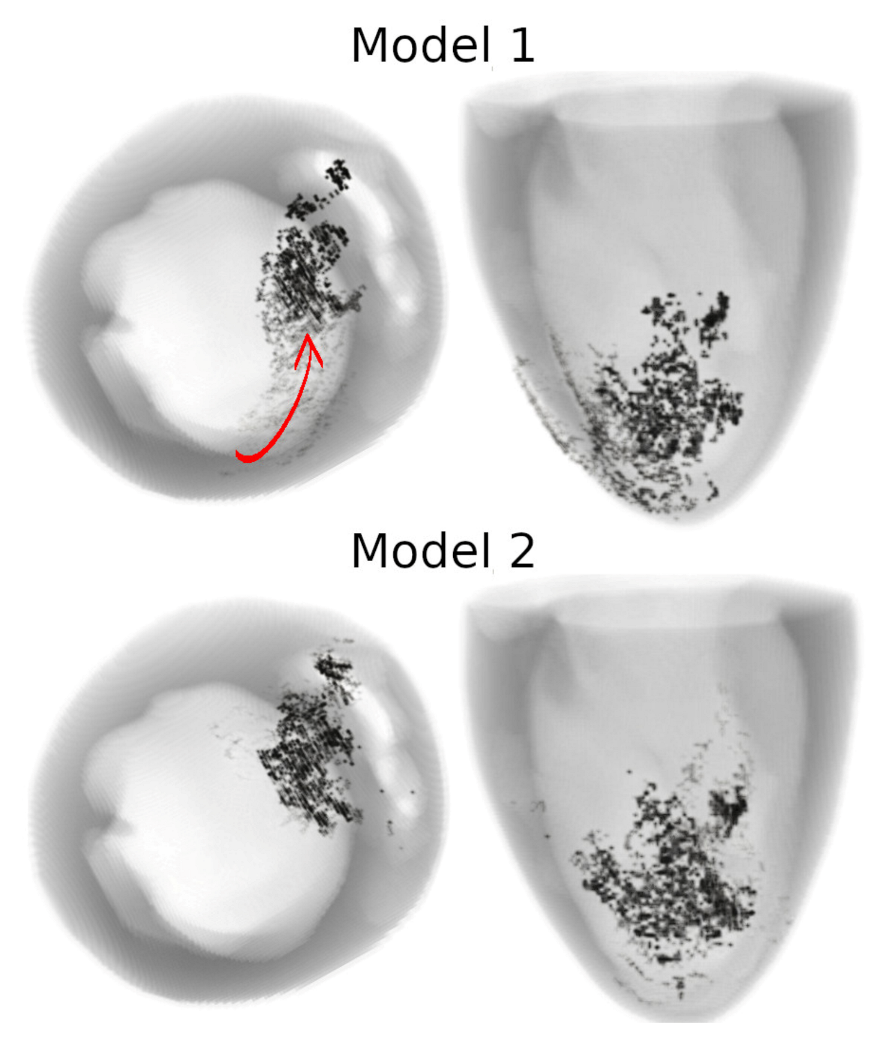
To the best of our knowledge, this is the first model to simulate infarction injury in the rat heart (see Figure 2). We built a ventricular model with an inexcitable transmural scar and an associated border zone with modified activity reflecting cellular remodeling. The shape and dimensions of the scar and border zone were set to be similar to what we observed in our experiments on ischemia-reperfusion injury in the rat heart (see Figure 1).
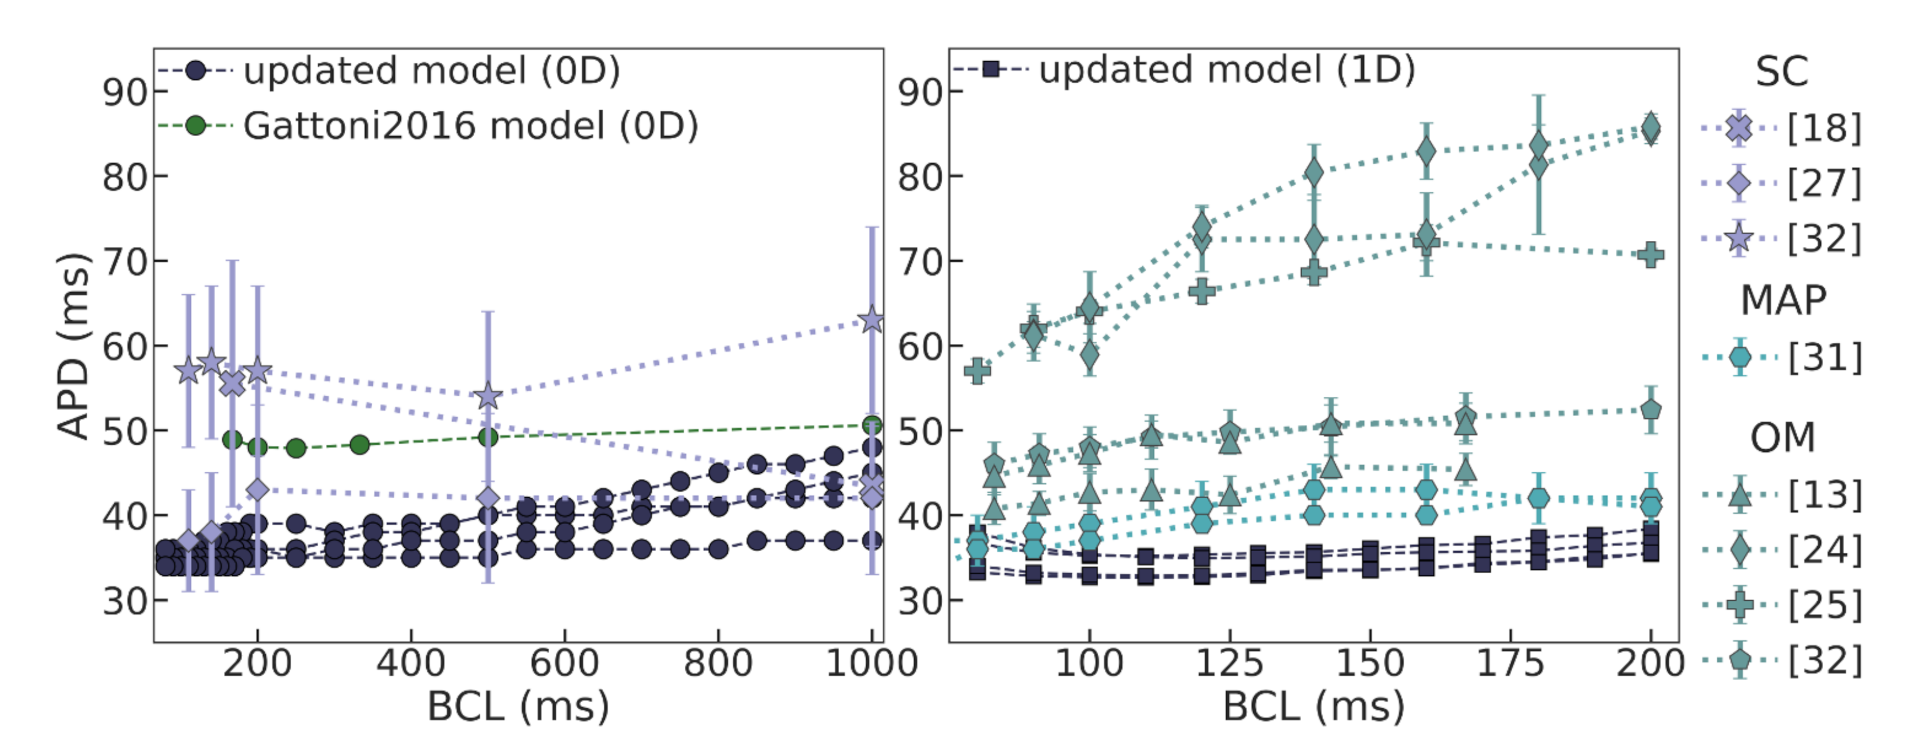
To develop the anatomical model, we first studied and updated the Gattoni2016 cellular model to be able to reproduce cellular activity at high pacing rates. We also made some modifications to increase the numerical stability of the model. This was an essential step in order to be able to reproduce excitation sources in the tissue with periods in a range of 10–20 Hz [24,35,36,37]. This is similar to what is measured in the rat heart during various arrhythmias, including those induced by ischemia-reperfusion interventions in rats [
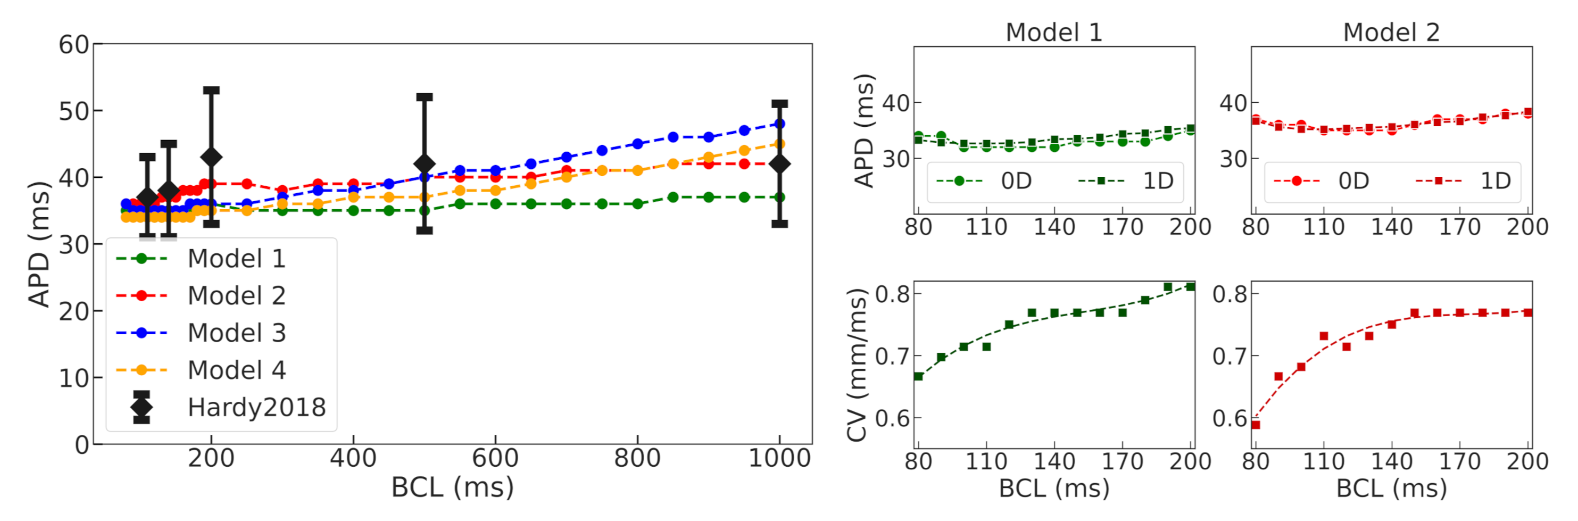
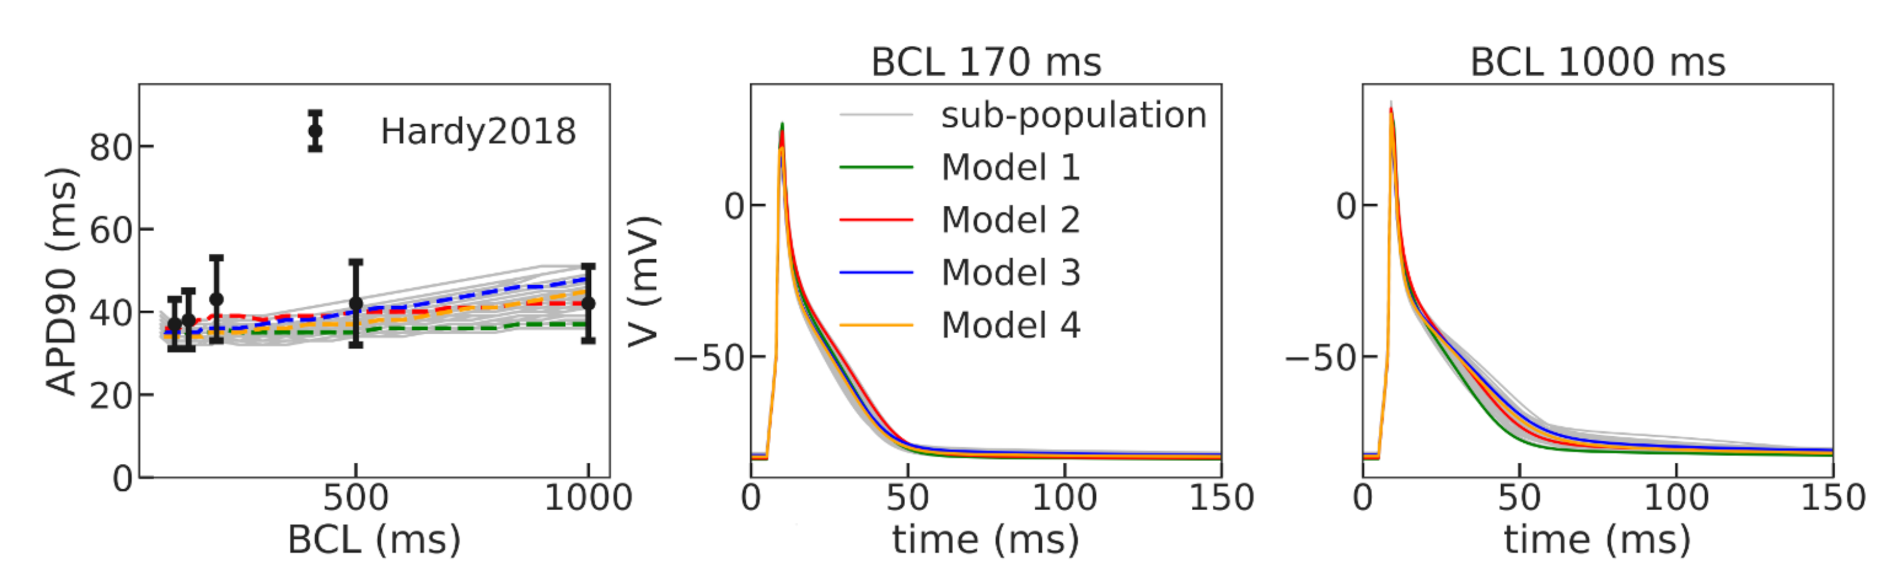
37]. Using a population-of-models approach, we tested 10,000 Gattoni2016 cellular models with varied parameters and selected four examples of cellular models which had APD restitution curves consistent with the experimental data (see Figure 5 and 
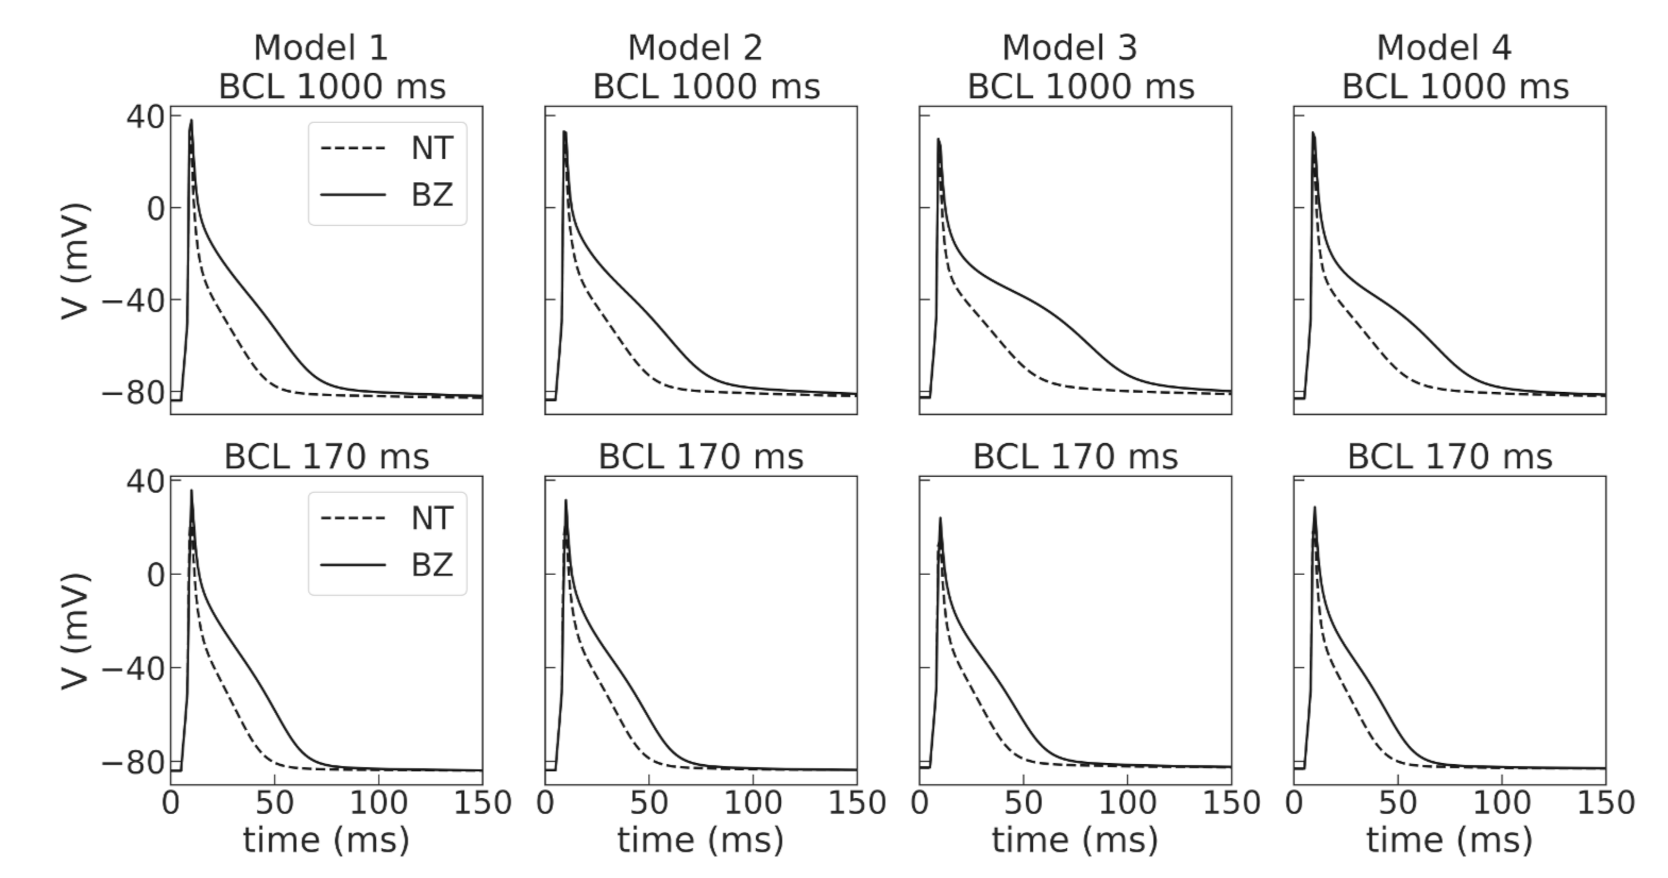
Figure A2) and were suitable for stable long-running simulations at high pacing rates for thousands of cycles. The baseline models for normal tissue were then modified to simulate APD elongation in the border zone of the post-infarction scar (see Figure 4), as reported in experimental studies [39]. Then, we performed simulations in 1D tissue strands composed of normal tissue cells to check if the APD restitution curves for propagating waves are close to those of single cells, and conduction velocity in the tissue models is in the physiological range.
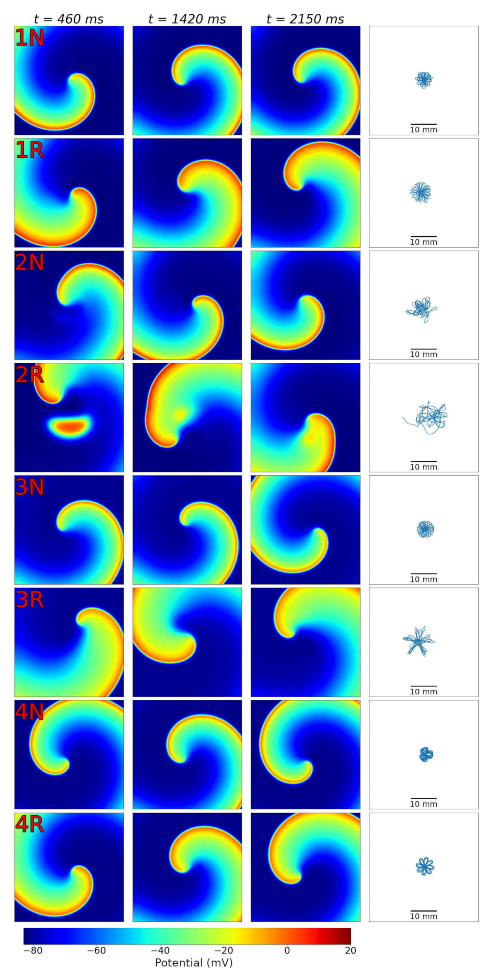
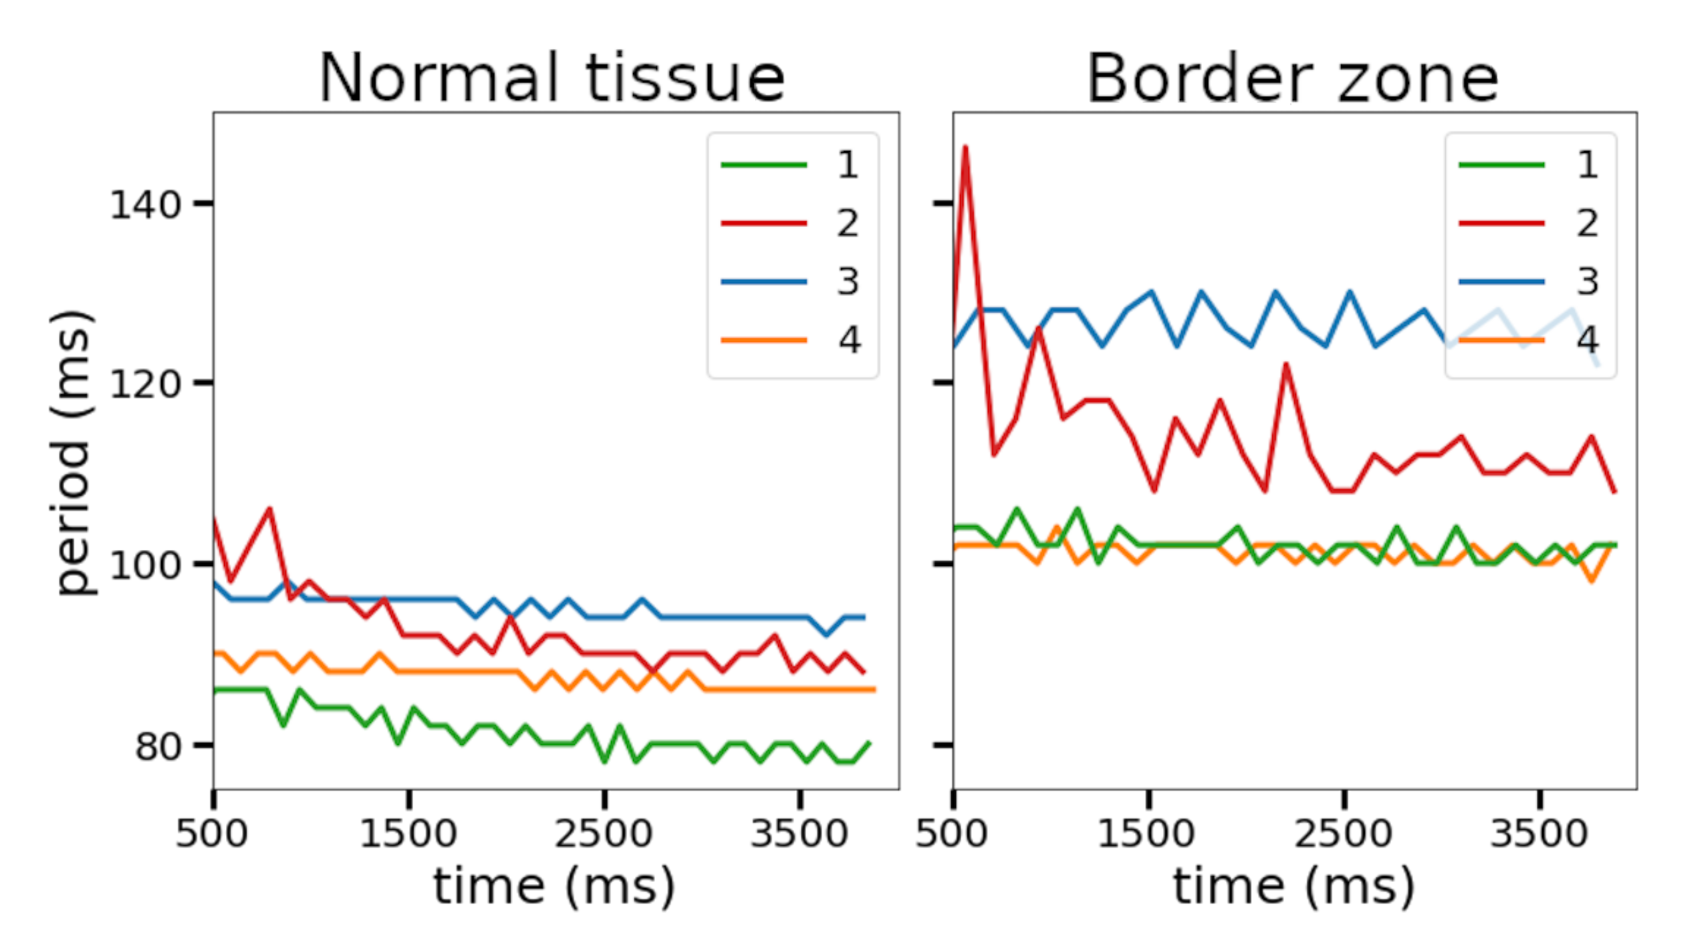
The next important step of our study was to simulate spiral waves in 2D tissue. We compared wave dynamics, using four selected cellular ionic models, with baseline parameters for normal tissue and modified parameters for the border zone (see Figure 6). In this setting, we found periods of spiral waves varying from 82 to 126 ms (see Table 4), which is consistent with experimental studies [24,37]. The longer periods of waves were produced by modified models with longer action potentials. Additionally, all models showed meandering dynamics of the spiral waves with a different degree of meandering. One of the models (Model 2) in the border zone tissue showed unstable behavior, leading to the formation of additional wave breaks (row 2R in 
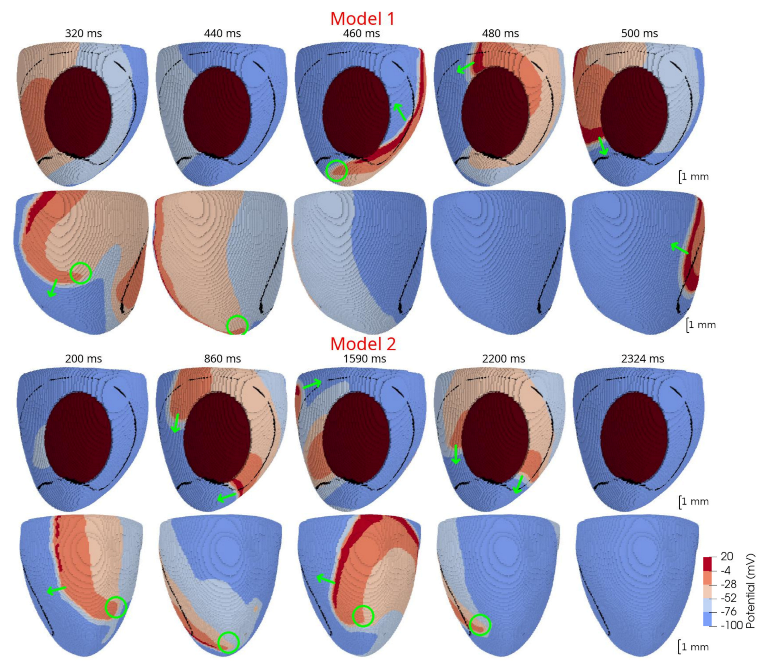
Figure 6). The stable Model 1 and unstable Model 2 were then used to simulate scroll waves in the ventricular rat models.
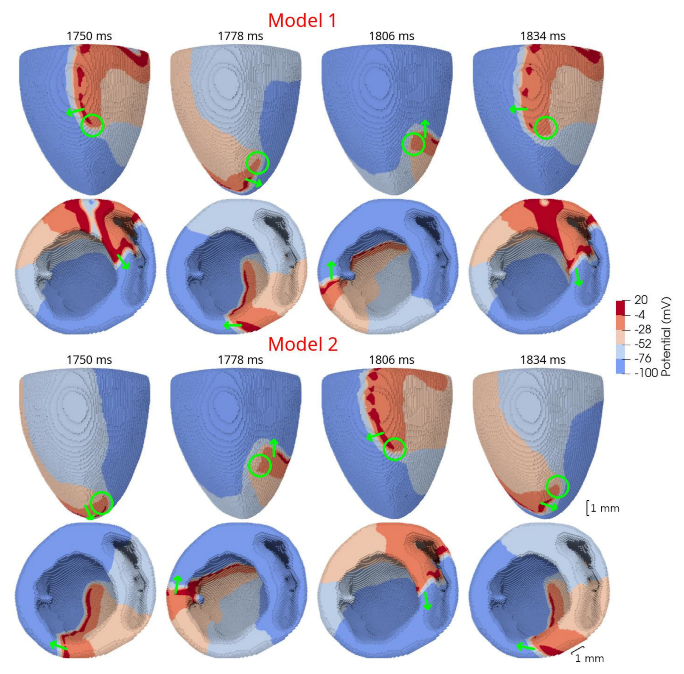
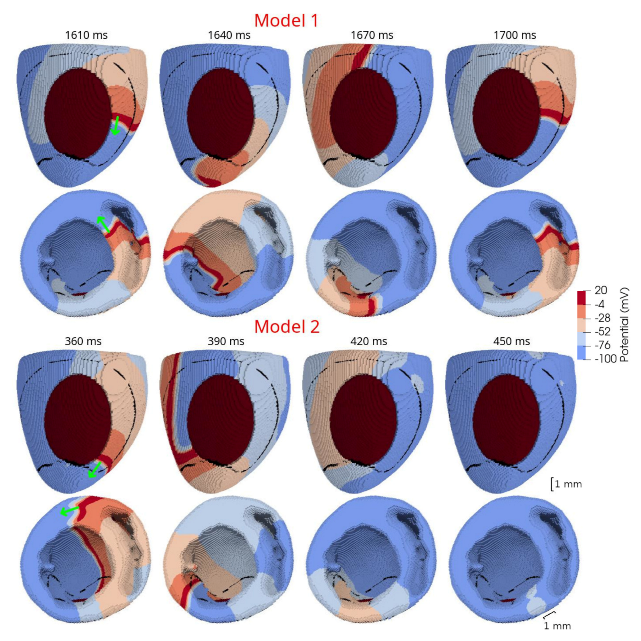
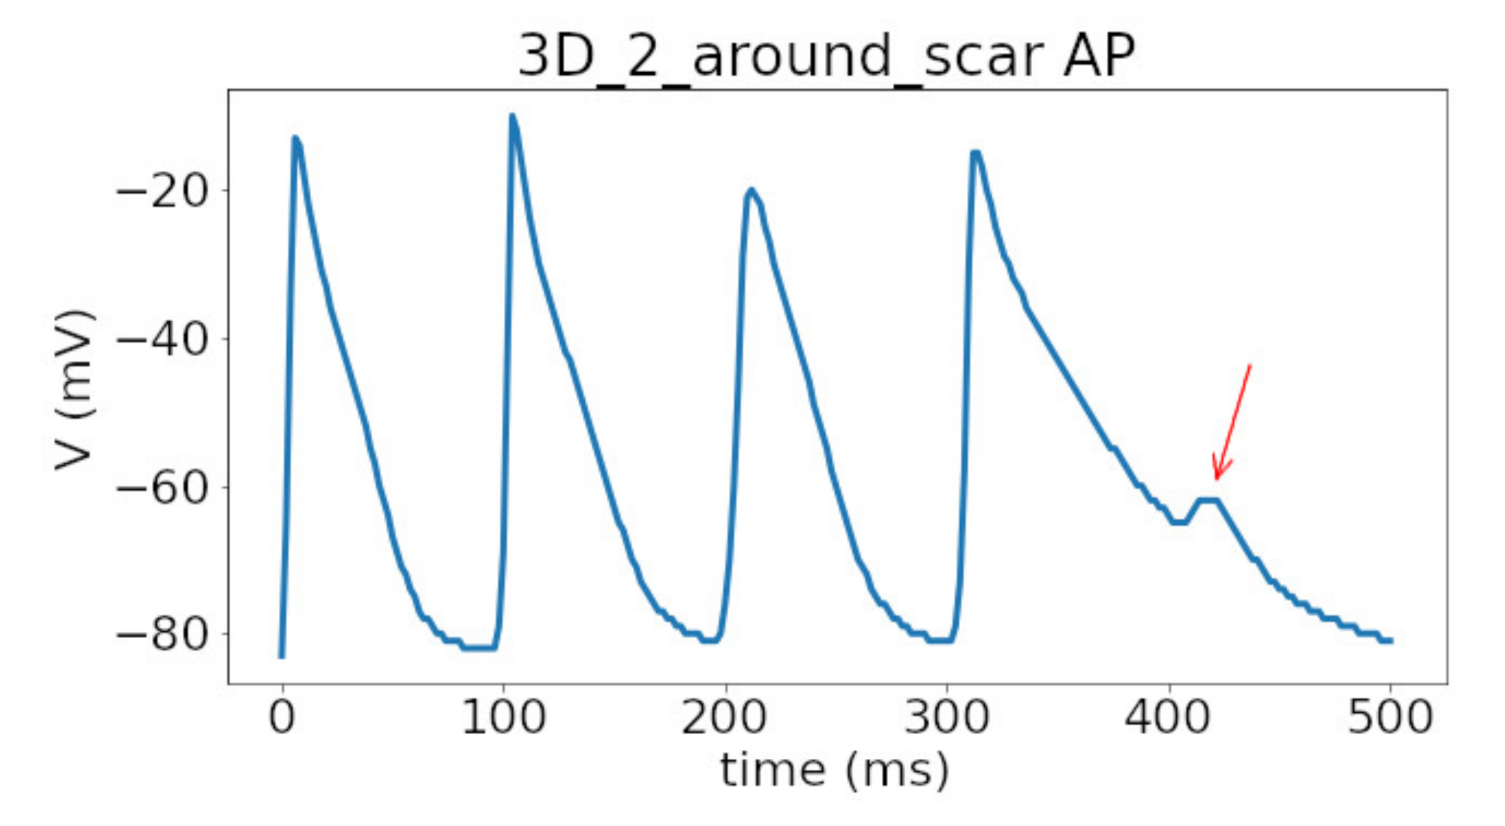
In 3D models of rat ventricles, we introduced an inexcitable post-infarction scar, with a border zone containing cells with modified ionic activity. In the models without the scar, we found no qualitative difference between the ventricular models utilizing the Cellular Models 1 and 2. Both models produce stable scroll waves with rotation periods of 83-90 ms, which is consistent with experimental data. The presence of the scar obstacle and cellular heterogeneity in the myocardium lead to the divergent behavior of the scroll waves in the two models. For Cellular Model 1 a scroll wave initiated near the scar remained stable VT-like (single scroll wave filament) for 2 s (20 rotations), while for Cellular Model 2, the scroll wave self-terminated after four rotations in the ventricles. When initiated outside of the scar region, the scroll wave drifted to the scar area and anchored around the scar in the case of Cellular Model 1, while it rotated with the initial core location before terminating in the case of Model 2.
The results of our study confirm the applicability of a multi-scale species-specific computational model of a rat heart, which reproduces a ventricular geometry and fiber orientation in combination with a detailed ionic model of cellular electrophysiology to study VT and VF-like arrhythmia in the rat heart under myocardial injury. The model provides the scientific community with a tool to study the effects of specific interventions aimed to reduce myocardial injury both in terms of dimensions of the scar and in terms of the change in the functional properties of cardiac tissue.

4.2. On Species-Specific Models of Rat Heart to Study Cardiac Arrhythmia

A curious fact is that despite the rat being the most widely used laboratory animal for studying cardiac physiology and pathology, only a few rat-specific cardiac models have been developed and used to analyze experimental data. Actually, to the best of our knowledge, there are only two groups who reported on both generic models of myocardial tissue and anatomical models of rat ventricles which can be used to study arrhythmia in a species-specific environment.
In Whittaker and co-authors’ first study [16], a detailed realistic model of the gross anatomy of rat heart ventricles and myocyte orientations in tissue was developed based on the data from DT MRI. The authors focused on the effects of variations in myocyte orientations on arrhythmia induction and on the dynamics of re-entry. In contrast to our study, they used a phenomenological cellular model, created by updating a Fenton–Karma three-variable model, to simulate cellular action potentials in rat cardiomyocytes. They showed that differences in myocyte orientations could critically affect the inducibility and persistence of arrhythmias. This aspect should be further addressed by using cellular ionic models.
In the second recent article of Bi and co-authors [17], a multi-scale 3D rat ventricle model was implemented using one of the bi-ventricular geometry models from [16] and a Pandit ionic model [19] of rat cardiomyocytes. The authors were mostly focused on the numerical aspects of model calculation and a parallelization solution based on the GPU platform. While they demonstrated an example of scroll waves initiated by an S1–S2 protocol, no specific detail on the wave characteristics was provided to compare with our findings.
Compared with previous studies, our research has novelty in several aspects. The first one is the choice of the cellular ionic model. There is a family of cellular ionic models first developed by Pandit and co-authors in 2001 [19] and then updated by several groups [18,40]. However, none of the models has been systematically validated for studying cardiac arrhythmia, where the frequency of cardiac cycling essentially increases over a physiological range. In the experimental rat models of VT and VF, the frequency of spontaneous activity measured in the heart is in a range of 10–20 Hz [36]. In this case, cellular models which are appropriate to study VT and VF should reproduce activity at high pacing rates and allow stable long-term runs in these conditions. However, the most frequent reference pacing rate used to develop cellular models is 1 Hz (e.g., [19,40]), which is out of the physiological and especially pathological ranges in rats. Unfortunately, some existing models were not specifically curated to ensure a robust performance at high frequencies. In particular, we have not been able to run the Pandit model at pacing rates higher than 6 Hz using Myokit software with an adaptive time step provided by the CVODE solver. Moreover, for those BCLs where we were able to calculate the models, we found a negative restitution curve which is not consistent with most of the experimental data on rats. The recent Gattoni2016 cellular model [18] inherited the Pandit description of ionic currents but was upgraded for the description of Ca 2 + dynamics in cells. It was specifically developed to simulate activity at high pacing frequencies in rat cardiomyocytes with a focus on the frequency-dependence of Ca 2 + dynamics in the cells. Indeed, the reference model reproduces experimental data on APD shortening and an increase in the duration of the intracellular Ca 2 + 
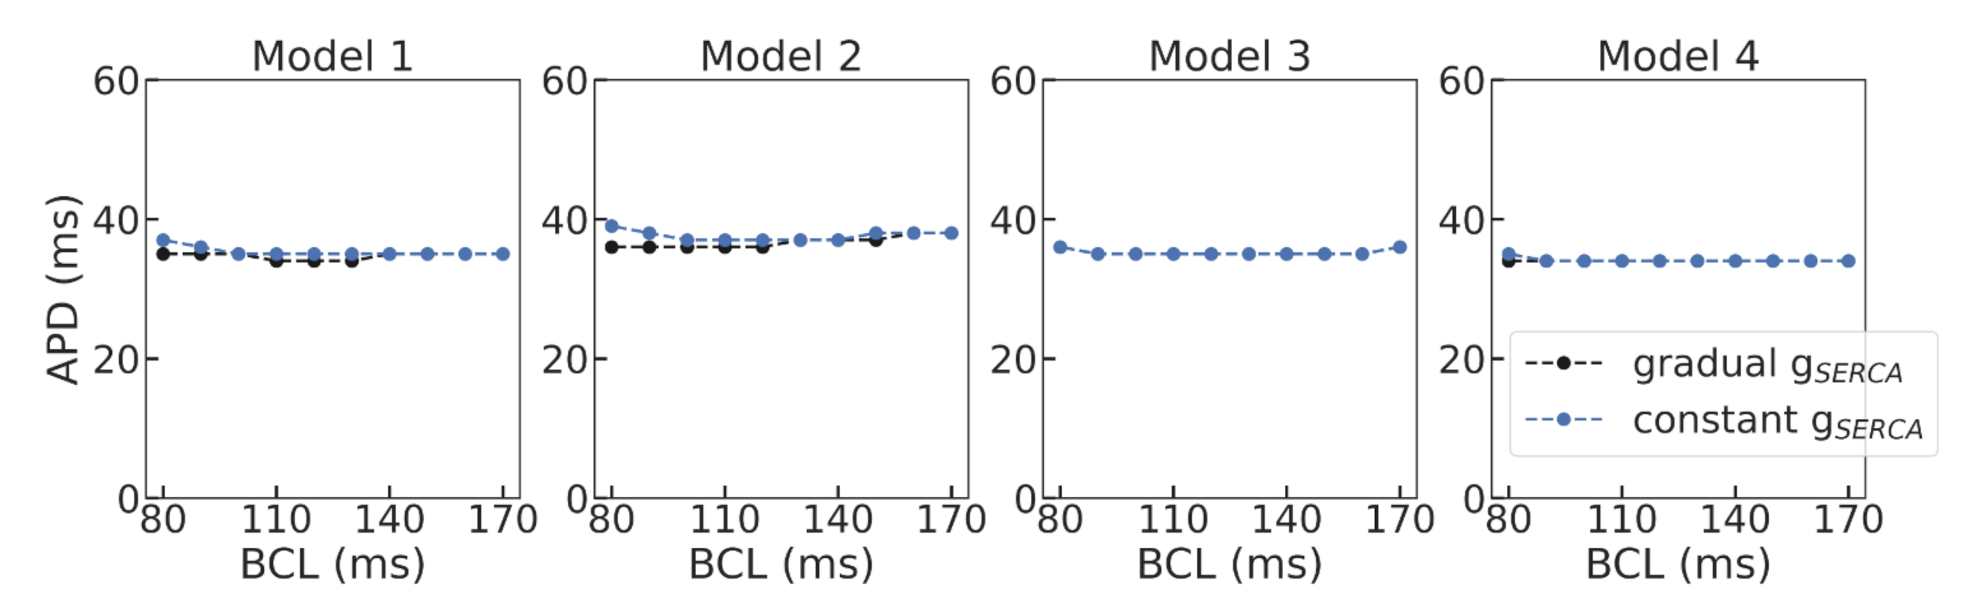
, which occurs with an increase in the pacing rate. This was achieved through manually setting the frequency-dependence of the SERCA pump rate via increasing the g S E R C A parameter with increasing pacing rate. The model was tested by the authors at frequencies of up to 6 Hz, so additional testing had to be carried out to ensure its applicability for even faster pacing. Moreover, the suggested phenomenological dependence of the SERCA rate on pacing frequency is reasonable for the steady state, reflecting the cumulative effects of several regulatory mechanisms adjusting cellular activity to the pacing rate. Actually, in the intact heart, this adaptation needs several cycles to approach the new level of cellular parameters. Such a model seems not quite appropriate in a dynamic setting where the cycle length may change from cycle to cycle and there is no time to adjust the model parameters for new cycle length conditions. However, the Gattoni2016 cellular model failed to reproduce a positive restitution curve with any constant g S E R C A parameter assigned to BCLs of either 1000 ms or 600 ms. Moreover, the model also showed unstable behavior at frequencies higher than 6 Hz. Therefore, the first step of our study was to search for an appropriate cellular model to be used in the dynamic VT-like simulations in the tissue.
We utilized a baseline Gattoni2016 cellular model and built a population of models by varying a number of model parameters in a range of 0–200% of the original reference values. Models demonstrating instabilities during the series of calculations and/or not meeting calibration criteria for action potential and Ca 2 + 
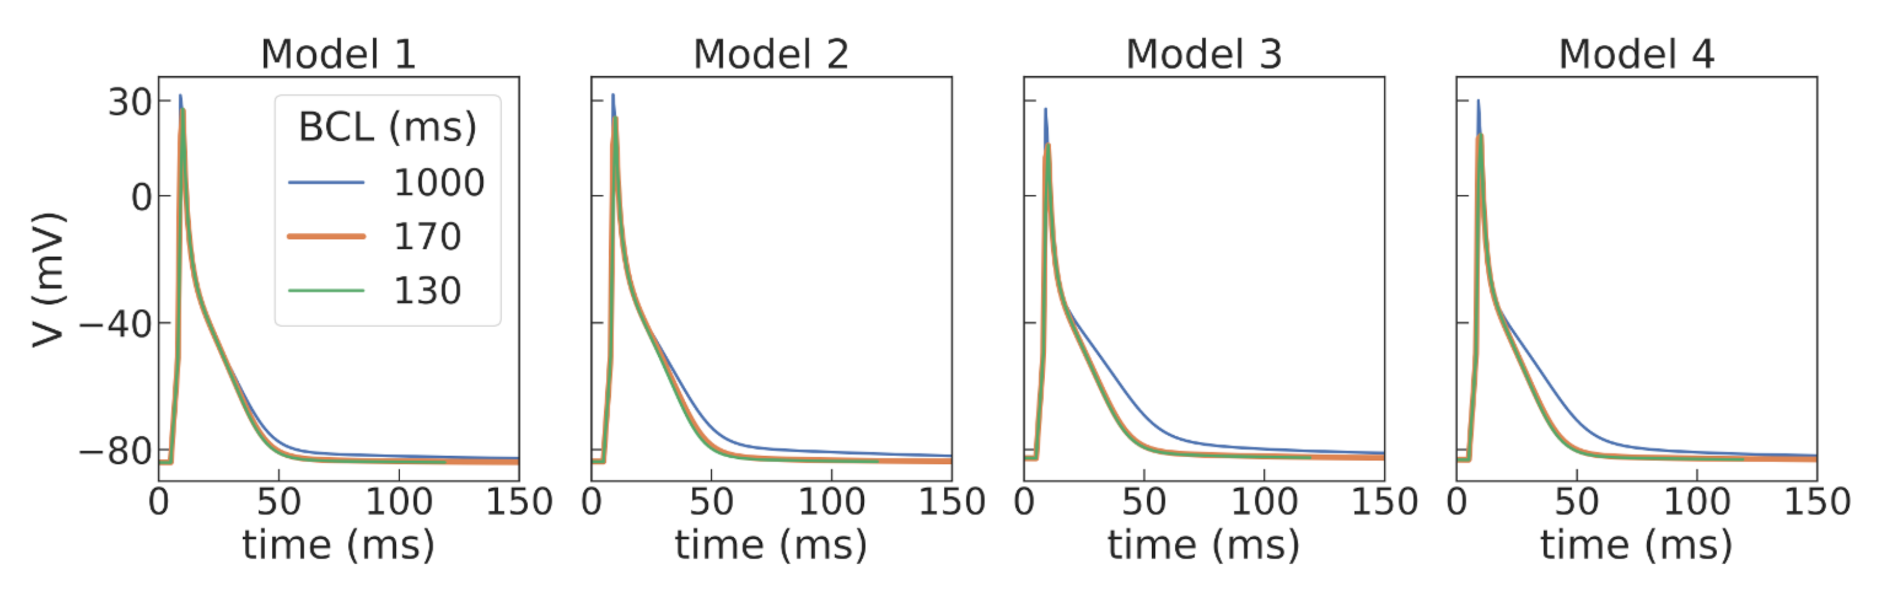
transient characteristics based on experimental data were rejected. The next step of model validation was to ensure consistency with experimental data on APD restitution in cells and myocardial tissue. In this study, we did not intend to reproduce particular restitution curves measured in experiments. For the purpose of our study, we were satisfied with any model that produces a positive restitution curve with a flat area at high pacing rates within an experimental range. Therefore, we have selected four such models with varying combinations of parameters as non-implausible samples from a population of applicable cellular models (see Table 1). Despite the essential variety in model parameters, especially those for the L-type calcium current ( J L ), the SERCA pump ( g S E R C A ) and sodium-calcium and sodium-potassium exchangers ( g N C X and I N a K m a x ) governing intracellular Ca 2 + dynamics, our selected models produce action potential and restitution curves with similar characteristics (see Figure 3 and Figure 5, Table 2). This indicates rather wide uncertainty in the model parameters, which could affect the simulation results as we showed in tissue settings (see discussion below). In case research aims to provide a more precise simulation of experimental restitution curves, one may use an approach suggested recently by Coveney and co-authors [41], which is aimed to decrease uncertainty in the model parameter choice.
Then, the four models were used to simulate cellular remodeling in the myocardium of the post-infarction scar border zone. Consistent with experimental data, we modified the model parameters of potassium currents g t o and g s s , as suggested in [29], in the selected models to simulate APD elongation in the border zone of an infarct scar. Of note, the response of our models was different to the same relative parameter change. Model 2 showed the highest effect of the ionic remodeling on APD, so we had to change the relative decrease in g t o from 45 to 35% and in g s s from 39 to 29% compared to other models to avoid the EAD-like prolongation of action potentials during the repolarization phase in the single-cell simulations, as in the presence of EADs it is impossible to fit experimentally observed APD restitution curves. However, there is experimental data of either no significant change in APD [35,42] or even the opposite, namely APD shortening in the border zone [43]. The direction of APD change depends on the stage of ischemia development, where APD shortening may reflect the activation of ATP-dependent potassium currents in the acute phase of ischemia development. APD elongation, on the other hand, may be associated with long-term opposite processes of cellular adaptation with a partial inhibition of potassium currents after reperfusion [43]. Different scenarios of cellular remodeling could be analyzed further within the ventricular models.
The four selected ionic models were used to compare the dynamics of spiral waves initiated in 2D isotropic tissue using S1–S2 protocols. We computed generic tissue sheet models composed of either baseline cardiomyocyte models for normal tissue or modified border zone models with elongated action potentials. The tissue model with modified Cellular Model 2 demonstrated a specific behavior compared to the other models. The variation of the wave rotation period and meandering area was the highest in this model (see Figure 6 and Figure 7). Moreover, a spiral wave initiated via an S1–S2 protocol in this model was broken up at 490 ms, and then the two waves collapsed into one wave again which continued rotation. Note that the conduction velocity restitution curves for Models 1 and 2 show similar dependencies (see Figure 5). Thus, we think that the instabilities which we observe are related to cellular (EAD) dynamics and not to conduction velocity restitution. The dependence of spiral waves on cellular properties has been demonstrated by Pathmanathan and co-authors in canine models of myocardial tissue [44]. They studied the effects of parameter uncertainties in a cellular model on spiral wave dynamics in 2D tissue. Among all the parameters varied in the study, I C a , L uncertainty had the greatest impact on the tissue results, strongly affecting the type of re-entrant behavior. Consistent with these results, our Model 2 has the greatest value of maximal conductance J L of the I C a , L current among the models we tested, suggesting its potential contribution to instability in the tissue.
In the third part of our study, we used a rat ventricular geometry and myocyte orientation model from [16] to study scroll waves in 3D tissue. For the first time, we included a generic model of post-infarction scar and border zone into the LV model and used two different cellular ionic models to compare scroll wave behavior. The dimensions and location of the scar were similar to what we observed in experimental models of ischemia reperfusion in rats. Note that we did not intend to reproduce the exact shape and structure of the infarction injury area as observed in the experiment. In contrast, we used a simplified description of the scar and border zone, simulating the former as a non-excitable area and the latter as a uniform area containing cardiomyocytes with modified properties compared to normal tissue. It has been well documented that the activity in the infarct border zone within the intact heart depends not only on the properties of surviving myocardial cells, but also on structural changes in the area around the scar. It was shown that this region is extremely heterogeneous with fibrous inclusions and discontinuities in myocyte orientation, which can significantly influence electrical activity in the tissue along with cellular remodeling [7,35,43,45]. Comprehensive imaging and analysis of the structure and function in the infarct border zone and simulations of their consequences for excitation abnormalities in a rat ventricular strand were performed by Rutherford and co-authors [46]. They demonstrated that structural heterogeneity in the per-infarct region provides a substrate for unidirectional propagation, rate-dependent regional slowing, and a conduction block. In our study, we were focused on the more general research question related to the possibility of simulating the instabilities of scroll wave rotation with a realistic anatomical ventricular geometry with the presence of a heterogeneity associated with myocardial damage accompanied by ischemia-reperfusion remodeling. Using different baseline cellular models, we were able to observe different behaviors of the scroll waves. We found either stable VT-like behavior of a scroll wave anchoring on the border of the scar independently of the two starting locations that we considered (see Figure 9 and Figure 10, Model 1), a self-terminating scroll wave initiated at the scar border, and a stabilized wave initiated outside of the scar area in the case of Cellular Model 2 (see Figure 9 and Figure 10, Model 2). Our results are in line with simulations by Whittaker and co-authors [16], who have also observed different scenarios of scroll wave evolution in rat ventricular models without myocardial damage depending on the fiber orientation and the location of the wave induction area.
A comparison of scroll waves produced by different cellular models in a subject-specific anatomical ventricular model of swine heart with ischemia damage was recently performed by Ramirez and co-authors [47]. The authors implemented a hybrid model of swine ventricular geometry with two cellular models of action potential in human cardiomyocytes using a phenomenological FK model [30,48] and an ionic TP06 model [49]. They concluded that model choice is essential in terms of variations in local APD restitution within ventricles with heterogeneous cellular properties along and across the wall within the LV and between the two ventricles. At the same time, the propensity and characteristics of VF are mainly controlled by anatomy and structural parameters, rather than by regional restitution properties. In contrast, the results of our simulations suggest that even little variations in the regional properties in small rat hearts may essentially affect macroscopic scroll wave dynamics. This result points out possible difficulties in transferring the results of experiments and simulations from a small rat heart to a large human heart.

5. Limitations

Our study has obvious limitations. First, our model utilized a simplified shape and structure of the infarction injury. Conventionally, myocardial damage reduction in rat models of ischemia/reperfusion is primarily assessed by looking for a reduction in the damage area, while the other analyzed biomarkers are chosen based on the specific research aims. Therefore, we assumed that the size of infarction injury is one of primary importance to be first addressed in an in silico study of electrophysiological consequences. However, numerous data from experiments and models of different species show that the shape and detailed structure of the infarct zone is crucial in pathology development [43,46,50]. The problem with experimental data available from histology imaging of the injury is that they are mainly performed on exerted hearts whose geometries significantly differ from those of intact hearts. This requires the development of special approaches to reconstruct the real geometry to be used in electrophysiology simulations. Using CT/MRI imaging techniques could help to improve the models. However, such an approach is rather expensive, labor-intensive and not available everywhere for rat experiments. As a result, it is not used routinely in studies aimed to reveal the mechanisms and treatments reducing ischemia/reperfusion damage in the heart. These limitations highlight the need of novel data analysis techniques including artificial intelligence to be able to integrate the data of different modalities for building a realistic subject and species-specific models of myocardial injury.
Functionally, our model of an infarction injury region is also simplified, as we simulated the scar region as an inexcitable obstacle and the border zone as an area with uniformly modified cellular properties. Even such simplified pathological heterogeneity in the ventricles allowed us to reproduce scroll wave instability in the rat models. Experimental data in rat ischemia/reperfusion models using optical mapping techniques exhibited much more complex behavior in the infarct zone [45,46]. The scar area has been shown to contain partially excitable inclusions of viable cells and fibroblast/myofibroblast electrical activity affecting the surrounding myocardial tissue. The border zone appears to be extremely heterogeneous tissue with cardiomyocyte disarray and discontinuity and have a complex fibrosis texture, with complicated interactions between cardiomyocytes and other cells occupying the area during injury development [46]. These structural and functional changes may result in a decrease in conduction velocity, local propagation blocks, spontaneous activity and local re-entry in this zone [46]. Details on possible micro- and macroscopic consequences of such pathological heterogeneity have to be analyzed in future simulation studies.
In our study, we observed complex excitation dynamics in tissue models with a cellular ionic model, Model 2, which were related to the onset of EADs. It will be interesting in future work to address more systematically possible effects of EADs on arrhythmia dynamics in the rat model, by changing the balance between inward and outward currents and, as in [34,51], classify the observed excitation regimes.
We have not accounted for intrinsic cellular heterogeneity in the heart, which is shown as an important physiological determinant of excitation and contraction in a normal heart. In particular, specific regional gradients of APD across and along the LV walls and between RV and LV were reported in rat experimental studies [13,52,53,54] and utilized in modeling studies as well [13,17]. Myocardial injury may affect the heterogeneity patterns and create additional substrates, increasing arrhythmia propensity. This issue has to be addressed in future studies as well.
In this article, we have not analyzed specific features of Ca 2 + dynamics in cardiomyocytes of myocardial tissue during VT/VT-like excitation abnormalities. Ca 2 + dynamics is an essential part of cellular models which may affect myocardium macroscopic behavior. Therefore, computational cellular and tissue electrophysiological models have to be validated against available experimental data not only on the myocardial electrical activity itself, but on the Ca 2 + dynamics as well. Here, we created a digital instrument to study arrhythmia in a rat heart, which can also be used to study the role of Ca 2 + dynamics in the initiation and evolution of arrhythmia under infarction injury.

6. Conclusions

An experimental ischemia-reperfusion model of rats is widely used to study the effects of various interventions aimed at reducing ischemic damage. We have built a species-specific multi-scale electrophysiological model of rat ventricles with a realistic geometry of ventricles containing a post-infarction scar and modified activity of cardiomyocytes in the border zone. Using various ionic models generating action potentials in cells from normal tissue and border zone, we have simulated scroll waves in the ventricles and reproduced different scenarios that have been observed in experiments: stable rotation, break-up and annihilation. Thus, the rat ventricular models which we developed showed their applicability to reproduce the basic properties of cardiac arrhythmias. Hence, they can be used for in silico studies of effects induced by ischemia-reperfusion injury and for in silico analysis of possible treatment strategies.

Supplementary Materials

The following are available online at https://www.mdpi.com/article/10.3390/math9202604/s1.

Author Contributions

Conceptualization, A.P. and O.S.; investigation, R.R., T.N., A.P. and O.S.; methodology, A.P. and O.S.; resources, E.P., D.S. and M.G.; software, R.R., T.N. and T.D.C.; visualization, R.R. and T.N.; writing—original draft, R.R., T.N., T.D.C., K.U., A.P. and O.S.; writing—review and editing, R.R., T.N., T.D.C., A.P. and O.S. All authors have read and agreed to the published version of the manuscript.

Funding

This study has been supported by a grant from the Ministry of Science and Higher Education of the Russian Federation (agreement #075-15-2020-800).

Institutional Review Board Statement

This study was conducted in conformance with the policies and procedures detailed by the “Institutional Animal Care and Use Committee” (IACUC). All animal experimental protocols and procedures were reviewed and approved by the Committee for the Control of the Maintenance and Use of Laboratory Animals of the V. A. Almazov National Medical Research Center (date: 06-FEB-2020. application number: 20-01).

Data Availability Statement

Data related to this study can be provided by the corresponding authors on request.

Acknowledgments

We are thankful to Olivier Bernus and Alan P. Benson for valuable discussions.

Conflicts of Interest

The authors declare no conflict of interest.

Abbreviations

The following abbreviations are used in this manuscript:
VTventricular tachycardia
VFventricular fibrillation
LVleft ventricular
RVright ventricle
SRsarcoplasmic reticulum
SERCASR Ca 2 + -ATPase
APDaction potential duration (where not specially indicated, APD = APD 90 )
APD X action potential duration at X% repolarization
CVconduction velocity
BCLbaseline cycle lengths
EADearly after-depolarization
NTnormal tissue
BZborder zone
SCsingle cells
MAPmonophasic action potential
OMoptical mapping
ECGelectrocardiography
DT MRIdiffusion-tensor magnetic resonance imaging
CTcomputed tomography
Vtransmembrane potential
I N a fast sodium current
I C a , L L-type calcium current
I p C a calcium pump current
I t o transient outward potassium current
I K 1 inward rectifier potassium current
I s s steady state outward potassium current
I N a K sodium-potassium exchange current
I N C X sodium-calcium exchange current
I f hyperpolarized activated current
I b C a background calcium current
I b N a background sodium current
I b K background potassium current
g S E R C A the maximal velocity of the SERCA pump
g D the Ca 2 + flux rate from dyadic space to cytosol
J L permeability of a single L-type calcium channel
g N C X pump rate of I N C X
g t o maximum conductance parameter of I t o
g s s maximum conductance parameter of I s s
I N a K m a x maximum I N a K

Appendix A

Appendix A.1. Effects of Model Parameter Variation in the Gattoni2016 Cellular Ionic Model

We performed a uni-parametric variation using 16 parameters of ionic current conductance for transmembrane ionic currents and intracellular Ca 2 + flows in the Gattoni2016 cellular model [18]. Each parameter was varied in a range of 10–200% of the reference value from the original article with a step of 10%. The change in APD (as a percentage of the baseline APD value) at each varied parameter was evaluated for three BCLs of 110, 170 and 1000 ms. The first (Q1) and third (Q3) quartiles (the range for 50% of the distribution) for the distribution of APD increments were used as a measure of the parameter variation effect on the APD in the model. Table A1 shows the statistics of the effects for the 16 parameters tested. It can be seen that variation in the first 10 out of 16 parameters showed a great effect (>10%) on APD for at least one of BCLs in the Gattoni2016 cellular model (see the green cells in the Table). The first 6 out of these 10 parameters were then used for population-of-models building.
We decided to use six parameters, as this, in our view, gives an optimal trade-off of gain and complexity. The use of six parameters allows us to consider quite a large population using thousands of samples and properly fit experimental APD restitution curves. Using all 10 parameters, on the other hand, would result in millions of samples and as we need to fit whole curves, not just single action potentials, it would make the task much more challenging.
First, we selected g S E R C A for the Ca 2 + SERCA pump, as this was the only parameter in the reference model whose pacing rate dependence was essential for restitution curve and Ca 2 + dynamics simulation. Then, we selected the conductivities g t o and g s s for I t o and I s s currents as these two were also used to simulate cellular remodeling in the border zone, and we supposed that their various baseline values are essential for tissue model predictions. The remaining three parameters J L , g N C X , and I N a K m a x for L-type Ca 2 + currents, sodium-calcium and sodium-potassium exchangers are the most important ones for Ca 2 + dynamics simulation, especially for fast pacing. By varying these parameters, we were able to reject models with non-physiological Ca 2 + transient characteristics.
Table A1. Effects of uni-parametric variation on APD in the Gattoni2016 cellular model. Distributions of the relative increments in APD ( Δ APD = (APD v − APD r )/APD v * 100%, APD v − APD values with varied parameters; APD r —reference value) were evaluated. The first (Q1) and third (Q3) quartiles (the range for 50% of distribution samples around the median) are shown. Green cells indicate effects greater than ±10%.
Δ APD (%)
BCL110 ms170 ms1000 ms
QuartileQ1Q3Q1Q3Q1Q3
g S E R C A −6.7712.50−4.359.78−33.70−5.43
J L −13.5415.10−15.7620.11−26.4522.83
g N C X −6.776.77−7.077.07−38.770.00
g t o −25.5225.00−20.1134.78−19.5722.83
g s s −6.256.25−8.707.07−9.4211.23
I N a K m a x −2.080.00−2.172.17−11.9610.51
g K 1 −64.0626.04−20.1168.48−36.9689.13
N−19.2770.31−20.11638.59−32.25288.77
g p C a −4.174.17−4.894.89−15.2218.48
g C a B −2.088.85−4.3511.96−37.3210.14
g N a −6.774.17−7.074.35−9.066.52
g B K −2.082.08−2.170.54−2.902.90
g B N a 0.002.08−2.172.17−3.264.71
g S R l 0.000.000.000.00−6.166.16
J R 0.000.52−0.540.00−3.261.45
g f 0.000.000.000.000.000.00

Appendix A.2. Additional Figures and Table

Figure A1. Restitution curves and action potential signals from a sub-population of 39 cellular models consistent with experimental data from Hardy et al. [27] used for model selection. Four representative models from the sub-population were arbitrarily selected for analysis and used in tissue simulations. Restitution curves for the four selected models (colored lines) lie within the curve band for the sub-population (gray lines). The time-dependent AP signals are also within the compact corridors of signals for the other models of the family.
Mathematics 09 02604 g0a1
Figure A2. Restitution curves: simulations against experimental data. Left panel, single-cell (SC) data: restitution curves measured in experiments on SC using microelectrode techniques (SC: Gattoni et al. 2016 [18], Hardy et al. 2018 [27], Benoist et al. 2012 [32]) combined with simulation results from the original and updated Gattoni2016 cellular models. Right panel, tissue data: restitution curves measured in myocardial tissue using monophasic action potential (MAP: Benoist et al. 2011 [31]) and optical mapping (OM: Lee et al. 2016. [25], Annoni et al. 2015 [24], Benoist et al. 2012 [32], Walton et al. 2013 [13]) in rat heart combined with simulation results from the updated models of a myocardial tissue strip.
Mathematics 09 02604 g0a2
Figure A3. Comparison of APD restitution curves in the selected Gattoni2016 cellular models with gradual g S E R C A depending on BCL (black lines), and at a constant g S E R C A value assigned to 170 ms BCL (blue lines). The maximal difference between corresponding APDs is less than 3 ms.
Mathematics 09 02604 g0a3
Figure A4. Action potential at BCLs of 1000 ms (upper panels) and 170 ms (lower panels) in the four cellular models in normal tissue (NT, dashed line) and in the border zone (BZ, solid line) of post-infarction scar.
Mathematics 09 02604 g0a4
Figure A5. Trajectory of the spiral wave tip on the epicardial and endocardial surfaces in normal rat heart simulations. Time is indicated by color: the darker the point, the further it is from the beginning of the simulation. The arrow is drawn along the spiral drift path for Model 1.
Mathematics 09 02604 g0a5
Figure A6. Electrical activity at a point at the base of the heart during rotation of a wave in Model 2 shown in Figure 9, bottom rows, Video 3D_2_around_scar. The measurements were taken in the middle of the region where the white spot appears at 390 ms (Figure 9, bottom row second column). Prolonged action potential attributed to EAD is marked by an arrow.
Mathematics 09 02604 g0a6
Table A2. Steady state initial conditions at 170 ms BCL for Models 1 and 2.
NameModel 1 NTModel 1 BZModel 2 NTModel 2 BZ
m 2.3928 × 10 3 2.4342 × 10 3 2.5957 × 10 3 2.6271 × 10 3
h 7.9074 × 10 1 7.8551 × 10 1 7.7529 × 10 1 7.7027 × 10 1
j 7.2459 × 10 1 6.5277 × 10 1 6.9011 × 10 1 6.2179 × 10 1
r 1.5843 × 10 3 1.5998 × 10 3 1.6618 × 10 3 1.6709 × 10 3
s 9.7761 × 10 1 9.5150 × 10 1 9.7325 × 10 1 9.4909 × 10 1
s slow 5.4055 × 10 1 3.2820 × 10 1 5.1283 × 10 1 3.4070 × 10 1
r ss 2.1256 × 10 3 2.1462 × 10 3 2.2230 × 10 3 2.2390 × 10 3
s ss 3.3446 × 10 1 2.8410 × 10 1 3.1319 × 10 1 2.6928 × 10 1
y 4.2945 × 10 3 3.3817 × 10 3 3.9400 × 10 3 3.2062 × 10 3
z 1 9.1920 × 10 1 8.5225 × 10 1 8.8825 × 10 1 8.2544 × 10 1
z 2 8.2829 × 10 3 8.0167 × 10 3 8.0900 × 10 3 7.8147 × 10 3
z 3 7.1870 × 10 2 1.3843 × 10 1 1.0273 × 10 1 1.6519 × 10 1
[ Na + ] i ( mM ) 9.1458 × 10 0 9.1952 × 10 0 9.4652 × 10 0 9.5314 × 10 0
[ Ca 2 + ] i ( mM ) 1.8354 × 10 4 2.3000 × 10 4 1.9585 × 10 4 2.3655 × 10 4
[ K + ] i ( mM ) 1.4196 × 10 2 1.4196 × 10 2 1.4086 × 10 2 1.4083 × 10 2
[ Ca 2 + ] SR ( mM ) 1.4974 × 10 0 1.1645 × 10 0 1.5351 × 10 0 1.2787 × 10 0
trpn ( mM ) 5.8061 × 10 2 5.5213 × 10 2 5.7175 × 10 2 5.4676 × 10 2
V ( mV ) 8.4214 × 10 1 8.4102 × 10 1 8.3683 × 10 1 8.3601 × 10 1

References

  1. Rodríguez, B.; Trayanova, N.; Noble, D. Modeling cardiac ischemia. Ann. N. Y. Acad. Sci. 2006, 1080, 395–414. [Google Scholar] [CrossRef] [PubMed]
  2. Black, S.; Rodger, I. Methods for studying experimental myocardial ischemic and reperfusion injury. J. Pharmacol. Toxicol. Methods 1996, 35, 179–190. [Google Scholar] [CrossRef]
  3. Chimenti, S.; Carlo, E.; Masson, S.; Bai, A.; Latini, R. Myocardial infarction: Animal models. Methods Mol. Med. 2004, 98, 217–226. [Google Scholar]
  4. Hall, L.; Guo, C.; Tandy, S.; Broadhouse, K.; Dona, A.C.; Malle, E.; Bartels, E.D.; Christoffersen, C.; Grieve, S.M.; Figtree, G.; et al. Oral pre-treatment with thiocyanate (SCN(-)) protects against myocardial ischaemia-reperfusion injury in rats. Sci. Rep. 2021, 11, 12712. [Google Scholar] [CrossRef] [PubMed]
  5. Staab, R.; Lynch, V.; Lau-Cam, C.; Barletta, M. Small Animal Model for Myocardial Infarction. J. Pharm. Sci. 1977, 66, 1483–1485. [Google Scholar] [CrossRef] [PubMed]
  6. Akbay, E.; Onur, M. A new modified myocardial infarction animal model. J.-Cardiovasc. Surg. 2013, 1, 68. [Google Scholar] [CrossRef] [Green Version]
  7. Weigand, K.; Witte, R.; Moukabary, T.; Chinyere, I.; Lancaster, J.; Pierce, M.K.; Goldman, S.; Juneman, E. In vivo Electrophysiological Study of Induced Ventricular Tachycardia in Intact Rat Model of Chronic Ischemic Heart Failure. IEEE Trans. Biomed. Eng. 2017, 64, 1393–1399. [Google Scholar] [CrossRef]
  8. Keldermann, R.H.; ten Tusscher, K.H.W.J.; Nash, M.P.; Hren, R.; Taggart, P.; Panfilov, A.V. Effect of heterogeneous APD restitution on VF organization in a model of the human ventricles. Am. J. Physiol. Heart Circ. Physiol. 2008, 294, H764–H774. [Google Scholar] [CrossRef] [PubMed] [Green Version]
  9. Keldermann, R.H.; ten Tusscher, K.H.W.J.; Nash, M.P.; Bradley, C.P.; Hren, R.; Taggart, P.; Panfilov, A.V. A computational study of mother rotor VF in the human ventricles. Am. J. Physiol. Heart Circ. Physiol. 2009, 296, H370–H79. [Google Scholar] [CrossRef] [PubMed] [Green Version]
  10. Lawson, B.A.J.; Oliveira, R.S.; Berg, L.A.; Silva, P.A.A.; Burrage, K.; Dos Santos, R.W. Variability in electrophysiological properties and conducting obstacles controls re-entry risk in heterogeneous ischaemic tissue. Philos. Trans. Ser. Math. Phys. Eng. Sci. 2020, 378, 20190341. [Google Scholar] [CrossRef]
  11. Pathmanathan, P.; Gray, R.A. Filament Dynamics during Simulated Ventricular Fibrillation in a High-Resolution Rabbit Heart. BioMed Res. Int. 2015, 2015, 720575. [Google Scholar] [CrossRef] [PubMed] [Green Version]
  12. Panfilov, A.; Keener, J. Re-entry in an anatomical model of the heart. Chaos Solitons Fractals 1995, 5, 681–689. [Google Scholar] [CrossRef]
  13. Walton, R.D.; Benson, A.; Hardy, M.; White, E.; Bernus, O. Electrophysiological and structural determinants of electrotonic modulation of repolarization by the activation sequence. Front. Physiol. 2013, 4, 281. [Google Scholar] [CrossRef] [Green Version]
  14. Bishop, M.J.; Plank, G.; Burton, R.A.B.; Schneider, J.E.; Gavaghan, D.J.; Grau, V.; Kohl, P. Development of an anatomically detailed MRI-derived rabbit ventricular model and assessment of its impact on simulations of electrophysiological function. Am. J. Physiol. Heart Circ. Physiol. 2010, 298, H699–H718. [Google Scholar] [CrossRef] [PubMed] [Green Version]
  15. Sack, K.L.; Aliotta, E.; Ennis, D.B.; Choy, J.S.; Kassab, G.S.; Guccione, J.M.; Franz, T. Construction and Validation of Subject-Specific Biventricular Finite-Element Models of Healthy and Failing Swine Hearts From High-Resolution DT-MRI. Front. Physiol. 2018, 9, 539. [Google Scholar] [CrossRef] [PubMed] [Green Version]
  16. Whittaker, D.G.; Benson, A.P.; Teh, I.; Schenider, J.E.; Colman, M.A. Investigation of the Role of Myocyte Orientations in Cardiac Arrhythmia Using Image-Based Models. Biophys. J. 2019, 117, 2396–2408. [Google Scholar] [CrossRef] [PubMed] [Green Version]
  17. Bi, X.; Zhang, S.; Jiang, H.; Wei, Z. A Multi-Scale Computational Model for the Rat Ventricle: Construction, Parallelization, and Applications. Comput. Methods Programs Biomed. 2021, 208, 106289. [Google Scholar] [CrossRef] [PubMed]
  18. Gattoni, S.; Røe, Å.T.; Frisk, M.; Louch, W.E.; Niederer, S.A.; Smith, N.P. The calcium–frequency response in the rat ventricular myocyte: An experimental and modelling study. J. Physiol. 2016, 594, 4193–4224. [Google Scholar] [CrossRef] [PubMed] [Green Version]
  19. Pandit, S.V.; Clark, R.B.; Giles, W.R.; Demir, S.S. A mathematical model of action potential heterogeneity in adult rat left ventricular myocytes. Biophys. J. 2001, 81, 3029–3051. [Google Scholar] [CrossRef] [Green Version]
  20. Lewalle, A.; Niederer, S.A.; Smith, N.P. Species-dependent adaptation of the cardiac Na+/K+ pump kinetics to the intracellular Na+ concentration. J. Physiol. 2014, 592, 5355–5371. [Google Scholar] [CrossRef] [PubMed] [Green Version]
  21. Hinch, R.; Greenstein, J.; Tanskanen, A.; Xu, L.; Winslow, R. A simplified local control model of calcium-induced calcium release in cardiac ventricular myocytes. Biophys. J. 2004, 87, 3723–3736. [Google Scholar] [CrossRef] [PubMed] [Green Version]
  22. Hindmarsh, A.C.; Brown, P.N.; Grant, K.E.; Lee, S.L.; Serban, R.; Shumaker, D.E.; Woodward, C.S. SUNDIALS: Suite of nonlinear and differential/algebraic equation solvers. ACM Trans. Math. Softw. (TOMS) 2005, 31, 363–396. [Google Scholar] [CrossRef]
  23. Clerx, M.; Collins, P.; de Lange, E.; Volders, P.G. Myokit: A simple interface to cardiac cellular electrophysiology. Prog. Biophys. Mol. Biol. 2016, 120, 100–114. [Google Scholar] [CrossRef] [PubMed]
  24. Annoni, E.M.; Xie, X.; Lee, S.W.; Libbus, I.; KenKnight, B.H.; Osborn, J.W.; Tolkacheva, E.G. Intermittent electrical stimulation of the right cervical vagus nerve in salt-sensitive hypertensive rats: Effects on blood pressure, arrhythmias, and ventricular electrophysiology. Physiol. Rep. 2015, 3, e12476. [Google Scholar] [CrossRef] [PubMed]
  25. Lee, S.W.; Li, Q.; Libbus, I.; Xie, X.; KenKnight, B.H.; Garry, M.G.; Tolkacheva, E.G. Chronic cyclic vagus nerve stimulation has beneficial electrophysiological effects on healthy hearts in the absence of autonomic imbalance. Physiol. Rep. 2016, 4, e12786. [Google Scholar] [CrossRef] [PubMed]
  26. McKay, M.D.; Beckman, R.J.; Conover, W.J. A comparison of three methods for selecting values of input variables in the analysis of output from a computer code. Technometrics 2000, 42, 55–61. [Google Scholar] [CrossRef]
  27. Hardy, M.E.; Pervolaraki, E.; Bernus, O.; White, E. Dynamic action potential restitution contributes to mechanical restitution in right ventricular myocytes from pulmonary hypertensive rats. Front. Physiol. 2018, 9, 205. [Google Scholar] [CrossRef] [PubMed] [Green Version]
  28. Bébarová, M.; Matejovic, P.; Pásek, M.; Simurdova, M.; Simurda, J. Dual effect of ethanol on inward rectifier potassium current IK1 in rat ventricular myocytes. J. Physiol. Pharmacol. 2014, 65, 497–509. [Google Scholar]
  29. Qin, D.; Zhang, Z.H.; Caref, E.B.; Boutjdir, M.; Jain, P.; El-Sherif, N. Cellular and ionic basis of arrhythmias in postinfarction remodeled ventricular myocardium. Circ. Res. 1996, 79, 461–473. [Google Scholar] [CrossRef]
  30. Fenton, F.; Karma, A. Vortex dynamics in three-dimensional continuous myocardium with fiber rotation: Filament instability and fibrillation. Chaos Interdiscip. J. Nonlinear Sci. 1998, 8, 20–47. [Google Scholar] [CrossRef] [PubMed]
  31. Benoist, D.; Stones, R.; Drinkhill, M.; Bernus, O.; White, E. Arrhythmogenic substrate in hearts of rats with monocrotaline-induced pulmonary hypertension and right ventricular hypertrophy. Am. J.-Physiol.-Heart Circ. Physiol. 2011, 300, H2230–H2237. [Google Scholar] [CrossRef]
  32. Benoist, D.; Stones, R.; Drinkhill, M.J.; Benson, A.P.; Yang, Z.; Cassan, C.; Gilbert, S.H.; Saint, D.A.; Cazorla, O.; Steele, D.S.; et al. Cardiac arrhythmia mechanisms in rats with heart failure induced by pulmonary hypertension. Am. J. -Physiol.-Heart Circ. Physiol. 2012, 302, H2381–H2395. [Google Scholar] [CrossRef] [PubMed] [Green Version]
  33. Xie, F.; Qu, Z.; Garfinkel, A.; Weiss, J.N. Electrical refractory period restitution and spiral wave reentry in simulated cardiac tissue. Am. J. Physiol. Heart Circ. Physiol. 2002, 283, 448–460. [Google Scholar] [CrossRef] [Green Version]
  34. Van Nieuwenhuyse, E.; Seemann, G.; Panfilov, A.V.; Vandersickel, N. Effects of early afterdepolarizations on excitation patterns in an accurate model of the human ventricles. PLoS ONE 2017, 12, e0188867. [Google Scholar] [CrossRef] [PubMed] [Green Version]
  35. Mills, W.R.; Mal, N.; Forudi, F.; Popovic, Z.B.; Penn, M.S.; Laurita, K.R. Optical mapping of late myocardial infarction in rats. Am. J.-Physiol.-Heart Circ. Physiol. 2006, 290, H1298–H1306. [Google Scholar] [CrossRef] [Green Version]
  36. Handa, B.S.; Roney, C.H.; Houston, C.; Qureshi, N.A.; Li, X.; Pitcher, D.S.; Chowdhury, R.A.; Lim, P.B.; Dupont, E.; Niederer, S.A.; et al. Analytical approaches for myocardial fibrillation signals. Comput. Biol. Med. 2018, 102, 315–326. [Google Scholar] [CrossRef]
  37. Bernikova, O.G.; Sedova, K.A.; Durkina, A.V.; Azarov, J.E. Managing of ventricular reperfusion tachyarrhytmias-focus on a perfused myocardium. J. Physiol. Pharmacol. Off. J. Pol. Physiol. Soc. 2019, 70, 757–763. [Google Scholar]
  38. Vandersickel, N.; Watanabe, M.; Tao, Q.; Fostier, J.; Zeppenfeld, K.; Panfilov, A.V. Dynamical anchoring of distant arrhythmia sources by fibrotic regions via restructuring of the activation pattern. PLoS Comput. Biol. 2018, 14, 1–19. [Google Scholar] [CrossRef] [Green Version]
  39. Kiseleva, I.; Kamkin, A.; Wagner, K.D.; Theres, H.; Ladhoff, A.; Scholz, H.; Günther, J.; Lab, M.J. Mechanoelectric feedback after left ventricular infarction in rats. Cardiovasc. Res. 2000, 45, 370–378. [Google Scholar] [CrossRef]
  40. Şengül Ayan, S.; Sırcan, A.K.; Abewa, M.; Kurt, A.; Dalaman, U.; Yaraş, N. Mathematical model of the ventricular action potential and effects of isoproterenol-induced cardiac hypertrophy in rats. Eur. Biophys. J. 2020, 49, 323–342. [Google Scholar] [CrossRef] [PubMed]
  41. Coveney, S.; Corrado, C.; Oakley, J.E.; Wilkinson, R.D.; Niederer, S.A.; Clayton, R.H. Bayesian Calibration of Electrophysiology Models Using Restitution Curve Emulators. Front. Physiol. 2021, 12, 1120. [Google Scholar]
  42. Ghouri, I.A.; Kelly, A.; Salerno, S.; Garten, K.; Stølen, T.; Kemi, O.J.; Smith, G.L. Characterization of Electrical Activity in Post-myocardial Infarction Scar Tissue in Rat Hearts Using Multiphoton Microscopy. Front. Physiol. 2018, 9, 1454. [Google Scholar] [CrossRef]
  43. Mendonca Costa, C.; Plank, G.; Rinaldi, C.A.; Niederer, S.A.; Bishop, M.J. Modeling the electrophysiological properties of the infarct border zone. Front. Physiol. 2018, 9, 356. [Google Scholar] [CrossRef]
  44. Pathmanathan, P.; Galappaththige, S.K.; Cordeiro, J.M.; Kaboudian, A.; Fenton, F.H.; Gray, R.A. Data-Driven Uncertainty Quantification for Cardiac Electrophysiological Models: Impact of Physiological Variability on Action Potential and Spiral Wave Dynamics. Front. Physiol. 2020, 11, 1463. [Google Scholar] [CrossRef]
  45. Ding, C.; Gepstein, L.; Nguyen, D.T.; Wilson, E.; Hulley, G.; Beaser, A.; Lee, R.J.; Olgin, J. High-Resolution Optical Mapping of Ventricular Tachycardia in Rats with Chronic Myocardial Infarction. Pacing Clin. Electrophysiol. 2010, 33, 687–695. [Google Scholar] [CrossRef]
  46. Rutherford, S.L.; Trew, M.L.; Sands, G.B.; LeGrice, I.J.; Smaill, B.H. High-Resolution 3-Dimensional Reconstruction of the Infarct Border Zone. Circ. Res. 2012, 111, 301–311. [Google Scholar] [CrossRef] [Green Version]
  47. Ramírez, W.A.; Gizzi, A.; Sack, K.L.; Filippi, S.; Guccione, J.M.; Hurtado, D.E. On the Role of Ionic Modeling on the Signature of Cardiac Arrhythmias for Healthy and Diseased Hearts. Mathematics 2020, 8, 2242. [Google Scholar] [CrossRef]
  48. Bueno-Orovio, A.; Cherry, E.M.; Fenton, F.H. Minimal model for human ventricular action potentials in tissue. J. Theor. Biol. 2008, 253, 544–560. [Google Scholar] [CrossRef]
  49. ten Tusscher, K.H.W.J.; Panfilov, A.V. Alternans and spiral breakup in a human ventricular tissue model. Am. J. -Physiol.-Heart Circ. Physiol. 2006, 291, H1088–H1100. [Google Scholar] [CrossRef]
  50. Okada, D.R.; Miller, J.; Chrispin, J.; Prakosa, A.; Trayanova, N.; Jones, S.; Maggioni, M.; Wu, K.C. Substrate Spatial Complexity Analysis for the Prediction of Ventricular Arrhythmias in Patients With Ischemic Cardiomyopathy. Circ. Arrhythmia Electrophysiol. 2020, 13, e007975. [Google Scholar] [CrossRef]
  51. Vandersickel, N.; Kazbanov, I.V.; Nuitermans, A.; Weise, L.D.; Pandit, R.; Panfilov, A.V. A Study of Early Afterdepolarizations in a Model for Human Ventricular Tissue. PLoS ONE 2014, 9, e0084595. [Google Scholar] [CrossRef]
  52. Weber dos Santos, R.; Nygren, A.; Otaviano Campos, F.; Koch, H.; Giles, W.R. Experimental and theoretical ventricular electrograms and their relation to electrophysiological gradients in the adult rat heart. Am. J.-Physiol.-Heart Circ. Physiol. 2009, 297, H1521–H1534. [Google Scholar] [CrossRef] [Green Version]
  53. Roman-Campos, D.; Carneiro-Júnior, M.A.; Prímola-Gomes, T.N.; Silva, K.A.; Quintão-Júnior, J.F.; Gondim, A.N.; Duarte, H.L.; Cruz, J.S.; Natali, A.J. Chronic exercise partially restores the transmural heterogeneity of action potential duration in left ventricular myocytes of spontaneous hypertensive rats. Clin. Exp. Pharmacol. Physiol. 2012, 39, 155–157. [Google Scholar] [CrossRef]
  54. Hardziyenka, M.; Campian, M.E.; Verkerk, A.O.; Surie, S.; van Ginneken, A.C.G.; Hakim, S.; Linnenbank, A.C.; de Bruin-Bon, H.A.C.M.R.; Beekman, L.; van der Plas, M.N.; et al. Electrophysiologic remodeling of the left ventricle in pressure overload-induced right ventricular failure. J. Am. Coll. Cardiol. 2012, 59, 2193–2202. [Google Scholar] [CrossRef] [PubMed] [Green Version]
Figure 1. Experimental images of ischemiareperfusion injury in the left ventricle of a rat. The left slice is stained by Evans Blue dye, revealing an unperfused area of necrosis and border zone colored in pink, in contrast with blue normal perfused tissue. The injury boundary is outlined with a yellow line. The right slice was incubated for 15 min in tetrazolium chloride solution (TTC), revealing the necrosis area of light pink color outlined in yellow, in contrast with viable TTC-positive myocardium colored in dark red.
Mathematics 09 02604 g001
Figure 2. Anatomical model of the rat ventricles with a postinfarction scar. The border zone is colored in pink and the scar is in red.
Mathematics 09 02604 g002
Figure 3. Action potential at BCLs of 1000, 170 and 130 ms in the updated Gattoni2016 cellular models.
Mathematics 09 02604 g003
Figure 4. Action potential signals at 170 and 1000 ms BCL (left and middle panels, respectively) and APD restitution curves (right panel) in Models 1–4 for normal tissue (NT, dash lines) and the border zone (BZ, solid lines).
Mathematics 09 02604 g004
Figure 5. APD and conduction velocity (CV) restitution curves in four selected models. Left panel: APD restitution curve measured in experiments on single cells using microelectrode techniques (Hardy et al. 2018 [27]) combined with simulation results from the updated Gattoni2016 cellular models. Central (Model 1) and right (Model 2) panels: APD restitution curves (top row) in 1D tissue models of myocardial tissue strip in comparison with 0D cellular models and CV restitution curves in 1D models (bottom row).
Mathematics 09 02604 g005
Figure 6. Spiral wave dynamics in 2D tissue models showing each of the four selected cellular models for normal tissue (N) and remodeled border zone tissue (R). Snapshots at several times are shown. Corresponding spiral wave core trajectories are shown in the right panels. Color scale for transmembrane potential is given at the bottom.
Mathematics 09 02604 g006
Figure 7. Spiral wave periods for the models from Figure 6 computed at an arbitrary point (100, 100) from the top left vertex of the tissue square.
Mathematics 09 02604 g007
Figure 8. Rotating scroll waves in an anatomical model of rat ventricles with Cellular Models 1 and 2. The top row shows the ventricles from the side of the RV free wall and the LV anterior wall. The bottom row shows the view from the base. A 1 mm spatial scale bar is shown at the bottom right. The color scale for transmembrane potential is given on the middle right. Green circles point to the spiral wave tip and green arrows show the wave propagation direction.
Mathematics 09 02604 g008
Figure 9. Scroll waves rotating around a post-infarction scar in anatomical models of the rat ventricles. A 1 mm spatial scale bar is shown on the bottom right. The voltage color scale is the same as in Figure 8. The post-infarction scar is colored in dark red. A black line around the scar area indicates the boundary between the border zone and normal tissue. Color scale for transmembrane potential is given on the middle right. Green arrows in the first column indicate the direction of rotation.
Mathematics 09 02604 g009
Figure 10. Dynamics of scroll waves initiated away from the scar. The notations are the same as in the previous figures. Color scale for transmembrane potential is given on the bottom right. Green circles indicate the position of the spiral wave tip until the wave is anchored around the obstacle (for Model 1). Green arrows indicate local directions of the wave front.
Mathematics 09 02604 g010
Table 1. Parameter values in four selected model samples, shown as percentages of the reference values at a BCL of 1000 ms from the Gattoni2016 cellular model [18].
ParameterReference ModelModel 1Model 2Model 3Model 4
g D 100% (0.099 μ m 3 /ms)40%40%40%40%
g S E R C A (1000 ms)100% (0.47 μ M/ms)71%79%116%155%
g S E R C A (170 ms)145% (0.68 μ M/ms)130%143%168%225%
J L 100% ( 7 × 10 4   μ m 3 /ms)118%165%100%87%
g N C X 100% (51.5 μ M/ms)69%63%168%154%
g t o 100% (19.6 nS)178%185%196%193%
g s s 100% (12 nS)72%41%26%62%
I N a K m a x 100% (1.38 nA)181%140%64%105%
Table 2. Comparison of APD at different BCLs in experimental data, the original Gattoni2016 cellular model and our updated models.
ReferenceAPD 90 (ms)APD 90 (ms)APD 90 (ms)
(BCL 110–130 ms)(BCL 140–170 ms)(BCL 1000 ms)
Hardy2018 [27]37 ± 6 (110 ms)38 ± 7 (140 ms)42 ± 9
Benoist2011 (LV) [31]39 ± 1 (120 ms)40 ± 1 (160 ms)
Benoist2011 (RV) [31]41 ± 3 (120 ms)43 ± 3 (160 ms)
Gattoni2016 [18]55.52 ± 14.51 (170 ms)43.41 ± 7.08
Benoist2012 [32]57 ± 9 (110 ms)58 ± 9 (140 ms)63 ± 11
Gattoni2016 model [18]48.9 (170 ms)50.6
Model 134 (130 ms)35 (170 ms)37
Model 237 (130 ms)38 (170 ms)42
Model 335 (130 ms)36 (170 ms)48
Model 434 (130 ms)34 (170 ms)45
Table 3. Relative difference between APD in border zone (BZ) against normal tissue (NT) in the cellular models: Δ APD(%) = (APD B Z − APD N T )/APD N T *100%. Mean values are shown for experimental data.
BCL 170 msBCL 1000 ms
Reference Δ APD 50 (%) Δ APD 90 (%) Δ APD 50 (%) Δ APD 90 (%)
Qin1996 [29]111124
Model 1905112565
Model 2503412267
Model 3734412290
Model 4603811467
Table 4. Spiral wave periods in 2D simulations for normal tissue (NT) and border zone (BZ) tissue. Each value is given in the mean ± std format.
Model idNT Period (ms)BZ Period (ms)
1 81.51 ± 2.60 102.00 ± 1.63
2 92.97 ± 4.73 114.19 ± 7.08
3 95.16 ± 1.35 126.43 ± 2.29
4 87.62 ± 1.46 101.22 ± 1.18
Publisher’s Note: MDPI stays neutral with regard to jurisdictional claims in published maps and institutional affiliations.

