Article

Using Artificial Neural Network with Prey Predator Algorithm for Prediction of the COVID-19: The Case of Brazil and Mexico

1
Department of Basic Sciences, College of Science and Theoretical Studies, Saudi Electronic University, Riyadh 11673, Saudi Arabia
2
Department of Computer Science, College of Computing and Informatics, Saudi Electronic University, Riyadh 11673, Saudi Arabia
3
Department of Mechanical Engineering, College of Engineering, Prince Mohammad Bin Fahd University, Al Khobar 31952, Saudi Arabia
*
Author to whom correspondence should be addressed.
Mathematics 2021, 9(2), 180; https://doi.org/10.3390/math9020180
Submission received: 22 December 2020 / Revised: 10 January 2021 / Accepted: 16 January 2021 / Published: 18 January 2021
(This article belongs to the Special Issue Evolutionary Algorithms in Artificial Intelligent Systems)

Abstract

:
The spread of the COVID-19 epidemic worldwide has led to investigations in various aspects, including the estimation of expected cases. As it helps in identifying the need to deal with cases caused by the pandemic. In this study, we have used artificial neural networks (ANNs) to predict the number of cases of COVID-19 in Brazil and Mexico in the upcoming days. Prey predator algorithm (PPA), as a type of metaheuristic algorithm, is used to train the models. The proposed ANN models’ performance has been analyzed by the root mean squared error (RMSE) function and correlation coefficient (R). It is demonstrated that the ANN models have the highest performance in predicting the number of infections (active cases), recoveries, and deaths in Brazil and Mexico. The simulation results of the ANN models show very well predicted values. Percentages of the ANN’s prediction errors with metaheuristic algorithms are significantly lower than traditional monolithic neural networks. The study shows the expected numbers of infections, recoveries, and deaths that Brazil and Mexico will reach daily at the beginning of 2021.

1. Introduction

COVID-19 pandemic was initially reported in China and quickly affected the entire world, leading to a public health emergency of international concern by the World Health Organization [1,2,3]. In the past two decades, COVID-19 is the third outbreak of corona virus-induced respiratory disease after the severe acute respiratory syndrome (SARS) and the Middle East respiratory syndrome (MERS) [4,5]. Since its first appearance in Wuhan, China, COVID-19 caused thousands of deaths and overwhelmed the health care system worldwide. In fighting against the COVID-19 pandemic, timely and effective screening and identification of the infected individuals is of utmost importance to spread the virus to other individuals if not identified and isolated [6].
COVID-19 is usually transmitted from human to human due to unrestricted movement [7]. In Brazil [8], the first two cases were reported on 25 and 29 February 2020. Until 4 March 2020, the total number of cases was only 3. However, from 5 March 2020, onwards, the number of COVID-19 infected patients increased dramatically, and by 21 March, it has spread to all parts of Brazil. In Mexico [9], the first cases of COVID-19 infection were reported on 28 February 2020.
Several researchers from different fields, including mathematics, chemistry, statistics, computer science, and health care, have been analyzing COVID-19 for its behavior and finding a solution for its cure. However, all efforts have gone in vain so far. Further, COVID-19 affected people have been showing a continuous change in the symptoms. Patients show cough, fever, and fatigue at the early stage, followed by pneumonia [8] and severe acute respiratory syndrome [9] in the later stages.
In order to address this problem by the artificial intelligence community, data is the core requirement for constructing a framework [10]. Due to the limited availability of data about COVID-19 infected patients, it is hard to design sufficient identification and analysis models. Very few details are available about the COVID-19 tested positive patients because people hesitate to go to the doctor to avoid any possible quarantine. Besides, some infected people do not show any symptoms [11] of COVID-19; that is why it is impossible to identify the actual number of positive cases in huge populations. The more time it takes to diagnose an infected person, the more he/she becomes risky for others. Therefore, the availability of large amounts of data is crucial to the analysis and behavior prediction of COVID-19 disease. Several articles exploring the effects of COVID-19 have been published from a computational, mathematical, and statistical perspective. Among many mathematical models to study the dynamics of the COVID-19 virus, Susceptible-Infectious-Recovered (SIR) is a widely used model that estimates an epidemic’s growth by exploiting a time-dependent system differential equation. Ebola and AIDS have been explored and analyzed using different variants of SIR models [12,13]. In this connection, a generalized SEIR epidemiological model [14] is adapted to estimate the growth of SARS-CoV-2 in Italy.
A stochastic approach is ensured using Particle Swarm Optimization (PSO) as a solver to fit the model parameters. Using the same SEIR model, Berger et al. [15] have explored the effects of testing and quarantine policies in the United States. The authors showed that increasing the number of conducted tests and selective quarantine can reduce the coronavirus’s negative impact on the economy and lessen hospitals’ burden. Roda et al. [16] have recently demonstrated that the SIR model outperforms the SEIR model using confirmed positive cases as input data. Model selection is performed using the Akaike Information Criterion. In another effort, Weissman et al. [17] proposed COVID-19 Hospital Impact Model for Epidemics (CHIME) SIR model to predict when the hospital capacity would be exhausted, and ventilators would be outnumbered focusing on three hospitals in the Philadelphia region. CHIME estimated the time when the current resources would fail to deal with the surge caused by COVID-19 patients.
The real number of COVID-19 data represents a series of observations arranged in time. Methods used for time-series prediction are native to the statistics field, such as Machine learning-based methods, Meta-predictors, and Structure-based methods [18,19,20]. Artificial neural networks (ANNs) are widely used for time series predictions [21]. One of the main advantages of ANN techniques is that it can be fueled with raw data that can automatically find the required representation [22]. Based on several factors like performance, accuracy, latency, speed, convergence, and size, ANN provides reliable results. Brazil and Mexico are among the countries with the largest number of infections globally, estimated in millions. Additionally, the number of infections in Brazil and Mexico is believed to be greater than the declared ones due to spread of the disease in poor communities. This work is based on ANNs for the prediction of a time series problem about the investigation of the COVID-19 in Brazil and Mexico [23,24]. Moreover, we used prey predator algorithm (PPA) to improve the ANN model’s performance by specifying the ANN parameters’ optimum value [25,26]. Note that there are many analyses of time series based on time-averaged observables and the time series dynamics [27]. The rest of the article is organized as follows. In Section 2, we present the established structures of our ANN models followed by the description of PPA algorithm. In Section 3, we present the results and analyze them. In Section 4, we draw conclusions.

2. Materials and Methods

2.1. Structure

ANN played a critical role in addressing many modern world problems [28,29,30]. An ANN consists of an input layer, one or more hidden layers, and an output layer. The processing elements or neurons in ANN produce output based on their respective predefined activation functions.
Multilayer Perceptron Neural Network (MLPNN) is a type of feed-forward ANN employed in our current work. We constructed an MLPNN of one hidden layer with ten neurons where sigmoid is used as an activation function in hidden neurons (see Equation (1)). Note that neurons in one layer are connected to other neurons in another layer through connection weights. This study has the input weights that link the input layer and hidden layer and the output weights that link the hidden layers with the output layer. Moreover, we have used a hyperbolic tangent transfer function in the output neurons, expressed in Equation (2). Note that Equation (2) gives output in the range from −1 to +1.
y i = 1 1 + e w k i * x k
where x k is the input value at input neuron i, w k i is the weight connecting node k from the input layer with node i from the hidden layer, and y i represents the value of the hidden neuron i.
y ^ j = 2 ( 1 + e 2 w i j * . y i ) 1
where w i j * is the output weight between the hidden neuron i and the output neuron j. y ^ j is the output value of output neuron j.
There are two stages for proposing an ANN model. In the first stage, we need to define the MLPNN architecture, where it depends on the data to be represented. According to the data sets used in this work (Brazil data set and Mexico data set), the MLPNN architectures of the two models we have used are the same (ANN brazil model and Mexico ANN model). Therefore, we have used one input neuron, ten hidden neurons, and three output neurons for both models. As a result, we proposed two ANN models, one for Brazil and the second one for Mexico. In each model, we have three outputs, namely the number of infections, recoveries, and deaths. Therefore, we have three neurons in the output layer for the prediction task. Figure 1 shows the structure of the MLPNN that we have used in this work.
In the second stage is the training process of ANNs, where it compares the actual outputs and the desired outputs. Therefore, the aim of the training is to obtain the least possible differences between the tangible outputs of the data set (training data) and the corresponding values of the ANN model. So, to build an ANN model, ANN is passed through the training phase. The difference between the two is learned through PPA, and weights are adjusted accordingly to minimize the difference (RMSE). Note that the values of the parameters of an MLPNN depend on the following:
(1)
The optimization algorithm is employed to determine the optimal parameters. In this study, we have used PPA to determine the optimal parameters (Input weights and output weights).
(2)
The data set (training data) that is using through the training procedure. This study has used two different data sets (Brazil data set and the Mexico data set). According to the two different data sets, the optimal parameters (Input weights and output weights) for the Brazil MLPNN (BMLPNN) model are not the same as the optimal parameters of Mexico MLPNN (MMPLNN).
The training procedure of a PPA-MLPNN is highlighted in Figure 2. The performance assessment and performance enhancements are achieved using root mean squared error (RMSE) and correlation coefficient (R). Equations (3) and (4) can be used to compute RMSE and R. Note that,
RMSE = ( O E ) 2 n
R = n O E O E [ n O 2 ( O ) 2 ] [ n E 2 ( E ) 2 ]
where n represents the number of cases, O shows the sum of all observed cases, E indicates the sum of all expected values, O 2 is the total of all squared observed values, ( O ) 2 is the square of the sum of all observed values, E 2 shows the sum of all squared expected values, and ( E ) 2 indicates the square of the sum of all expected values.

2.2. Prey Predator Algorithm (PPA)

PPA is considered one of the most effective optimization techniques for finding an optimal solution to an optimization problem [25,31]. It solves the issues of continuous optimization, combinatorial optimization, and constraint optimization. Moreover, it can deal with highly nonlinear, and multi-modal optimization problems naturally and efficiently [26,32,33]. MLPNN is an optimization problem, where we used PPA to determine the best MLPNN models by determining the optimal values of the models weights. As mentioned before, the values of the weights are adjusted accordingly to minimize the RMSE.
The interaction of animals inspires the development of PPA in a prey predator relationship [26]. PPA’s basic idea is how a predator hunts its prey where a prey tries to escape and hide. The solutions in the search space of PPA are termed as prey and predator.
In the current article, PPA is employed to optimize the survival value of a predator identifying the smallest performance value using the RMSE function. Among the target preys, the best prey is the one that successfully escapes and finds a hideout [25]. Such prey is called the best prey in the search space and is represented by the highest survival value. In each iteration, the predator hunts for the weaker prey, which tries to follow other prey populations to escape the predator attack and find a safe hiding place. The predator’s movement towards prey can be determined by the direction in which a predator or prey moves and by the distance to be covered in that particular direction. Equation (5) shows the direction of a solution in the search space:
y i * = e s v ( x j ) v x i x j ( x i x j )
where different values of parameter v determine the jump size for the solution x i .
A direction is considered optimum if moving along increases the survival value of a solution. An issue with updating a solution is the step length while exploring minimum step length λ min and maximum step length λ max where λ min < λ max . Equations (6)–(9), as discussed in [25,26], can describe predator and prey movement.
The movement of prey is given in Equation (6) after the follow-up probability is met.
x i ( t + 1 ) = x i ( t ) + ( y i y i ) r a n d ( λ max + λ min )
Alternatively, the movement of prey is determined by Equation (7).
x i ( t + 1 ) = x i ( t ) + ( y i y i ) r a n d λ max
The best prey and predator’s movements are, respectively, given by Equations (8) and (9).
x i ( t + 1 ) = x i ( t ) + ( y i y i ) r a n d λ min
x p r e d a t o r ( t + 1 ) = x p r e d a t o r ( t ) + ( y i y i ) r a n d λ max λ min ( x i x p r e d a t o r ( t ) x i x p r e d a t o r ( t ) )

2.3. COVID-19 Data Set

In this work, we have proposed two ANN models to predict the number of COVID-19 infected (active cases), recoveries, and total deaths in Brazil and Mexico. Using these models aids in making decisions and building overall strategies to reduce human losses in these countries. In addition to the possibility of circulating the forms to countries similar to Brazil and Mexico in terms of the number of cases. We offer a quantitative overview of COVID-19 status in the said countries where the covered durations with starting and ending dates are given in Table 1.

3. Results and Discussion

We used ANN models with one input neuron, ten hidden neurons, and three output neurons in the current work. Note that the input neuron accepts the “requested data” whereas the three output neurons predict the infected (active cases), recovered, and total deaths. PPA is used to determine the two models’ optimal parameters, one for Brazil and the other for Mexico. Moreover, the ANN is trained via PPA for 20 trials with 1000 iterations where each trial covers 50 populations. Moreover, the number of predators in PPA is 8 with local search directions of 1, the number of best preys 4, and then the best values are reported. The RMSE values we obtained were less than 0.05 in all our optimal models.
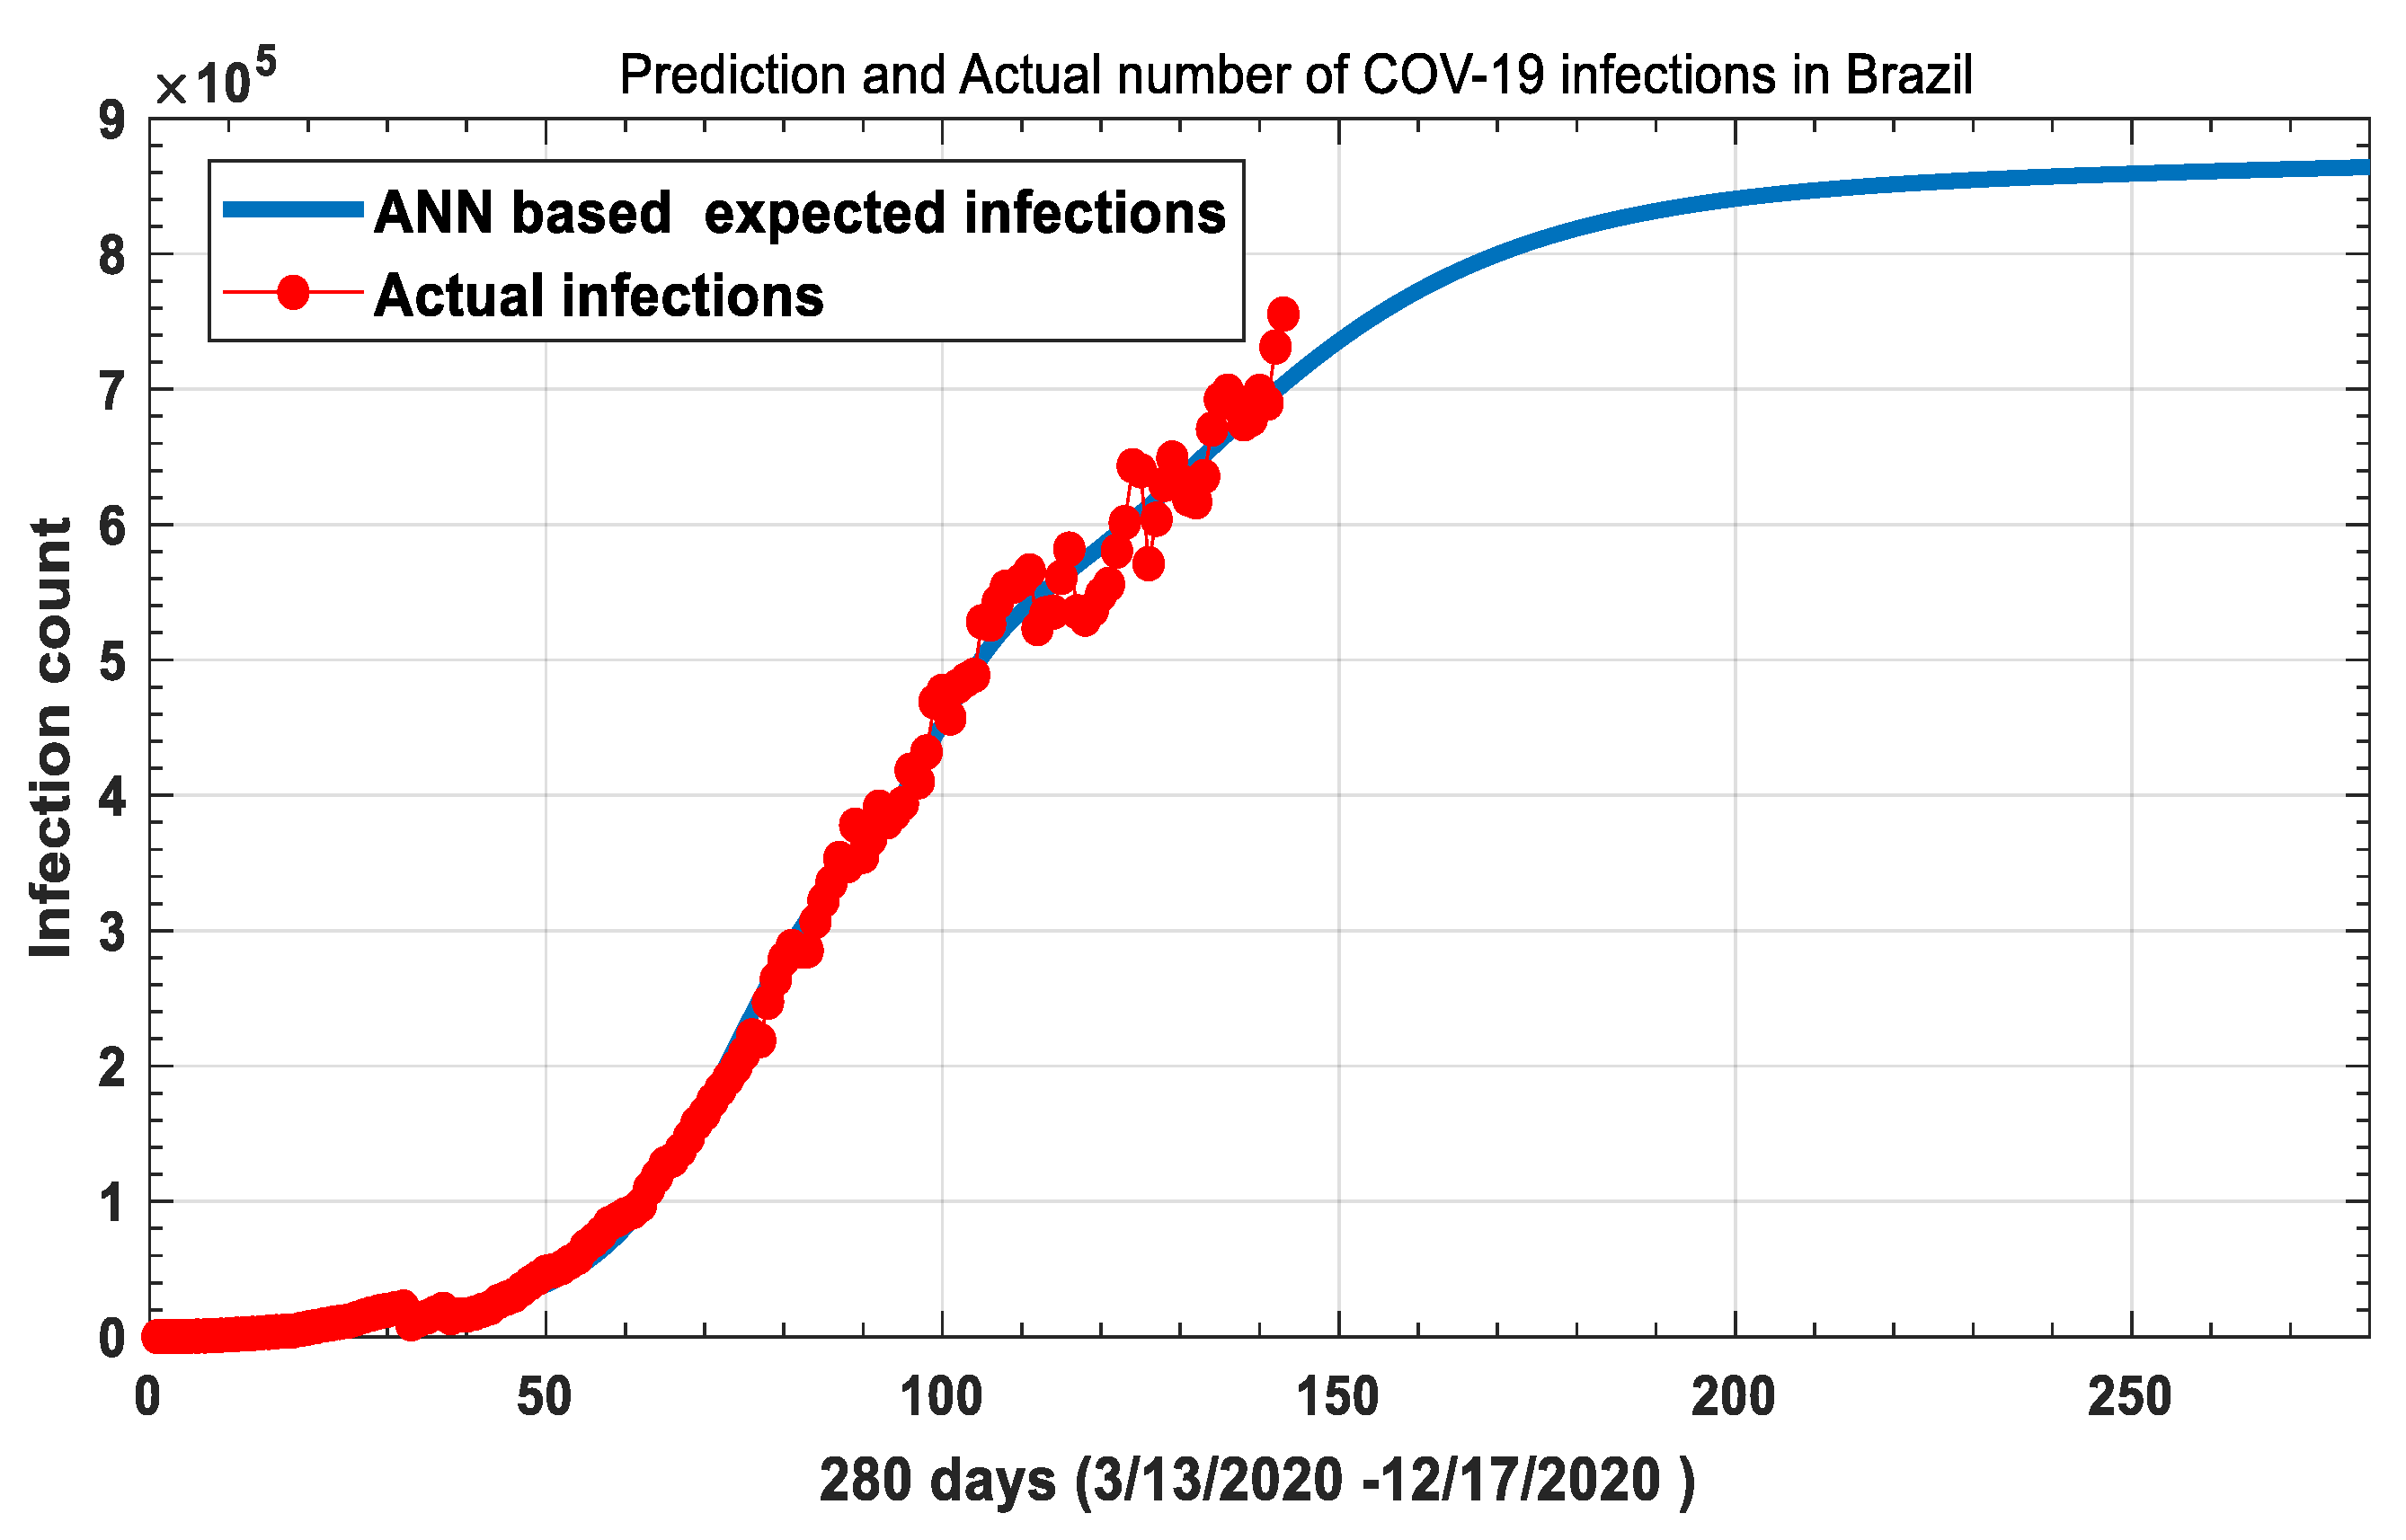
To propose a prediction model, dataset called training data, and another dataset called testing data are taken to compare the real results with the expected results. Figure 3 highlights the training data (in Red) and ANN-based predicted data (in Blue) of COVID-19 infected people in Brazil, where the training data covers the duration from 13 March 2020, to 2 August 2020. In contrast, ANN-based common infections cover 13 March 2020, to 17 December 2020. The results showed that the number of infected cases would increase at a rate of 9 × 10 5 daily by the end of this year.
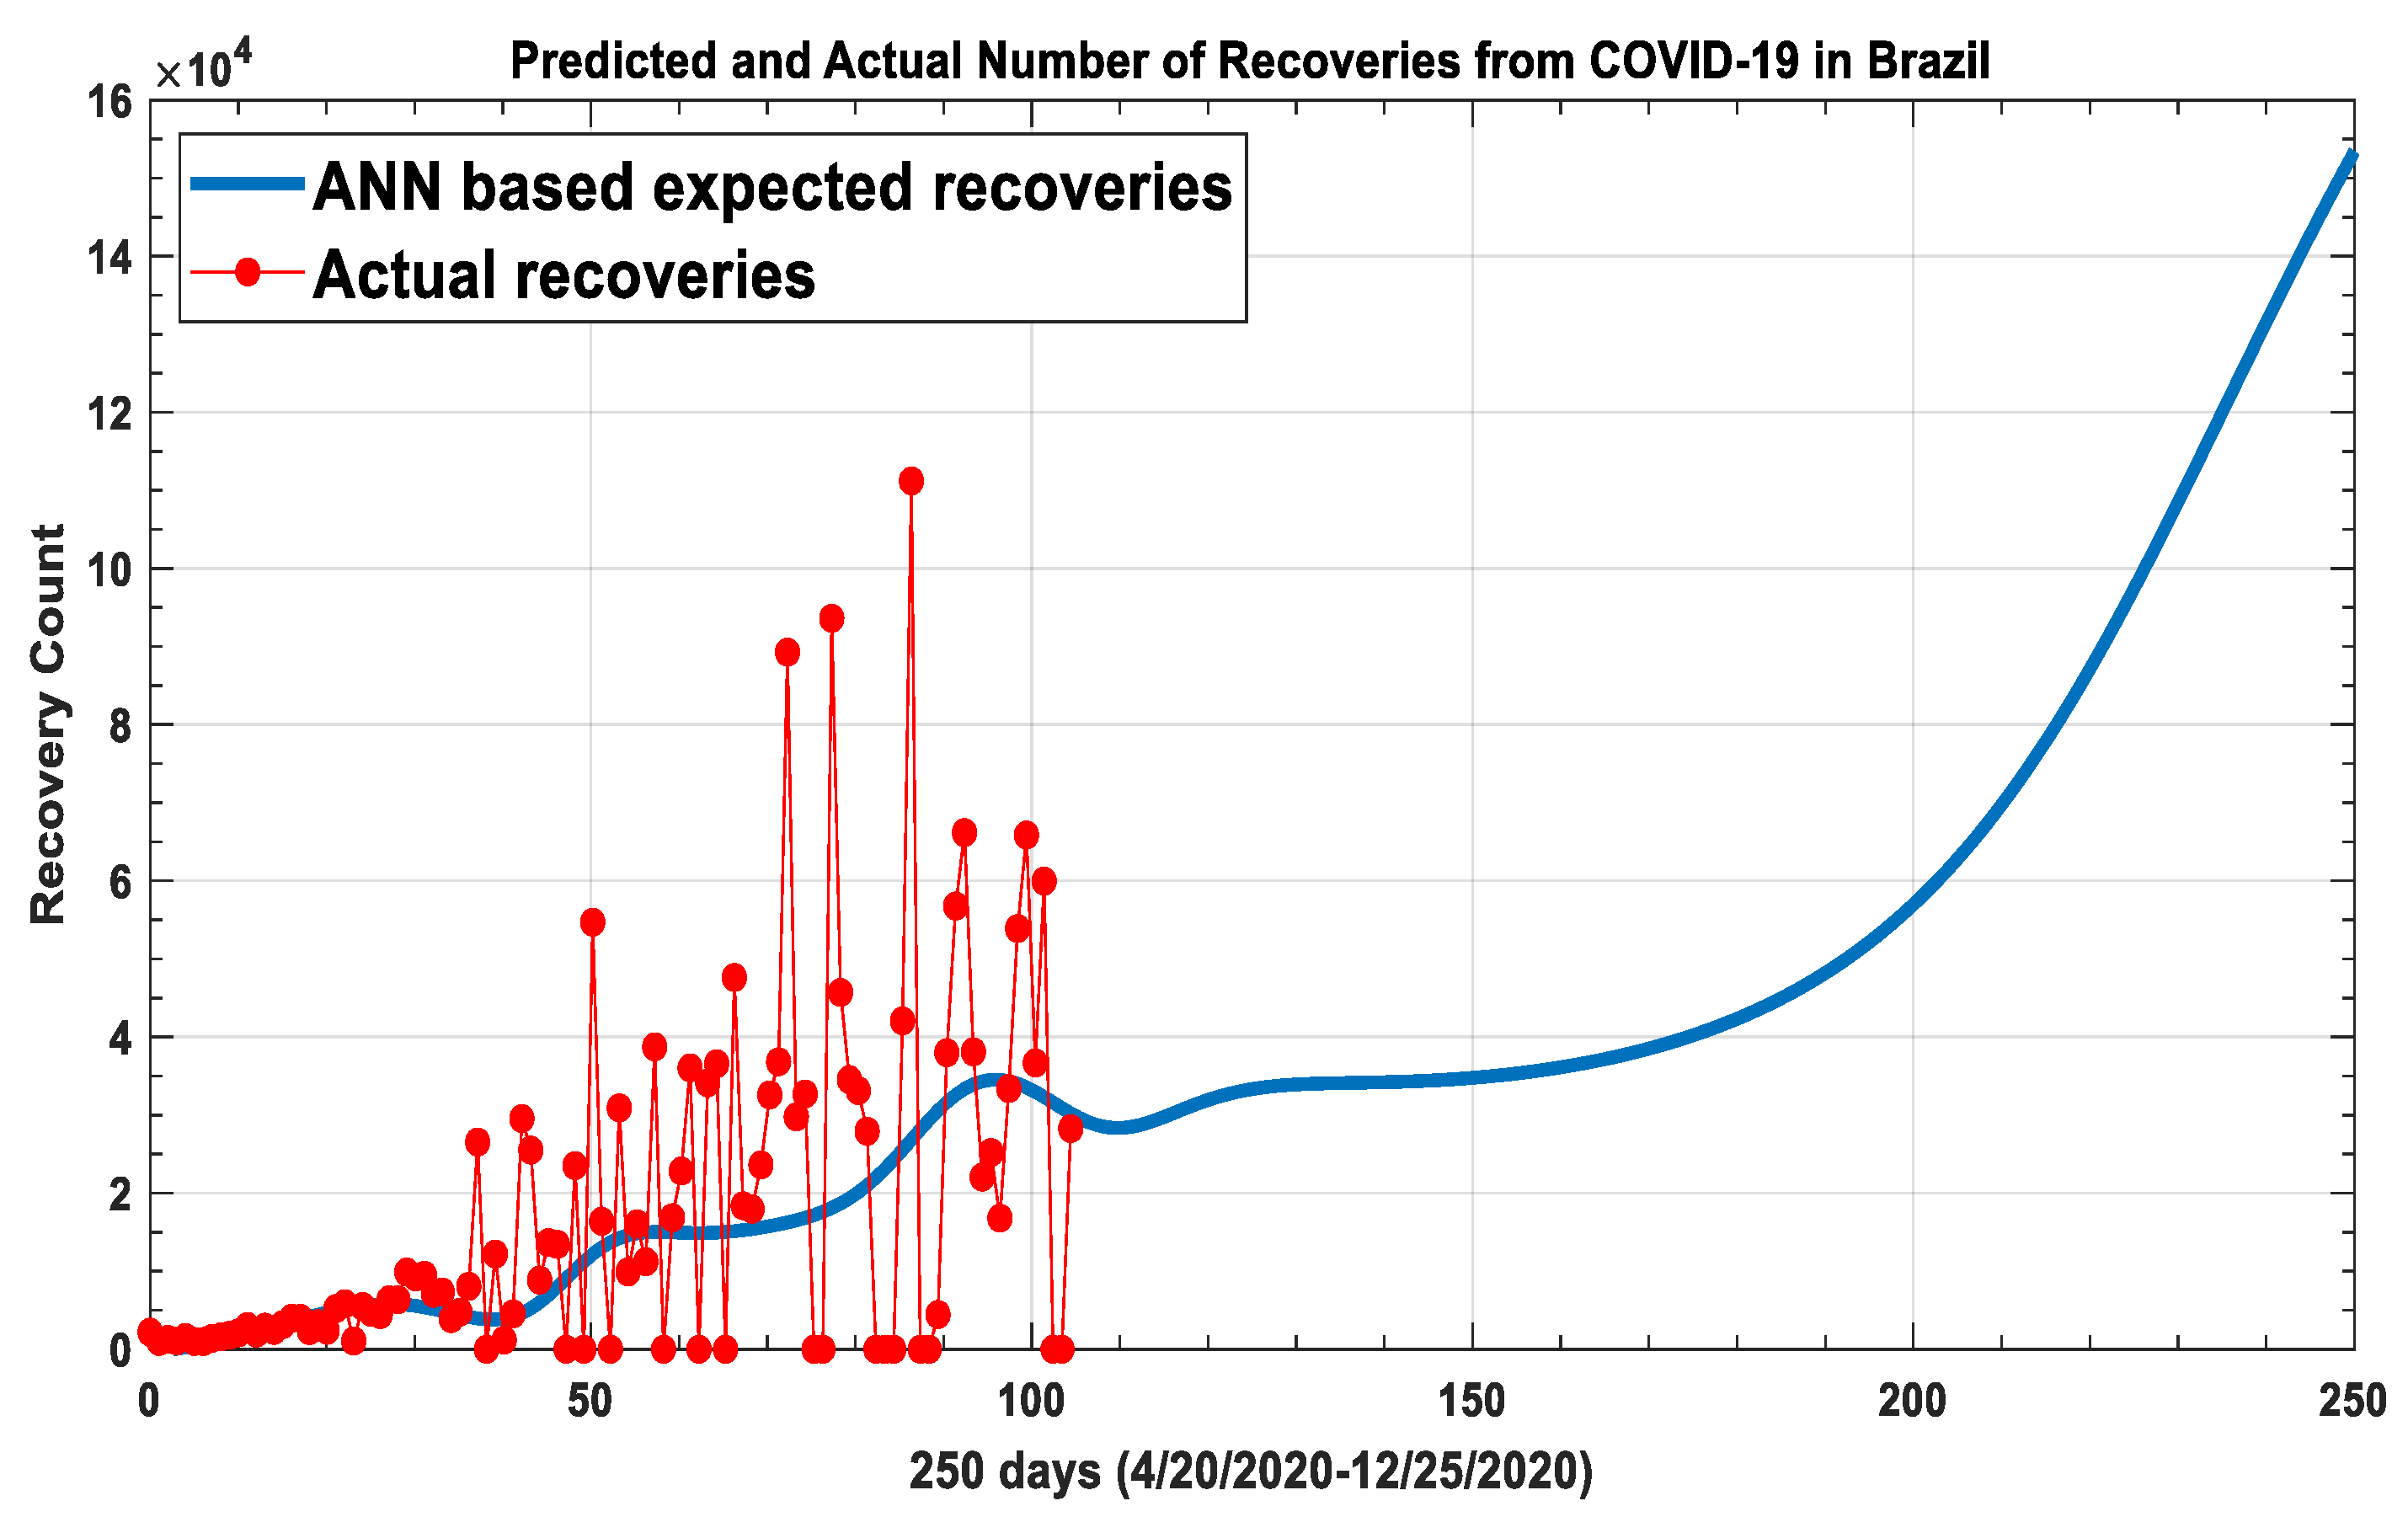
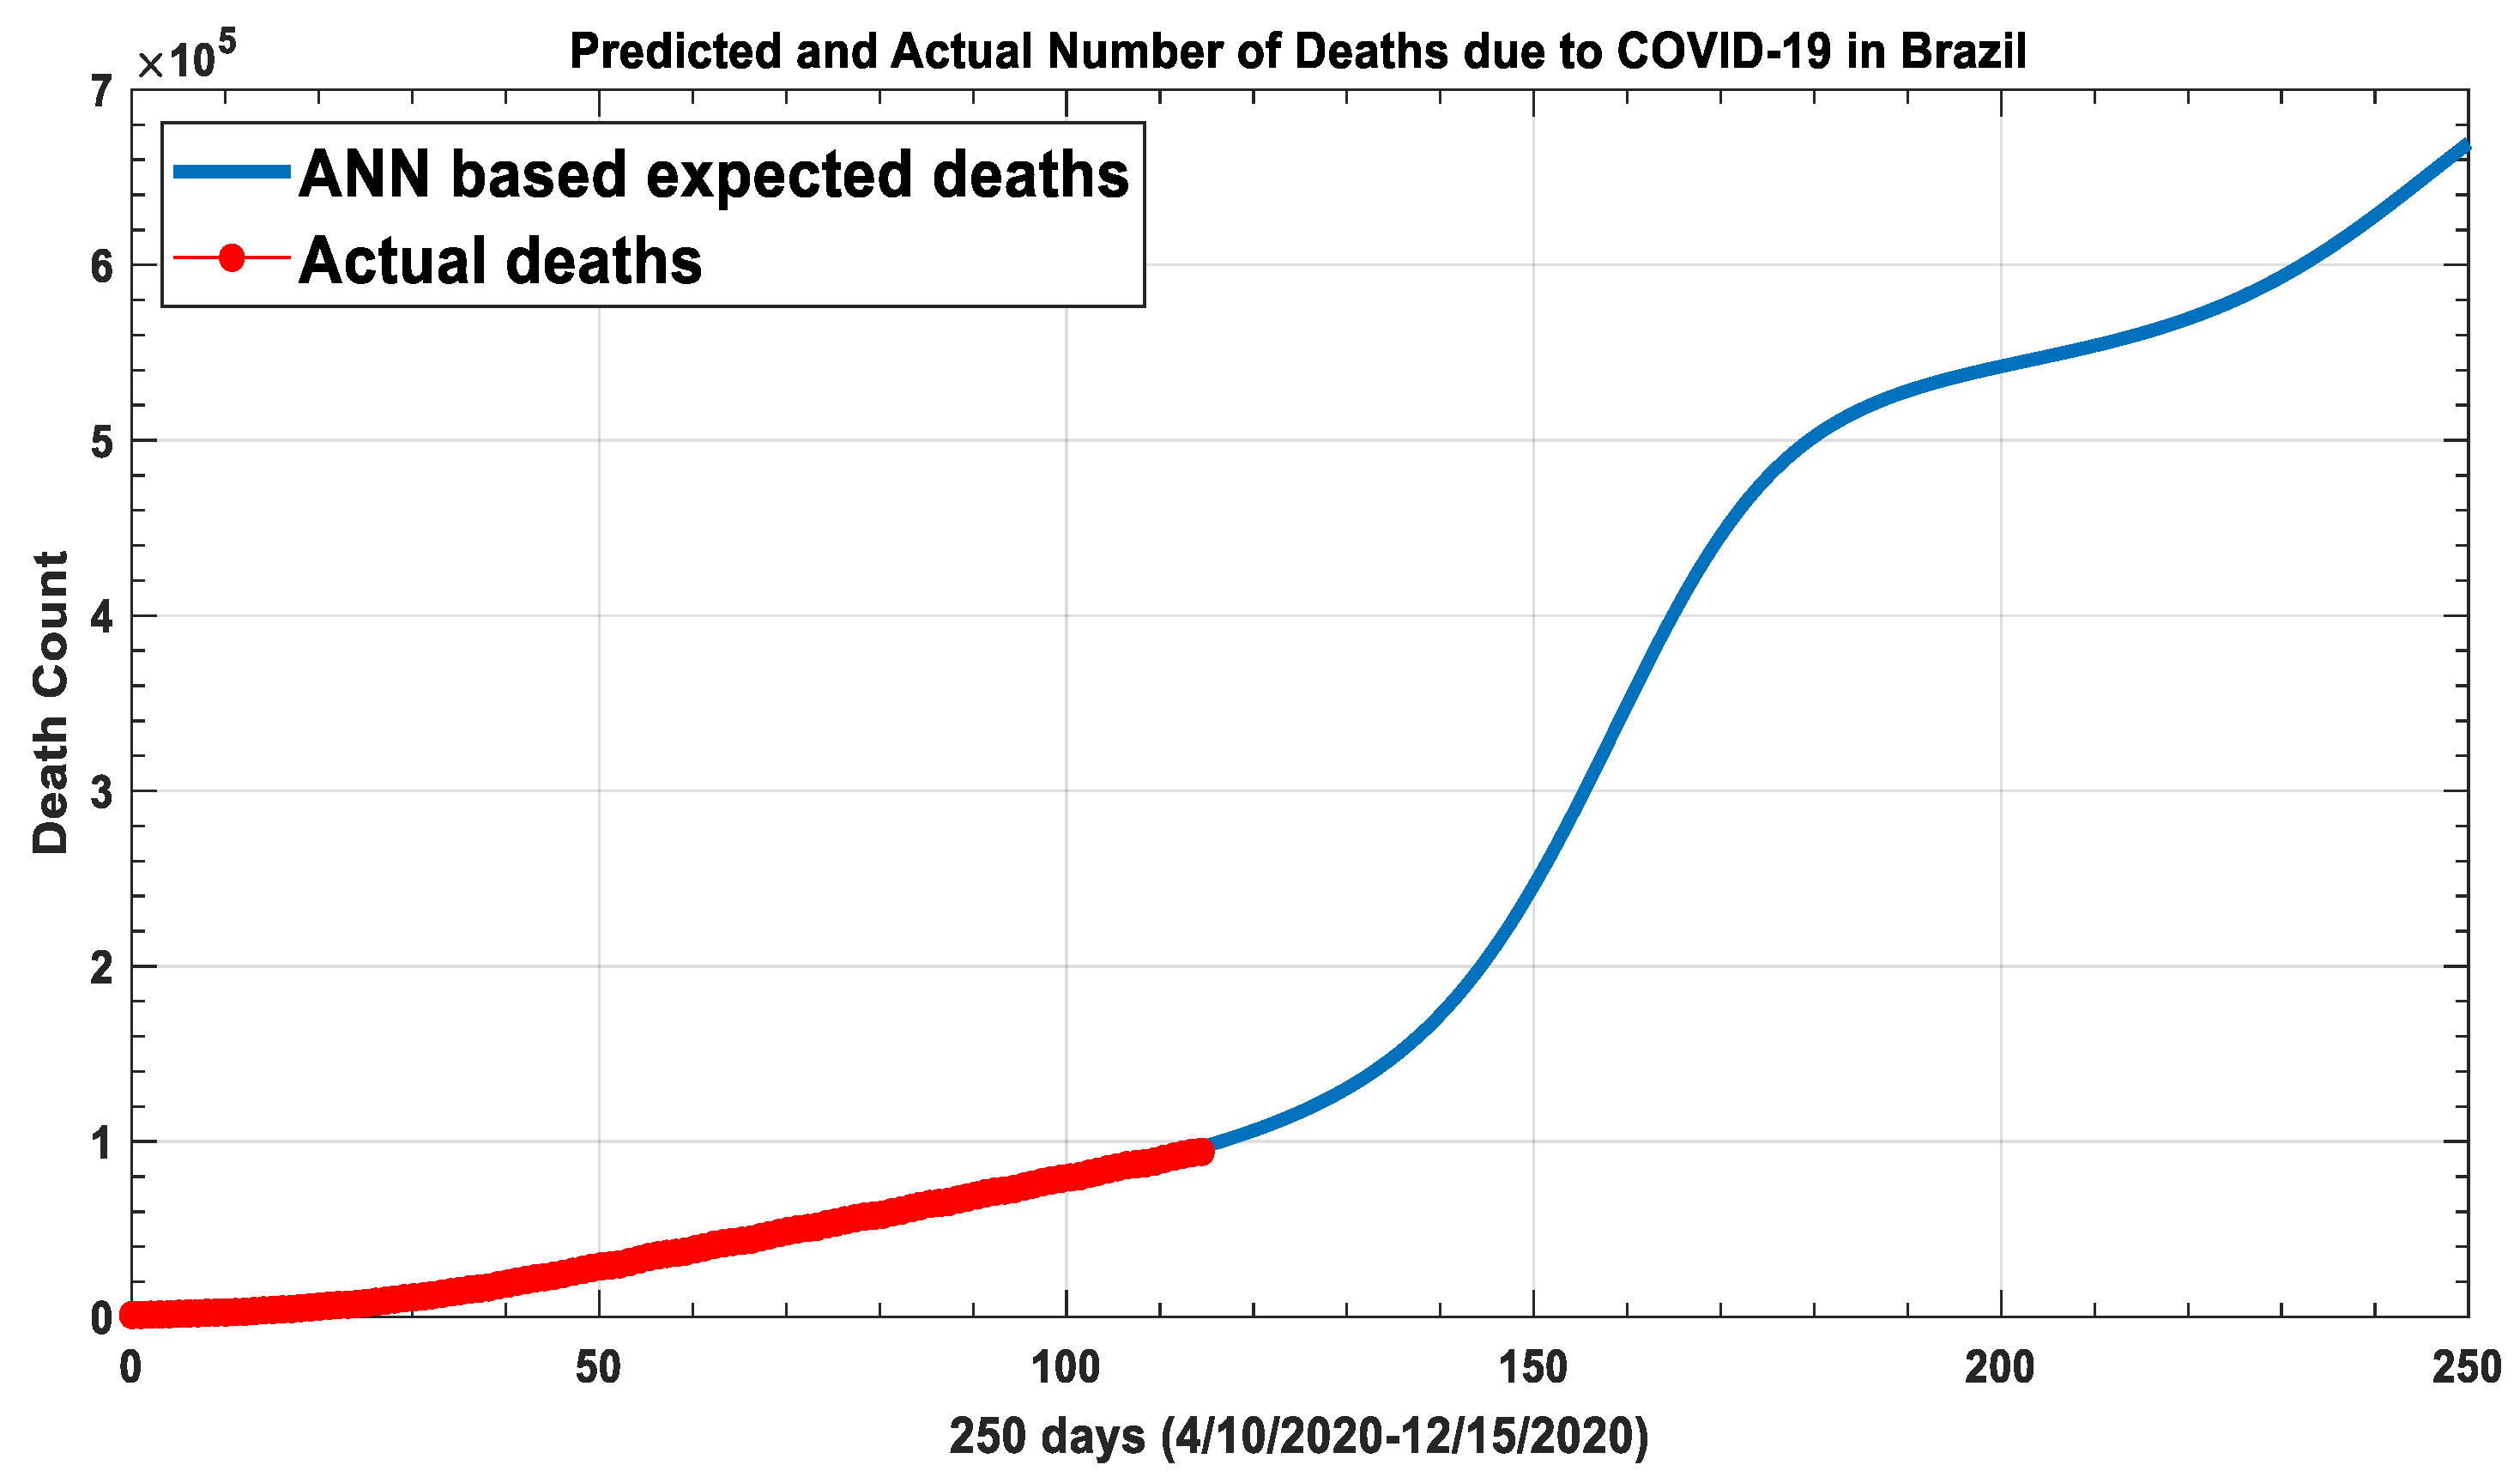
Figure 4 represents the training data (in Red), and ANN-based predicted data (in Blue) of recoveries from COVID-19 in Brazil, where the training data covers the duration from 20 April 2020, to 2 August 2020. In contrast, the ANN-based expected number of recoveries covers 20 April 2020, to 25 December 2020. The results showed that the number of recovered cases would increase by the end of the current year, at 15 × 10 5   daily rate. On the other hand, Figure 5 shows that the number of death cases would increase by the end of the current year, at 6.5 × 10 5 daily rate. Note that the training data (deaths data) covers the duration from 10 April 2020, to 2 August 2020, whereas ANN-based expected deaths cover the period from 10 April 2020, to 15 December 2020.
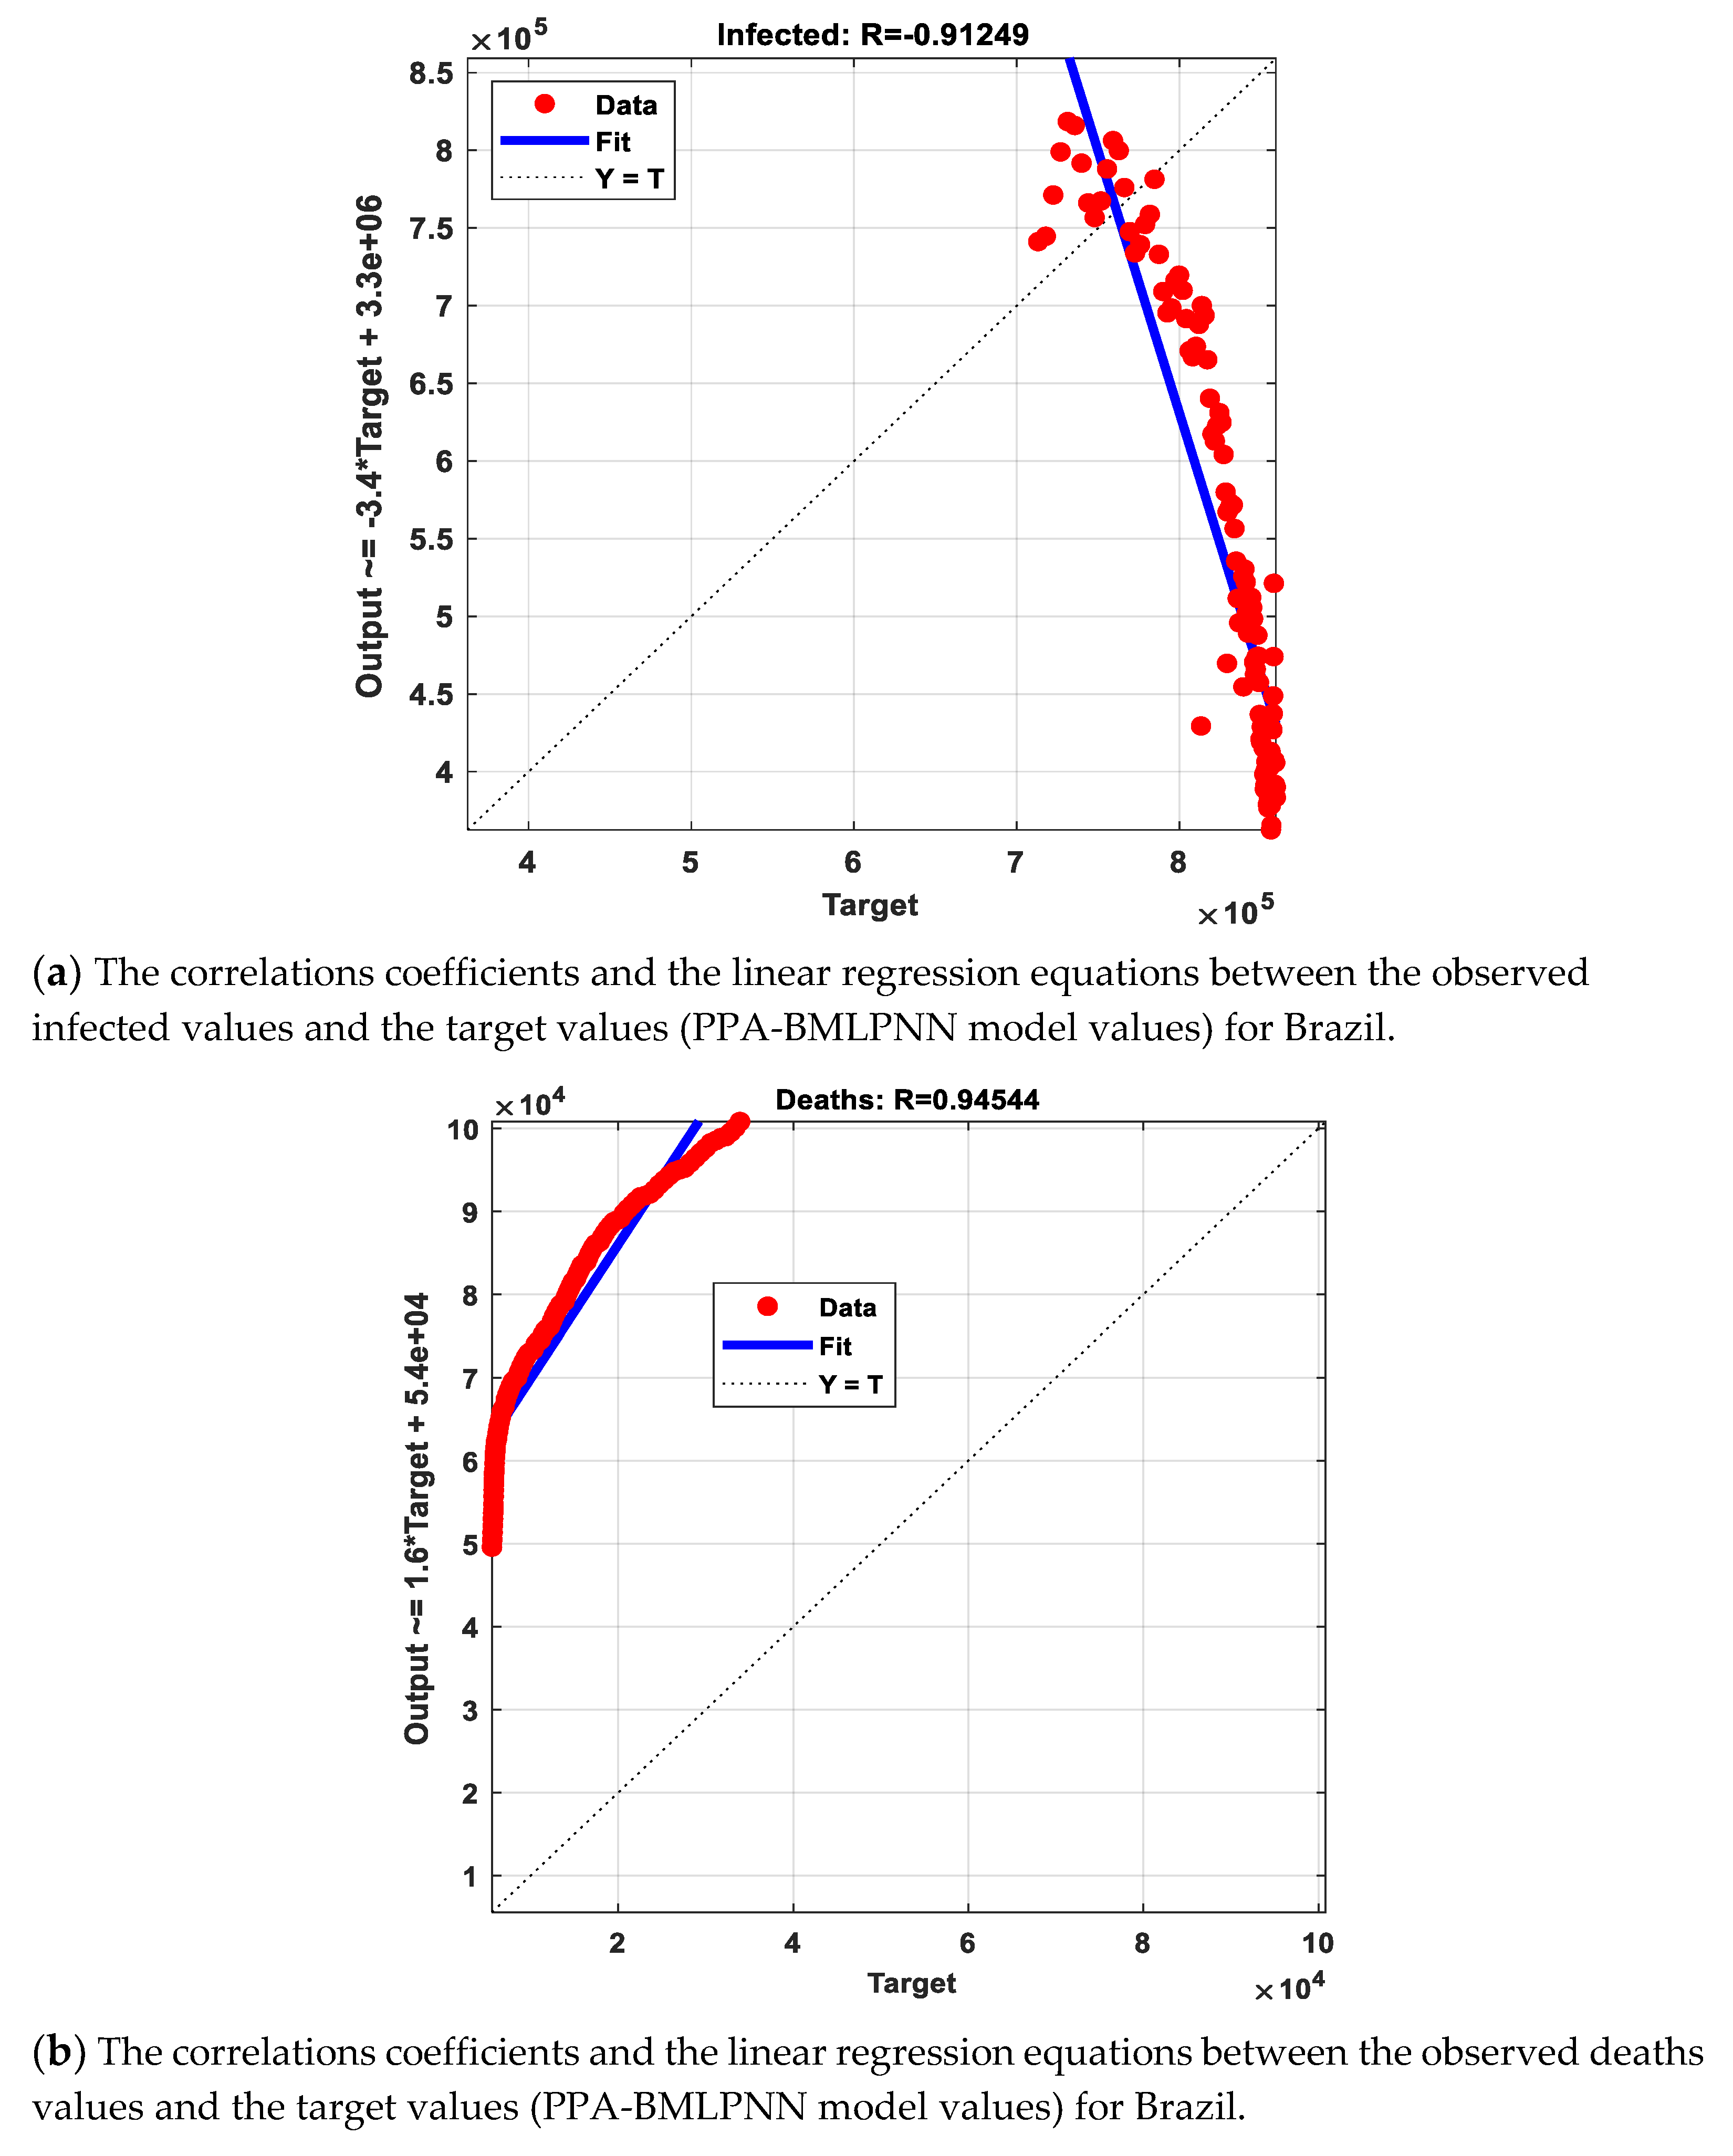
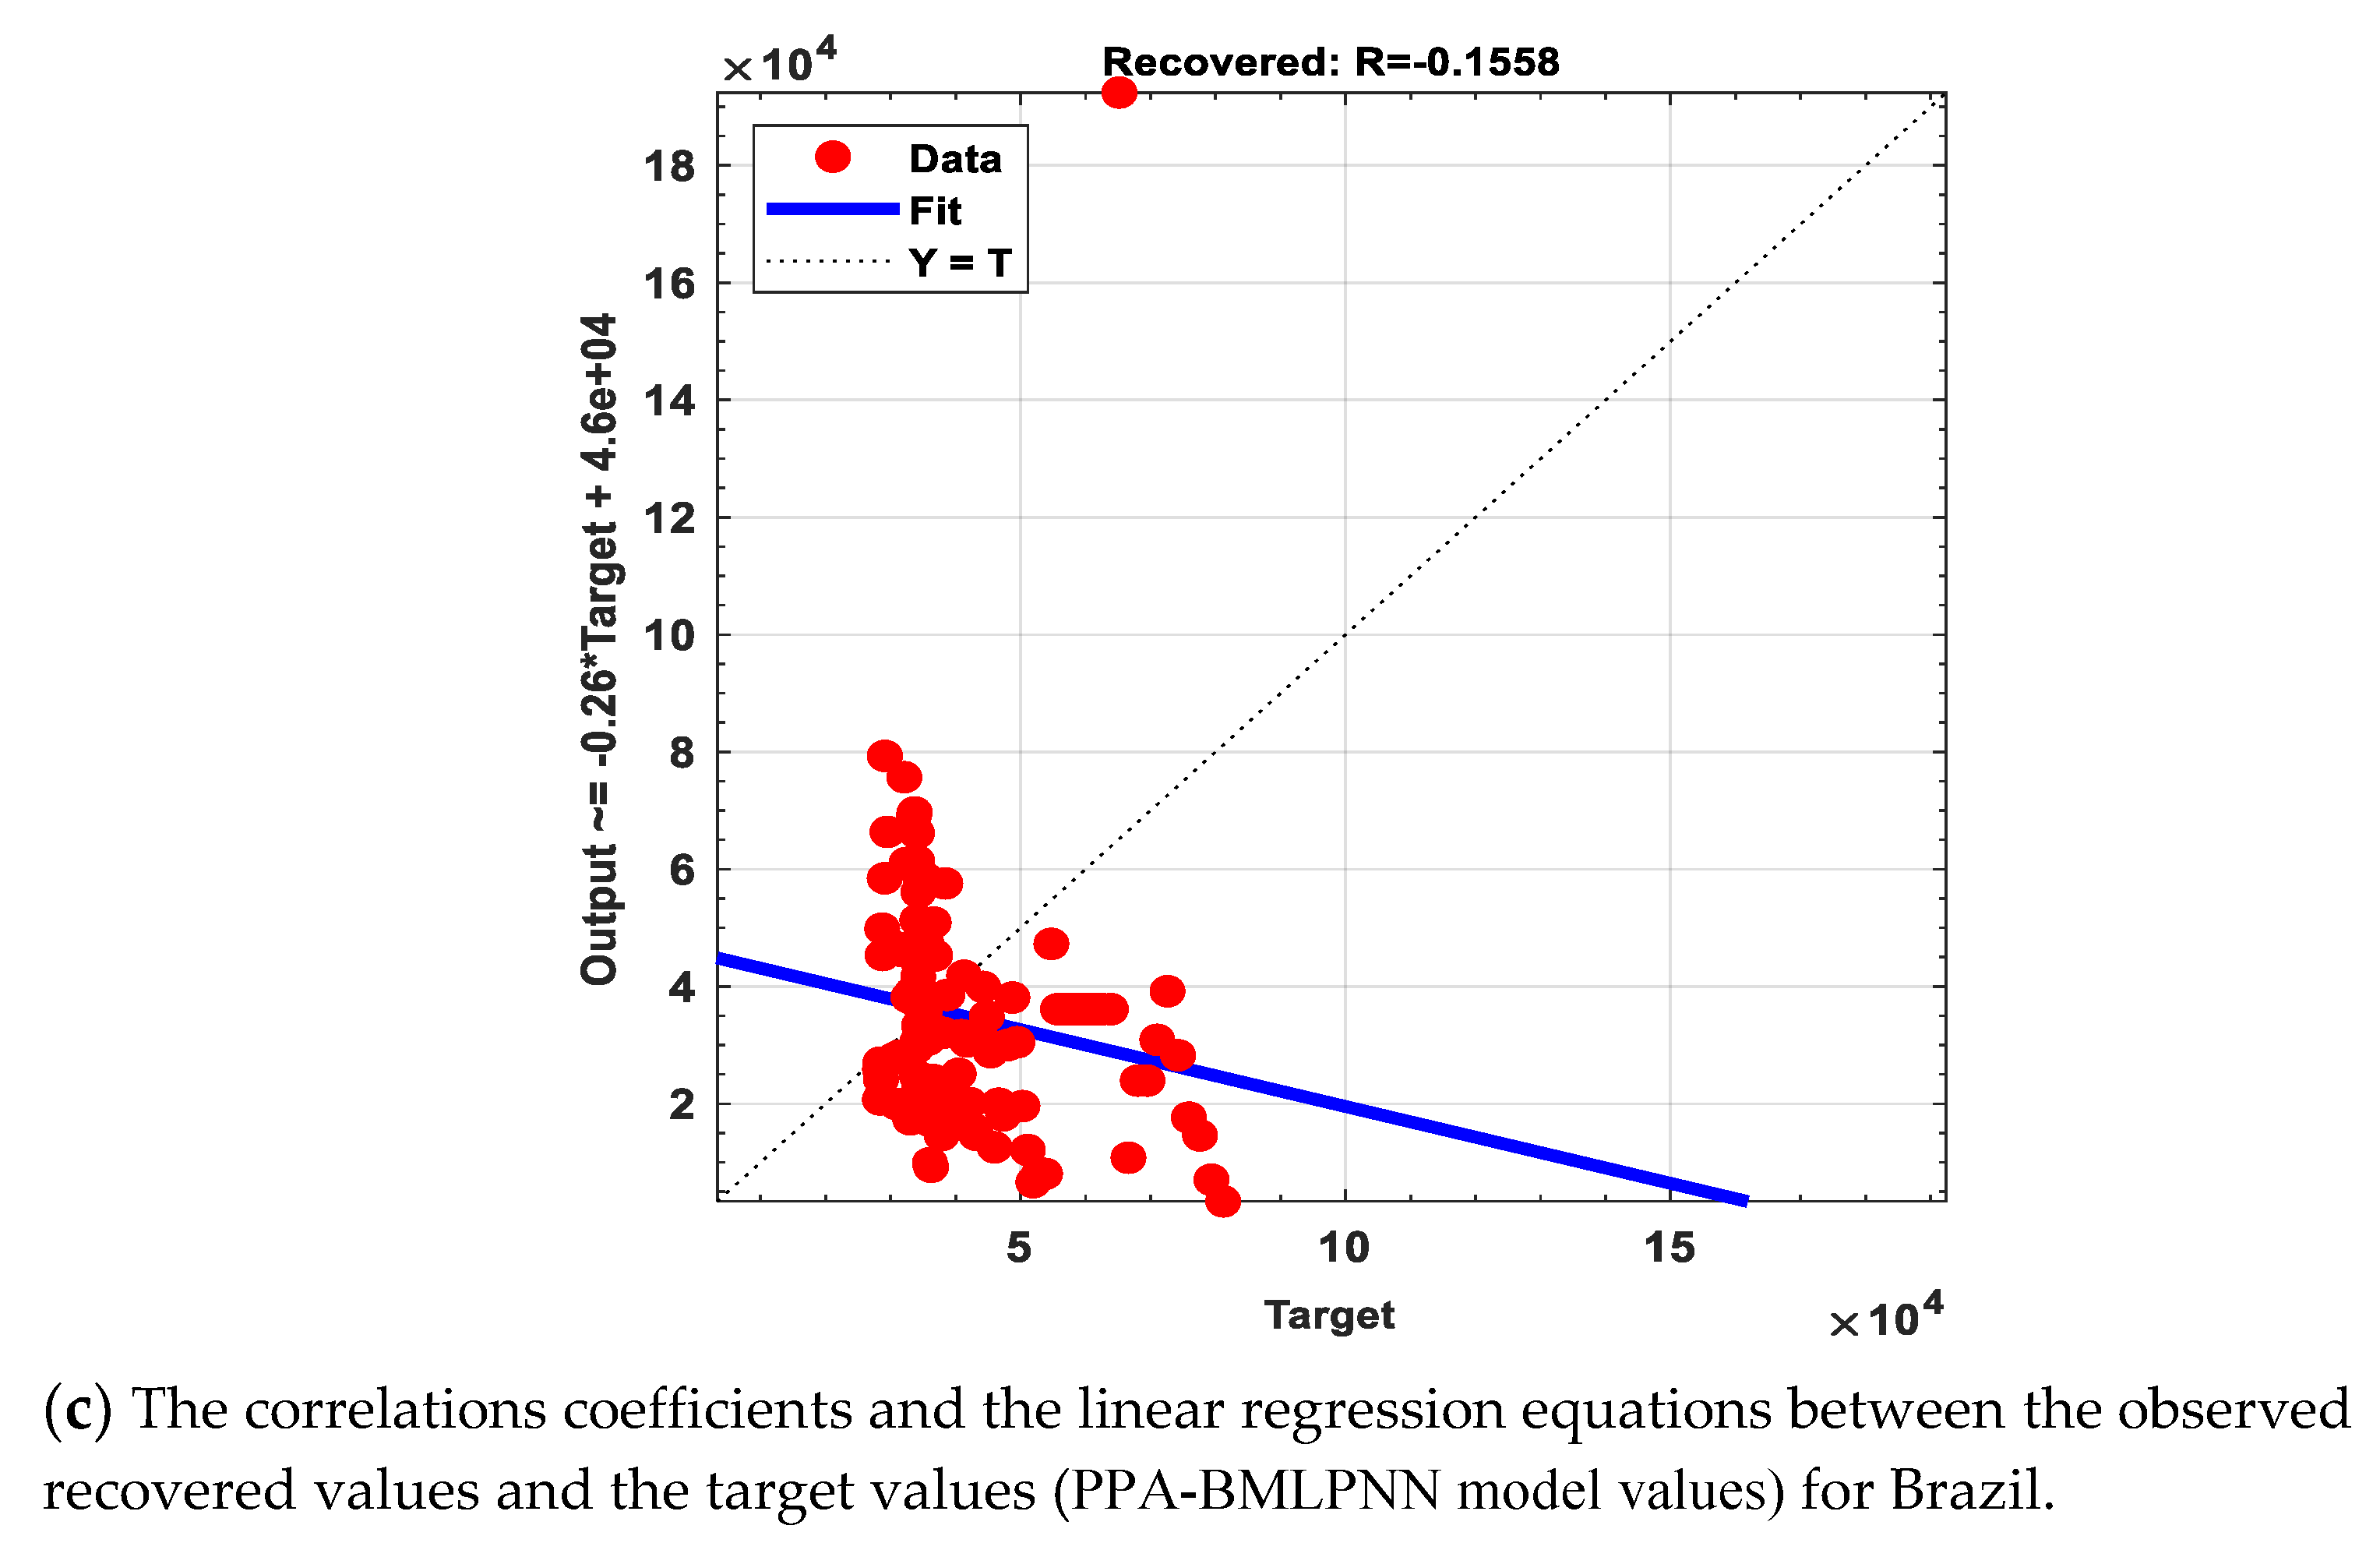
Moreover, we have used the correlation confident between the testing data that covered the duration from 4 August 2020, to 22 November 2020, and the corresponding ANN values, as shown in Figure 6. Additionally, the nonlinear regression equations of the testing data are illustrated in Figure 6. The nonlinear regression equations will help to understand the relation between the observed values and expected values. The results show that the expected number of infections, recoveries, and deaths is much higher than announced due to the insufficient number of tests and the spread of disease among indigenous and poor communities.
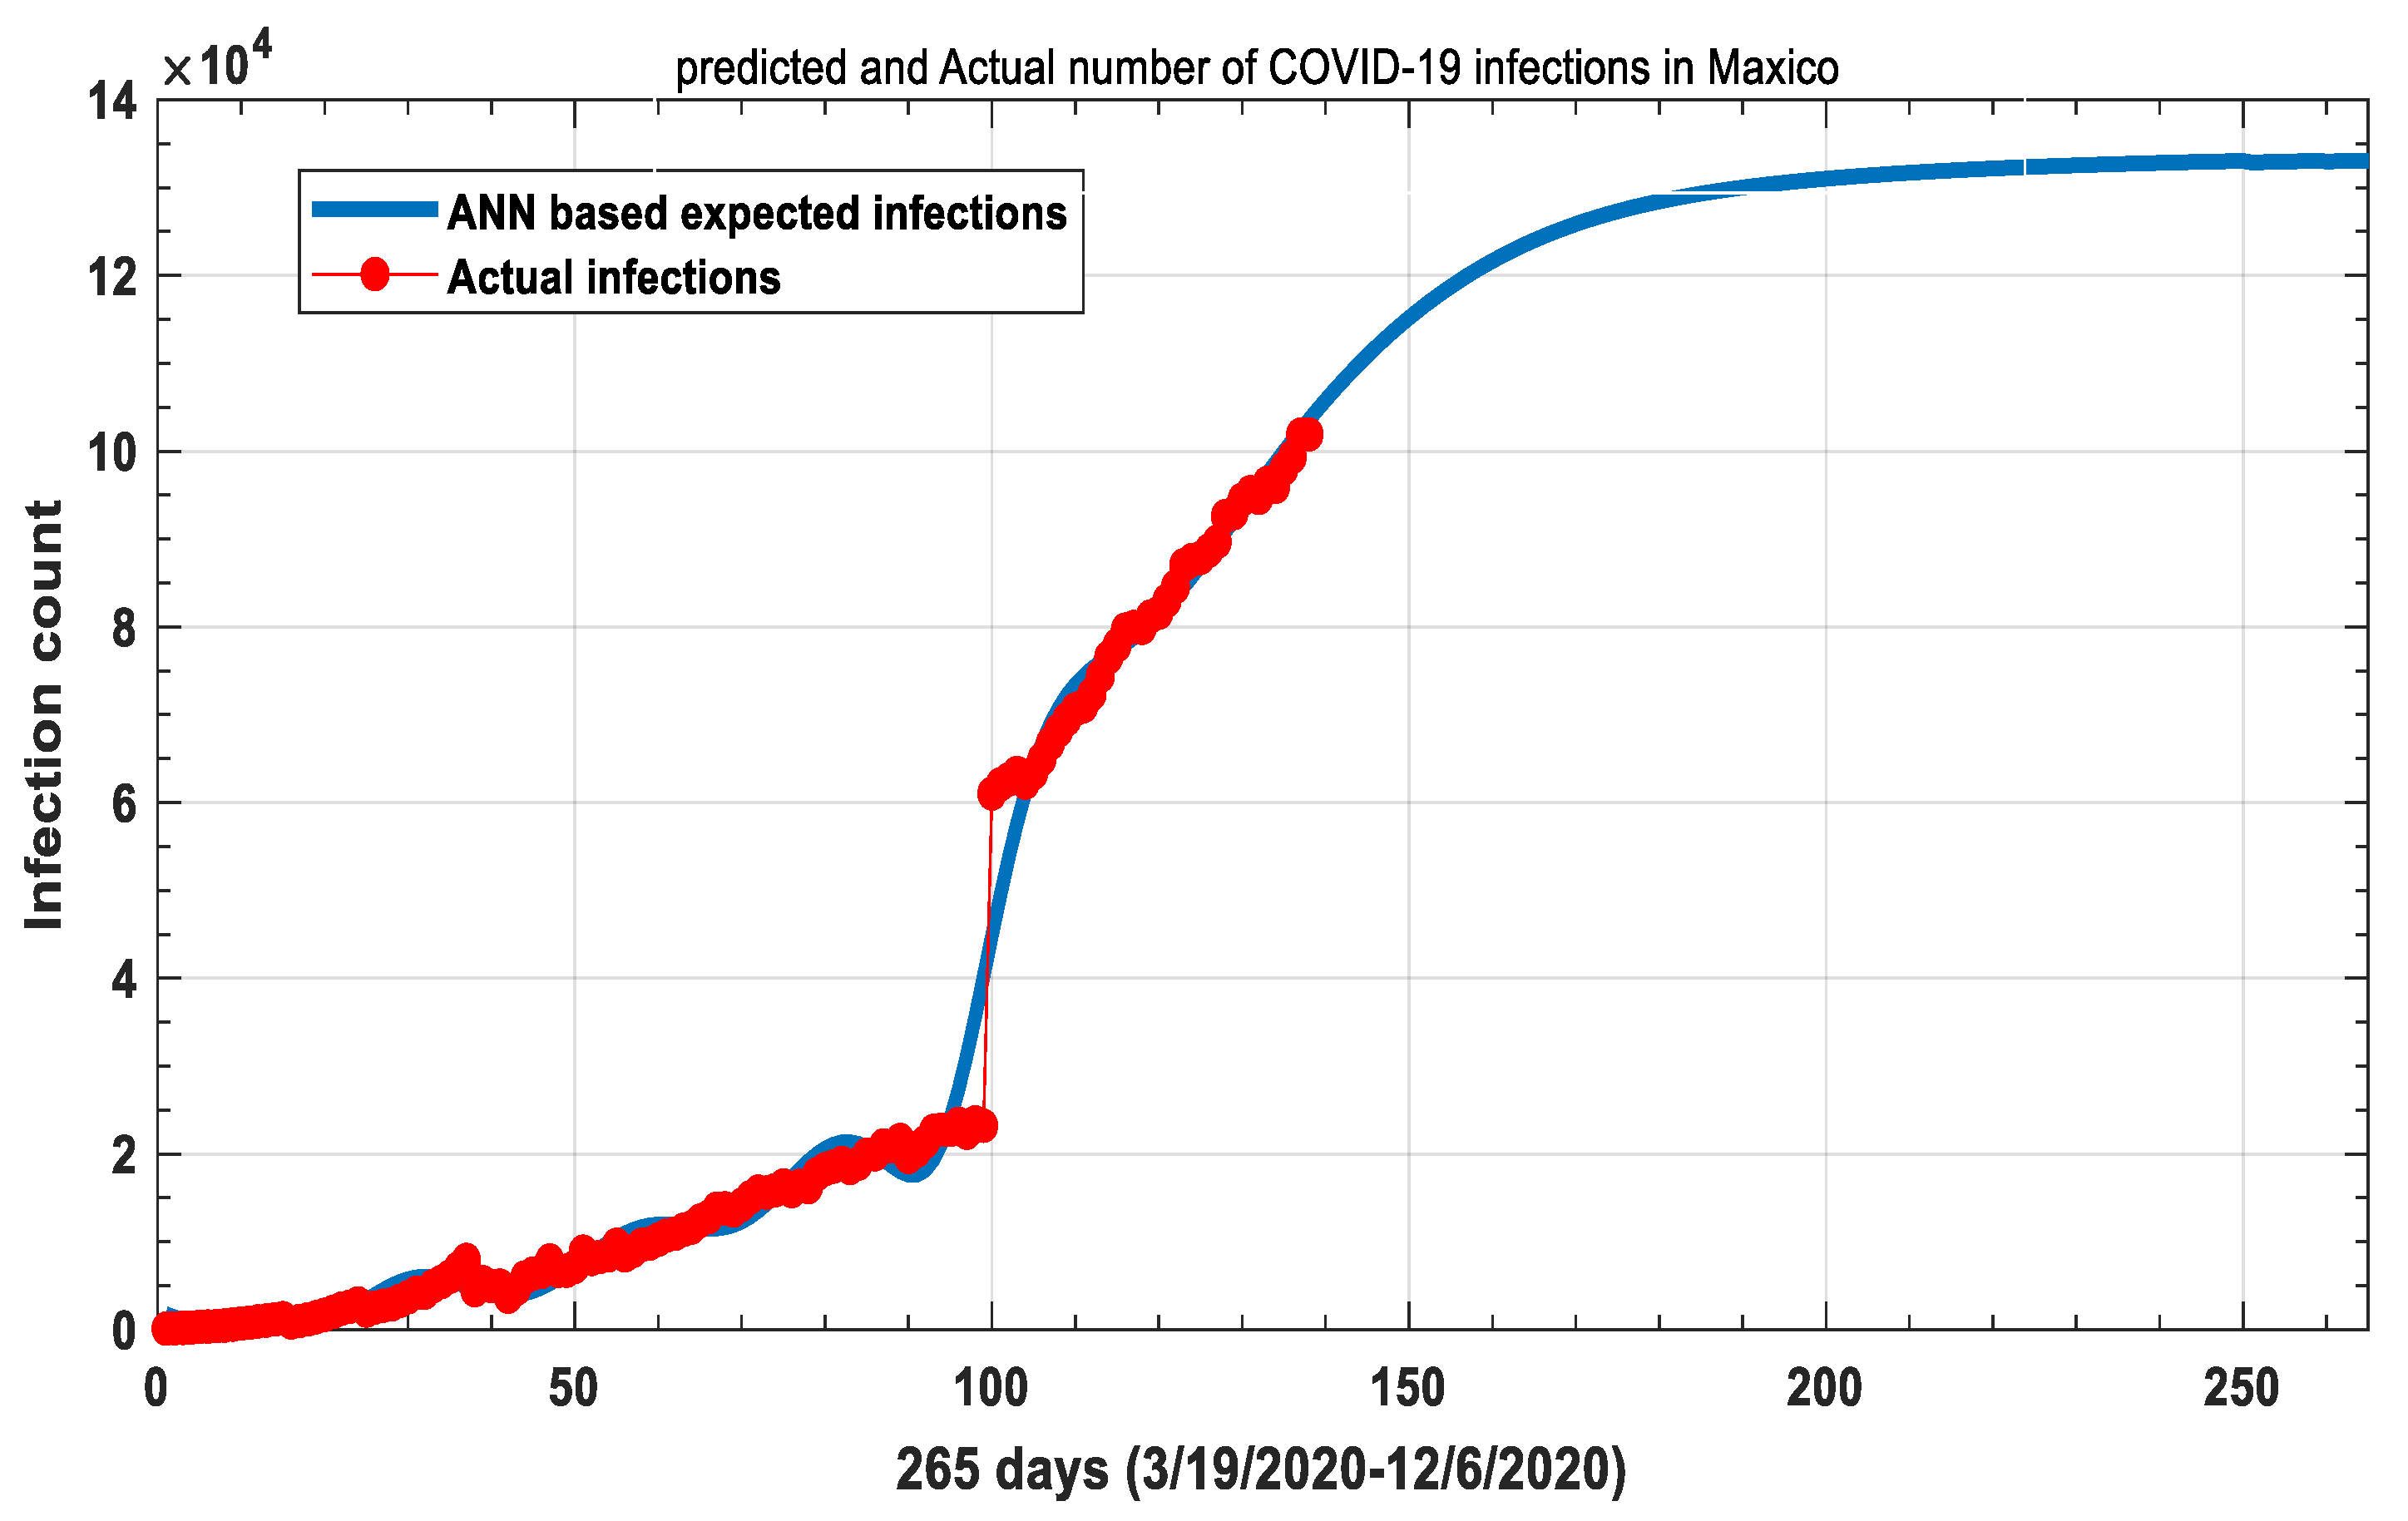
Figure 7 highlights the training data (in Red) and ANN-based predicted data (in Blue) for infected (active) cases of COVID-19 in Mexico, where the training data covers the duration from 19 March 2020, to 3 August 2020. In contrast, the ANN-based expected number of infected people covers 19 March 2020, to 6 December 2020. The results showed that the number of daily infections would continue to increase until the end of this year.
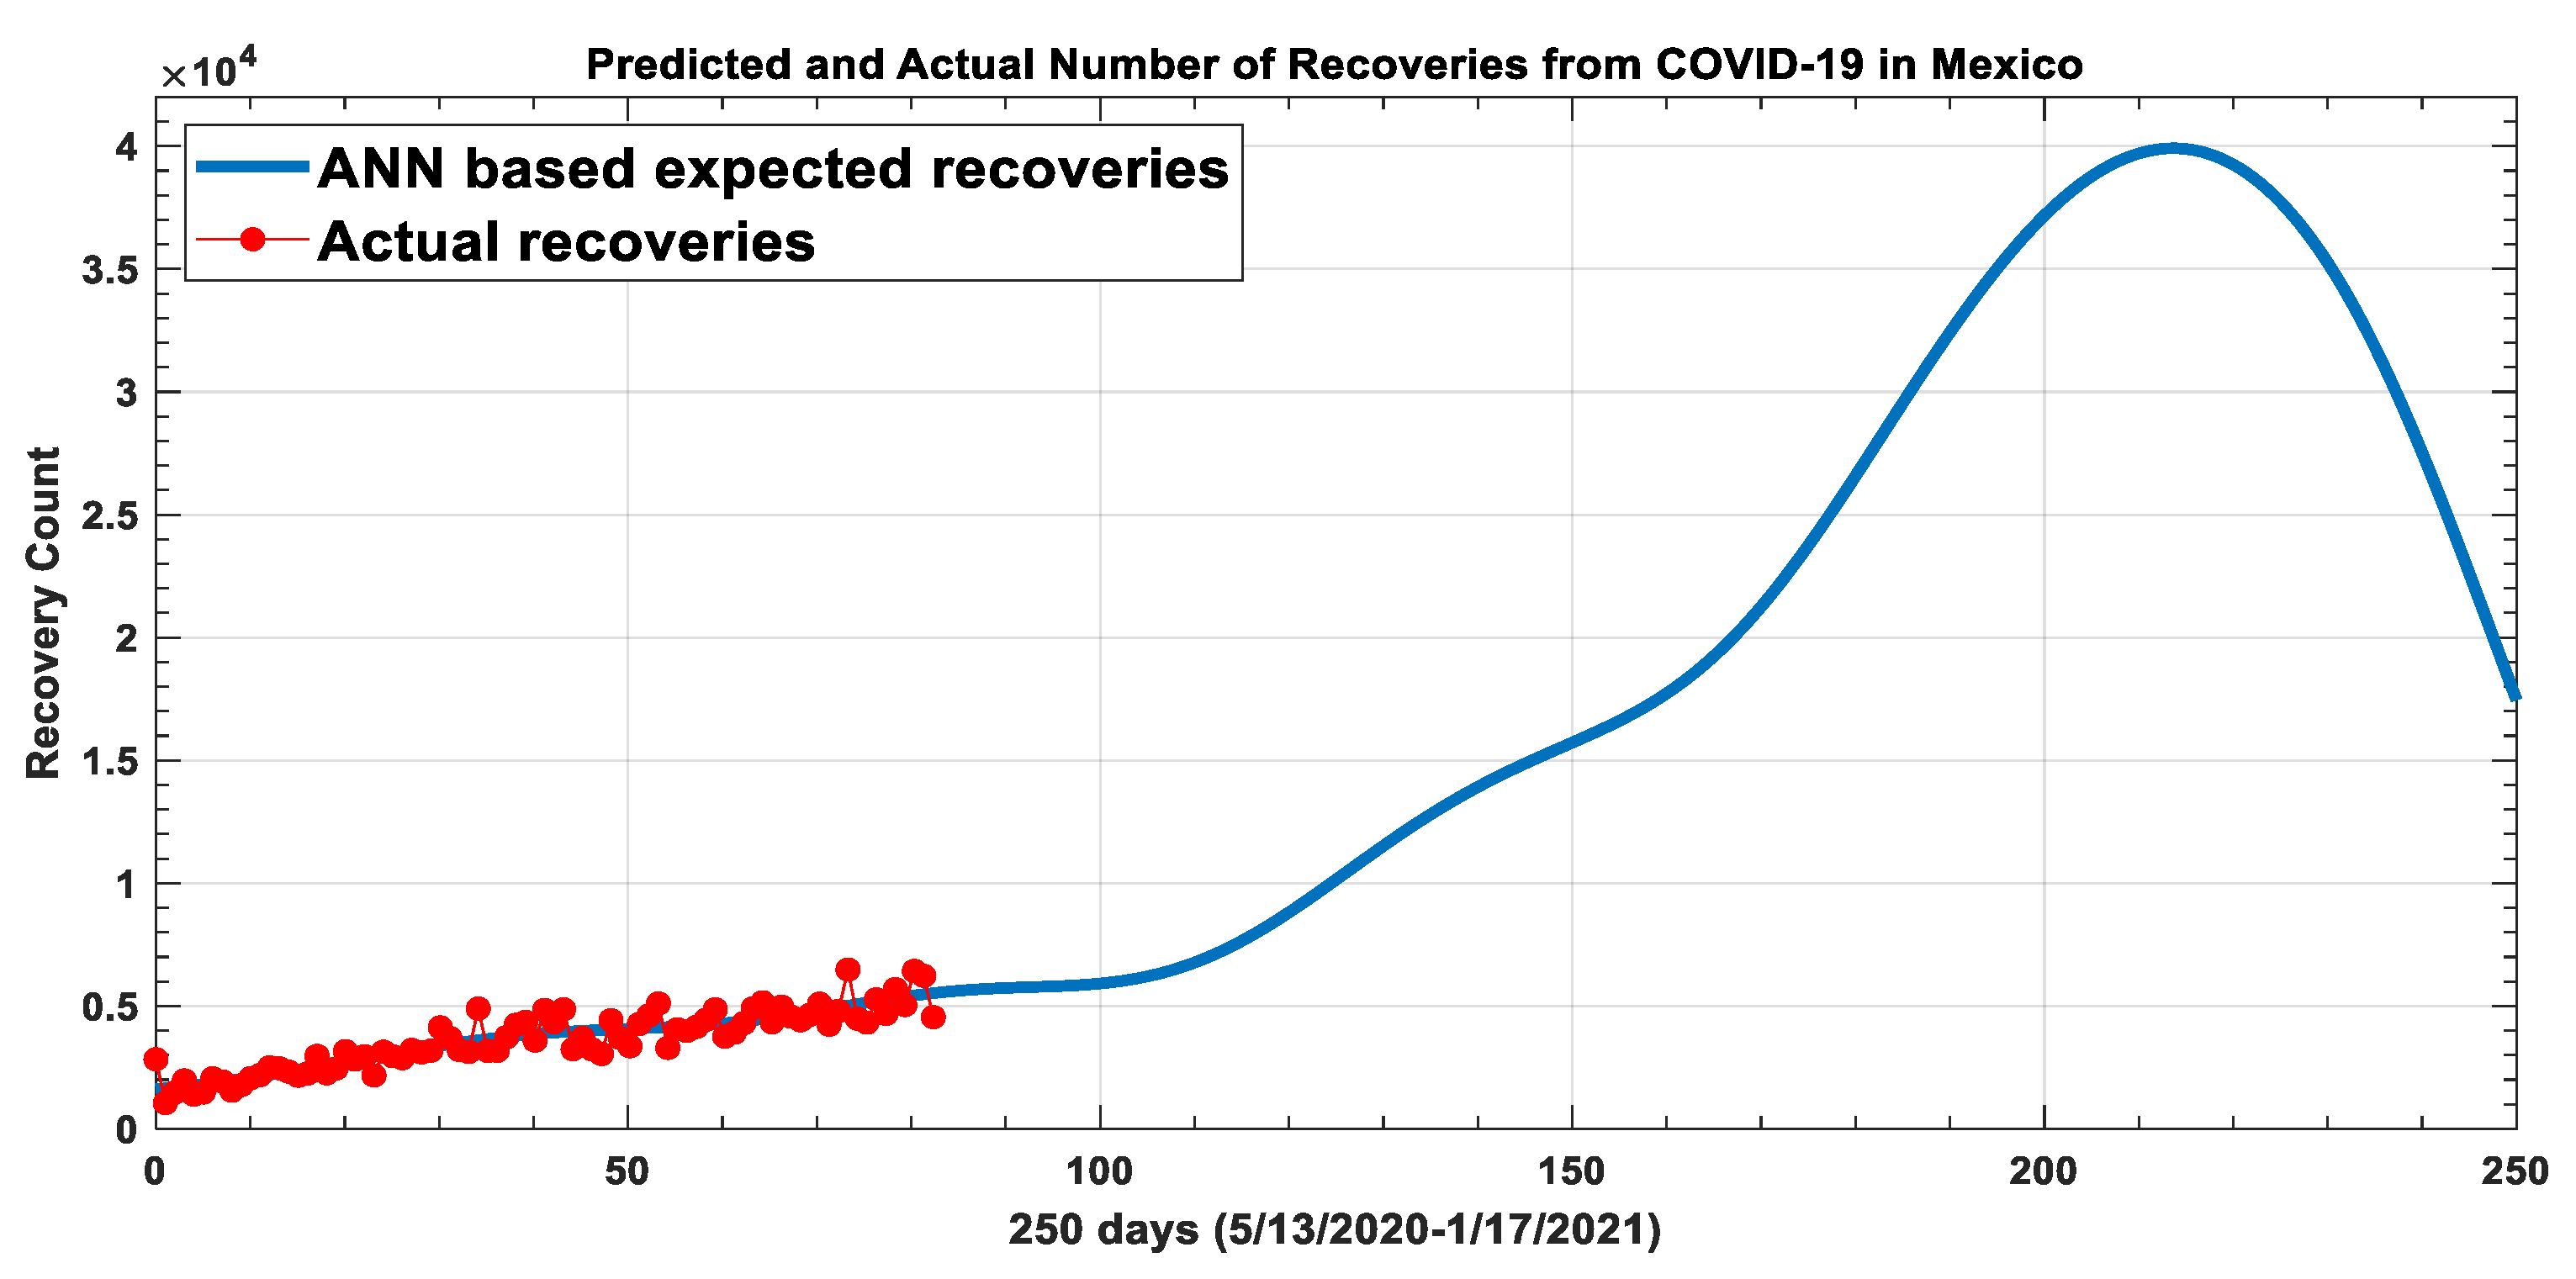
On the other hand, the expected recovery and daily deaths decrease with the end of this year, as shown in Figure 8 and Figure 9. Note that Figure 8 shows the training data (in Red) and ANN-based predicted data (in Blue) of recovered cases from COVID-19 in Mexico where the training data covers the duration from 13 May 2020, to 3 August 2020. In contrast, the ANN-based expected number of recovered cases covers data from 13 May 2020, to 17 January 2021.
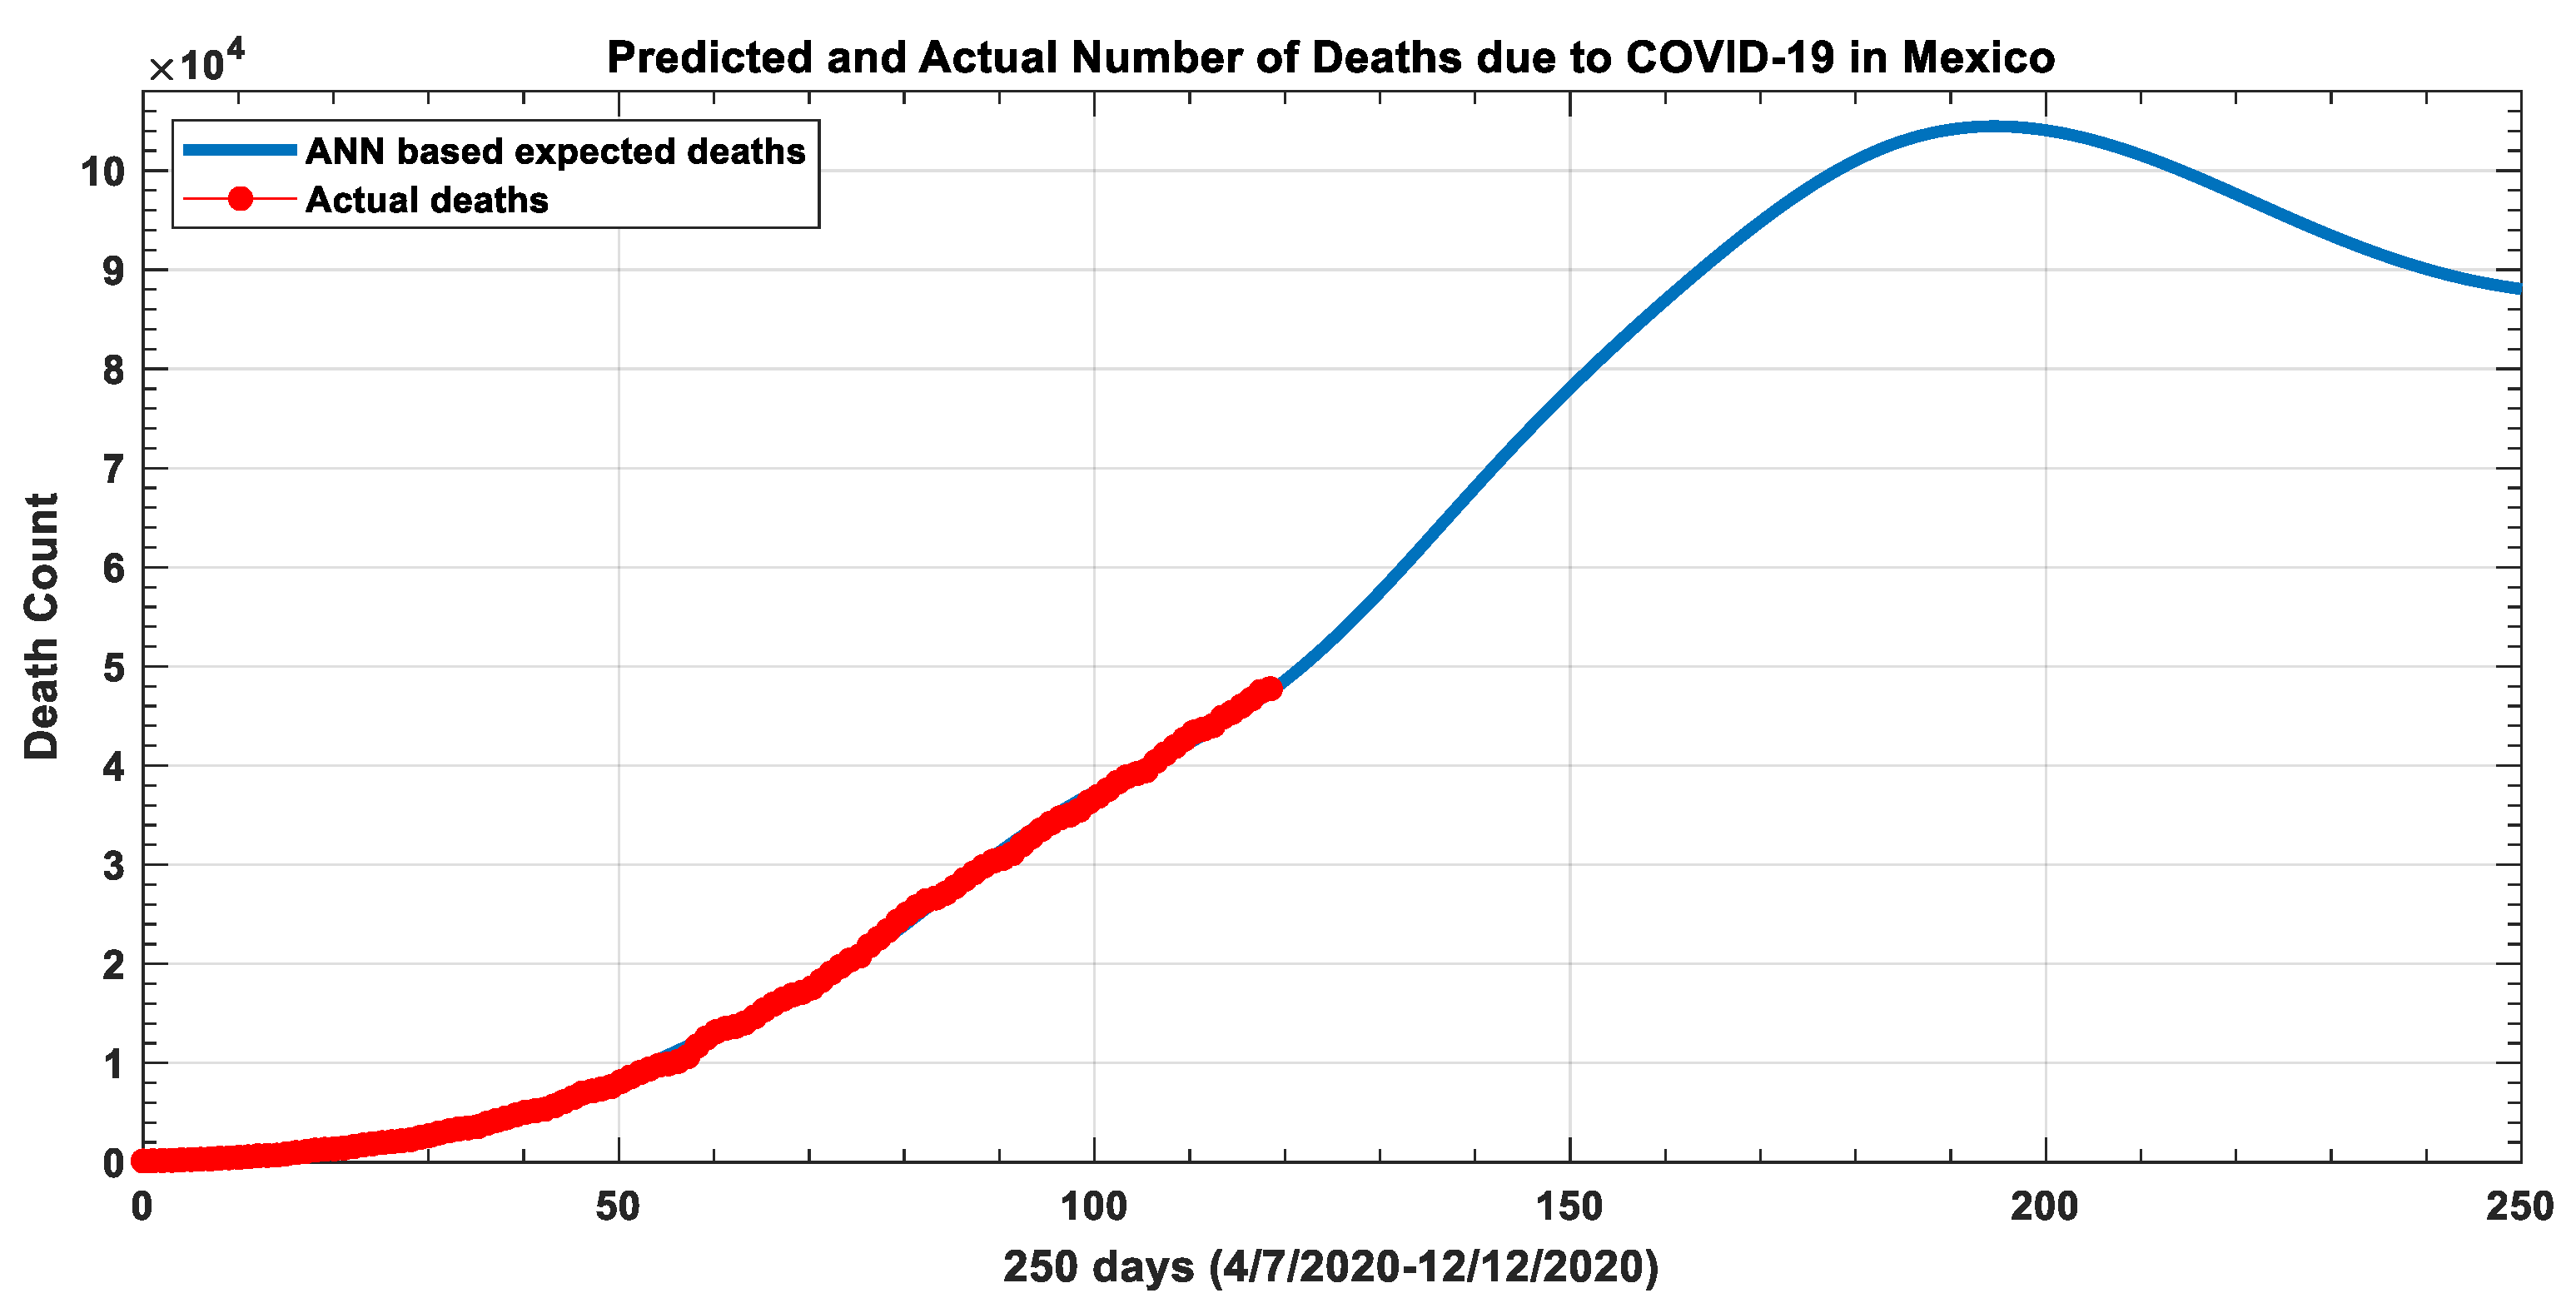
Figure 9 shows the training data (in Red) and ANN-based predicted data (in Blue) of deaths from COVID-19 in Mexico, where the training data covers the duration from 7 April 2020, to 3 August 2020. In contrast, ANN-based expected number of deaths covers the period from 7 April 2020, to 12 December 2020.
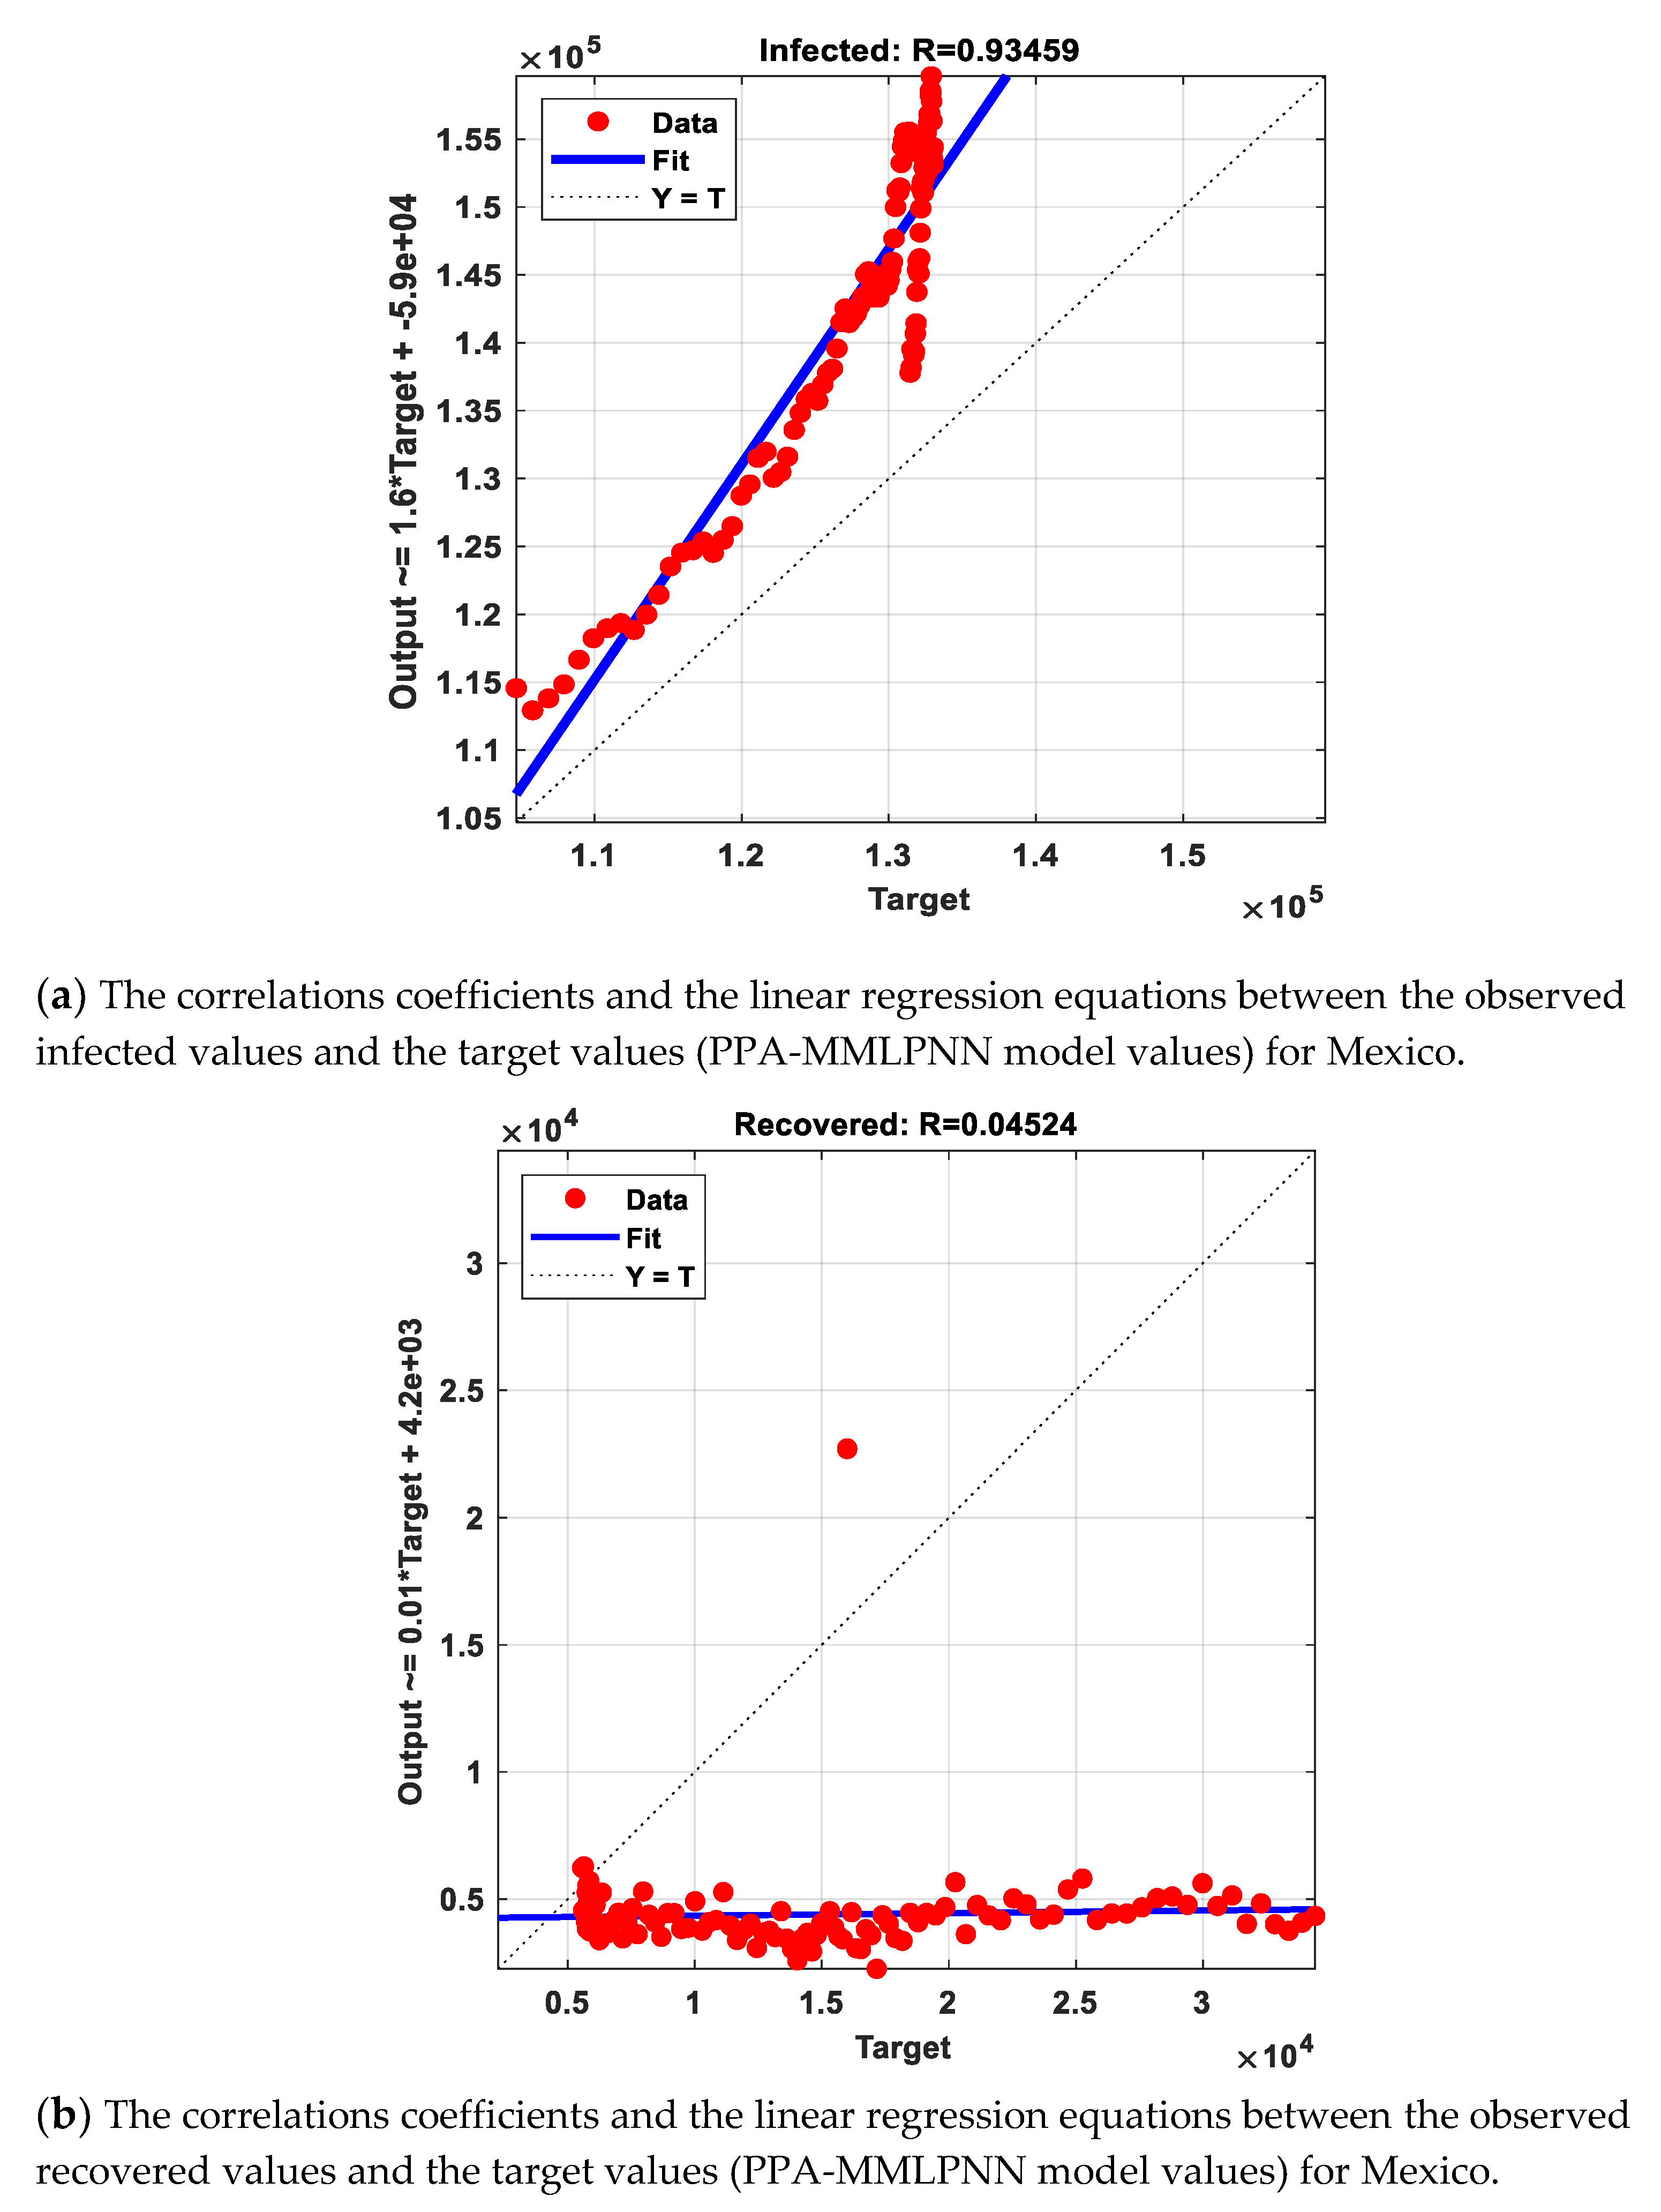
We have used the correlation confident between the testing data that covered the duration from 4 August 2020, to 22 November 2020, and the corresponding ANN values, as shown in Figure 10.
The linear regression equations of the testing data are illustrated in Figure 10. The linear regression equations will help to understand the relation between the observed values and expected values. By looking at the results, we see that the ANN values for the infections, recoveries and deaths are much higher than announced cases due to the insufficient number of tests as well as the spread of disease among poor communities. For example, the correlation coefficient of the recovered number between the expected data and announced data is 0.045.

4. Conclusions

In this study, we have proposed artificial neural networks (ANNs) prediction models for Brazil and Mexico using a multilayer perceptron neural network (MLPNN) in conjunction with a prey predator algorithm (PPA). The two proposed model are (PPA-BMLPNN and PPA-MMLPNN). These models are employed as an artificial inelegance forecasting technique for COVID-19 in Brazil and Mexico. PPA was used to determine the optimal parameter values of the ANN models. Note that the parameters for MLPNNs are the input weights and output weights. The proposed models have high performance in predicting the number of infected (active), total deaths, and recovered cases in Brazil and Mexico. The results could also be of interest to countries similar in population and case numbers to Brazil and Mexico. The results show that
  • At the beginning of 2021, the average active cases of COVID-19 in Brazil will go to 9   ×   10 5 , with 1.5 × 10 5 recovered cases per day, and more than 6 × 10 5 the total of deaths.
  • At the beginning of 2021, the average active cases of COVID-19 in Mexico will go to 1.4 × 10 5 , with less than 0.2 × 10 5 recovered per day, and less than 0.9 × 10 5 total deaths.

Author Contributions

Conceptualization, N.N.H. and W.A.K.; methodology, N.N.H. and W.A.K.; validation, N.N.H., W.A.K. and M.T.; investigation, N.N.H. and M.T.; resources, W.A.K. and M.T.; writing—original draft preparation, N.N.H., W.A.K. and M.T.; writing—review and editing, N.N.H., W.A.K. and M.T.; supervision, W.A.K. All authors have read and agreed to the published version of the manuscript.

Funding

This research received no external funding.

Conflicts of Interest

The authors declare no conflict of interest.

References

  1. Zu, Z.Y.; Jiang, M.D.; Xu, P.P.; Chen, W.; Ni, Q.Q.; Lu, G.M.; Zhang, L.J. Coronavirus disease 2019 (COVID-19): A perspective from China. Radiology 2020, 200490. [Google Scholar] [CrossRef] [PubMed] [Green Version]
  2. Tartaglione, E.; Barbano, C.A.; Berzovini, C.; Calandri, M.; Grangetto, M. Unveiling COVID-19 from Chest X-ray with deep learning: A hurdles race with small data. Int. J. Environ. Res. Public Health 2020, 17, 6933. [Google Scholar] [CrossRef]
  3. Kong, W.; Agarwal, P.P. Chest imaging appearance of COVID-19 infection. Radiol. Cardiothorac. Imaging 2020, 2, e200028. [Google Scholar] [CrossRef] [Green Version]
  4. Zhou, P.; Yang, X.-L.; Wang, X.-G.; Hu, B.; Zhang, L.; Zhang, W.; Si, H.-R.; Zhu, Y.; Li, B.; Huang, C.-L.; et al. A pneumonia outbreak associated with a new coronavirus of probable bat origin. Nature 2020, 579, 270–273. [Google Scholar] [CrossRef] [PubMed] [Green Version]
  5. Li, X.; Geng, M.; Peng, Y.; Meng, L.; Lu, S. Molecular immune pathogenesis and diagnosis of COVID-19. J. Pharm. Anal. 2020, 10, 102–108. [Google Scholar] [CrossRef] [PubMed]
  6. Wang, L.; Lin, Z.Q.; Wong, A. Covid-net: A tailored deep convolutional neural network design for detection of COVID-19 cases from chest x-ray images. Sci. Rep. 2020, 10, 19549. [Google Scholar] [CrossRef] [PubMed]
  7. Chen, Y.; Cheng, J.; Jiang, Y.; Liu, K. A time delay dynamic system with external source for the local outbreak of 2019-nCoV. Appl. Anal. 2020, 1–12. [Google Scholar] [CrossRef] [Green Version]
  8. Fu, L.; Wang, B.; Yuan, T.; Chen, X.; Ao, Y.; Fitzpatrick, T.; Li, P.; Zhou, Y.; Lin, Y.; Duan, Q.; et al. Clinical characteristics of coronavirus disease 2019 (COVID-19) in China: A systematic review and meta-analysis. J. Infect. 2020, 80, 656–665. [Google Scholar] [CrossRef]
  9. Cascella, M.; Rajnik, M.; Cuomo, A.; Dulebohn, S.C.; Di Napoli, R. Features, Evaluation and Treatment Coronavirus (COVID-19). Statpearls; StatPearls Publishing: Treasure Island, FL, USA, 2020. [Google Scholar]
  10. Cohen, J.P.; Morrison, P.; Dao, L.; Roth, K.; Duong, T.Q.; Ghassemi, M. COVID-19 image data collection: Prospective predictions are the future. arXiv 2019, arXiv:200611988. [Google Scholar]
  11. Gao, Z.; Xu, Y.; Sun, C.; Wang, X.; Guo, Y.; Qiu, S.; Ma, K. A systematic review of asymptomatic infections with COVID-19. J. Microbiol. Immunol. Infect. 2020. [Google Scholar] [CrossRef]
  12. Khaleque, A.; Sen, P. An empirical analysis of the Ebola outbreak in West Africa. Sci. Rep. 2017, 7, 42594. [Google Scholar] [CrossRef] [PubMed] [Green Version]
  13. Zakary, O.; Larrache, A.; Rachik, M.; Elmouki, I. Effect of awareness programs and travel-blocking operations in the control of HIV/AIDS outbreaks: A multi-domains SIR model. Adv. Differ. Equ. 2016, 2016, 169. [Google Scholar] [CrossRef] [Green Version]
  14. Godio, A.; Pace, F.; Vergnano, A. SEIR Modeling of the Italian Epidemic of SARS-CoV-2 Using Computational Swarm Intelligence. Int. J. Environ. Res. Public Health 2020, 17, 3535. [Google Scholar] [CrossRef] [PubMed]
  15. Berger, D.W.; Herkenhoff, K.F.; Mongey, S. An seir infectious disease model with testing and conditional quarantine. Natl. Bur. Econ. Res. 2020, 898–2937. [Google Scholar]
  16. Roda, W.C.; Varughese, M.B.; Han, D.; Li, M.Y. Why is it difficult to accurately predict the COVID-19 epidemic? Infect. Dis. Model. 2020, 5, 271–281. [Google Scholar] [CrossRef]
  17. Weissman, G.E.; Crane-Droesch, A.; Chivers, C.; Luong, T.; Hanish, A.; Lubken, J.; Becker, M.; Draugelis, M.E.; Anesi, G.L.; Brennan, P.J.; et al. Locally informed simulation to predict hospital capacity needs during the COVID-19 pandemic. Ann. Intern. Med. 2020. [Google Scholar] [CrossRef]
  18. Meng, F.; Uversky, V.N.; Kurgan, L. Comprehensive review of methods for prediction of intrinsic disorder and its molecular functions. Cell. Mol. Life Sci. 2017, 74, 3069–3090. [Google Scholar] [CrossRef]
  19. Al-Qaness, M.A.; Ewees, A.A.; Fan, H.; Abd El Aziz, M. Optimization method for forecasting confirmed cases of COVID-19 in China. J. Clin. Med. 2020, 9, 674. [Google Scholar] [CrossRef] [Green Version]
  20. Hamadneh, N.N.; Khan, W.A.; Ashraf, W.; Atawneh, S.H.; Khan, I.; Hamadneh, B.N. Artificial Neural Networks for Prediction of COVID-19 in Saudi Arabia. Comput. Mater. Contin. 2021, 66, 2787–2796. [Google Scholar] [CrossRef]
  21. Wang, L.; Wang, Z.; Qu, H.; Liu, S. Optimal forecast combination based on neural networks for time series forecasting. Appl. Soft Comput. 2018, 66, 1–17. [Google Scholar] [CrossRef]
  22. Eriksson, T.A.; Bülow, H.; Leven, A. Applying neural networks in optical communication systems: Possible pitfalls. IEEE Photonics Technol. Lett. 2017, 29, 2091–2094. [Google Scholar] [CrossRef] [Green Version]
  23. Worldometers (2020) Brazil Coronavirus Disease. Available online: https://www.worldometers.info/coronavirus/country/brazil/ (accessed on 16 January 2021).
  24. Worldometers (2020) Mexico Coronavirus Disease. Available online: https://www.worldometers.info/coronavirus/country/mexico/ (accessed on 16 January 2021).
  25. Hamadneh, N.N.; Khan, W.S.; Khan, W.A. Prediction of thermal conductivities of polyacrylonitrile electrospun nanocomposite fibers using artificial neural network and prey predator algorithm. J. King Saud Univ. Sci. 2019, 31, 618–627. [Google Scholar] [CrossRef]
  26. Tilahun, S.L.; Ong, H.C. Prey-predator algorithm: A new metaheuristic algorithm for optimization problems. Int. J. Inf. Technol. Decis. Mak. 2015, 14, 1331–1352. [Google Scholar] [CrossRef]
  27. Cherstvy, A.G.; Vinod, D.; Aghion, E.; Chechkin, A.V.; Metzler, R. Time averaging, ageing and delay analysis of financial time series. New J. Phys. 2017, 19, 063045. [Google Scholar] [CrossRef] [Green Version]
  28. Falah, F.; Rahmati, O.; Rostami, M.; Ahmadisharaf, E.; Daliakopoulos, I.N.; Pourghasemi, H.R. Artificial neural networks for flood susceptibility mapping in data-scarce urban areas. In Spatial Modeling in GIS and R for Earth and Environmental Sciences; Elsevier: Amsterdam, The Netherlands, 2019; pp. 323–336. [Google Scholar]
  29. Kakkar, P.; Dutta, U. A novel Approach to Recognition of English Characters Using Artificial Neural Networks. Int. J. Adv. Res. Electr. Electron. Instrum. Eng. 2014, 3. [Google Scholar]
  30. Mohsin, A.; Sadoon, M. Developing an Arabic Handwritten Recognition System by Means of Artificial Neural Network. J. Eng. Appl. Sci. 2019, 15, 1–3. [Google Scholar] [CrossRef] [Green Version]
  31. Hamadneh, N.; Khan, W.; Tilahun, S. Optimization of microchannel heat sinks using prey-predator algorithm and artificial neural networks. Machines 2018, 6, 26. [Google Scholar] [CrossRef] [Green Version]
  32. Hamadneh, N.; Tilahun, S.; Sathasivam, S.; Ong, H. Prey-predator algorithm as a new optimization technique using in radial basis function neural networks. Res. J. Appl. Sci. 2013, 8, 383–387. [Google Scholar]
  33. Ong, H.C.; Tilahun, S.L.; Lee, W.S.; Ngnotchouye, J.M.T. Comparative study of prey predator algorithm and firefly algorithm. Intell. Autom. Soft Comput. 2017, 1–8. [Google Scholar] [CrossRef]
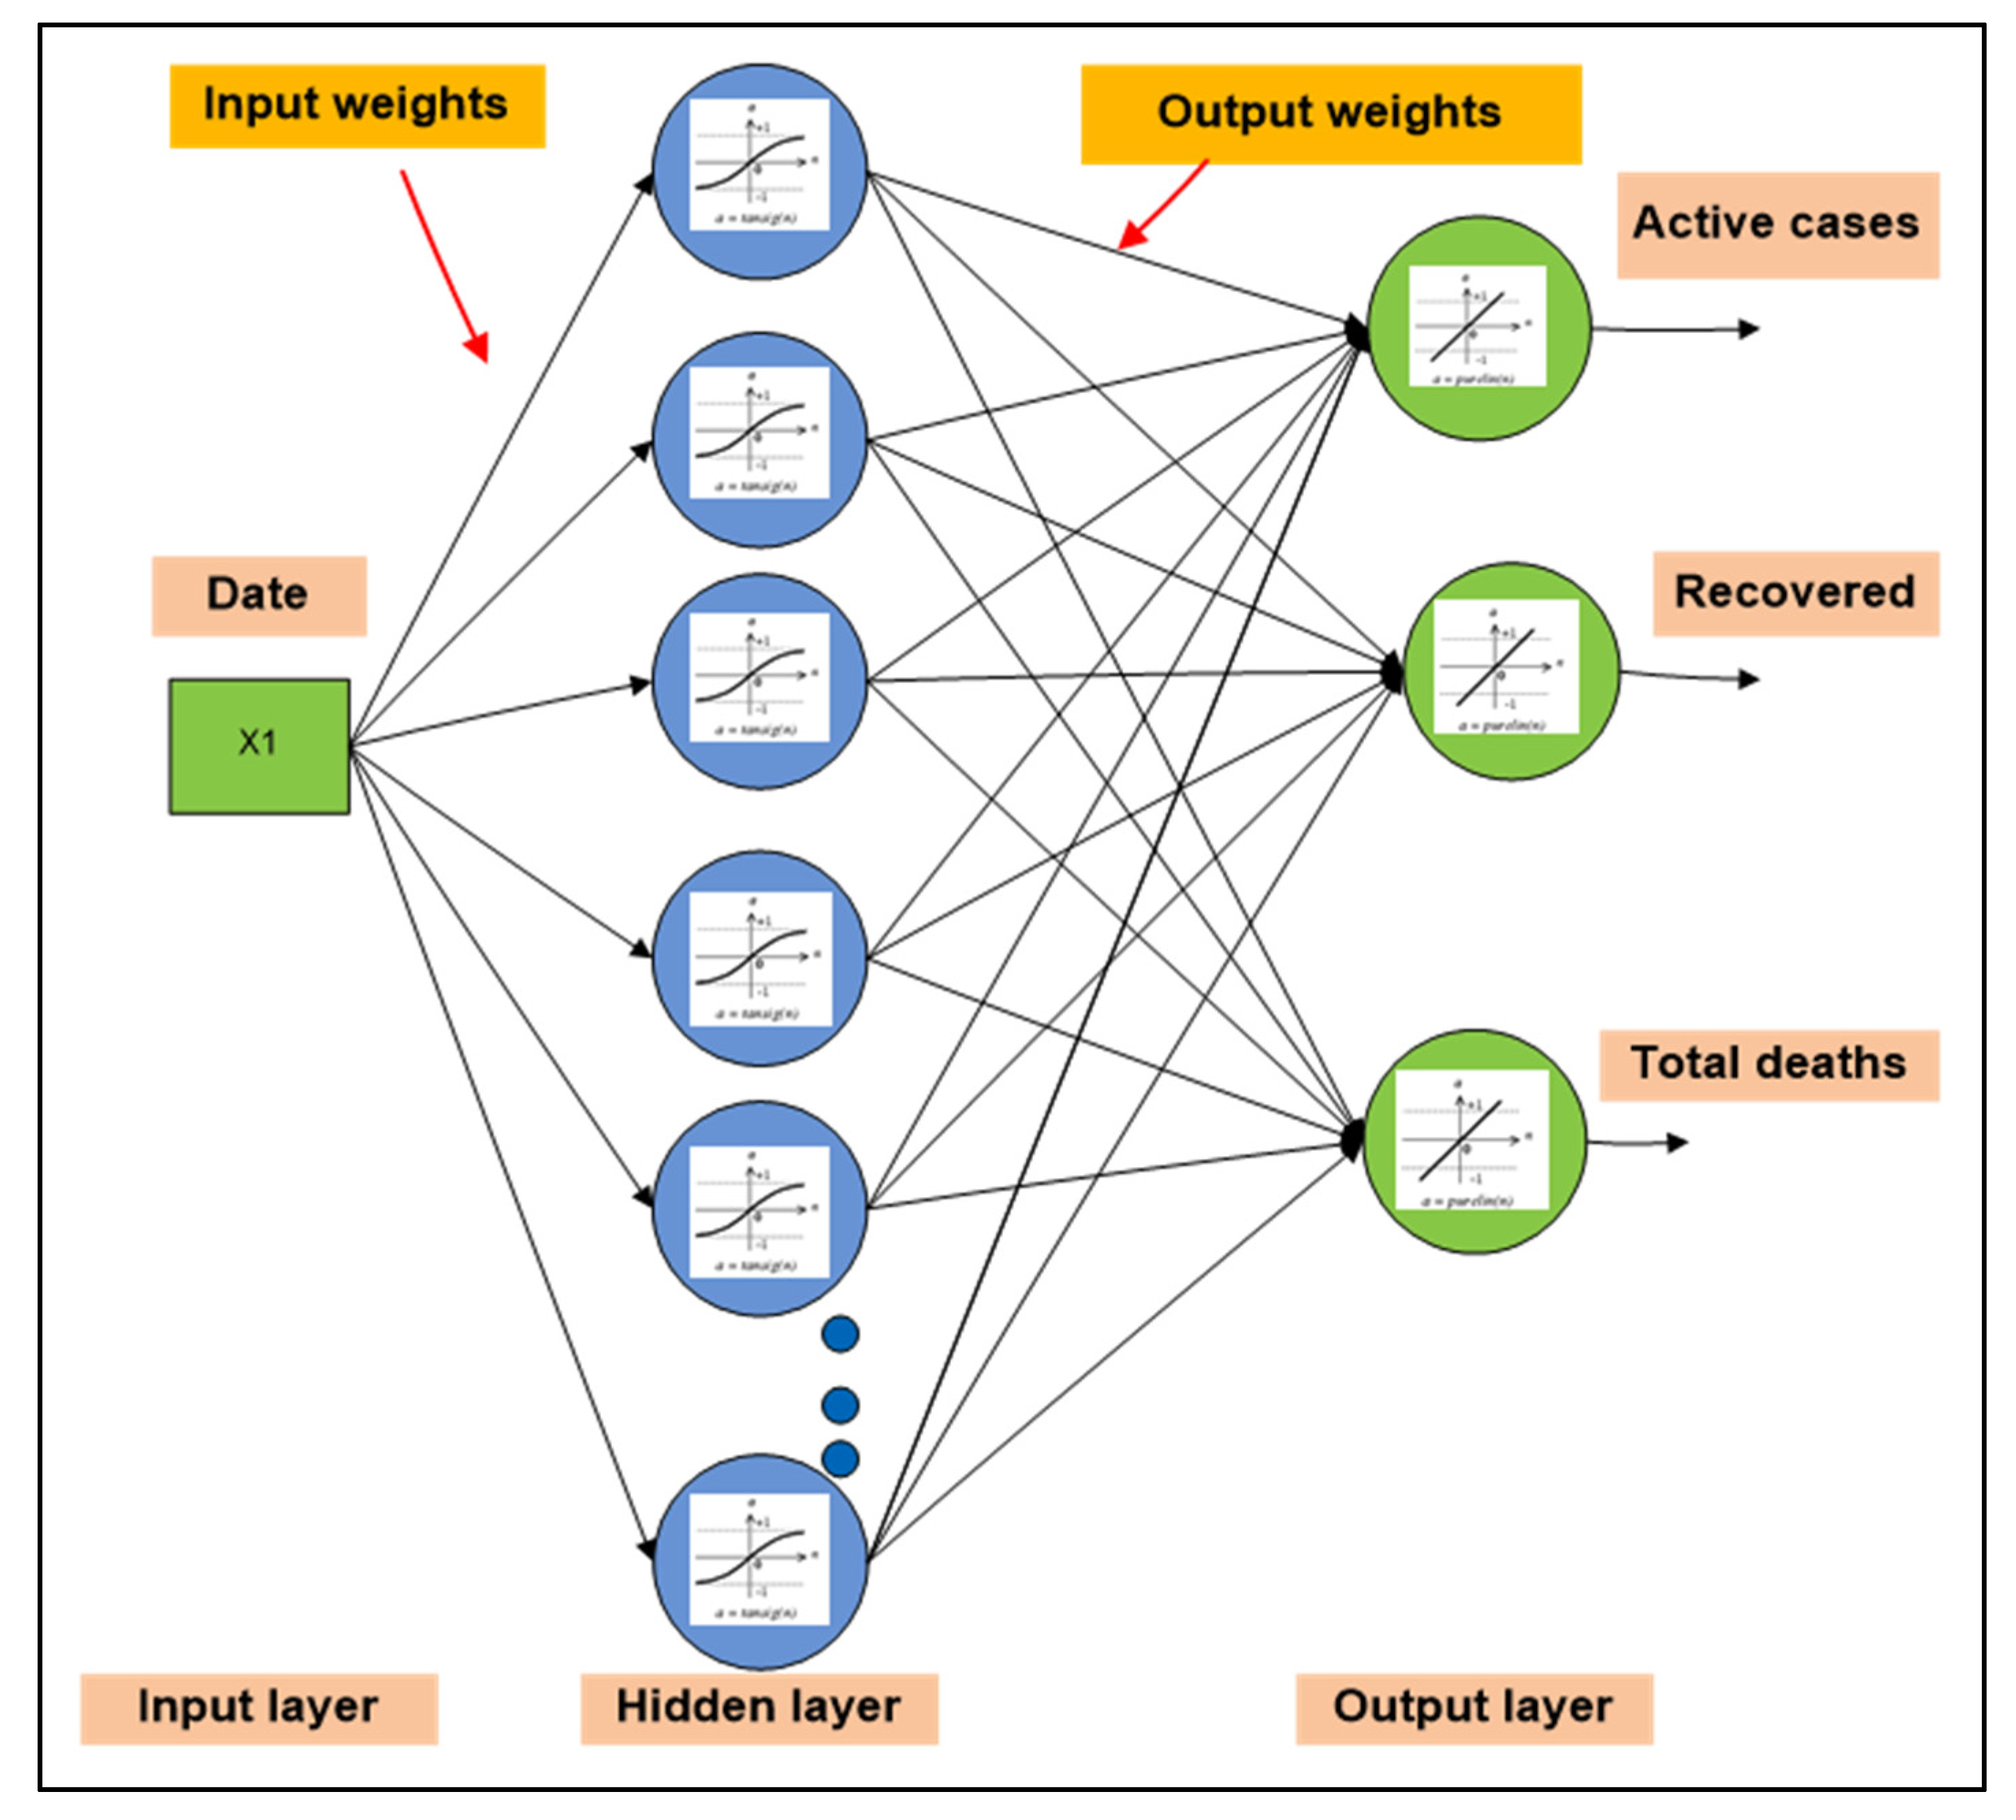
Figure 1. The Structure of the MLPNN that have used for both models (Brazil artificial neural network (ANN) model and Mexico ANN model).
Mathematics 09 00180 g001
Figure 2. Training process of using prey predator algorithm (PPA) for both MLPNN models (PPA-BMLPNN and PPA-MMLPNN).
Mathematics 09 00180 g002
Figure 3. The training data and predicted data of COVID-19 infected people in Brazil.
Mathematics 09 00180 g003
Figure 4. The training data and predicted data of COVID-19 recovered people in Brazil.
Mathematics 09 00180 g004
Figure 5. The training data and predicted data of COVID-19 deaths in Brazil.
Mathematics 09 00180 g005
Figure 6. The correlations coefficients and the linear regression equations between the testing data of (infected, recovered and deaths) and PPA-BMLPNN model values for Brazil.
Mathematics 09 00180 g006aMathematics 09 00180 g006b
Figure 7. The training data and predicted data of COVID-19 infected people in Mexico.
Mathematics 09 00180 g007
Figure 8. The training data and predicted data of COVID-19 recovered people in Mexico.
Mathematics 09 00180 g008
Figure 9. The training data and predicted data of COVID-19 recovered people in Mexico.
Mathematics 09 00180 g009
Figure 10. The correlation coefficients and the linear regression equations between the testing data of (infected, recovered and deaths) and PPA-BMLPNN model values for Mexico.
Mathematics 09 00180 g010aMathematics 09 00180 g010b
Table 1. Data durations for Brazil and Mexico [23,24].
BrazilMexico
From DateTo DateFrom DateTo Date
Infections (active cases) 13-March-202017-December-202019-March-20206-December-2020
Recoveries20-April-202025-December-202013-May-202017-January-2021
Deaths10-April-202015-December-20207-April-202012-December-2020
Publisher’s Note: MDPI stays neutral with regard to jurisdictional claims in published maps and institutional affiliations.