Article

Multiple-Criteria Decision Analysis Using TOPSIS and WSA Method for Quality of Life: The Case of Slovakia Regions

by
Jana Coronicova Hurajova
1 and
Zuzana Hajduova
2,*
1
Faculty of Business Economy with seat in Košice, University of Economics in Bratislava, Tajovského 13, 041 30 Košice, Slovakia
2
Faculty of Business Management, University of Economics in Bratislava, Dolnozemská Cesta 1/b, 852 35 Bratislava 5, Slovakia
*
Author to whom correspondence should be addressed.
Mathematics 2021, 9(19), 2440; https://doi.org/10.3390/math9192440
Submission received: 8 September 2021 / Revised: 22 September 2021 / Accepted: 27 September 2021 / Published: 1 October 2021

Abstract

:
Quality of life can be expressed as a highly subjective measure of happiness, which is an important part of many financial and non-financial decisions. The issue of quality of life, namely its quantification, is a current topic, evidenced by a number of literary sources in both foreign and domestic literature. The paper deals with this issue in the conditions of the Slovak Republic and studies the quality of life for each region of Slovakia with respect to the given indicators. In this paper, we deal with the use of the methods of multi-criteria analysis in evaluating the quality of life in Slovakia. The aim of this paper is to highlight that it is important to monitor the level of quality of life at the regional level and that one of the indicators influencing the quality of life in the region may be its location in relation to neighboring countries.

1. Introduction

Economic growth brings millions to tens of millions of people out of poverty every year. In order to control this growth and try to manage it, its theoretical definition and determination is essential. At present, however, it is no longer enough to focus on economic growth, but it is necessary to focus on a much more complex multidimensional phenomenon such as the quality of life of the population [1,2]. The increasing need for a detailed analysis of this issue, not only at the highest inter-national level, but especially at smaller levels, such as the regions, stimulates the quality of life of the populations of the regions in this work [3,4]. These are regions with significantly similar requirements for measuring and determining the quality of life as a result of the strong globalization in recent years and membership of the European Union, as well as their common history, a relative culture or the geographical point of view itself, since these are neighboring national bodies located in the center of Europe [5] At the end of the 20th century, an enormous increase in research in the field began, resulting in an increasingly better and more precise definition of quality of life determinants [6,7]. The main differences stem mainly from the existence of psychological, social, geographical, ecological, environmental, medical and especially economic perspectives. The last one mentioned, the economic perspective, will be the basic pillar for us in this research. However, according to several authors, quality of life is a multidimensional phenomenon that can be studied using a comprehensive holistic approach or a partial approach [8]. A great sense of importance exists in a consistent definition of quality of life, because only a competitive region can create a sustainable standard of living or a positive contribution to the growth of quality of life [9,10]. Many scientific studies prefer quality of life indexes in regions to compare quality of life, as they bring benefits in inter-score detection of differences and benchmarking [11,12]. Each indicator shall be homogeneously defined and shall ensure consistency of the system under examination in a given area. The issue of environmental sustainability is very important in assessing quality of life, as it should reflect differences in the social and cultural values of local communities, including environmental and community health aspects. Environmental quality is considered to be a very important advantage, especially in developed countries [13]. Identifying a causal link between quality of life in individual countries and economic growth can help implement measures and policies in the various recovery plans of the EU economies, even in today’s period, following the devastating consequences of the Coronavirus pandemic. Based on the results of this work, it is argued that measures must also be directed to areas such as the circular economy, the quality of life of the population, the state of industry and services [14]. It is not enough to focus aid solely on the most affected sectors; recovery plans must also think about other areas. If policies are implemented correctly, the EU can gain a significant competitive advantage [15]. Taking into account the environmental impacts of the pandemic and the economy are two counter-polar areas. While scientists report that there have been record drops in emissions as a result of a pandemic, the economies of individual countries are experiencing the sharpest decline in sales, perhaps even in their entire modern history. However, it is not entirely appropriate to enjoy the reduction of emissions, as this decline was due to a decline in economic output.
The multidimensional concept can be covered by five dimensions: physical well-being, material well-being, social well-being, emotional well-being, development and activity. This model highlights the specific problems of the individual, as well as of the entire population [16,17]. The quality of life is closely linked to the quality of the environment. Environmental efficiency is a globally debated issue [18]. Some studies have shown that countries with positive economic development also have better results in their quality of life policy [19,20]. Policy makers around the world face the challenge of a balance between economic development and environmental welfare, which requires a broad set of energy efficiency and environmental protection measures [21]. According to the World Trade Council for Sustainable Development, eco-efficiency is achieved “by the supply of competitively priced goods and services that meet human needs and bring quality of life, gradually reducing environmental impacts and resource intensity over the life cycle to a level at least in line with Earth’s carrying capacity” [22]. The development of the global economy is accompanied by increasing environmental pollution, which has led to a change in attitudes and the need to promote sustainability. Modern innovation policy is increasingly focused on the environment. Eco-innovation generally has a positive impact on the environmental, economic and social growth of companies that are gradually adopting sustainable development [23,24]. Continuous data are used to assess the most complex socio-economic phenomena using multicritical methods, the source of which is most often public statistics. However, there are complex phenomena in the evaluation, such as quality of life and quality of service, for which questionnaire surveys and order scales are used [25,26]. One effective way to analyze the quality of life is to use a multi-criteria analysis [27,28]. By selecting the suitable methods of multi-criteria analysis, it is possible to process data of a different nature and compare the given alternatives according to the specified criteria, even in the case of ambiguous selection [29,30]. In a previous study, the authors use the Analytical Hierarchical Process (AHP) method to combine a subjective and objective approach to assessing the living conditions of the people of Thessaloniki [31]. Four methods of multi-criteria decision making, namely TOPSIS, SAW, VIKOR and ELECTRE, were used to assess the quality of life in two districts in Tehran [32]. The better health technology with combination of multicriteria analysis can also yield an improved quality of life [33].
A less common approach is to study the quality of life at the regional level, especially if it is considered a smaller country like Slovakia. Nevertheless, there are several papers that point to the importance of this topic. In the authors of a previous study studied the quality of life in the Czech Republic at the level of municipalities and regions [34]. This problem is also of interest in [35], where the quality of life in three regions of Russian Federation were studied. Other papers that dealt with this topic are provided, for example.

2. Materials and Methods

The multi-criteria analysis takes place in two basic steps:
  • To determine the weights of the criteria according to which the alternatives are evaluated.
  • To select the proper decision-making method to evaluate the variants/the alternatives.
It is possible to determine the weights of the criteria in various ways. The choice of an appropriate method depends on whether the preferences of the criteria are known or not, as well as on whether the evaluation is to be objective or subjective and, thus, tailored to the task submitter. In [36] Odu classificates the weighting methods in the following way:
  • subjective methods
    point allocation
    direct rating
    scoring method
    pairwise comparison
    ratio method
    swing method
    delphi method
    nominal group technique
    simple Multi-attribute ranking technique (SMART)
  • objective methods
    entropy method
    criteria importance through inter-criteria
    correlation (CRITIC)
    mean weight
    standard deviation
    statistical variance procedure
    ideal point method
  • integrated methods
    multiplication synthesis
    additive synthesis
    optimal weighting based on sum of squares
    optimal weighting based on relational coefficient of graduation.
In this paper, three methods are considered for determining the weights of the criteria:
  • the method of equal weights, which assigns the same weight to each criterion, namely 1/number of criteria (objective weighting method),
  • the scoring method (subjective weighting method),
  • the entropy method (objective weighting method).

2.1. The Scoring or Ranking Method

The scoring method is based on dividing the certain number of points between the individual criteria according to their importance. Here, it is important to know the preferences of the task submitter. The more important the criterion, the higher the number of points it gets. Subsequently, the given values are divided by the total number of divided points to obtain the normalized criteria weights.

2.2. Entropy Method

The entropy method [37,38] is a method used to determine the weights of the criteria when the preferences of the given criteria are not known or are hard to determinate. The process of the entropy method can be described in the following steps:
  • Construct the criteria matrix Y = y ij created from the input data:
    Y = y 11 y 12   y 1 n y 21 y 22 y 2 n y m 1 y m 2 y m n
    The element y i j of the matrix Y represents the value of the i -th alternative, according to the j -th criterion.
  • Transform the criteria matrix into an auxiliary matrix P = p i j as follows:
    p i j = y i j i = 1 m y i j
  • Calculate the entropy E j for each of the considered criteria as follows:
    E j = 1 l n   m i = 1 m p i j l n   p i j
  • Calculate the weights of the criteria as follows:
    w j = 1 E j n j = 1 n E j ;     j = 1 , 2 , ,   n .  
The second step in multi-criteria analysis is to determine the order of the variants [39,40]. It is important to adapt the selection of the method to the goal pursued as well as to know what type of information is being worked with, i.e., whether the input data are of the cardinal or ordinal nature. For the purposes of this paper, two methods requiring cardinal information were selected, namely the TOPSIS method and the weighted sum method (WSA). Both of these methods are among the most commonly used methods, which was one of the reasons for their choice [41].

2.3. TOPSIS Method

The TOPSIS method uses cardinal information to identify a compromise variant that is as close as possible to the positive-ideal solution and as far away from the negative-ideal solution as possible. If there is a positive-ideal solution and it is possible to achieve it, then the positive-ideal solution and compromise variant match [42]. The positive-ideal solution acquires the best values with respect to all specified criteria and is represented by a vector h 1 ,   h 2 ,   ,   h n . The negative-ideal solution acquires the worst possible values in all criteria and is represented by a vector d 1 ,   d 2 ,   ,   d n , where n indicates the number of criteria that are taken into account in the analysis.
The TOPSIS method can be described in the following steps:
Step 1: Construct the criteria matrix Y =   y i j created from the input data:
Y = y 11 y 12   y 1 n y 21 y 22 y 2 n y m 1 y m 2 y m n
The element y i j of the matrix Y represents the value of the i -th alternative, according to the j -th criterion.
Step 2: Construct the normalized matrix R =   r i j as follows:
r i j = y i j i = 1 m y i j 2   ; i = 1 ,   2 ,   ,   m ;   j = 1 ,   2 ,   ,   n .
Step 3: Construct the weighted normalized matrix Z =   z i j by using the formula:
z i j = w j r i j ;     i = 1 ,   2 ,   ,   m ;   j = 1 ,   2 ,   ,   n .
Step 4: Determine the positive-ideal solution h =   h 1 , h 2 , ,   h n   and the negative-ideal solution d = d 1 , d 2 , ,   d n   , where:
h j = m a x i   z i j ; j = 1 ,   2 ,   ,   n
d j = m i n i   z i j ; j = 1 ,   2 ,   ,   n .
Step 5: Calculate the distance between each alternative and the positive-ideal and the negative-ideal solution as follows:
d i + = j = 1 n z i j h j 2 ;   i = 1 ,   2 ,   ,   m  
d i = j = 1 n z i j d j 2 ;   i = 1 ,   2 ,   ,   m  
Step 6: Calculate the relative indicator of distance for each alternative as follows:
c i = d i d i + + d i ;   i = 1 ,   2 ,   ,   m
Step 7: Finally, the variants are ranked according to the values of the relative indicators (the higher value, the better the alternative).

2.4. Weighted Sum Product Method, WSA

Even with the weighted sum method, it is necessary to compile the criterion matrix Y =   y i j . For each criterion, the best h j and worst d j value is identified. Subsequently, the matrix U =   u i j is created as follows:
u i j = y i j d j h j d j ;     i = 1 , 2 , ,   m ; j = 1 , 2 , ,   n .  
The value of u i j expresses the benefit of the i-th variant with respect to the j-th criterion. Next, the values of the aggregate utility function u V i for each variant V i are determined by using the normalized weights:
u V i = j = 1 n w j u i j .  
The main goal of this paper is to compare the regions of Slovakia based on the level of quality of life. Slovakia is divided into eight regions, which represent the subjects of this analysis. These are the eight regions:
  • BA—Bratislava Region
  • TT—Trnava Region
  • TN—Region of Trenčín
  • NT—Nitra Region
  • ZA—Žilina Region
  • BB—Banská Bystrica Region
  • PO—Prešov Region
  • KE—Košice Region
By the multi-criteria analysis, the regions represent the alternatives that are ranked.
The first four regions of the regions, Bratislava, Trnava, Trenčín and Nitra Regions, are located in the western part of Slovakia. The western part of the country borders with the Czech Republic, Austria and Hungary. Two of these three countries have a higher index of quality of life than Slovakia. The Žilina and Banská Bystrica Regions represent the central part of Slovakia, which borders with Poland in the north and with Hungary in the south. Both Poland and Hungary have a worse position, according to the Quality of Life Index, than Slovakia. The Prešov and Košice regions represent eastern Slovakia and, in addition to Poland and Hungary, also border with Ukraine, i.e., countries that are on a lower rung, according to the Quality of Life Index, than Slovakia [43].
In order to determine the ranking of the regions according to the quality of life, the following indices were chosen:
  • K1: GDP per capita (€)—GDP per capita is one of the most used indicators of economic performance in the state and in the region;
  • K2: unemployment rate (%)—the registered unemployment rate is the main indicator of the situation in the labor market. Unemployed people tend to have lower incomes, which usually have a significant impact on their quality of life;
  • K3: average life expectancy at birth (age)—this expresses the average length of years in which an individual is most likely to live. This indicator mainly affects the state of the economy, health care, the environment and others;
  • K4: gross wage (€)—in fulfilling their tasks in relation to the society, households try to ensure their needs and development and, thus, ensure a certain quality of life;
  • K5: economically active population (in thousands)—activities in the production of tangible assets or in the provision of services provided for the purpose of obtaining a means of subsistence;
  • K6: at-risk-of-poverty rate (%)—the poverty line is the minimum level of income needed to achieve an adequate standard of living in a given country or region;
  • K7: average disposable equivalent household income (€)—average household income is related to the average gross monthly wage. The higher the income, the higher the possibility of consumption and a better quality of life;
  • K8: number of crimes—crime is increasing with high economic activity. Crimes are also committed in places with the highest employment rates;
  • K9: real estate price per m2 (€)—apartment prices push up the lack of real estate for sale and also high purchasing power. However, this indicator is closely related to an individual’s income. If income is low, people cannot afford to buy real estate.
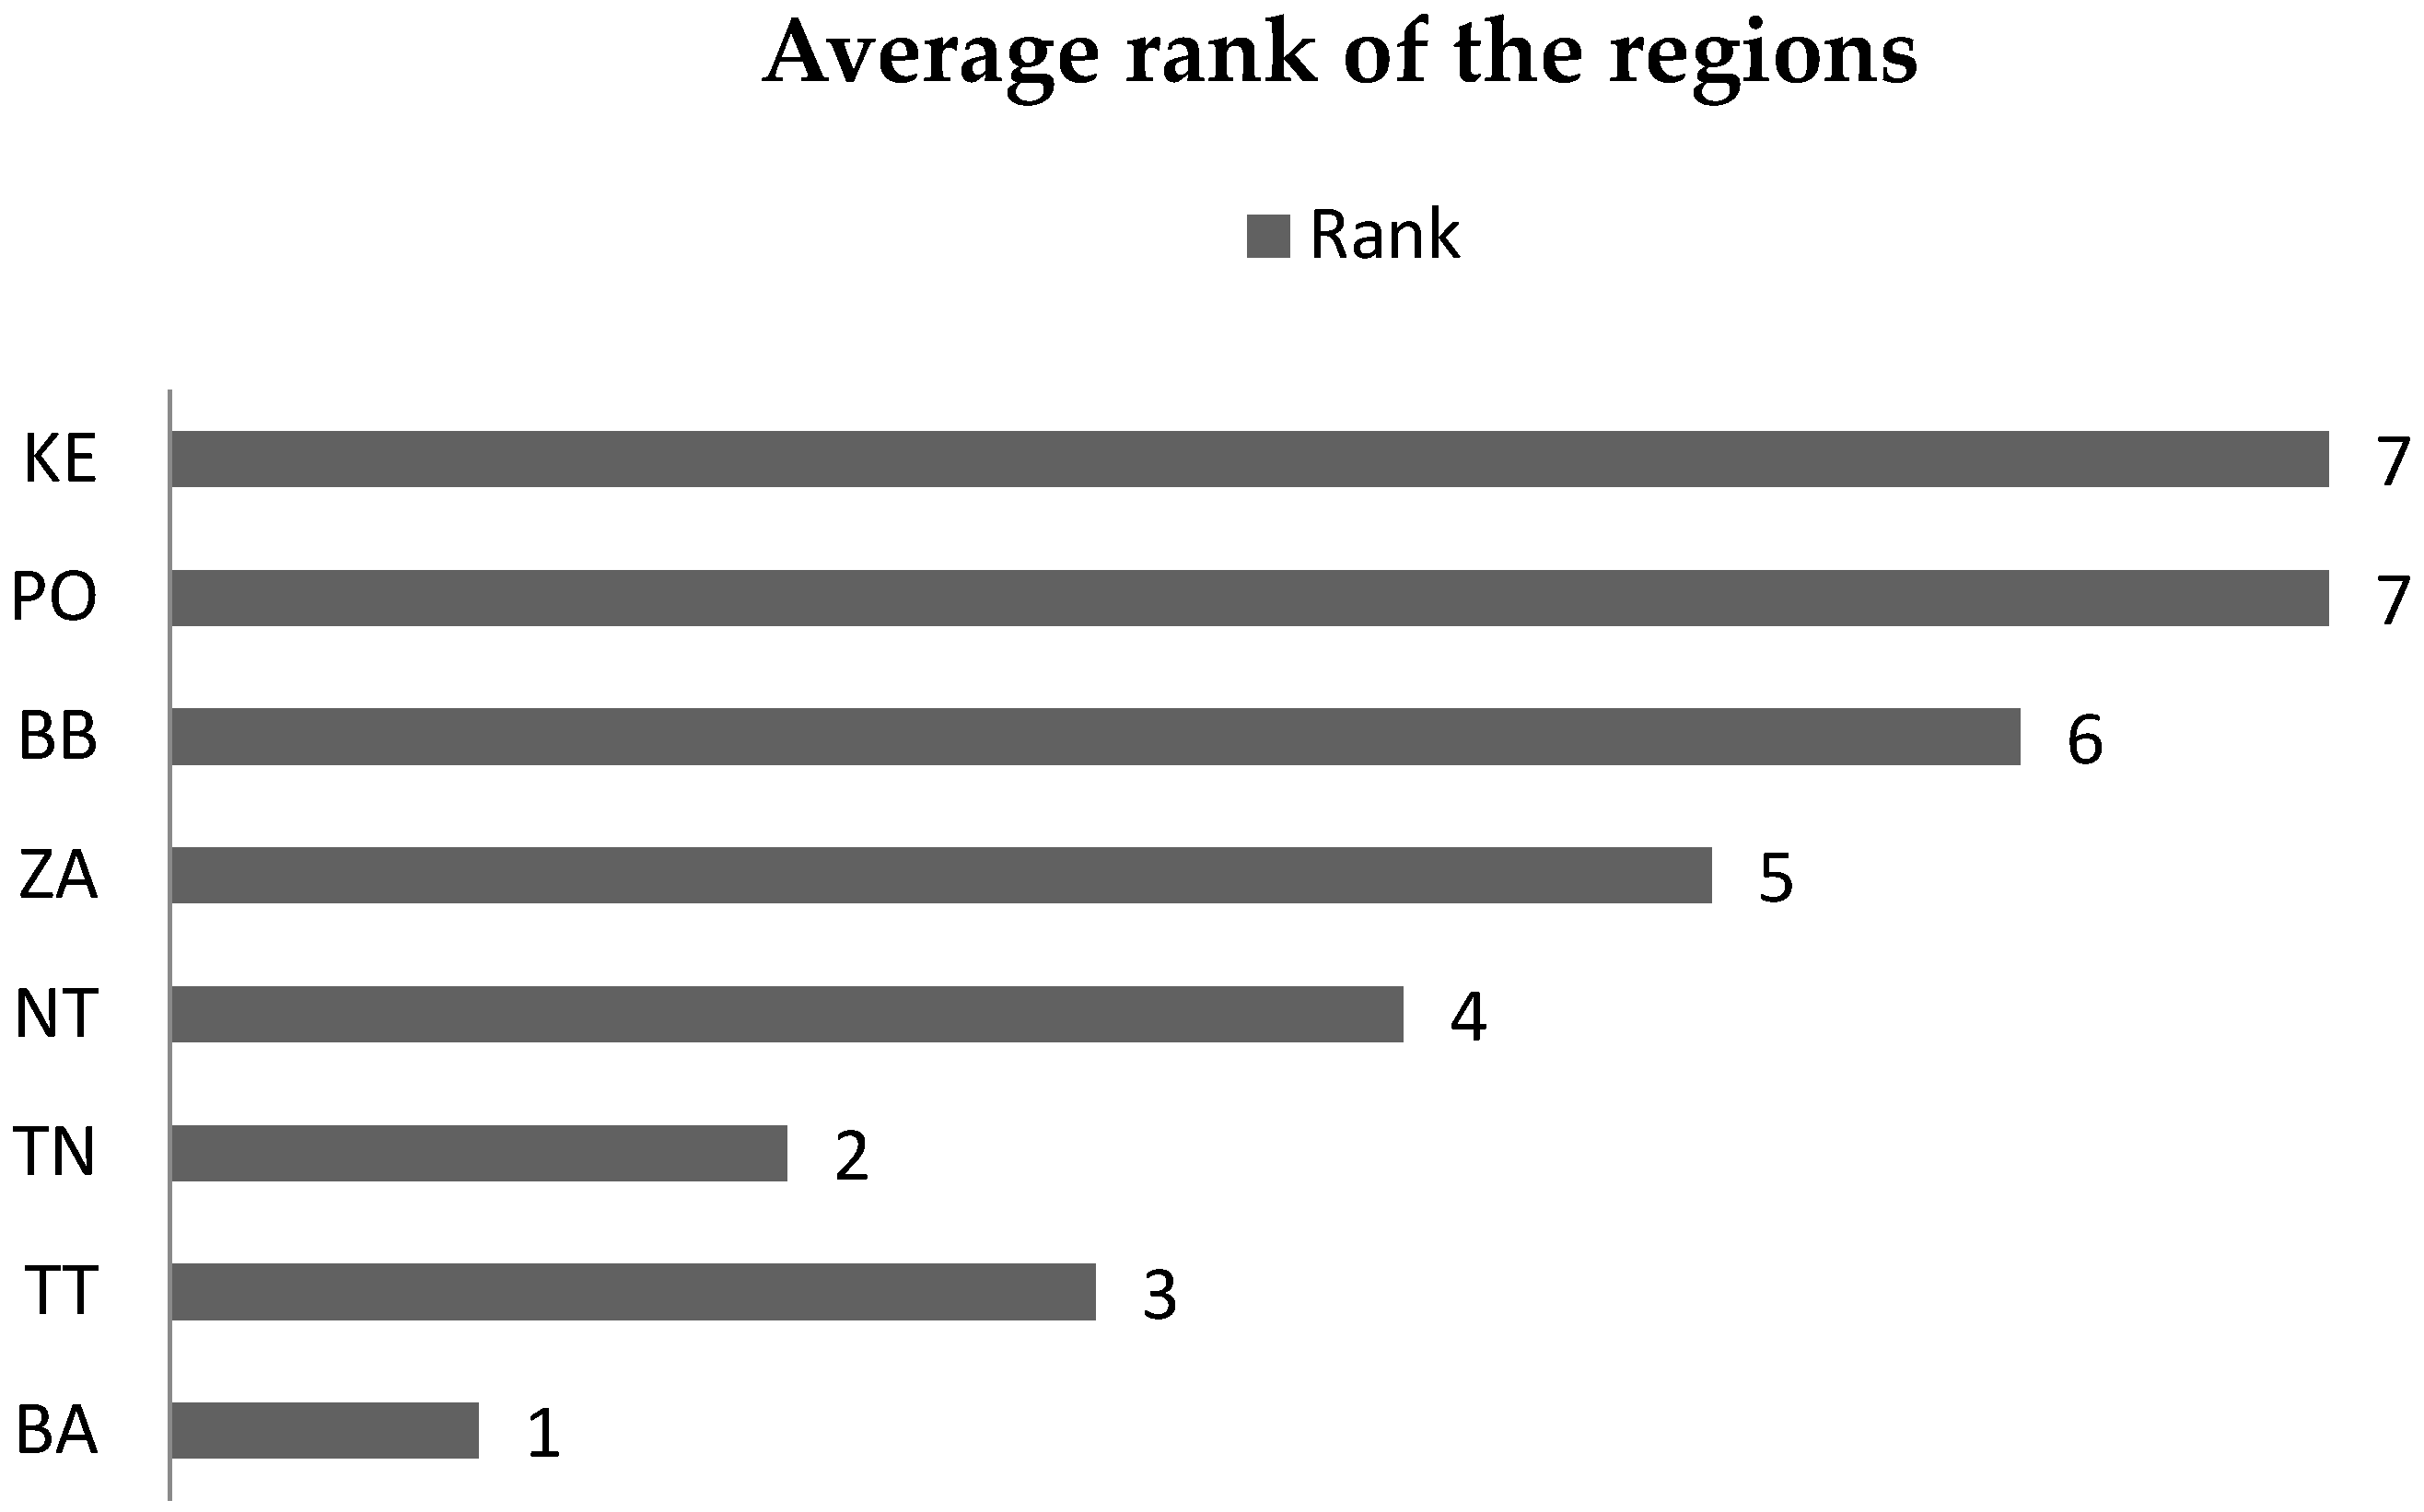
These nine indicators represent nine criteria on which the multi-criteria analysis of the given districts was based and carried out. The third indicator, K3, i.e., the average life expectancy at birth, was different for men and women for all districts. Therefore, in the analysis itself, criterion K3 represents the arithmetic mean of these two values, indicated in Table 1 as K3 m and K3 w.

3. Results

The evaluation and the comparison of the quality of life in a given group of countries according to the various indices is a very frequent topic for many papers. On the other side, such an analysis is less common at the regional level. This is especially true if a smaller country like Slovakia is considered. In this part of the paper, the quality of life in eight regions of Slovakia is analyzed according to the nine criteria that are described in the sections above; see Table 1.
Multi-criteria analysis methods were used to process the input data. The first step after collecting the input data was to assign weights to the given criteria. To ensure the most objective evaluation possible, three methods of assigning weights to the given criteria were chosen for this analysis. Method I was the method of equal weight; in this case, each criteria had the value 1/9, and the method II was the scoring method, and the method III was the entropy method. The method of equal weights and the method of entropy depend only on the input data. The scoring method is more subjective. Therefore, the analysis itself was preceded by a survey in the form of a questionnaire in order to be able to use this scoring method without the subjective involvement of the authors of the paper. The questionnaire was completed by 100 people aged 18 to 45 years, living in one of the regions of Slovakia, with the equal representation of both sexes. The age of the participating respondents was determined in a targeted manner, as it was assumed that such a group of people has the greatest propensity to move to another region for a better job or study or just a better quality of live. Each of the addressed people was asked to rank the given criteria according to importance on the basis of their own preferences and to divide 100 points between the given criteria. The collected data were used to determine the weights in the scoring method; see Table 2.
After the weights of the individual criteria were determined, the two methods were used to rank the alternatives. The first method used to evaluate the regions was the TOPSIS method; see Table 3. The order of the given regions differed only slightly, and their rank depended on the method of determining the weights of the given criteria. On the other side, it is easy to see that the quality of life depended on to the location of the region. The regions belonging to western Slovakia were placed at the forefront; regions of central Slovakia were located somewhere in the middle, while Košice Region and Prešov Region were at the tail of the table. The only exception was the position of the Banská Bystrica region when the entropy method was used. In this case, the Banská Bystrica region ranked first. The reason is probably the ninth criterion, i.e., the price of the property per m2, which shuffled the order in this case.
The second method used for this analysis was the WSA method. In this case the analysis was also performed for all three cases of weight determining as it was considered for the TOPSIS; see Table 4. The first two methods of the weight determining in combination with the WSA method led to identical results as before. The importance of the location of the region within Slovakia was obvious. The further west the region was located, the higher the quality of life based on the observed indices. This division of the regions even was not affected by the fact that in two regions of the eastern Slovakia lie the cities of Košice and Prešov, which have the largest population after Bratislava. The entropy method in combination with the WSA method provided just a slightly different order of the regions, but it ultimately confirmed the previous conclusion.
Based on the obtained results, the final order of the regions, with respect to the quality of life, was determined as the arithmetic average of all six results obtained by both methods, TOPSIS and WSA. The region with the highest quality of life was the Bratislava region, where the capital city of Slovakia, Bratislava, lies. It was followed by the Trnava, Trenčín and Nitra regions, i.e., the regions of western Slovakia. The fifth and sixth places were occupied by the regions of central Slovakia. According to the given indicators, eastern Slovakia and its two regions ranked in the last two places according to the level of quality of life; see Figure 1.

4. Discussion

In this paper, the quality of life in Slovakia in combination with a multicriteria analysis was studied. To ensure an objective evaluation, three methods were chosen to determine the weights of the individual criteria, on which the evaluation was based and performed. The determination of weights is a very important step in multicriteria analysis, as it can significantly affect the order of given alternatives. For the comparison of alternatives (in this case, the alternatives were the regions), two methods, TOPSIS and WSA, were chosen so that the resulting order best reflected the quality of life in the individual regions of Slovakia [44,45].
Slovakia does not resemble the large countries in terms of population or size. Therefore, it could be assumed that the quality of life in the different regions of this country does not differ much. The same assumption could also hold for the individual indicators of quality of life. An interesting finding of the multicriteria analysis performed in this paper is that the quality of life in the regions was related to their location. Those regions that lay in the western part of the country had a higher level of quality of life than the regions that were located in the middle or east of the country. These are the Bratislava Region, Trnava Region, Trenčín Region and Nitra Region. One of the reasons may be the fact that in the west, Slovakia borders with countries that are, within in the ranking of countries compiled according to the quality of life, higher than the countries with which Slovakia borders, for example, in the east. The resulting order of the analyzed regions was even not affected by the fact that the second and third largest cities by population, Košice and Prešov, are located in two regions of eastern Slovakia, namely the Košice region and Prešov region, which took the last two places, i.e., the 6th and the 8th place, respectively, in the multi-criteria analysis performed in the results part of this paper.
This paper dealt with a multi-criteria analysis of quality of life in the regions of Slovakia in 2019. It would be interesting to study the topic over a longer period of time, as well as whether the COVID-19 pandemic and related measures, such as closed shops and restaurants, distance learning, working from home or limited travel, affected the ranking of individual regions or not.

5. Conclusions

Quality of life is a concept that has several definitions and interpretations. There are many studies that have addressed this topic in different ways. For the purposes of this work, a multi-criteria analysis was chosen. This method of research has a wide application. It can be used not only in the combination with the quality of life, but also in the other areas related not only to economics. The aim of this work was to evaluate the quality of life of the regions of Slovakia on the basis of nine criteria.
Two methods of mutli-criteria analysis, TOPSIS and WSA, represent how the eight regions of Slovakia, on the basis of nine important indicators of the quality of life, were ranked. It was observed that one of the factors influencing the quality of life in Slovakia is the location of the region. The further west the region, the higher the quality of life was. On the contrary, the regions in the east of the country were placed on the last rungs of both methods used. Large differences in quality of life between regions can encourage the relocation of people to work or study and, thus, deepen regional disparities. An important area is the protection and creation of the environment, whether at a regional or national level, in terms of the country in question or internationally, in terms of the world economy. Other possible avenues for further research are the assessment of the innovation efficiency of regions with quality of life indices, as some research shows a high correlation between these indicators.

Author Contributions

Conceptualization, J.C.H.; Data curation, Z.H.; Formal analysis, J.C.H. and Z.H.; Project administration, Z.H.; Software, J.C.H.; Visualization, Z.H. and J.C.H.; Writing—original draft, Z.H. and J.C.H.; Writing—review & editing, Z.H. and J.C.H. All authors have read and agreed to the published version of the manuscript.

Funding

This article has been supported by funds of the project VEGA No. 1/0240/20.

Institutional Review Board Statement

Not applicable.

Informed Consent Statement

Not applicable.

Data Availability Statement

Publicly available datasets were analyzed in this study. This data can be found here: https://ec.europa.eu/eurostat/databrowser/view/TEC00114/bookmark/table?bookmarkId=388837b6-18d3-422f-8339-fa23f0378454 (accessed on 27 September 2021).

Conflicts of Interest

The authors declare no conflict of interest.

References

  1. Almeida, T.A.D.N.; Garcia-Sanchez, I.-M. Sociopolitical and economic elements to explain the environmental performance of countries. Environ. Sci. Pollut. Res. 2016, 24, 3006–3026. [Google Scholar] [CrossRef]
  2. Andráško, I. Quality of Life: An Introduction to the Concept; Masarykova Univerzita: Brno, Czech Republic, 2013. [Google Scholar]
  3. Veenhoven, R. Quality-of-Life in the Modern Society Measured with Happy Life Years. Veenhoven, R. Quality-of-Life in the Modern Society Measured with Happy Life Years1. Happiness Public Policy 2006, 19–44. [Google Scholar] [CrossRef] [Green Version]
  4. Mareš, J. Kvalita Života u Dětí a Dospívajících; MSD: Brno, Czech Republic, 2006. [Google Scholar]
  5. Liu, B.; Matsushima, J. Annual changes in energy quality and quality of life: A cross-national study of 29 OECD and 37 non-OECD countries. Energy Rep. 2019, 5, 1354–1364. [Google Scholar] [CrossRef]
  6. Bravo, G. The Human Sustainable Development Index: New calculations and a first critical analysis. Ecol. Indic. 2014, 37, 145–150. [Google Scholar] [CrossRef]
  7. Koišová, E.; Grmanová, E.; Škrovánková, K.; Kostrová, J. Competitiveness of Regions in the Visegrad Group Countries. Eng. Econ. 2019, 30, 203–210. [Google Scholar] [CrossRef]
  8. Wolsink, M. Contested environmental policy infrastructure: Socio-political acceptance of renewable energy, water, and waste facilities. Environ. Impact Assess. Rev. 2010, 30, 302–311. [Google Scholar] [CrossRef] [Green Version]
  9. Duman, Y.S.; Kasman, A. Environmental technical efficiency in EU member and candidate countries: A parametric hyperbolic distance function approach. Energy 2018, 147, 297–307. [Google Scholar] [CrossRef]
  10. Bassi, S.A.; Christensen, T.H.; Damgaard, A. Environmental performance of household waste management in Europe—An example of 7 countries. Waste Manag. 2017, 69, 545–557. [Google Scholar] [CrossRef] [PubMed] [Green Version]
  11. Murray, A.; Skene, K.; Haynes, K. The Circular Economy: An Interdisciplinary Exploration of the Concept and Application in a Global Context. J. Bus. Ethics 2015, 140, 369–380. [Google Scholar] [CrossRef] [Green Version]
  12. Javidikia, M.; Sadeghifar, M.; Songmene, V.; Jahazi, M. Effect of turning environments and parameters on surface integrity of AA6061-T6: Experimental analysis, predictive modeling, and multi-criteria optimization. Int. J. Adv. Manuf. Technol. 2020, 110, 2669–2683. [Google Scholar] [CrossRef]
  13. Sergi, S.B.; D’Aleo, V.; Arbolino, R.; Carlucci, F.; Barilla, D.; Ioppolo, G. Evaluation of the Italian transport infrastructures: A technical and economic efficiency analysis. Land Use Policy 2020, 99, 104961. [Google Scholar] [CrossRef]
  14. Sachs, J. The Age of Sustainable Development; Columbia University Press: New York, NY, USA, 2015. [Google Scholar]
  15. Jin, H.; Qian, X.; Chin, T.; Zhang, H. A Global Assessment of Sustainable Development Based on Modification of the Human Development Index via the Entropy Method. Sustainability 2020, 12, 3251. [Google Scholar] [CrossRef] [Green Version]
  16. Bottero, M.; Dell’Anna, F.; Morgese, V. Evaluating the Transition Towards Post-Carbon Cities: A Literature Review. Sustainability 2021, 13, 567. [Google Scholar] [CrossRef]
  17. Abu, R.; Aziz, M.A.A.; Sapuan, N.; Abdullah, T.A.T.; Hassan, C.H.C.; Noor, Z.Z. Multi-criteria decision approach with stakeholders for food waste management. IOP Conf. Ser. Earth Environ. Sci. 2021, 756, 012005. [Google Scholar] [CrossRef]
  18. Madaleno, M.; Moutinho, V.; Robaina, M. Economic and Environmental Assessment: EU Cross-country Efficiency Ranking Analysis. Energy Procedia 2016, 106, 134–154. [Google Scholar] [CrossRef]
  19. Liu, X.; Guo, P.; Guo, S. Assessing the eco-efficiency of a circular economy system in China’s coal mining areas: Emergy and data envelopment analysis. J. Clean. Prod. 2018, 206, 1101–1109. [Google Scholar] [CrossRef]
  20. Lacko, R.; Hajduová, Z. Determinants of Environmental Efficiency of the EU Countries Using Two-Step DEA Approach. Sustainability 2018, 10, 3525. [Google Scholar] [CrossRef] [Green Version]
  21. Lee, P.; Park, Y.-J. Eco-Efficiency Evaluation Considering Environmental Stringency. Sustainability 2017, 9, 661. [Google Scholar] [CrossRef] [Green Version]
  22. Chen, Y.; Lu, H.; Li, J.; Yang, Y.; Xia, J. Multi-criteria decision making and fairness evaluation of water ecological carrying capacity for inter-regional green development. Environ. Sci. Pollut. Res. 2020, 28, 6470–6490. [Google Scholar] [CrossRef]
  23. Mishra, R. A hybrid multi-criteria decision-making approach to assess the enablers of manufacturing flexibility under fuzzy environment. Int. J. Qual. Reliab. Manag. 2020, 38, 955–985. [Google Scholar] [CrossRef]
  24. Roszkowska, E.; Kusterka-Jefmańska, M.; Jefmański, B. Intuitionistic Fuzzy TOPSIS as a Method for Assessing Socioeconomic Phenomena on the Basis of Survey Data. Entropy 2021, 23, 563. [Google Scholar] [CrossRef]
  25. Hajduk, S. Multi-Criteria Analysis of Smart Cities on the Example of the Polish Cities. Resources 2021, 10, 44. [Google Scholar] [CrossRef]
  26. Arechavala, N.S.; Espina, P.Z.; Trapero, B.P.; Somarriba, N. The Economic Crisis and its Effects on the Quality of Life in the European Union. Soc. Indic. Res. 2014, 120, 323–343. [Google Scholar] [CrossRef]
  27. Băndoi, A.; Jianu, E.; Enescu, M.; Axinte, G.; Tudor, S.; Firoiu, D. The Relationship between Development of Tourism, Quality of Life and Sustainable Performance in EU Countries. Sustainability 2020, 12, 1628. [Google Scholar] [CrossRef] [Green Version]
  28. Gryshova, I.; Kyzym, M.; Khaustova, V.; Korneev, V.; Kramarev, H. Assessment of the Industrial Structure and its Influence on Sustainable Economic Development and Quality of Life of the Population of Different World Countries. Sustainability 2020, 12, 2072. [Google Scholar] [CrossRef] [Green Version]
  29. Majeed, M.T. Quality of Life and Globalization: Evidence from Islamic Countries. Appl. Res. Qual. Life 2017, 13, 709–725. [Google Scholar] [CrossRef]
  30. Slottje, D. Measuring The Quality Of Life Across Countries. Rev. Econs. Stat. 2019. [Google Scholar] [CrossRef]
  31. Feneri, A.-M.; Vagiona, D.; Karanikolas, N. Multi-Criteria Decision Making to Measure Quality of Life: An Integrated Approach for Implementation in the Urban Area of Thessaloniki, Greece. Appl. Res. Qual. Life 2014, 10, 573–587. [Google Scholar] [CrossRef]
  32. Vakilipour, S.; Sadeghi-Niaraki, A.; Ghodousi, M.; Choi, S.-M. Comparison between Multi-Criteria Decision-Making Methods and Evaluating the Quality of Life at Different Spatial Levels. Sustainability 2021, 13, 4067. [Google Scholar] [CrossRef]
  33. Baltussen, R.; Marsh, K.; Thokala, P.; Diaby, V.; Castro, H.; Cleemput, I.; Garau, M.; Iskrov, G.; Olyaeemanesh, A.; Mirelman, A.; et al. Multicriteria Decision Analysis to Support Health Technology Assessment Agencies: Benefits, Limitations, and the Way Forward. Value Health. 2019, 22, 1283–1288. [Google Scholar] [CrossRef] [Green Version]
  34. Murgaš, F.; Klobučník, M. Municipalities and Regions as Good Places to Live: Index of Quality of Life in the Czech Republic. Appl. Res. Qual. Life 2014, 11, 553–570. [Google Scholar] [CrossRef]
  35. Pechenaya, L.; Magomedov, M.; Stroev, V.; Karabanova, O.; Domarev, I. Comparative Assessment of Quality and Life Standards in Russia and Abroad. Russ. Conf. Digit. Econ. Knowl. Manag. 2020, 434–437. [Google Scholar] [CrossRef]
  36. Odu, G. Weighting methods for multi-criteria decision making technique. J. Appl. Sci. Environ. Manag. 2019, 23, 1449. [Google Scholar] [CrossRef] [Green Version]
  37. Wang, M.; Zhao, X.; Gong, Q.; Ji, Z. Measurement of Regional Green Economy Sustainable Development Ability Based on Entropy Weight-Topsis-Coupling Coordination Degree—A Case Study in Shandong Province, China. Sustainability 2019, 11, 280. [Google Scholar] [CrossRef] [Green Version]
  38. Ardielli, E. Use of TOPSIS Method for Assessing of Good Governance in European Union Countries. Rev. Econ. Perspect. 2019, 19, 211–231. [Google Scholar] [CrossRef] [Green Version]
  39. Triantaphyllou, E. Multi-criteria Decision Making Methods: A Comparative Study; Springer: Boston, MA, USA, 2000. [Google Scholar] [CrossRef]
  40. Yoon, K.; Hwang, C.-L. Multiple Attribute Decision Making; Sage Publications: Thousand Oaks, CA, USA, 1995. [Google Scholar] [CrossRef]
  41. Valaskova, K.; Kramarova, K.; Bartosova, V. Multi Criteria Models Used in Slovak Consumer Market for Business Decision Making. Procedia Econ. Finance 2015, 26, 174–182. [Google Scholar] [CrossRef] [Green Version]
  42. Rahim, R.; Supiyandi, S.; Siahaan, A.P.U.; Listyorini, T.; Utomo, A.P.; Triyanto, W.A.; Irawan, Y.; Aisyah, S.; Khairani, M.; Sundari, S.; et al. TOPSIS Method Application for Decision Support System in Internal Control for Selecting Best Employees. J. Phys. Conf. Ser. 2018, 1028, 012052. [Google Scholar] [CrossRef] [Green Version]
  43. Eurostat. Available online: https://ec.europa.eu/eurostat/databrowser/view/TEC00114/bookmark/table?bookmarkId=388837b6-18d3-422f-8339-fa23f0378454 (accessed on 27 September 2021).
  44. Stofkova, Z.; Seemann, P.; Binasova, V. Evaluation of quality of life in the period of globalization. SHS Web Conf. 2021. [Google Scholar] [CrossRef]
  45. Mohit, M.A. Analysis of Malaysian Regional Quality-of-Life and its Policy Implications. Asian J. Qual. Life 2018, 3, 11. [Google Scholar] [CrossRef] [Green Version]
Figure 1. Average rank of the Slovak regions. Source: own processing.
Mathematics 09 02440 g001
Table 1. Criteria matrix.
2019K1K2K3 wK3 mK4K5K6K7K8K9
BA38,836.002.8381.9275.621641.00359.704.30860.9210,064.002102.00
TT17,917.482.6380.7574.721197.00288.7010.70737.726173.001138.00
TN13,741.783.2081.5374.761180.00296.505.10732.745033.00944.00
NT13,768.712.9380.3173.441122.00342.306.60732.956793.00877.00
ZA14,078.553.9681.2273.551174.00346.1012.10691.886983.001123.00
BB12,064.186.6980.4673.221108.00330.9019.30664.357280.00825.00
PO10,388.558.1981.2374.111024.00401.6017.50627.087153.001034.00
KE13,352.957.5780.4773.471168.00375.5016.60669.819156.001036.00
MAXMINMAXMAXMAXMINMAXMINMIN
Source: own processing.
Table 2. Criteria weights.
Criteria WeightsK1K2K3K4K5K6K7K8K9
Method I0.111110.111110.111110.111110.111110.111110.111110.111110.11111
Method II0.149300.134300.089600.089600.119400.074600.104500.126900.05970
Method III0.097260.262660.000070.009100.005040.293660.003950.198290.12996
Source: own processing.
Table 3. TOPSIS method.
Method IRankMethod IIRankMethod IIIRank
TOPSIS c i c i c i
BA0.89989810.4990930.4999882
TT0.16360520.50350220.4965325
TN0.11697930.547410.4965484
NT0.07534450.49118340.4987193
ZA0.07628740.48712750.4915947
BB0.04673870.46762560.5008511
PO0.03794780.45489970.4825548
KE0.0522160.44916380.4925726
Source: own processing.
Table 4. WSA method.
WSAMethod IRankMethod IIRankMethod IIIRank
u i u i u i
BA0.84365610.80175710.6604294
TT0.55756930.5148530.7126933
TN0.67133820.59329920.8458231
NT0.52210940.47417340.7678992
ZA0.49787850.4552450.5803585
BB0.29383780.2567880.3200346
PO0.38635760.33613460.2637347
KE0.3110570.26674370.2432868
Source: own processing.
Publisher’s Note: MDPI stays neutral with regard to jurisdictional claims in published maps and institutional affiliations.

