Article

Inferential Reasoning of Secondary School Mathematics Teachers on the Chi-Square Statistic

by
Jesús Guadalupe Lugo-Armenta
* and
Luis Roberto Pino-Fan
Departamento de Ciencias Exactas, Universidad de Los Lagos, Osorno 5290000, Chile
*
Author to whom correspondence should be addressed.
Mathematics 2021, 9(19), 2416; https://doi.org/10.3390/math9192416
Submission received: 28 August 2021 / Revised: 23 September 2021 / Accepted: 24 September 2021 / Published: 28 September 2021
(This article belongs to the Special Issue Statistics Education: An Immediate Need in a Changing World)

Abstract

:
Statistics education has investigated how to promote formal inferential reasoning from informal inferential reasoning. Nevertheless, there is still a need for proposals that explore and progressively develop inferential reasoning of students and teachers. Concerning this, the objective of this article is to characterize the inferential reasoning that secondary school mathematics teachers show in the practices that they develop to solve problems regarding the Chi-square statistic. To achieve this, we use theoretical and methodological notions introduced by the onto-semiotic approach of mathematics knowledge and instruction. In particular, we have taken a theoretical proposal of levels of inferential reasoning for the Chi-square statistic. Based on the results, the main conclusion was that the proposal above effectively predicted the teachers’ practices, allowing us to distinguish characteristic elements of the levels of inferential reasoning.

1. Introduction

Statistics education has recently developed a particular interest in the education of citizens with the ability to interpret the world around them. Consequently, several countries, including Chile, have incorporated inferencing topics into their secondary education curricula [1]. Callingham and Watson [2] and Pfannkuch [3] have evidenced that curriculums show elements of statistical inference in years before university education; nevertheless, the notions involved in it are often complex for students and teachers to understand [4,5,6,7,8]. Batanero [9] observes that most incorrect interpretations and errors in statistical inference are related to hypothesis testing. These difficulties often arise in understanding the significance level, the formulation of the null and alternative hypotheses, sampling distributions, Type I and Type II errors; as well as the logic of hypothesis testing is often misunderstood, and the results are misinterpreted.
To counteract these difficulties, researchers have proposed ways to promote inferential reasoning, from which we can observe two trends. On the one hand, some proposals focus on how to approach inference from an early age under an informal perspective called informal inferential reasoning (IIR) [10,11,12]. On the other hand, some propositions focus on developing formal inferential reasoning (FIR) based on IIR [13,14,15]. Nevertheless, there is still no consensus, and the discussion on how to promote inferential reasoning progressively is still open [15]. Thus, it is necessary to have proposals that allow for the exploration and progressive development (from IIR to FIR) of the inferential reasoning of students and teachers.
The present article focuses on the Chi-square statistic, which played an essential role in the construction of a methodology for hypothesis testing. Currently, hypothesis tests with this statistic are part of applied statistics, making valuable contributions in medicine, psychology, genetics, agronomy, aquaculture, biology, financial analysis, econometrics, industry, and marketing research. In order to make inferences based on these statistical tests, it is necessary for students and teachers to profoundly and holistically understand the Chi-square statistic and related notions [16,17]. When students have difficulties in understanding or connecting statistical notions, they may focus on algorithms or procedures. However, according to Batanero [9], this could imply that they cannot identify the type of data, choose the statistic, and the distribution or test needed to solve a real problem.
Some studies have emphasized problems that students and teachers present when making inferences with the Chi-square statistic. These difficulties include identifying variables, assuming independence, having a unidirectional, deterministic, and localistic conception of association, using a generic interpretation of the hypothesis test, confusing homogeneity with independence, and making errors in the hypothesis statement, with the p-value and the significance level [18,19,20,21,22,23,24,25].
In this sense, this study aims to characterize the inferential reasoning evidenced by Latin American teachers when they carry out problem-solving practices on Chi-square. The purpose of this characterization is to study the primary elements (representations, concepts/definitions, properties, procedures, arguments) that teachers use in their practices and whether these elements allow them to be associated with different levels of inferential reasoning. Similarly, this study seeks to empirically explore if the levels of inferential reasoning on the Chi-square statistic, proposed by Lugo-Armenta and Pino-Fan [26], are predictors of the level of inferential reasoning associated with the practices that teachers can develop when solving problems about this statistic.

2. Theoretical Framework

In research on statistics education, we find various positions and uses of statistical reasoning, literacy, and thinking. Ben-Zvi and Garfield [27] define these notions, highlighting the differences between them. For example, they indicate that statistical literacy includes the essential skills for understanding statistical information or research results. In contrast, they define statistical reasoning as “the way people reason with statistical ideas and make sense of statistical information” (p. 7). Meanwhile, statistical thinking involves understanding the nature of sampling, the reasons and the procedures for conducting statistical investigations, and the processes for using models to simulate random phenomena. It also comprises understanding the procedures, the moments, and the reasons for using inferential tools, using the context of a problem to form an investigation and outline conclusions, comprehending the process of a statistical investigation, and critiquing and evaluating both the results and the statistical study.
In this work, we consider reasoning as a “social and epistemic macro-process” that involves bringing into play both primary mathematical objects (representations, concepts/definitions, properties/propositions, procedures, and arguments) and mathematical processes for the solution of a situation-problem. In other words, to say that an individual “understands” Chi-square, we must observe that in the reasoning of his practices (to solve different types of situations/problems), primary mathematical objects and processes linked to the meanings of this notion emerge gradually, systematically and progressively [28]. It is worth noting that this position on reasoning resorts to a pragmatist view on the construction of mathematical knowledge, and school mathematical knowledge, which contemplates the semiotic, anthropological, and pragmatic postulates of the ontosemiotic approach to mathematical knowledge and instruction (OSA) [29,30]. Then, to talk about school statistics, we resort to an integrated and transdisciplinary view involving thinking, reasoning, and statistical literacy, as each of these approaches to school statistics is developed from psychological, epistemic, and semiotic perspectives, respectively. Thus, by considering reasoning in terms of mathematical practices, objects, and processes, one moves in a sense through the definitions given by Ben-Zvi and Garfield [27] for thinking, reasoning, and statistical literacy.
To define mathematical practices, objects, and processes, we turn to the OSA, an inclusive theoretical approach to mathematics education with anthropological and semiotic theoretical assumptions [29,30]. This approach recognizes the dual nature of mathematics as a system of objects and a system of practices. The notion of practice plays a fundamental role in OSA. We understand it as “any performance or manifestation (verbal, graphic, etc.) carried out by someone in order to solve mathematical problems, communicate the solution obtained to others, validate it or generalize it to other contexts and problems” [31] (p. 334). Mathematical practices involve ostensive objects (symbols, graphs, etc.) and non-ostensive objects (concepts, propositions, etc.) and are represented in textual, oral, graphic, or even gestural form. At least six types of primary mathematical objects emerge from the systems of practices, operational or discursive, that account for their organization and structure and interact to configure mathematical activity: linguistic elements, situations/problems, concepts/definitions, properties/propositions, procedures, and arguments [29,30]. As these primary mathematical objects can be analyzed from the process-product perspective, we must consider the processes: communication, problematization, definition, enunciation, algorithmization, and argumentation [32]. Other processes that enable us to understand mathematical objects’ complex and progressive nature are generalization, particularization, idealization, materialization, representation, signification, reification, splitting, and modeling [33,34].
To carry out this study, we used a theoretical proposal of levels of inferential reasoning on the Chi-square statistic, which is based on the theoretical notions we have described and on the research literature of statistics education [26]. This proposal links different perspectives on inferential reasoning and mathematical objects and processes identified with a historical-epistemological study on Chi-square statistics. We conducted the historical-epistemological study from an intuitive, pre-formal, and formal perspective [35]. Appendix A (Figure A1 and Figure A2) summarizes the proposed levels of inferential reasoning for the Chi-square statistic, which we used for the development of this research.

3. Methodology

This study is framed within the qualitative paradigm [36] as it analyzes the mathematical practices that teachers perform when solving problems involving the Chi-square statistic. Then, based on this analysis, it determines the level of reasoning exhibited in the mathematical practices that teachers develop. The study performs the above characterization using the levels of inferential reasoning on the Chi-square statistic (see Appendix A).

3.1. Teachers Participating in the Study

The participants of this study were 41 practicing teachers and 50 prospective teachers (one group of 28 and the other of 22). The first group of prospective teachers (28) belonged to a Mexican university and were taking their first course in probability and statistics. However, they had not yet started with topics on inference. As part of the course, these prospective teachers took a two-week workshop on statistical reasoning, which was conducted virtually and synchronously due to the COVID-19 pandemic (all the workshop sessions were recorded). During the workshop, the prospective teachers solved activities on the Chi-square statistic in randomly composed teams and discussed their solutions with their peers and the workshop trainer (first author of this article).
The second group of prospective teachers (22) came from various universities in Costa Rica and enrolled in a one-week workshop on statistical reasoning, held virtually and asynchronously, and organized by two universities of that country. In this workshop, participants solved activities on the Chi-square statistic individually due to the workshop modality. They had the opportunity to interact with their peers and with the trainer (first author of this article) through a forum and videos.
The practicing teachers (41) were from a variety of Latin American countries, specifically from Argentina, Chile, Colombia, Guatemala, Mexico, and Peru, and were enrolled in a workshop on statistical reasoning for high school mathematics teachers organized by a Chilean university. This workshop lasted one week; it was conducted virtually in a synchronous and asynchronous mode due to the effects of the pandemic too. During the workshop week, which sessions were recorded, teachers had the opportunity to solve activities in teams and discuss their solutions with their peers and the trainers who taught the workshop (both authors of this article). It is important to indicate that the composition of the teams was random.
The mathematical practices that the three groups of teachers developed to solve the activities were uploaded to the platforms used in each workshop. The practices, along with the video recordings, and interactions in forums, served to analyze the teachers’ practices in Section 4.
In this article, we present the analysis of the practices developed by (i) Teams 1, 2, and 4 of Group 1 (G1) of prospective teachers; (ii) Teachers 5, 11, 17, and 21 of Group 2 (G2) of prospective teachers; and (iii) by Teams 3 and 5 of practicing teachers (G3). The rationale for presenting the practices shown and discussed by these teachers and teams is that they were representative of the types of practices developed by all of the participating teachers.

3.2. Instrument of Inquiry

In Appendix B (Figure A3, Figure A4 and Figure A5), we present the activities solved by the prospective and practicing teachers; the activities have similar characteristics since they can be solved with practices that admit features of one of the four levels of inferential reasoning for the Chi-square statistic. To validate the activities, we resort to content validity [36]; while in the case of reliability, we do so in the sense of the consistency of the observations (mathematical practices developed by the teachers), which can be observed in Section 4. For reasons of space, we do not discuss all activities here.
With the proposed activities, we expected teachers to carry out various mathematical practices. For example, respecting Level 1 of inferential reasoning, a first practice could be of an intuitive nature, such as making conjectures about the problem posed using graphs (e.g., bar chart) and/or statistical measures such as quartiles, mean and standard deviation. They could also reflect on the dispersion, symmetry, and shape of the graph. Concerning the practices associated with the second level, they could indicate characteristics of the data to be analyzed, such as whether it is a sample or population and whether their classification is according to one or two variables. They could also identify the hypothesis implicit in the problem and make it explicit, some properties such as the Chi-square statistic and degrees of freedom. In the arguments, they could use probability in context. In the practices associated with the third level, both hypotheses could be expressed in natural language, identify whether it is necessary to apply a continuity correction factor to the Chi-square statistic; also establish a significant deviation limit, and use it to argue their inference. Regarding the practices associated with the fourth level, they could indicate and justify a significance level and state the hypotheses in symbolic language. They could also perform the test with the Chi-square statistic, decide based on the hypothesis test, argue it statistically, and critically analyze the efficiency of their statistical inference.

4. Analysis of Teachers’ Practices

In the following, we analyze the practices developed by practicing teachers and prospective teachers concerning the solution of Activities 1 and 2. For this analysis, we used the proposed levels of inferential reasoning on the Chi-square statistic (Appendix A) and the notion of mathematical practice and configuration of objects and processes, described in the theoretical framework section.

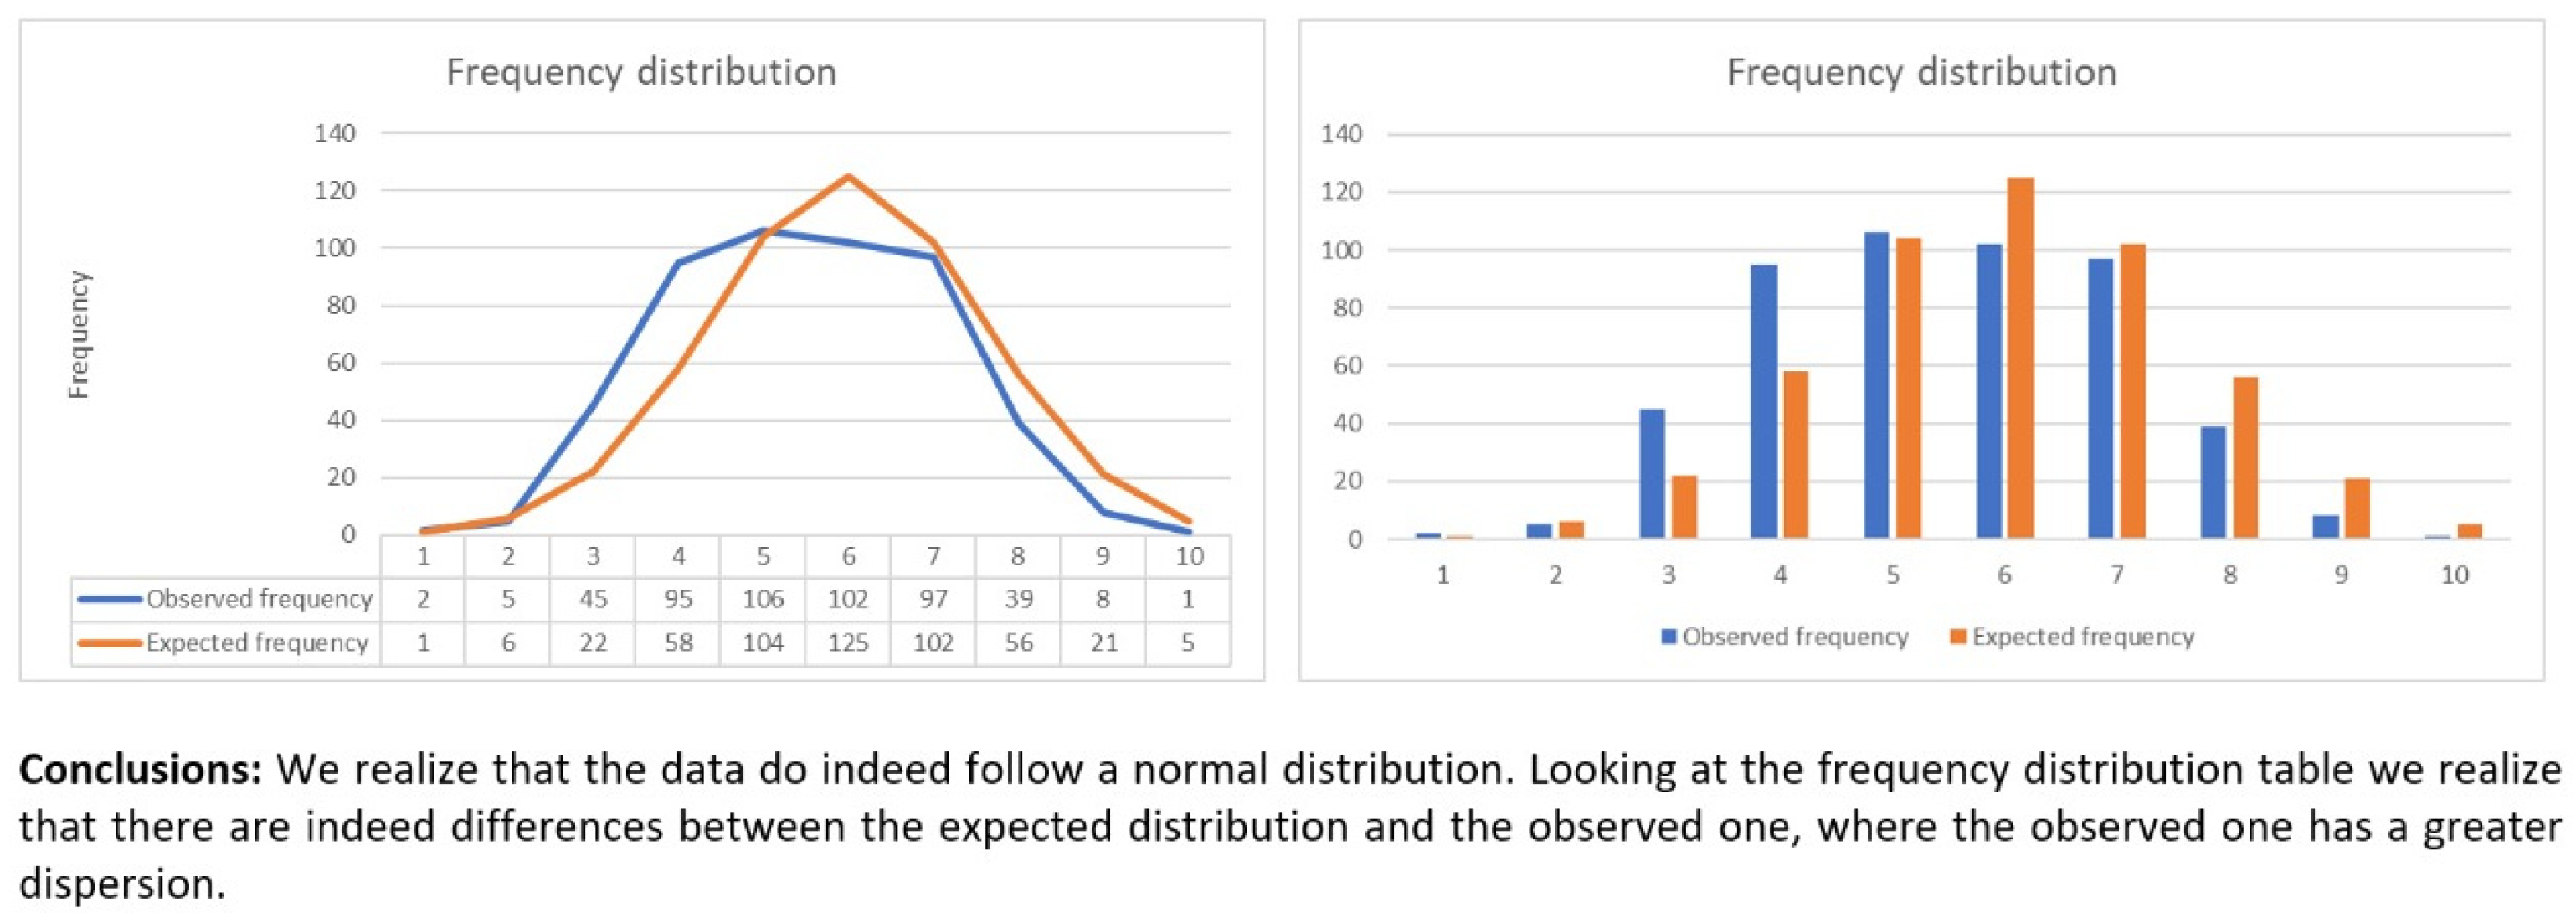
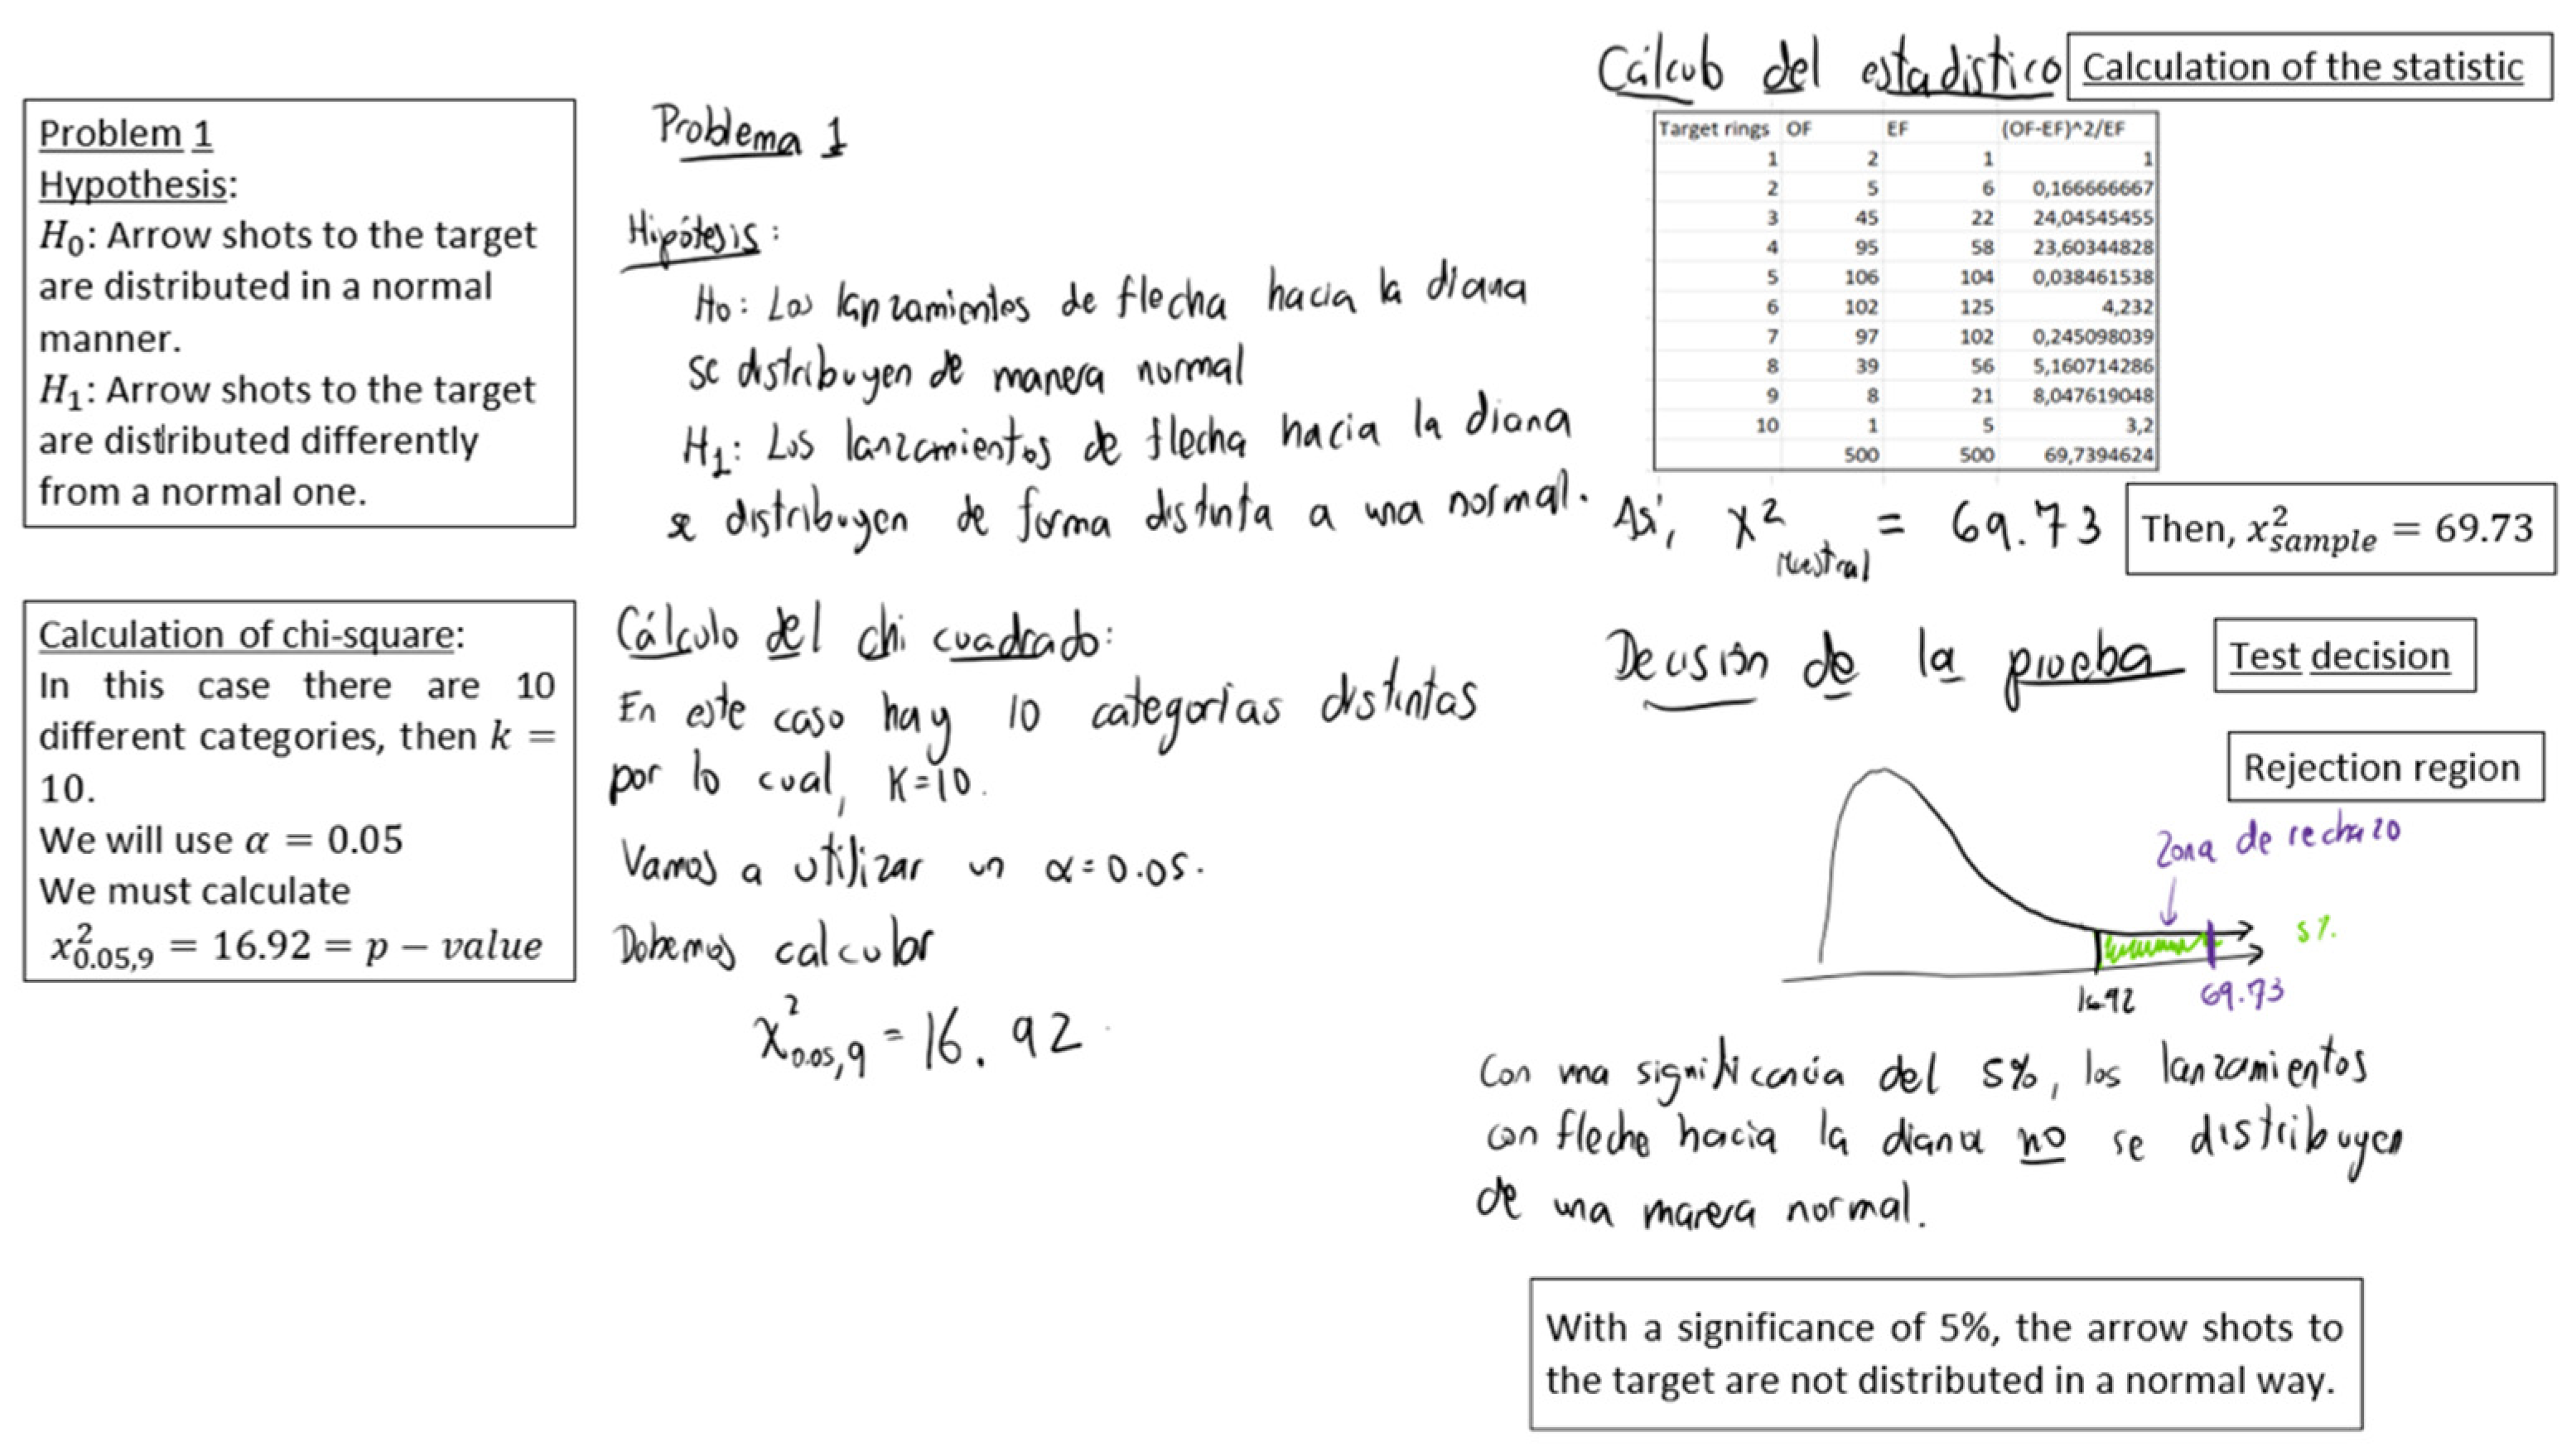
4.1. Practices Associated with Activity 1

Activity 1 (see Figure A3) deals with arrow shots in an amateur archery tournament, where it is interesting to know if the form in which the observed frequencies are distributed is as expected (expected frequencies). i.e., if the distances follow a normal distribution. Below, we present the practices developed by prospective and practicing teachers on this activity.
We exemplify the first type of practice characteristic for Activity 1 with the developments of Team 1 of the prospective teachers in the first group (Figure 1).
The prospective teachers of Team 1 observed that the closer they came to the center of the target the fewer the arrows, and that this made sense as it was an amateur tournament. They also noted that the target rings with the fewest arrows are Ring One and Ring Ten, whereas Rings Five and Six have the most arrows. They also indicated that data ranging from Ring One to Ring Five (in that order) have increasing behavior, while data ranging from Ring Six to Ring Ten (in that order) have decreasing behavior. Besides, they made two frequency distribution graphs, from the observed (OF) and expected (EF) frequencies provided in the problem. From the trends they visualized in the graphs, they referred to “OF is similar to EF,” “the shapes of the graphs are bell-shaped,” and “it seems that OF has greater dispersion than EF.” Finally, the teachers of Team 1 guessed that the observed data indeed follow a normal distribution.
In Team 1′s practice, we identified primary objects as the linguistic elements, graphical representations, and natural language; some concepts/definitions such as observed and expected frequency, frequency distribution, and dispersion; while the main property/proposition is the normal distribution. The procedures performed by the prospective teachers were to make the line graph and the bar graph, based on the information provided in the table of Activity 1, using Excel. Concerning the arguments for their conclusion, they mainly relied on the “bell-shaped” shape of the graphs and the apparent greater dispersion of the observed data. Thus, all the primary objects we identified in the mathematical practice, and the mathematical processes associated with them, correspond to Level One reasoning. One of the particularities of Level One, in a first stage, is related to visualization. Then, in the indicators that correspond to IIR, students or teachers are expected to support their guesses with the characteristics of the graphs and, subsequently, to base them on an analysis of the data.
The practice performed by this first team is related to what is expected in the first task to promote the IIR of the framework proposed by Zieffler, Garfield, delMas and Reading [10]. For a practice with more complex Level 1 elements, teachers could have used concepts/definitions such as ogive, quartiles, and percentiles; and properties/propositions such as Q 2 in 1   2 , Q 1 in 1   4 , Q 3 in 3   4 , and the conditions for a symmetric series proper to Galton’s method of intercomparison [38]. They could have calculated and graphed the deviations, positive and negative, concerning the median, making use of the mean error concept and the probable error property, and based their conjecture on the characteristics of the graphs such as shape, but also on symmetry, dispersion, the amplitude of the quartiles and/or bias.
A second practice characteristic of activity one was carried out by Team 3 of practicing teachers. The teachers used Excel to carry out the activity (Figure 2).
Team 3 teachers mentioned that they used Excel to determine if the observed frequencies had a normal distribution characteristics. They also mentioned that the first thing they did was calculate the mean, variance, standard deviation, median, and mode. They added that one of the characteristics of the normal distribution is that the mean, mode, and median have the same value and that in the problem, the values of these measures correspond to approximately five. Then, they pointed out that they made a histogram and that from this, they saw symmetry and that the two tails were very similar (shape of the graph). Finally, they concluded that the data has a normal distribution and that another strategy could be to use statistical software to calculate some statistic test.
In the practice carried out by the practicing teachers of Team 3, we observed linguistic elements such as natural language, tabular and graphical representation, concepts/definitions such as observed and expected frequency, and symmetry, properties/propositions such as normal distribution, mean, standard deviation, median, mode, and variance. The teachers’ procedures attend to the properties indicated using Excel. The arguments were based on the histogram’s symmetry and shape and the normal distribution property that the mean, mode, and median coincide. These primary mathematical objects and the processes associated with them belong to Level 1 of inferential reasoning on the Chi-square statistic.
For these teachers’ practice to progress to a Level 2, they could start by identifying the hypothesis implicit in the problem. According to Pfannkuch and Wild [39], Pfannkuch et al. [40], and Bakker, Ben-Zvi and Makar [17], approaching statistical hypotheses through hypotheses in the form of questions or conjectures can favor the understanding of hypotheses. Besides, teachers could use the Chi-square statistic to assess the goodness-of-fit of the data set and obtain the probability associated with the value of the statistic and interpret it as a measure of the occurrence of a complex system of n errors occurring with a frequency as large or larger than that of the observed system. According to Stohl, Angotti, and Tarr [41], by using probability in this way, teachers will naturally make decisions to maintain their current hypothesis or alter it based on the obtained probability.
We exemplify a third type of practice on activity one, with the practice developed by prospective Teacher 21 (PT21) of Group Two (Figure 3).
PT21 made the statistical hypotheses and calculated the Chi-square statistic. Nevertheless, he could not interpret the statistic’s value or obtain the value of the probability, either using probability tables of the Chi-square distribution, web calculator, or any software (e.g., Excel, Minitab, R, SPSS). Then, from the table he constructed to calculate the statistic, he interpreted some contributions of each category to the Chi-square statistic. In particular, he distinguished that the closer this contribution is to zero, the greater the similarity with the EFs; he also made a double bar graph where he visualized the asymmetry of the OFs. These aspects helped him to conclude that the observed data do not follow a normal distribution.
In PT21′s practice, we distinguish the linguistic elements, natural and symbolic language, and graphical and tabular representations; some concepts/definitions such as observed and expected frequency and symmetry; while the main property/proposition is the Chi-square statistic. The teacher’s procedures were the calculation of the statistic and the bar chart using Excel. Concerning the arguments for his conclusion, he resorted mainly to the asymmetry of the observed data. In general, the primary objects we have identified in the mathematical practice of PT21 correspond to Level 2 of inferential reasoning on the Chi-square statistic.
Although the practice developed by this teacher is Level 2, we find Level 1 features, such as the use of the characteristics observed in the bar graph to support the conclusion, and Level 4 features, such as how the hypotheses are stated. However, although PT21 recognized the use of the Chi-square statistic to solve the problem, he had difficulties in concluding the hypothesis test. To strengthen this Level 2 practice, PT21 could have obtained the probability value for the statistic he has calculated and interpreted it as discussed in the previous practice. To perform this, the teacher must be familiar with the Chi-square distribution and understand its properties. He could start with simulation applets to visualize how this distribution behaves by varying its parameter since, according to various research [42,43,44], technological resources help students and teachers to interact with statistical notions, which favors their comprehension.
For a Level 3 practice, the teacher should have identified that since there are expected frequencies less than five, it would have been appropriate to use the Chi-square statistic with continuity correction factor; also, he or she could have employed the significance level in a pre-formal way. In this regard, the proposal for levels of inferential reasoning (Appendix A) suggests working with the concept/definition of significance as a significant deviation limit; based on this limit, which is usually associated with a probability value, it is seriously considered that a difference is likely to exist. This approach to work on significance was applied by Fisher [45] and is consistent with Rossman’s [46] proposal to introduce some ideas on inference.
The following practice corresponds to prospective Teacher 5 in Group Two (Figure 4).
The prospective Teacher 5 (PT5) of the second group presented the null and alternative hypotheses. Then, he calculated the Chi-square statistic, defined an alpha value to obtain the critical value or the theoretical statistic, and used it to decide whether the observed data set follows a normal distribution. For this, he made a graph of the Chi-square distribution where he indicated the region of rejection. Consequently, the teacher concluded that he could state with a significance of 5% that the data are not distributed as normal.
In this practice, we can identify that the linguistic elements used by PT5 are natural and symbolic language and tabular and graphical representations. Some concepts/definitions are observed and expected frequency, significance, hypothesis, and rejection zone. At the same time, the properties/propositions are the Chi-square statistic, degrees of freedom, alpha (significance level), decision rule with the statistic, and critical region. The procedures he made were to calculate the Chi-square statistic, the degrees of freedom, determine the level of significance, obtain the critical value, and compare it with the value of the statistic calculated employing a graphical representation to decide to reject or not the null hypothesis. Finally, the arguments supporting his conclusion are that since the value of the Chi-square statistic is greater than the critical value, then the data observed in archery shooting cannot follow a normal distribution.
In summary, the practice developed by PT5 is characteristic of Level 4. Nevertheless, when using the Chi-square statistic, he does not realize that it is necessary to use a continuity correction factor because the expected frequencies are less than five. This is because this test is approximate since χ is a continuous distribution and the distribution that we are trying to approximate is discrete. Then, the precision of the approximation of the test depends on the observations’ values, and when working with small numbers, the discrepancy that is generated becomes noticeable.
For PT5 to strengthen his Level 4 FIR, he could explore Type I and Type II errors and understand the relationships between these errors, the significance level, and the power. Similar to Rossman’s proposal [46], for the understanding of the distribution or the p-value, we can use software, simulations, and graphical representations, to promote the properties/propositions of Type I and Type II errors, significance level, and power of the test, as well as the relationships between them.
The above practices exemplify the type of practices that both prospective teachers and practicing teachers carried out when solving Activity 1. Next, in Figure 5, we present another practice that stood out in the second group of prospective teachers.
The prospective Teacher 11 (PT11), from the second group, performed a goodness-of-fit test with the Chi-square statistic. To carry it out, he stated the hypotheses, identified that the data had ten categories, and from this, he determined the degrees of freedom. He then established a significance level of 0.05. Consequently, he calculated the theoretical statistic using R software, and with the use of Excel, he calculated the value of the test statistic. PT11 concluded that with a significance level of 5%, the arrow shots to the target do not follow a normal distribution. As we can see, the practice developed by PT11 is very similar to that developed by PT5; however, PT11 seems to have a wrong understanding of the p-value since he is working with the critical value or theoretical statistic. We consider that this is not a simple mistake since we could observe this error in other practices of Activities 1 and 2 and when working with the test statistic. If the teacher had understood this notion, he would have realized that he was working with a probability value and that it could not be greater than one. Concerning this, the proposal of levels of inferential reasoning about the Chi-square statistic promotes the progressive understanding of notions such as the p-value. The prospective teacher could start with an informal approach to the p-value, aided by software for simulations or calculating the probability of the Chi-square statistic (Level 2), and thereby supported his inference [44,46].

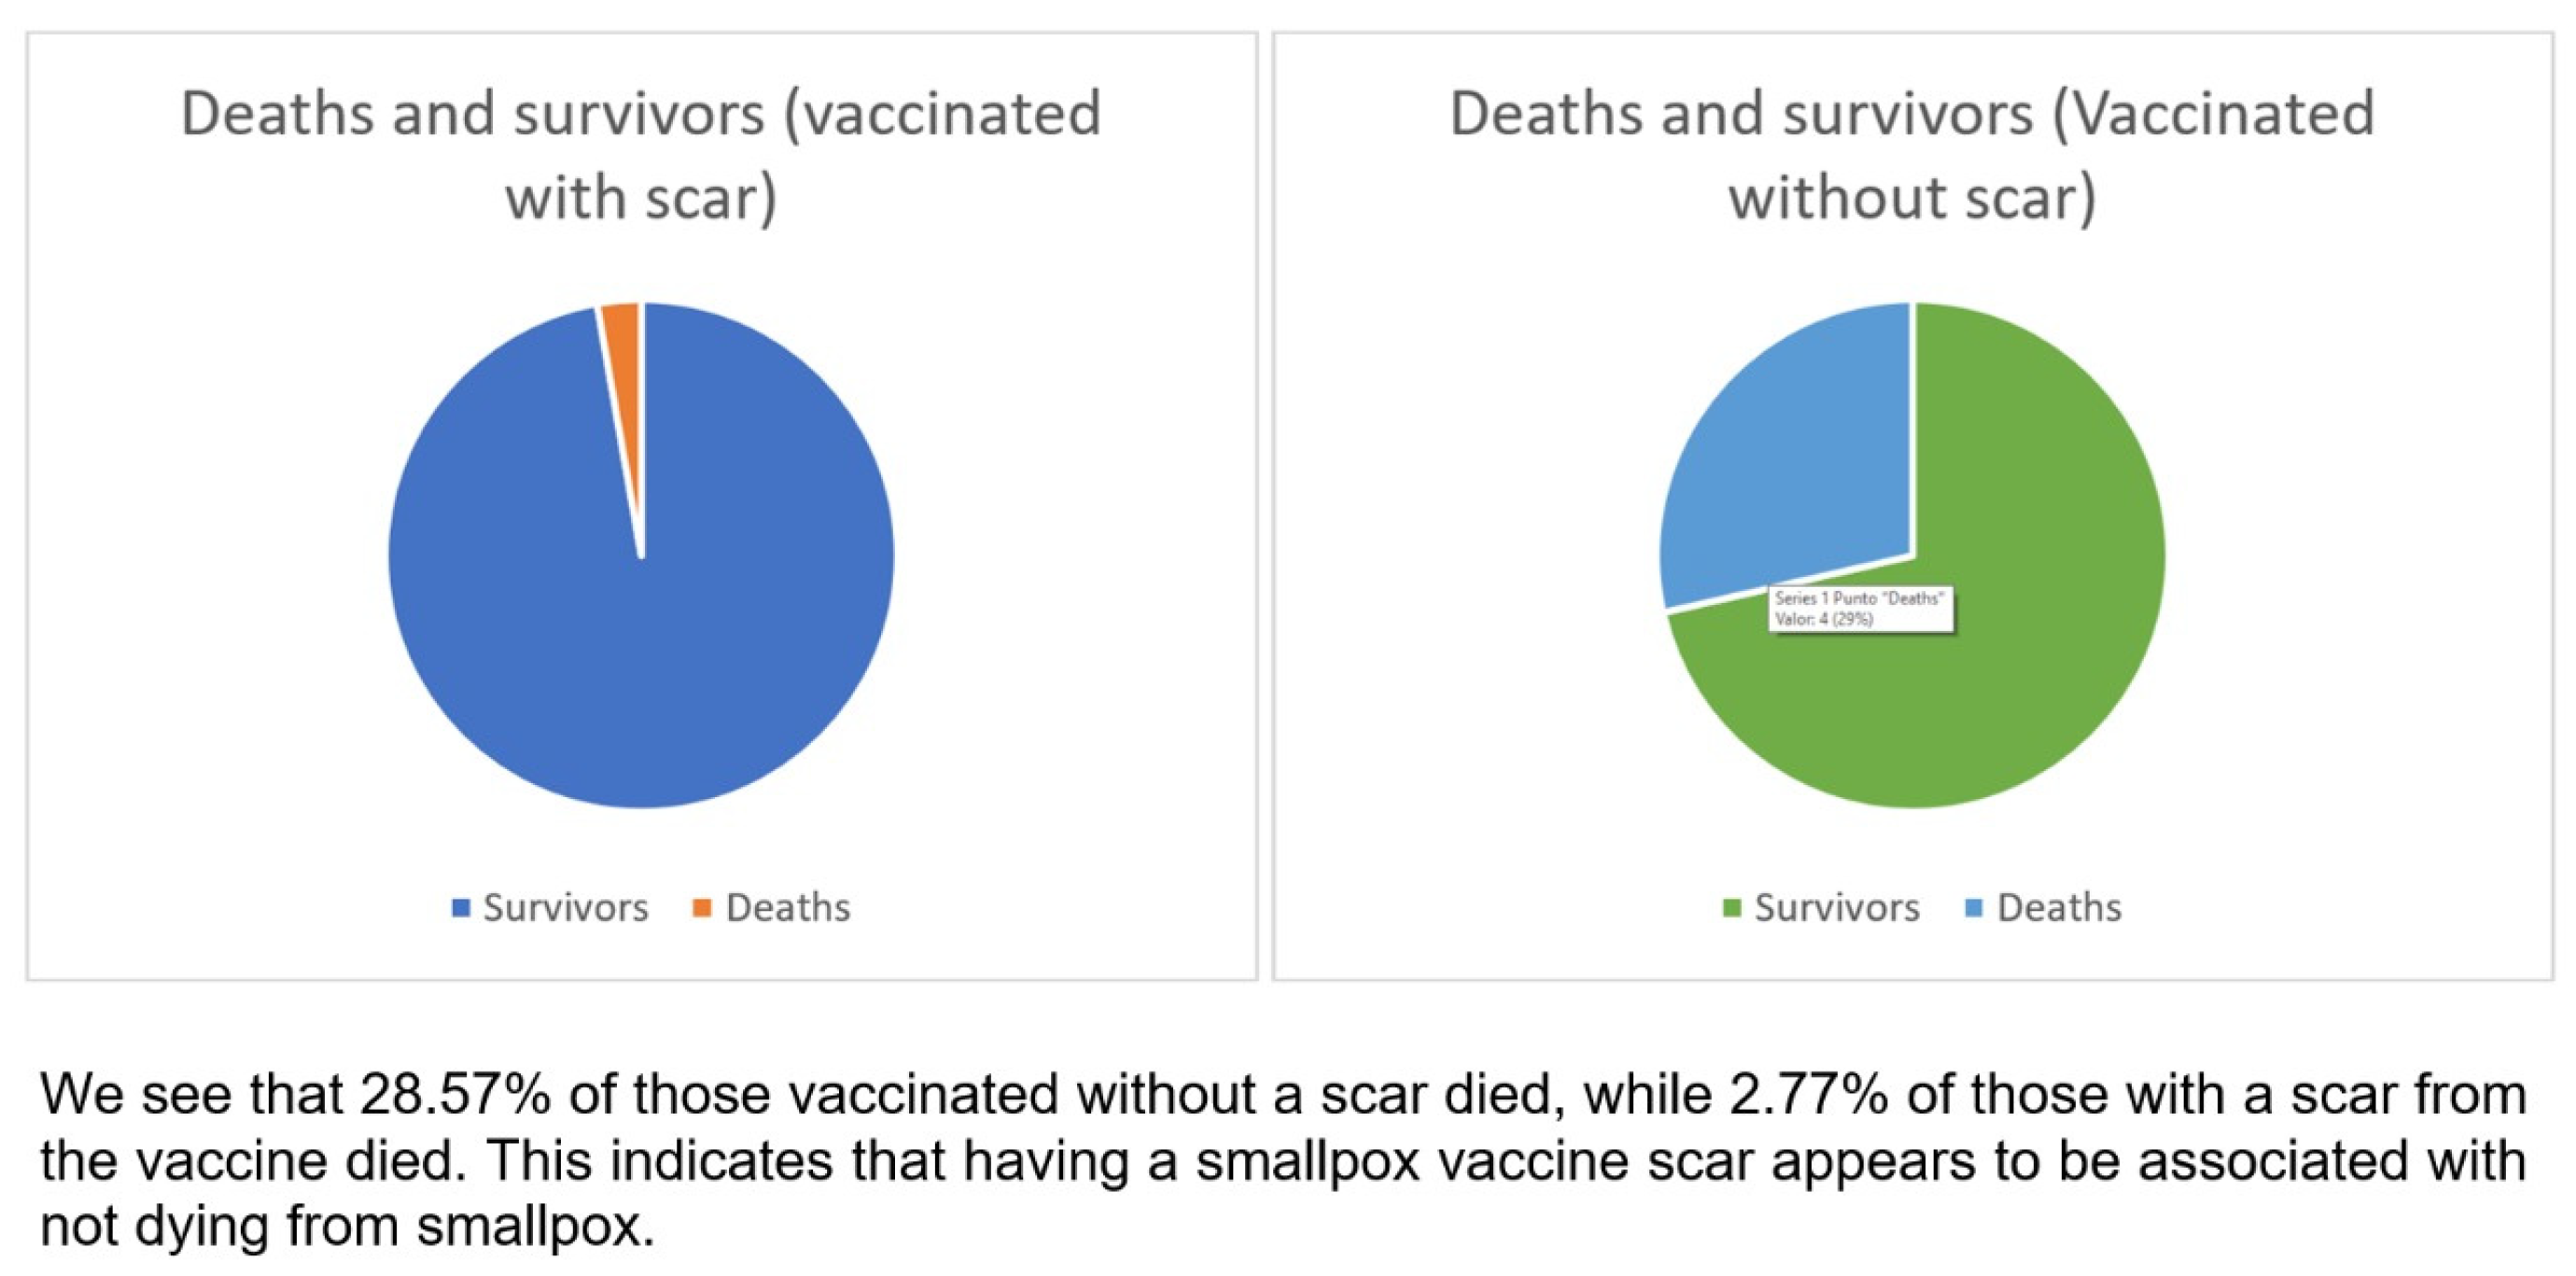
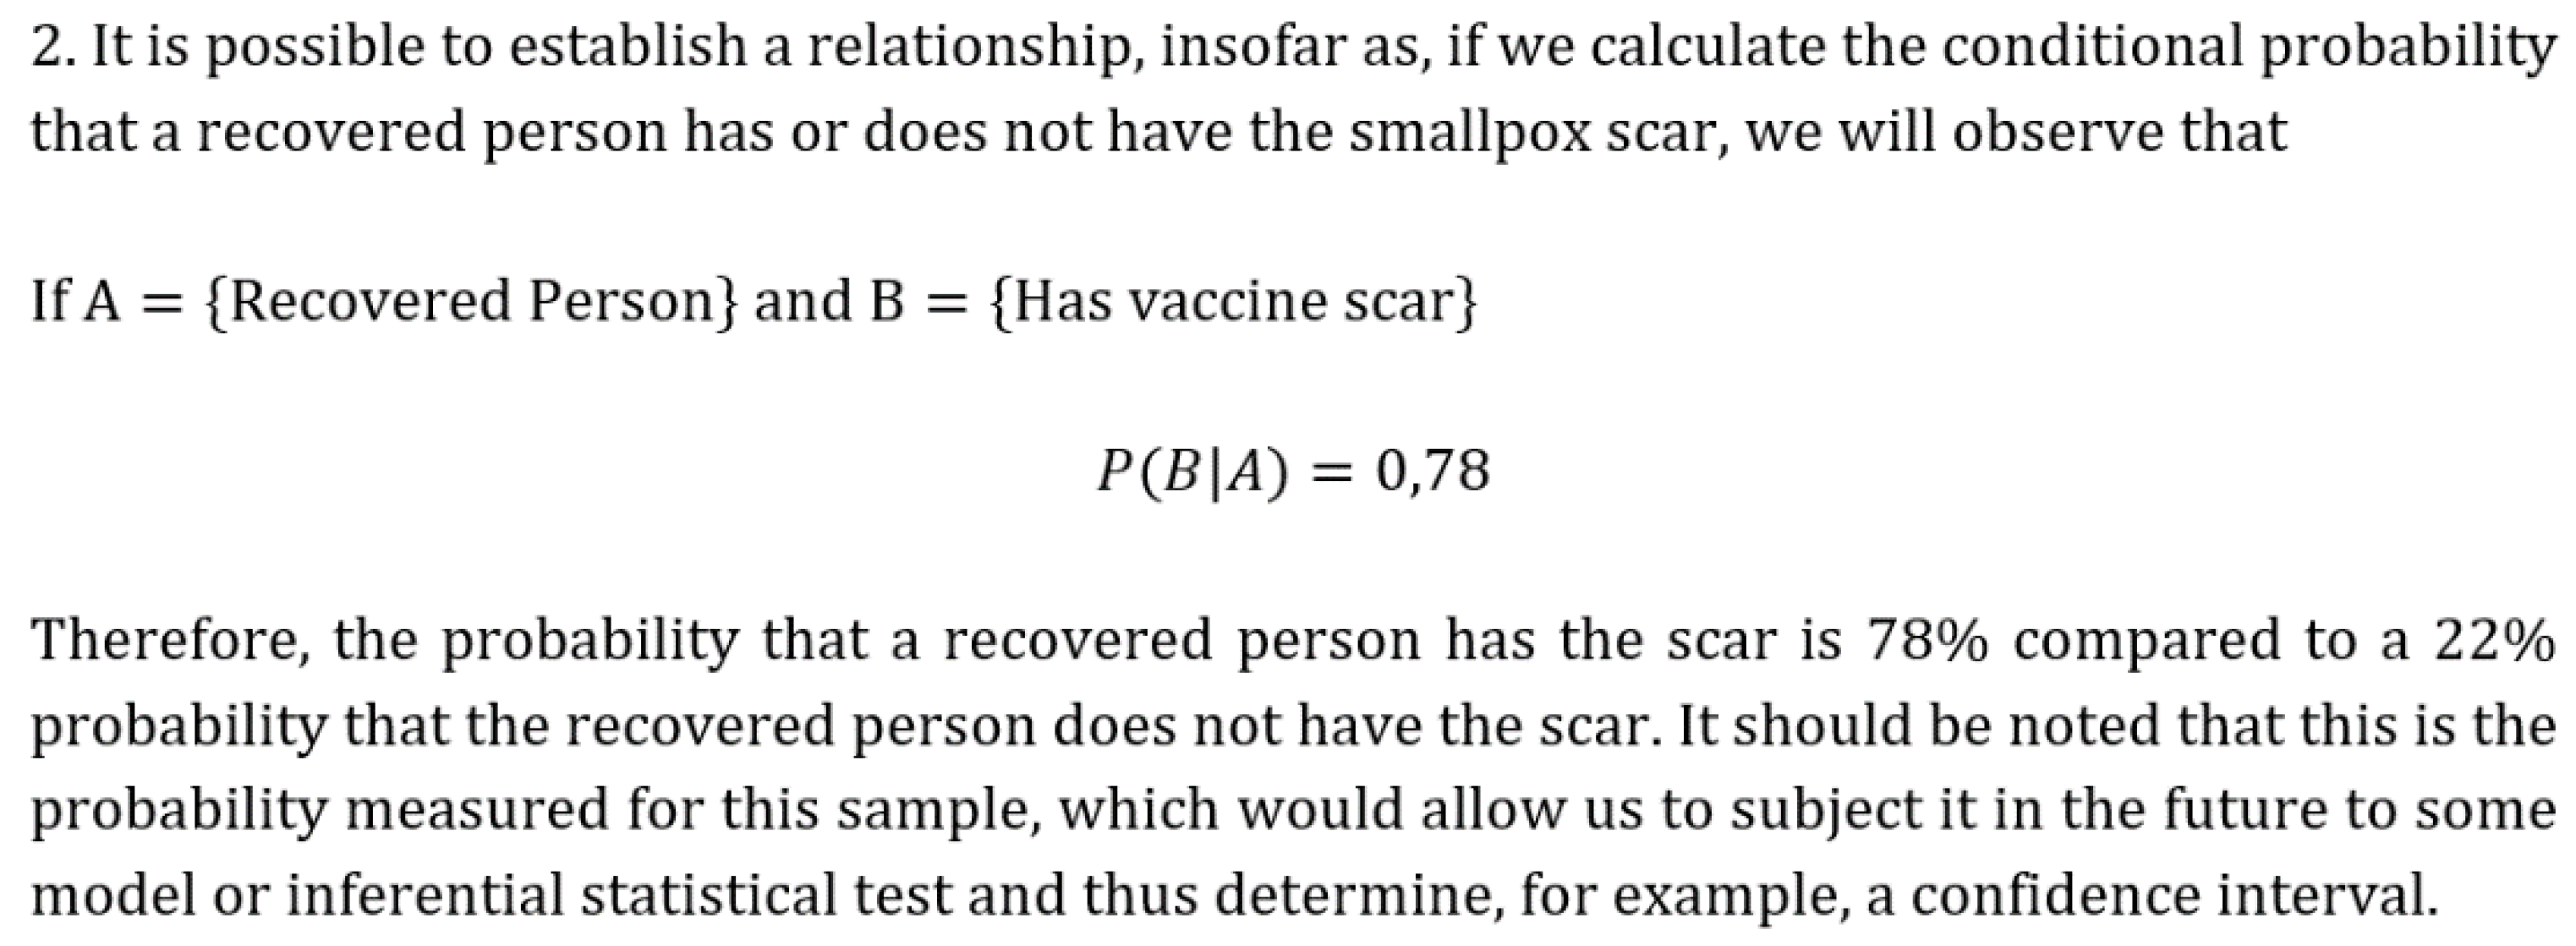
4.2. Practices Associated with Activity 2

Activity 2 (see Figure A4) deals with data collected during a smallpox epidemic, where it is of interest to establish whether there is any relationship between the presence of vaccine scarring and smallpox recoveries.
Below, we present the practices carried out by the prospective teachers in Group 1. We exemplify the first type of practice characteristic for this activity, with the one developed by Team 2 (Figure 6).
The teachers on Team 2 indicated that in the first instance, they found it very appealing to say that the sample is not large enough to ensure a relationship between deaths and whether or not they had the vaccine scar. However, as a team, they decided to explore the data and made pie charts of deaths versus survivors with and without the vaccine scar. The prospective teachers indicated that they interpreted a significant relationship between the scar and the patient’s recovery once they made the graphs since they could see that only 2.78% of the patients with the scar died. In comparison, 28.57% of the patients without the scar died.
In the practice of Team 2, we observed that the linguistic elements they used are natural language and graphical representation. Some concepts/definitions are samples, variable, frequency, and association (relationship). The procedures they carried out are making pie charts using Excel. Concerning the arguments for their conclusion, they considered the percentages of dead patients with and without a scar. All the primary mathematical objects and their associated processes identified in this mathematical practice correspond to Level 1 of inferential reasoning about the Chi-square statistic. In addition to what was developed by the prospective teachers of this team, they could have analyzed the association of the two variables by means of the association coefficient [47], which can be considered a precedent to the test of independence with the Chi-square statistic; that is why in the proposal of levels of inferential reasoning the association coefficient is considered at Level 1, as an intuitive version that can support conjectures or informal inferences in problems of independence.
In Figure 7, we can observe the practice of Team 5 of practicing teachers, which is characteristic of this activity.
The teachers of Team 5 chose to establish whether there is a relationship between recovery and the presence of scarring using conditional probability. To perform this, they established Events A and B in terms of the problem and calculated the probability of having vaccine scarring given recovery. The teachers pointed out a 78% probability that those who recovered will have scarring from the vaccine, compared to a 22% probability of no scarring. Likewise, 97% of those with scars recovered, while 71% of those without scars recovered. Therefore, they considered that there is a relationship between recovery and scarring from the vaccine. The teachers emphasized that the probabilities they obtained refer to this single sample but could be subjected to some type of statistical inference technique to determine the existence of an association.
In the practice performed by Team 5, we identified concepts/definitions such as sample, probability events, probability, and association (relationship). The property/proposition that stands out is conditional probability, while the procedures were to calculate conditional probabilities. Regarding the arguments, they supported their conclusion with the probabilities obtained. Most of the primary elements identified in this practice correspond to Level 1. In order to strengthen the practice of this level, which corresponds to IIR, teachers should obtain the conditional distributions by row, by column, and the joint distribution of the whole sample. In addition, it might also help to perform stacked bar charts or mosaic plots to visualize proportions [48] or tree diagrams [49], to approximate a test of independence with the Chi-square statistic.
A third type of practice for Activity Two is exemplified by the one developed by Team 4 of prospective teachers in Group One (Figure 8).
The prospective teachers in Team 4 mentioned that they first made a stacked bar chart with the frequencies provided in the activity table and then a tree diagram with the possibilities provided in the table, representing the conditional distribution by columns, and then considered calculating the conditional distribution by row. Furthermore, based on the graph and the calculated probabilities, they decided that there was indeed a relationship between recovering and scar presence.
In Team 4′s practice, we identified natural and symbolic language and graphical representations as linguistic elements; some concepts/definitions such as sample, probability events, probability, and association (relationship); properties/propositions, such as conditional probability, conditional distribution by row and column; procedures such as the elaboration of the stacked bar chart, the calculation of the conditional probabilities for the conditional distributions, and the formation of the tree diagram; arguments based on the shape of the stacked bar chart and the probability values obtained. Additionally, we observed that the mathematical objects identified in this practice correspond to Level 1 of inferential reasoning on the Chi-square statistic.
For the teachers’ practice to progress to a Level 2 practice, they could ask themselves whether the difference between the probabilities obtained will actually be sufficient evidence to decide whether there is a relationship between the presence of scarring and recoveries; and to answer this, the teachers could conduct a test of independence with the Chi-square statistic. To perform this, it is necessary that teachers first recognize the implicit hypothesis in the problem. The identification of the hypothesis in the form of a question is a crucial feature at this level. Moreover, this form presents a first approximation to the formal statistical hypotheses corresponding to Level 4 (Appendix A). In this sense, the statistical inquiry cycle (PPDAC: problem, plan, data, analysis and conclusion) of Wild and Pfannkuch [50] has as its first component the generation of a research question, which must be formulated about a particular context, which is the one to be investigated. At this level, it is crucial for the teacher to know and understand the Chi-square distribution (e.g., it is right skewed, it has degrees of freedom as its only parameter, as degrees of freedom increase, it approaches the normal curve, and cannot take negative values). Concerning this, some studies suggest using technological resources to promote the understanding of such notion [46,51,52,53]. Teachers could also use the probability to measure how far the observed system is or not compatible with probabilistic independence bases. i.e., use it to make pre-formal inferences (Level 1) and then explore comparing the probability to a preset limit (Level 3) or a significance level (Level 4).
Figure 9 exemplifies the fourth type of practice characteristic of Activity Two. Prospective teachers in the second group developed this practice.
Prospective Teacher 17 (PT17) said that he decided to apply a test of independence with the Chi-square statistic because he wanted to know if there was a relationship between the variables: vaccine scar and survival. To carry out the independence test, he calculated the expected frequencies, stated the hypotheses, calculated the Chi-square statistic and the degrees of freedom; he also established a probability of 0.05 to obtain the critical value as a limit. Finally, the teacher rejects the null hypothesis because the value of the calculated Chi-square statistic exceeds the critical value and concludes that there is a relationship between a scar and the person’s condition.
In this practice, we can identify the use of linguistic elements such as natural and symbolic language. We can also observe concepts/definitions such as the sample, variables, categories, frequencies (observed and expected), and hypotheses. In addition, we identify properties/propositions such as the Chi-square statistic, expected frequency, degrees of freedom, and decision-making criteria. Furthermore, we recognize procedures such as hypothesis statement, calculating the expected frequencies, calculating the Chi-square statistic, calculating the degrees of freedom, setting p = 0.05 as a limit and obtaining the value of the theoretical statistic, comparing this critical value with the calculated statistic and, finally, deciding whether to reject the null hypothesis. Concerning the arguments, the prospective teacher based them on the criteria for decision-making; since the value of the test statistic is greater than that of the theoretical statistic, then the null hypothesis is rejected. Most of the primary objects that we identified in the practice of PT17 are Level 4; however, what caught our attention was the use of probability as a significant limit. This aspect is characteristic of Level 3. In our proposal of levels, it is considered a pre-formal meaning of the significance level. From this limit, it can be seriously considered that it is probable that there is a difference. As mentioned in the practice of PT21 (Figure 3), this approach to the significance level is consistent with some proposals for introducing notions of inference.
For PT17 to strengthen his FIR, he could deepen his understanding of significance and confidence level, work with Type I and Type II errors, and validate his inference using the test’s power. The teacher could start with an approximation. Batanero, Vera and Diaz [7] suggest starting the exploration of conditional probability using applets to visualize the various possibilities. The teacher must acknowledge the relationships between all the notions mentioned. He should also not see them as isolated concepts or formulas that only help to perform an algorithm. In other words, a holistic approach is required for the teacher to learn to reason statistically and deeply understand these and other statistical notions [54,55]. Therefore, the proposal of levels of inferential reasoning on the Chi-square statistic has a progressive character, which allows exploring the different notions at various moments (in the levels) with different degrees of complexity, depth, and formality.

5. Final Reflections

In this study, we characterize the inferential reasoning evidenced by Latin American teachers when they practice solving Chi-square problems. We carried out this characterization to identify the primary mathematical objects that teachers use in their practices and determine whether it is possible to associate these primary mathematical objects with the levels of inferential reasoning about the Chi-square statistic proposed at the theoretical level by Lugo-Armenta and Pino-Fan [26].
Regarding the teachers’ practices, we could say that those associated with Level 1 mainly emphasized the use of graphic representations (e.g., double bars, lines, stacked bars, and pie), some statistical measures (e.g., mean and standard deviation), and the use of conditional probability. It is noteworthy that, although the prospective teachers in Group 1 had not received instruction on inference, they were able to make conjectures based on the visualization of graph features and probability measurements, thus showing IIR. The practices associated with Level 2 emphasized the use of the Chi-square statistic and the recognition of hypotheses. In contrast, in the practices associated with Level 4, we found the hypothesis statement, the Chi-square statistic and distribution, the critical value rule for decision-making, and the level of significance. It is worth highlighting that there was no evidence of practices that used in-depth elements of Level 3; however, in the teachers’ practices, we found traits of the use of elements of this level; for example, PT17 used probability as a significant limit.
On the other hand, based on the practices put into play by the teachers participating in our study, it was possible to analyze and discuss how these could be more robust within the same level or move to the next level. It became evident how the proposed levels of inferential reasoning could help with some frequent errors and difficulties that we observed in the teachers’ practices and that have been reported in the statistics education literature. For example, in the practices of G1 and G3 teachers, we observed that they did not state the null and alternative hypotheses. This is an aspect reported as one of the main difficulties presented by students and teachers in statistical inference [4,9,56,57]. In this sense, the proposal for levels of inferential reasoning (Appendix A) proposes working on hypotheses in three stages, at Levels 2, 3, and 4, respectively: (1) identifying the hypothesis implicit in the problem, commonly in the form of a question; (2) stating the null and alternative hypotheses in natural language; and (3) stating the null and alternative hypotheses in natural and symbolic language. Going through these three moments of hypotheses could help students and teachers to understand the nature and characteristics of hypotheses progressively.
On the other hand, the teachers usually used the critical value decision criterion (Level 4) but evidenced difficulty with the p-value. We exemplify this difficulty with the practice of PT11, who indicated that he had calculated the p-value with the help of the R software but obtained the value of the theoretical statistic (critical value), and did not realize that this value corresponded to a point and not to the area under the curve. The calculation and interpretation of the p-value are another of the main difficulties in statistical inference. This has been reported in several investigations [57,58]. That is why, in the proposal of levels that we use, we propose to work progressively on the p-value in three moments, in Levels 2, 3, and 4 respectively: (1) working with the traditional meaning of probability, (2) relating the concept of significance to probability and an intuitive rule for decision making, and (3) using the decision criterion with the significance level and the p-value. This proposed progression could help understand both p-value and related notions, e.g., significance level.
A final example that we would like to highlight is about the probability of committing Type I and Type II errors, aspects typical of Level 4 that we could not observe in the practices of the participating teachers. According to Cohen [59], we can understand test power as an index of the validity of statistical results. The suggested progressivity within Level 4 shows that the criteria on errors and test power present a greater complexity than the decision making based on the decision criterion (p-value or critical value). This complexity may be the reason why the practices analyzed have not identified elements related to them. However, we cannot leave aside the power of the test or the probability of committing Type I and Type II errors. Doing so would lead us to a deterministic view of the inference or hypothesis testing that we are performing [60].
In this study, we could not observe the application of the Chi-square statistic with the continuity correction factor. This situation is similar to other studies that propose activities to work the Chi-square tests with students [61,62,63,64]. For example, Gibbs and Goossens [64] talk about the relevance of the continuity correction factor and that it is usually not used when working with software because some (e.g., Minitab) do not have the option to use this factor. Therefore, it is necessary to understand this property/proposition and what is behind the processes or procedures performed by some software in data analysis.
In general, from the primary mathematical objects identified in the practices developed by the participating teachers, it was possible to verify that these are related to the elements proposed in the different levels of inferential reasoning about Chi-square. In addition, based on what has been discussed here, we consider that these levels are good predictors of teachers’ and students’ inferential reasoning about this statistic. Although conditional probability distributions were not part of the initial proposal of levels, this empirical study allowed us to realize their importance in practices that evidence IIR (Level 1). Considering this, we will include them in the proposal of levels of inferential reasoning on the Chi-square statistic. The above reflects that the proposal of levels used is not intended to be definitive and that further theoretical or empirical studies are needed to make the necessary adjustments for its consolidation. Furthermore, the findings of this study also revealed the need of conducting training cycles with prospective and in-service secondary school teachers to promote the development of inferential reasoning, for which the proposal of levels of inferential reasoning on the Chi-square statistic is fundamental.
Regarding a possible generalization of the levels of inferential reasoning, we con-sider that it is necessary to make proposals of levels of inferential reasoning for other statistics (e.g., t, z, and F) and from there, a general proposal of levels of inferential reasoning should be made, and moreover that it should be extended from hypothesis testing to confidence intervals.

Author Contributions

Conceptualization, J.G.L.-A. and L.R.P.-F.; formal analysis, J.G.L.-A. and L.R.P.-F.; investigation, J.G.L.-A. and L.R.P.-F.; methodology, J.G.L.-A. and L.R.P.-F.; project administration, L.R.P.-F.; writing—original draft, J.G.L.-A.; writing—review and editing, J.G.L.-A. and L.R.P.-F. All authors have read and agreed to the published version of the manuscript.

Funding

This research has been developed within the framework of the research project Fondecyt 1200005, funded by Agencia Nacional de Investigación y Desarrollo (ANID) of Chile.

Institutional Review Board Statement

The study was conducted according to the guidelines of the Declaration of Helsinki, and approved by the Institutional Review Board (or Ethics Committee) of Universidad de Los Lagos (Folio CEC-ULagos H012/2020 and date of approval 7 July 2020).

Informed Consent Statement

Not applicable.

Data Availability Statement

Doctoral thesis dissertations are public documents, but at the moment are not internet accessible. If one is interested in revising the investigation, they can request information from the authors.

Conflicts of Interest

The authors declare no conflict of interest. The funders had no role in the design of the study; in the collection, analyses, or interpretation of data; in the writing of the manuscript, or in the decision to publish the results.

Appendix A

Figure A1. Levels of inferential reasoning on the Chi-square statistic (Part 1).
Mathematics 09 02416 g0a1
Figure A2. Levels of inferential reasoning on the Chi-square statistic (Part 2).
Mathematics 09 02416 g0a2
More details about the elements of the Chi-square statistic meanings, which are referred to in these figures, are found in the historical epistemological study on the Chi-square statistic [35].

Appendix B

Figure A3. Activity/Problem 1 (Retrieved from [37]).
Mathematics 09 02416 g0a3
Figure A4. Activity/Problem 2 (Retrieved from [37]).
Mathematics 09 02416 g0a4
Figure A5. Activity/Problem 3 (Retrieved from [37]).
Mathematics 09 02416 g0a5

References

  1. Ministerio de Educación de Chile [Mineduc]. Bases Curriculares 3° y 4° Medio [Curricular Bases 3rd and 4th of Secondary Education]; Unidad de Currículum y Evaluación: Santiago, Chile, 2019.
  2. Callingham, R.; Watson, J.M. The development of statistical literacy at school. Stat. Educ. Res. J. 2017, 16, 181–201. [Google Scholar] [CrossRef]
  3. Pfannkuch, M. Reimagining curriculum approaches. In International Handbook of Research in Statistics Education, 1st ed.; Ben-Zvi, D., Makar, K., Garfield, J., Eds.; Springer International: Cham, Switzerland, 2018; pp. 387–413. [Google Scholar] [CrossRef]
  4. Sotos, A.E.C.; Vanhoof, S.; Van den Noortgate, W.; Onghena, P. Students’ misconceptions of statistical inference: A review of the empirical evidence from research on statistics education. Educ. Res. Rev. 2007, 2, 98–113. [Google Scholar] [CrossRef]
  5. Garfield, J.; Ben-Zvi, D. Developing Students’ Statistical Reasoning: Connecting Research and Teaching Practice, 1st ed.; Springer: Dordrecht, The Netherlands, 2008. [Google Scholar] [CrossRef]
  6. Harradine, A.; Batanero, C.; Rossman, A. Students and teachers’ knowledge of sampling and inference. In Teaching Statistics in School Mathematics-Challenges for Teaching and Teacher Education, 1st ed.; Batanero, C., Burril, G., Reading, C., Eds.; Springer: Dordrecht, The Netherlands, 2011; pp. 235–246. [Google Scholar] [CrossRef]
  7. Batanero, C.; Vera, O.D.; Díaz, C. Dificultades de estudiantes de psicología en la comprensión del contraste de hipótesis [Psychology students’ difficulties on understanding the contrast of hypotheses]. Números. Rev. Didáctica Matemáticas 2012, 80, 91–101. [Google Scholar]
  8. López-Martín, M.M.; Batanero, C.; Gea, M.M.; Arteaga, P. Assessing prospective high school teachers’ understanding of statistical hypotheses. In INTED 2018, Proceedings of the 12th International Technology, Education and Development Conference, Valencia, Spain, 5–7 March 2018; Gómez, L., López, A., Candel, I., Eds.; IATED: Valencia, Spain, 2018; pp. 2808–2813. [Google Scholar] [CrossRef]
  9. Batanero, C. Del análisis de datos a la inferencia: Reflexiones sobre la formación del razonamiento estadístico [Reflections on the formation of statistical reasoning]. Cuad. Investig. Form. Educ. Matemática 2013, 11, 277–291. [Google Scholar]
  10. Zieffler, A.; Garfield, J.; delMas, R.; Reading, C. A framework to support research on informal inferential reasoning. Stat. Educ. Res. J. 2008, 7, 40–58. [Google Scholar]
  11. Makar, K.; Rubin, A. A framework for thinking about informal statistical inference. Stat. Educ. Res. J. 2009, 8, 82–105. [Google Scholar]
  12. Doerr, H.M.; delMas, R.; Makar, K. A modeling approach to the development of students’ informal inferential reasoning. Stat. Educ. Res. J. 2017, 16, 86–115. [Google Scholar] [CrossRef]
  13. Jacob, B.L.; Doerr, H.M. Statistical reasoning with the sampling distribution. Quadrante 2014, 23, 123–146. [Google Scholar] [CrossRef]
  14. Pfannkuch, M.; Arnold, P.; Wild, C.J. What I see is not quite the way it really is: Students’ emergent reasoning about sampling variability. Educ. Stud. Math. 2015, 88, 343–360. [Google Scholar] [CrossRef]
  15. Makar, K.; Rubin, A. Learning about statistical inference. In International Handbook of Research in Statistics Education, 1st ed.; Ben-Zvi, D., Makar, K., Garfield, J., Eds.; Springer International: Cham, Switzerland, 2018; pp. 261–294. [Google Scholar] [CrossRef]
  16. Nilsson, P.; Schindler, M.; Bakker, A. The Nature and Use of Theories in Statistics Education. In International Handbook of Research in Statistics Education, 1st ed.; Ben-Zvi, D., Makar, K., Garfield, J., Eds.; Springer International: Cham, Switzerland, 2018; pp. 359–386. [Google Scholar] [CrossRef]
  17. Bakker, A.; Ben-Zvi, D.; Makar, K. An inferentialist perspective on the coordination of actions and reasons involved in making a statistical inference. Math. Educ. Res. J. 2017, 29, 455–470. [Google Scholar] [CrossRef] [Green Version]
  18. Cañadas, G.R.; Díaz, C.; Batanero, C.; Estepa, A. Precisión de los Estudiantes de Psicología en la Estimación de la Asociación [Psychology student’s estimation of association]. Bolema Bol. Educ. Matemática 2013, 27, 759–778. [Google Scholar] [CrossRef] [Green Version]
  19. Cañadas, G.R.; Batanero, C.; Arteaga, P.; Gea, M.M. Medidas de asociación en tablas 2 × 2: Evaluación de una experiencia de enseñanza con estudiantes universitarios [Association coefficients in 2 × 2 tables: Assessing a teaching experience with university students]. In Investigación en Educación Matemática XVIII; González, M.T., Codes, M., Arnau, D., Ortega, T., Eds.; SEIEM: Salamanca, Spain, 2014; pp. 207–216. [Google Scholar]
  20. Cañadas, G.; Arteaga, P.; Contreras, J.M.; Gea, M.M. Comprensión de medidas de asociación en tablas RxC por estudiantes de psicología [Measures of association in tables RxC for student’s in Psychology]. In Investigación en Educación Matemática XX; Berciano, A., Fernández, C., Fernández, T., González, J.L., Hernández, P., Jiménez, A., Macías, J.A., Ruiz, F.J., Sánchez, M.T., Eds.; SEIEM: Malaga, Spain, 2016; pp. 187–196. [Google Scholar]
  21. Estrada, A.; Díaz, C. Computing probabilities from two way tables. In An exploratory study with future teachers. In Proceedings of Seventh International Conference on Teaching of Statistics, Bahia, Salvador; Rossman, A., Chance, B., Eds.; International Association for Statistical Education: Bahia, Salvador, 2006; pp. 1–4. [Google Scholar]
  22. Batanero, C.; Estepa, A.; Godino, J.D.; Green, D.R. Intuitive strategies and preconceptions about association in contingency tables. J. Res. Math. Educ. 1996, 27, 151–169. [Google Scholar] [CrossRef]
  23. Cañadas, G.R.; Batanero, C.; Díaz, C.; Roa, R. Psychology students’ understanding of the Chi-squared test. Stat. Enseign. 2012, 3, 3–18. [Google Scholar]
  24. Cañadas, G.; Batanero, C.; Díaz, C.; Gea, M.M. Comprensión del test chi-cuadrado por estudiantes de Psicología [undertanding of chi-squared test by psychology students]. In Investigación en Educación Matemática XVI; Estepa, A., Contreras, A., Deulofeu, J., Penalva, M.C., García, F.J., Ordóñez, L., Eds.; Universidad de Granada: Granada, Spain, 2012; pp. 153–163. [Google Scholar]
  25. Contreras, J.M.; Estrada, A.; Díaz, C.; Batanero Bernabeu, M.D.C. Dificultades de futuros profesores en la lectura y cálculo de probabilidades de doble entrada [Difficulties of future teachers in reading and calculating double-entry probabilities]. In Investigación en Educación Matemática XIV; Moreno, M.M., Estrada, A., Carrillo, J., Sierra, T.A., Eds.; SEIEM: Lleida, Spain, 2010; pp. 271–280. [Google Scholar]
  26. Lugo-Armenta, J.G.; Pino-Fan, L.R. An approach to inferential reasoning levels. Educ. Stud. Math. 2021. submitted. [Google Scholar]
  27. Ben-Zvi, D.; Garfield, J.B. Statistical Literacy, Reasoning, and Thinking: Goals, Definitions, and Challenges. In The Challenge of Developing Statistical Literacy, Reasoning and Thinking, 1st ed.; Ben-Zvi, D., Garfield, J., Eds.; Springer: Dordrecht, The Netherlands, 2004; pp. 3–16. [Google Scholar] [CrossRef]
  28. Lugo-Armenta, J.G.; Pino-Fan, L.R. Niveles de razonamiento inferencial para el estadístico t-Student [Inferential reasoning Levels about the t-Student statistic]. Bolema Bol. Educ. Matemática 2021, 71, in press. [Google Scholar]
  29. Godino, J.D.; Batanero, C.; Font, V. The onto-semiotic approach to research in mathematics education. ZDM Int. J. Math. Educ. 2007, 39, 127–135. [Google Scholar] [CrossRef] [Green Version]
  30. Godino, J.D.; Batanero, C.; Font, V. The onto-semiotic approach: Implications for the prescriptive character of didactics. Learn. Math. 2019, 39, 37–42. [Google Scholar]
  31. Godino, J.D.; Batanero, C. Significado institucional y personal de los objetos matemáticos [Institutional and personal meaning of mathematical objects]. Rech. Didact. Mathématiques 1994, 14, 325–355. [Google Scholar]
  32. Godino, J.D.; Font, V.; Wilhelmi, M.R.; Lurduy, O. Why is the learning of elementary arithmetic concepts difficult? Semiotic tools for understanding the nature of mathematical objects. Educ. Stud. Math. 2011, 77, 247–265. [Google Scholar] [CrossRef]
  33. Pino-Fan, L.R.; Godino, J.D.; Font, V. Assessing key epistemic features of didactic-mathematical knowledge of prospective teachers: The case of the derivative. J. Math. Teach. Educ. 2018, 21, 63–94. [Google Scholar] [CrossRef]
  34. Font, V.; Rubio, N.V. Procesos matemáticos en el enfoque ontosemiótico [Mathematical processes in the onto-semiotic approach]. In Actas del Segundo Congreso Internacional Virtual de Educación Estadística; Contreras, J.M., Arteaga, P., Cañadas, G.R., Gea, M.M., Giacomone, B., López-Martín, M.M., Eds.; Departamento de Didáctica de la Matemática, Universidad de Granada: Granda, Spain, 2017. [Google Scholar]
  35. Lugo-Armenta, J.G.; Pino-Fan, L.R.; Ruiz, B.R. Chi-square reference meanings: A historical-epistemological overview. Revemop 2021, 3, 1–33. [Google Scholar] [CrossRef]
  36. Cohen, L.; Manion, L.; Morrison, K. Research Methods in Education, 6th ed.; Routledge: New York, NY, USA, 2011. [Google Scholar]
  37. Lugo-Armenta, J.G.; Pino-Fan, L.R. Inferential statistical reasoning of math teachers: Experiences in virtual contexts generated by the COVID-19 pandemic. Educ. Sci. 2021, 11, 363. [Google Scholar] [CrossRef]
  38. Galton, F., IV. Statistics by intercomparison, with remarks on the law of frequency of error. Lond. Edinb. Dublin Philos. Mag. J. Sci. 1875, 49, 33–46. [Google Scholar] [CrossRef]
  39. Pfannkuch, M.; Wild, C. Towards an understanding of statistical thinking. In The Challenge of Developing Statistical Literacy, Reasoning and Thinking, 1st ed.; Ben-Zvi, D., Garfield, J., Eds.; Kluwer Academic Publishers: Dordrecht, The Netherlands, 2004; pp. 17–46. [Google Scholar] [CrossRef]
  40. Pfannkuch, M.; Budgett, S.; Fewster, R.; Fitch, M.; Pattenwise, S.; Wild, C.; Ziedins, I. Probability modeling and thinking: What can we learn from practice? Stat. Educ. Res. J. 2016, 15, 11–37. [Google Scholar] [CrossRef]
  41. Stohl Lee, H.; Angotti, R.L.; Tarr, J.E. Making comparisons between observed data and expected outcomes: Students’ informal hypothesis testing with probability simulation tools. Stat. Educ. Res. J. 2010, 9, 68–96. [Google Scholar]
  42. Chance, B.; Rossman, A. Using simulation to teach and learn statistics. In Proceedings of the Seventh International Conference on Teaching Statistics, Voorburg, The Netherlands, 2–7 July 2006; International Statistical Institute: Voorburg, The Netherlands; pp. 1–6. [Google Scholar]
  43. Tintle, N.L.; Topliff, K.; Van der Stoep, J.; Holmes, V.L.; Swanson, T. Retention of statistical concepts in a preliminary randomization-based introductory statistics curriculum. Stat. Educ. Res. J. 2012, 11, 21–40. [Google Scholar] [CrossRef]
  44. Rossman, A.J.; Chance, B.L. Using simulation-based inference for learning introductory statistics. Wiley Interdiscip. Rev. Comput. Stat. 2014, 6, 211–221. [Google Scholar] [CrossRef]
  45. Fisher, R.A. Statistical Methods for Research Workers, 1st ed.; Oliver and Boyd: Edinburgh, Scotland, 1925. [Google Scholar]
  46. Rossman, A.J. Reasoning about Informal Statistical Inference: One Statistician’s View. Stat. Educ. Res. J. 2008, 7, 5–19. [Google Scholar]
  47. Yule, G.U. On the association of attributes in statistics: With illustrations from the material of the childhood society. Philos. Trans. R. Soc. Lond. 1900, 194, 257–319. [Google Scholar] [CrossRef] [Green Version]
  48. Batanero, C.; Borovcnik, M. Statistics and Probability in High School; Sense Publishers: Rotterdam, The Netherlands, 2016. [Google Scholar] [CrossRef]
  49. Batanero, C.; Gea, M.M.; Álvarez-Arroyo, R. Comprendiendo la independencia y el condicionamiento [Understanding independence and conditioning]. UNO Rev. Didáctica Mat. 2020, 89, 7–13. [Google Scholar]
  50. Wild, C.; Pfannkuch, M. Statistical thinking in empirical enquiry. Int. Stat. Rev. 1999, 67, 223–248. [Google Scholar] [CrossRef]
  51. Bakker, A.; Gravemeijer, K. Learning to reason about distribution. In The Challenge of Developing Statistical Literacy, Reasoning, and Thinking; Ben-Zvi, D., Garfield, J., Eds.; Kluwer Academic Publishers: Dordrecht, The Netherlands, 2004; pp. 147–168. [Google Scholar] [CrossRef]
  52. Reading, C.; Reid, J. An emerging hierarchy of reasoning about distribution: From a variation perspective. Stat. Educ. Res. J. 2006, 5, 46–68. [Google Scholar]
  53. Dinov, I.D.; Palanimalai, S.; Khare, A.; Christou, N. Randomization-based statistical inference: A resampling and simulation infrastructure. Teach. Stat. 2018, 40, 64–73. [Google Scholar] [CrossRef] [PubMed]
  54. Bakker, A.; Derry, J. Lessons from inferentialism for statistics education. Math. Think. Learn. 2011, 13, 5–26. [Google Scholar] [CrossRef]
  55. Makar, K.; Ben-Zvi, D. The Role of Context in Developing Reasoning about Informal Statistical Inference. Math. Think. Learn. 2011, 13, 1–4. [Google Scholar] [CrossRef]
  56. Vallecillos, A. El papel de las hipótesis estadísticas en los contrastes: Concepciones y dificultades de aprendizaje [The role of statistical hypotheses on contrasts: Conceptions and learning difficulties]. Educ. Matemática 1997, 9, 5–20. [Google Scholar]
  57. López-Martín, M.M.; Batanero, C.; Gea, M.M. ¿Conocen los futuros profesores los errores de sus estudiantes en la inferencia estadística? [Do prospective teachers know their students’ errors in statistical inference?]. Bolema Bol. Educ. Matemática 2019, 33, 672–693. [Google Scholar] [CrossRef] [Green Version]
  58. Inzunza, S.; Jiménez, J.V. Caracterización del razonamiento estadístico de estudiantes universitarios acerca de las pruebas de hipótesis [The characteristics of college students’ statistical reasoning on hypothesis testing]. Rev. Latinoam. Investig. Matemática Educ. 2013, 16, 179–211. [Google Scholar] [CrossRef]
  59. Cohen, J. Cosas que he aprendido (hasta ahora) [Things I have learned (up to now)]. An. Psicol. Ann. Psychol. 1992, 8, 3–18. [Google Scholar]
  60. Batanero, C. Treinta años de investigación didáctica sobre el análisis inferencial de datos [Thirty years of educational research on inferential data analysis]. In Rutas de la Educación Matemática; Avila, A., Ed.; Sociedad Mexicana de Investigación y divulgación de la Educación Matemática: Mexico City, Mexico, 2018; pp. 186–199. [Google Scholar]
  61. DePaolo, C.A.; Robinson, D.F.; Jacobs, A. Café Data 2.0: New Data from a New and Improved Café. J. Stat. Educ. 2016, 24, 85–103. [Google Scholar] [CrossRef] [Green Version]
  62. Fellers, P.S.; Kuiper, S. Introducing Undergraduates to Concepts of Survey Data Analysis. J. Stat. Educ. 2020, 28, 18–24. [Google Scholar] [CrossRef]
  63. Woodard, V.; Lee, H.; Woodard, R. Writing Assignments to Assess Statistical Thinking. J. Stat. Educ. 2020, 28, 32–44. [Google Scholar] [CrossRef]
  64. Gibbs, A.L.; Goossens, E.T. The Evidence for Efficacy of HPV Vaccines: Investigations in Categorical Data Analysis. J. Stat. Educ. 2013, 21. [Google Scholar] [CrossRef]
Figure 1. The practice of Team 1 of prospective teachers (G1) on Activity 1 (Retrieved from [37]).
Mathematics 09 02416 g001
Figure 2. The practice of Team 3 of practicing teachers (G3) on Activity 1.
Mathematics 09 02416 g002
Figure 3. The practice of the prospective Teacher 21 (G2) on Activity 1.
Mathematics 09 02416 g003
Figure 4. The practice of the prospective Teacher 5 (G2) on Activity 1.
Mathematics 09 02416 g004
Figure 5. The practice of prospective Teacher 11 (G2) on Activity 1.
Mathematics 09 02416 g005
Figure 6. The practice of Team 2 of prospective teachers (G1) on Activity 2.
Mathematics 09 02416 g006
Figure 7. The practice of Team 5 of prospective teachers (G3) on Activity 2 (retrieved from [37]).
Mathematics 09 02416 g007
Figure 8. The practice of Team 4 of prospective teachers (G1) on Activity 2.
Mathematics 09 02416 g008
Figure 9. The practice of the prospective Teacher 17 (G2) on Activity 2.
Mathematics 09 02416 g009
Publisher’s Note: MDPI stays neutral with regard to jurisdictional claims in published maps and institutional affiliations.

