
A Two Phase Integrated Fuzzy Decision-Making Framework for Green Supplier Selection in the Coffee Bean Supply Chain


Abstract
:1. Introduction
- To understand and identify evaluation criteria for GSS from a supply chain context in Vietnam.
- To calculate the relative importance weights of the GSS evaluation criteria for the supply chain.
- To select the most potential green supplier from a set of alternatives in supply chain.
- To put forward managerial and practical implications of the proposed work.
2. Literature Review
2.1. Literature Review on GSS Approaches and Criteria Selection
2.2. Literature Review on Proposed Methodologies
3. Methodology
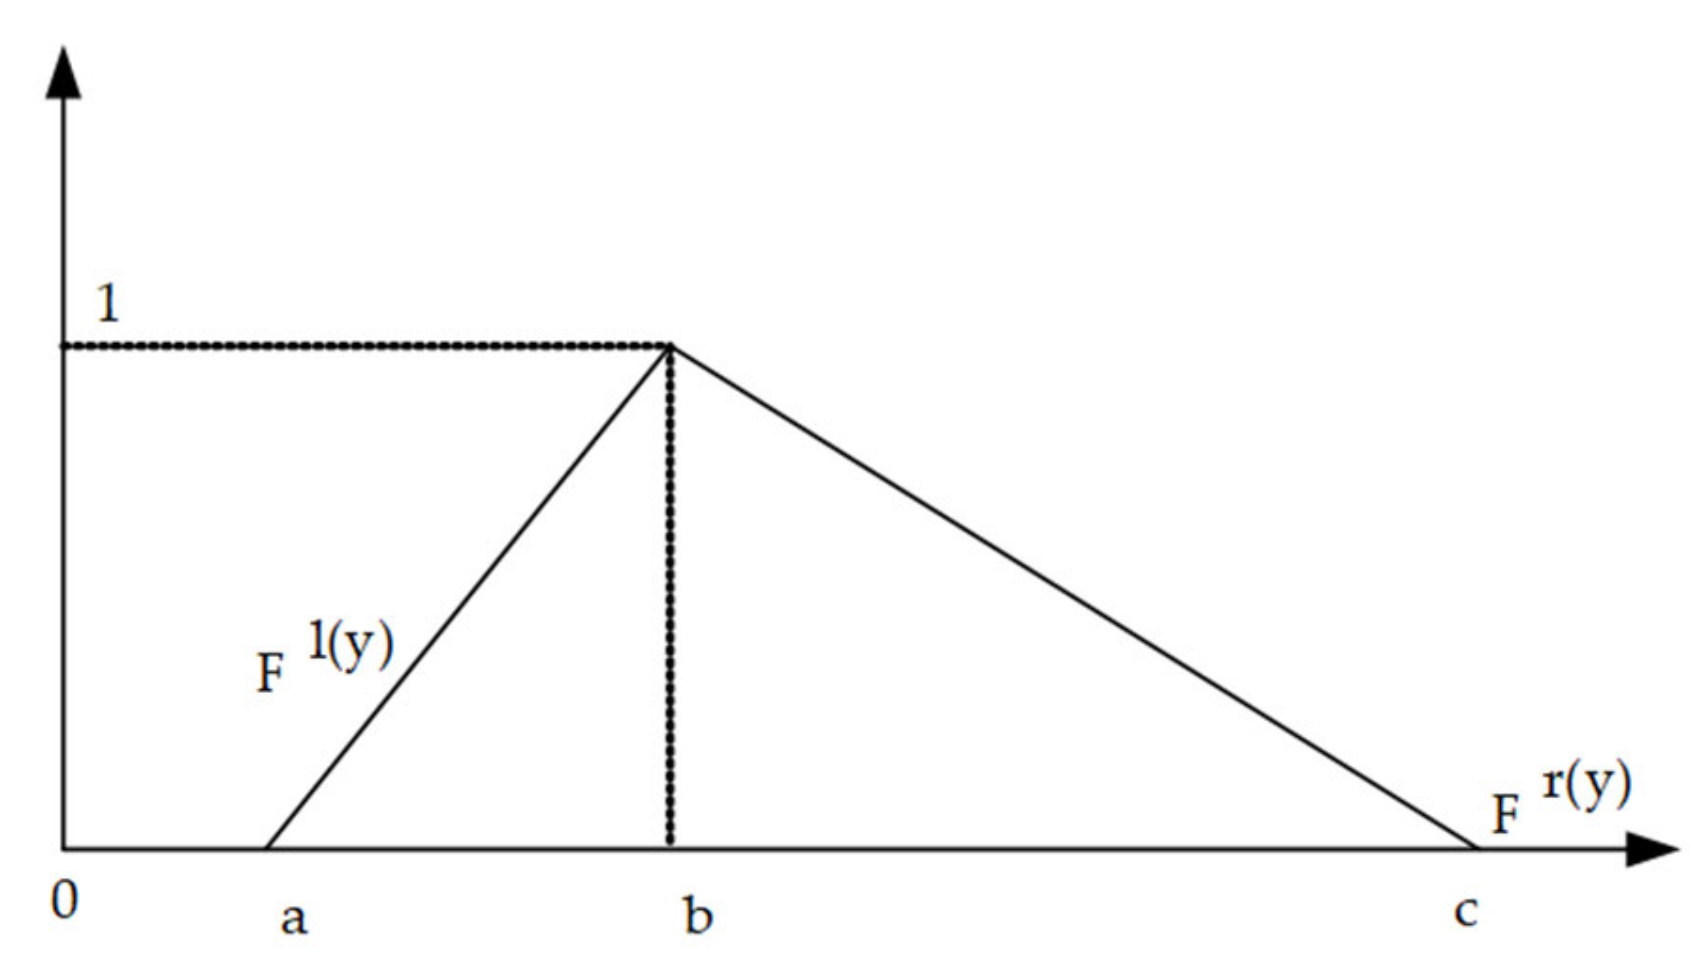
3.1. Fuzzy Analytical Hierarchy Process (FAHP)
3.2. Visekriterijumska Optimizacija I Kompromisno Resenje (VIKOR)
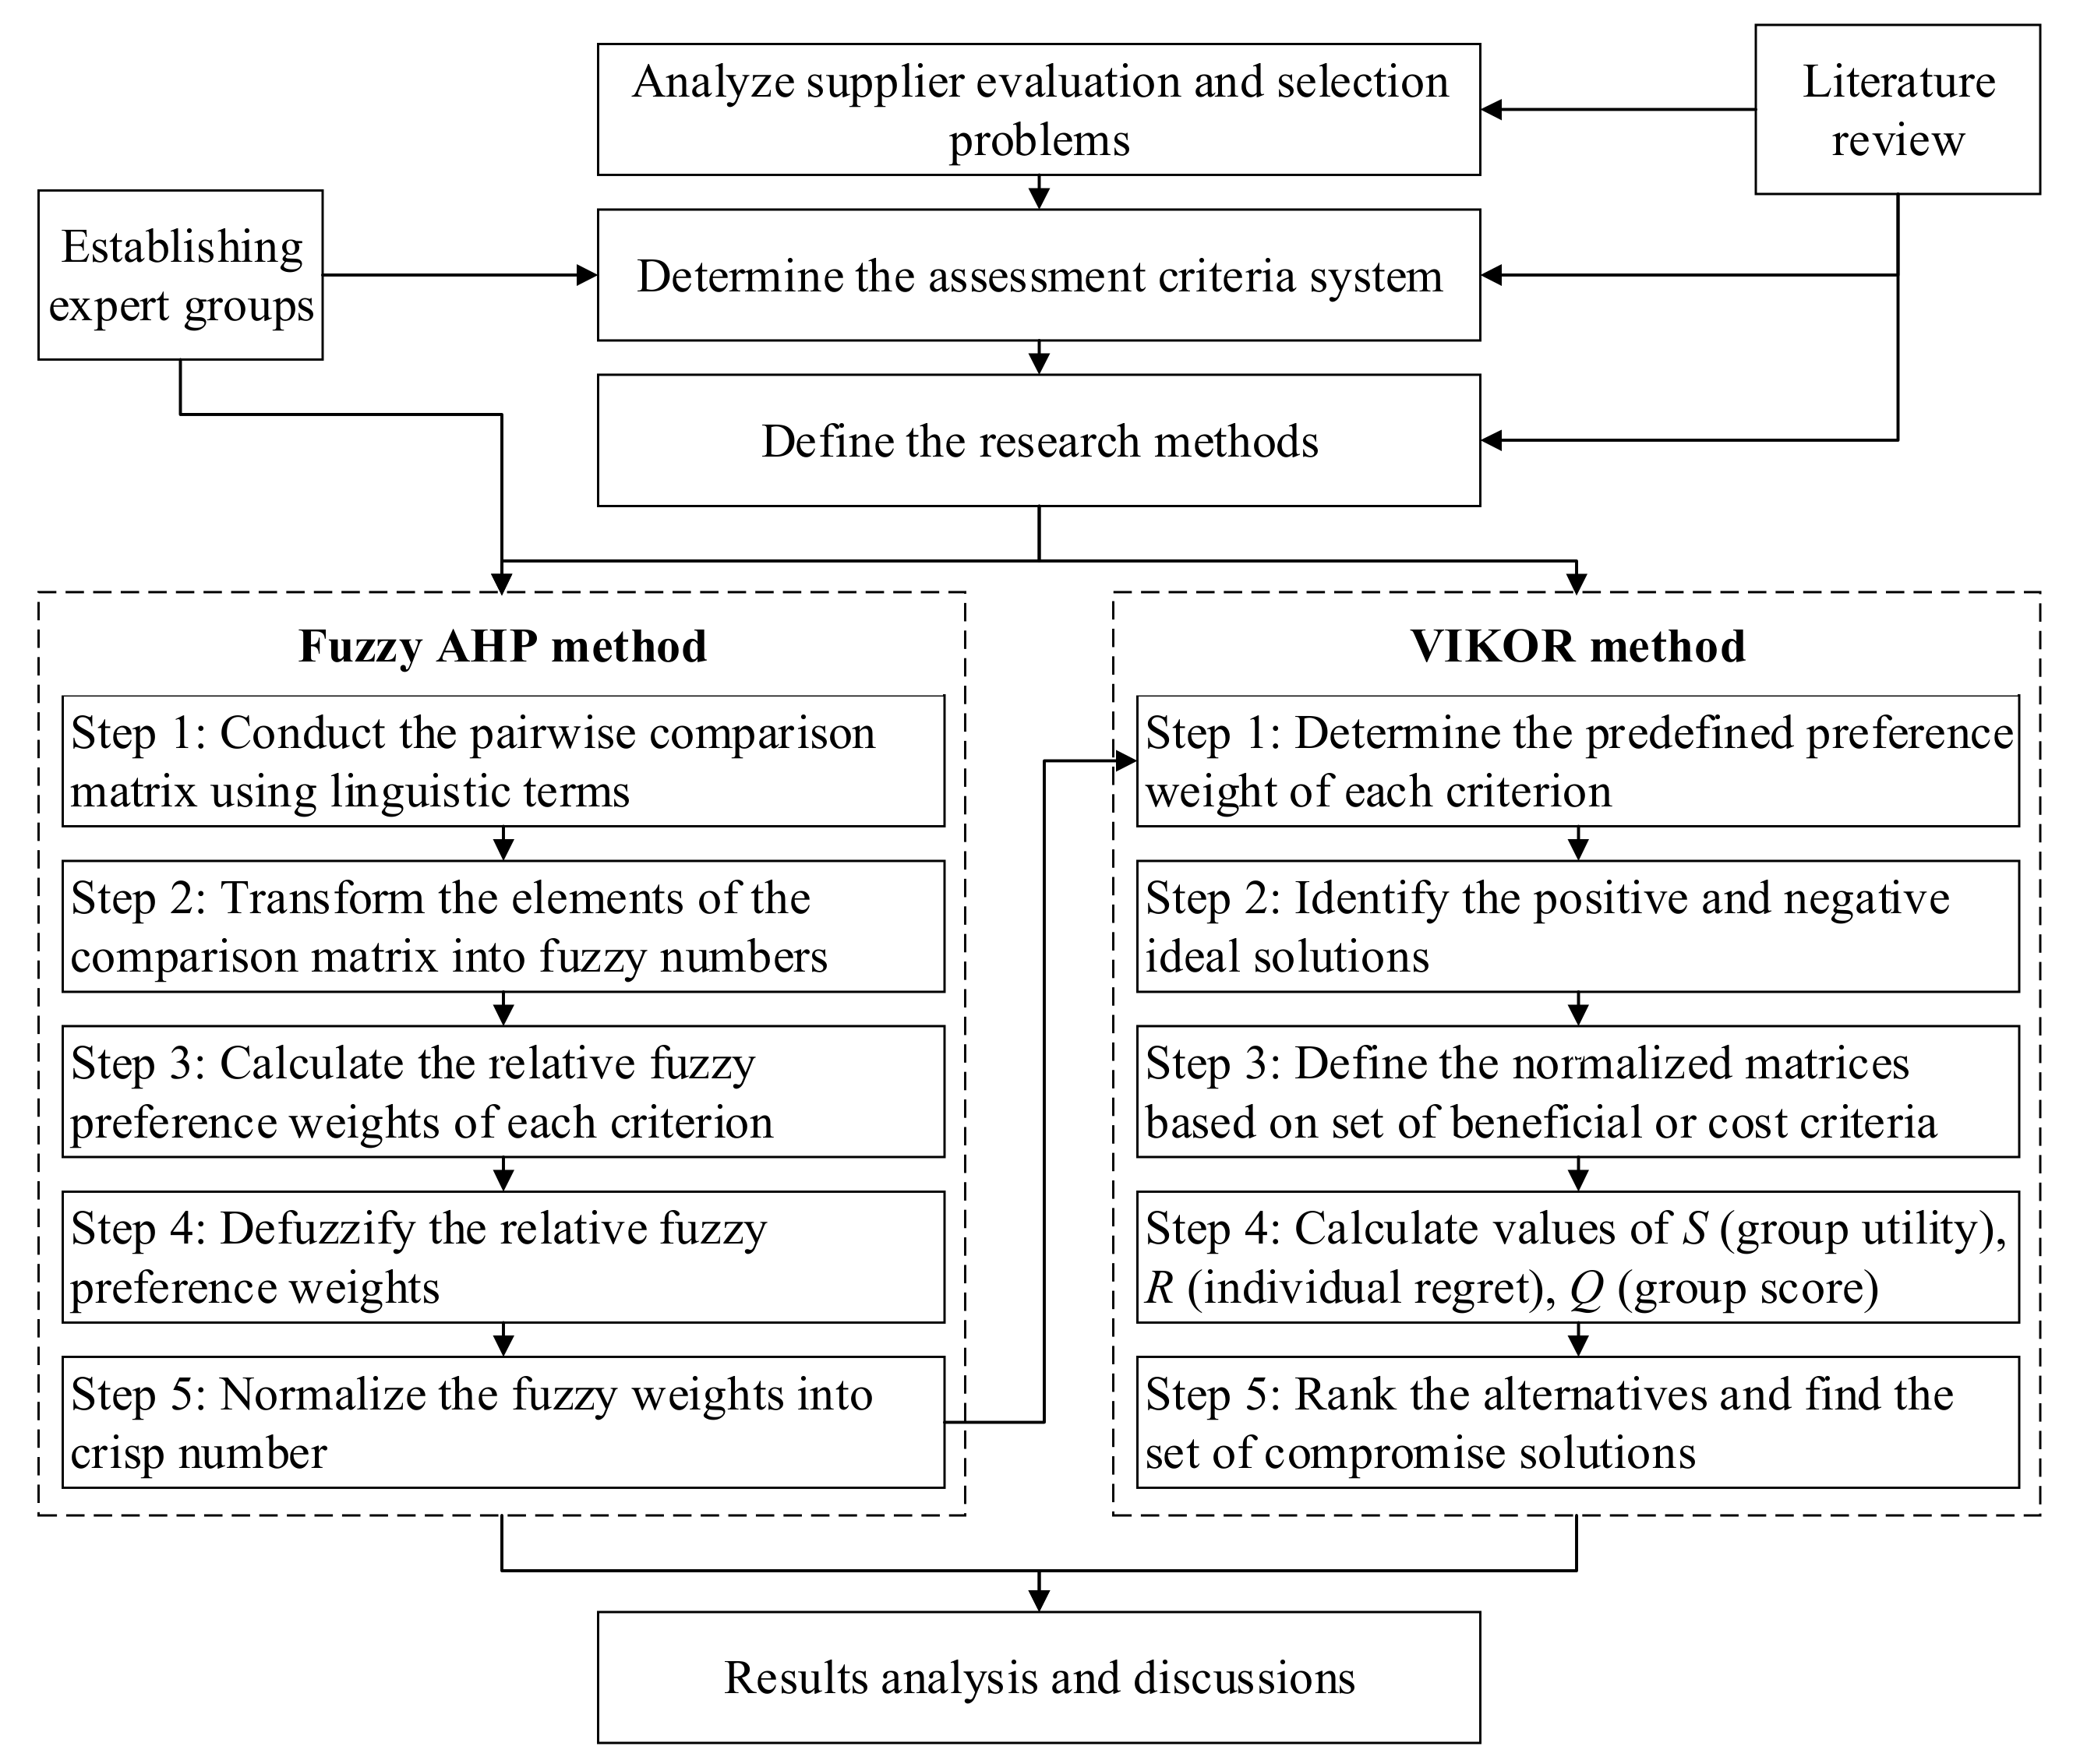
3.3. Research Framwork
4. Case Study and Results Analysis
4.1. Case Study
4.2. Results of FAHP
4.3. Results of VIKOR
5. Discussions and Conclusions
Author Contributions
Funding
Institutional Review Board Statement
Informed Consent Statement
Data Availability Statement
Acknowledgments
Conflicts of Interest
Appendix A

| Criteria | Linguistics Variables | Criteria | ||||||||||||||||
|---|---|---|---|---|---|---|---|---|---|---|---|---|---|---|---|---|---|---|
| (8, 9, 10) | (7, 8, 9) | (6, 7, 8) | (5, 6, 7) | (4, 5, 6) | (3, 4, 5) | (2, 3, 4) | (1, 2, 3) | (1, 1, 1) | (1, 2, 3) | (2, 3, 4) | (3, 4, 5) | (4, 5, 6) | (5, 6, 7) | (6, 7, 8) | (7, 8, 9) | (8, 9, 10) | ||
| C11 | 3 | 1 | 1 | C12 | ||||||||||||||
| C11 | 2 | 3 | C13 | |||||||||||||||
| C11 | 4 | 1 | C21 | |||||||||||||||
| C11 | 1 | 2 | 2 | C22 | ||||||||||||||
| C11 | 1 | 3 | 1 | C23 | ||||||||||||||
| C11 | 1 | 3 | 1 | C31 | ||||||||||||||
| C11 | 3 | 2 | C32 | |||||||||||||||
| C11 | 3 | 2 | C41 | |||||||||||||||
| C11 | 2 | 1 | 2 | C42 | ||||||||||||||
| C11 | 1 | 2 | 2 | C51 | ||||||||||||||
| C11 | 1 | 2 | 2 | C52 | ||||||||||||||
| C11 | 1 | 2 | 2 | C53 | ||||||||||||||
| C11 | 1 | 2 | 2 | C54 | ||||||||||||||
| C11 | 1 | 1 | 1 | 2 | C55 | |||||||||||||
| C12 | 2 | 2 | 1 | C13 | ||||||||||||||
| C12 | 2 | 2 | 1 | C21 | ||||||||||||||
| C12 | 2 | 2 | 1 | C22 | ||||||||||||||
| C12 | 1 | 2 | 1 | 1 | C23 | |||||||||||||
| C12 | 1 | 2 | 1 | 1 | C31 | |||||||||||||
| C12 | 2 | 2 | 1 | C32 | ||||||||||||||
| C12 | 1 | 2 | 1 | 1 | C41 | |||||||||||||
| C12 | 3 | 2 | C42 | |||||||||||||||
| C12 | 4 | 1 | C51 | |||||||||||||||
| C12 | 3 | 2 | C52 | |||||||||||||||
| C12 | 3 | 2 | C53 | |||||||||||||||
| C12 | 2 | 1 | 2 | C54 | ||||||||||||||
| C12 | 2 | 1 | 2 | C55 | ||||||||||||||
| C13 | 2 | 2 | 1 | C21 | ||||||||||||||
| C13 | 2 | 2 | 1 | C22 | ||||||||||||||
| C13 | 1 | 2 | 2 | C23 | ||||||||||||||
| C13 | 1 | 2 | 2 | C31 | ||||||||||||||
| C13 | 2 | 2 | 1 | C32 | ||||||||||||||
| C13 | 2 | 3 | C41 | |||||||||||||||
| C13 | 1 | 1 | 3 | C42 | ||||||||||||||
| C13 | 2 | 3 | C51 | |||||||||||||||
| C13 | 1 | 2 | 2 | C52 | ||||||||||||||
| C13 | 1 | 2 | 2 | C53 | ||||||||||||||
| C13 | 1 | 2 | 2 | C54 | ||||||||||||||
| C13 | 3 | 1 | 1 | C55 | ||||||||||||||
| C21 | 2 | 3 | C22 | |||||||||||||||
| C21 | 1 | 3 | 1 | C23 | ||||||||||||||
| C21 | 1 | 3 | 1 | C31 | ||||||||||||||
| C21 | 3 | 2 | C32 | |||||||||||||||
| C21 | 3 | 2 | C41 | |||||||||||||||
| C21 | 3 | 2 | C42 | |||||||||||||||
| C21 | 3 | 2 | C51 | |||||||||||||||
| C21 | 3 | 2 | C52 | |||||||||||||||
| C21 | 2 | 1 | 2 | C53 | ||||||||||||||
| C21 | 2 | 1 | 2 | C54 | ||||||||||||||
| C21 | 2 | 3 | C55 | |||||||||||||||
| C22 | 2 | 1 | 1 | 1 | C23 | |||||||||||||
| C22 | 1 | 1 | 1 | 1 | 1 | C31 | ||||||||||||
| C22 | 1 | 1 | 1 | 2 | C32 | |||||||||||||
| C22 | 1 | 1 | 1 | 2 | C41 | |||||||||||||
| C22 | 1 | 1 | 1 | 1 | 1 | C42 | ||||||||||||
| C22 | 1 | 2 | 1 | 1 | C51 | |||||||||||||
| C22 | 3 | 2 | C52 | |||||||||||||||
| C22 | 1 | 1 | 2 | 1 | C53 | |||||||||||||
| C22 | 1 | 1 | 2 | 1 | C54 | |||||||||||||
| C22 | 1 | 1 | 2 | 1 | C55 | |||||||||||||
| C23 | 2 | 1 | 2 | C31 | ||||||||||||||
| C23 | 1 | 2 | 1 | 1 | C32 | |||||||||||||
| C23 | 1 | 2 | 1 | 1 | C41 | |||||||||||||
| C23 | 2 | 1 | 2 | C42 | ||||||||||||||
| C23 | 2 | 1 | 2 | C51 | ||||||||||||||
| C23 | 1 | 1 | 3 | C52 | ||||||||||||||
| C23 | 1 | 2 | 2 | C53 | ||||||||||||||
| C23 | 2 | 2 | 1 | C54 | ||||||||||||||
| C23 | 1 | 2 | 2 | C55 | ||||||||||||||
| C31 | 1 | 2 | 2 | C32 | ||||||||||||||
| C31 | 2 | 2 | 1 | C41 | ||||||||||||||
| C31 | 1 | 3 | 1 | C42 | ||||||||||||||
| C31 | 3 | 2 | C51 | |||||||||||||||
| C31 | 3 | 2 | C52 | |||||||||||||||
| C31 | 3 | 2 | C53 | |||||||||||||||
| C31 | 1 | 3 | 1 | C54 | ||||||||||||||
| C31 | 1 | 3 | 1 | C55 | ||||||||||||||
| C32 | 3 | 2 | C41 | |||||||||||||||
| C32 | 2 | 1 | 2 | C42 | ||||||||||||||
| C32 | 3 | 2 | C51 | |||||||||||||||
| C32 | 2 | 1 | 2 | C52 | ||||||||||||||
| C32 | 1 | 3 | 1 | C53 | ||||||||||||||
| C32 | 3 | 1 | 1 | C54 | ||||||||||||||
| C32 | 1 | 1 | 2 | 1 | C55 | |||||||||||||
| C41 | 3 | 1 | 1 | C42 | ||||||||||||||
| C41 | 1 | 1 | 2 | 1 | C51 | |||||||||||||
| C41 | 3 | 1 | 1 | C52 | ||||||||||||||
| C41 | 3 | 1 | 1 | C53 | ||||||||||||||
| C41 | 3 | 1 | 1 | C54 | ||||||||||||||
| C41 | 1 | 1 | 2 | 1 | C55 | |||||||||||||
| C42 | 3 | 1 | 1 | C51 | ||||||||||||||
| C42 | 1 | 1 | 2 | 1 | C52 | |||||||||||||
| C42 | 1 | 3 | 1 | C53 | ||||||||||||||
| C42 | 1 | 3 | 1 | C54 | ||||||||||||||
| C42 | 2 | 2 | 1 | C55 | ||||||||||||||
| C51 | 3 | 2 | C52 | |||||||||||||||
| C51 | 1 | 3 | 1 | C53 | ||||||||||||||
| C51 | 1 | 2 | 2 | C54 | ||||||||||||||
| C51 | 1 | 2 | 2 | C55 | ||||||||||||||
| C52 | 1 | 2 | 2 | C53 | ||||||||||||||
| C52 | 2 | 2 | 1 | C54 | ||||||||||||||
| C52 | 1 | 3 | 1 | C55 | ||||||||||||||
| C53 | 3 | 2 | C54 | |||||||||||||||
| C53 | 2 | 1 | 2 | C55 | ||||||||||||||
| C54 | 3 | 1 | 1 | C55 | ||||||||||||||
| Aspects | Linguistics Variables | Aspects | ||||||||||||||||
|---|---|---|---|---|---|---|---|---|---|---|---|---|---|---|---|---|---|---|
| (8, 9, 10) | (7, 8, 9) | (6, 7, 8) | (5, 6, 7) | (4, 5, 6) | (3, 4, 5) | (2, 3, 4) | (1, 2, 3) | (1, 1, 1) | (1, 2, 3) | (2, 3, 4) | (3, 4, 5) | (4, 5, 6) | (5, 6, 7) | (6, 7, 8) | (7, 8, 9) | (8, 9, 10) | ||
| C1 | x | C2 | ||||||||||||||||
| C1 | x | C3 | ||||||||||||||||
| C1 | x | C4 | ||||||||||||||||
| C1 | x | C5 | ||||||||||||||||
| C2 | x | C3 | ||||||||||||||||
| C2 | x | C4 | ||||||||||||||||
| C2 | x | C5 | ||||||||||||||||
| C3 | x | C4 | ||||||||||||||||
| C3 | x | C5 | ||||||||||||||||
| C4 | x | C5 | ||||||||||||||||
| Aspects | Quality (C1) | Cost (C2) | Delivery (C3) | Technology (C4) | Environment (C5) |
|---|---|---|---|---|---|
| Quality (C1) | (1, 1, 1) | (1, 2, 3) | (1, 2, 3) | (2, 3, 4) | (1, 2, 3) |
| Cost (C2) | (1/3, 1/2, 1) | (1, 1, 1) | (3, 4, 5) | (2, 3, 4) | (1/3, 1/2, 1) |
| Delivery (C3) | (1/3, 1/2, 1) | (1/5, 1/4, 1/3) | (1, 1, 1) | (1/4, 1/3, 1/2) | (1/5, 1/4, 1/3) |
| Technology (C4) | (1/4, 1/3, 1/2) | (1/4, 1/3, 1/2) | (2, 3, 4) | (1, 1, 1) | (1/3, 1/2, 1) |
| Environment (C5) | (1/3, 1/2, 1) | (1, 2, 3) | (3, 4, 5) | (1, 2, 3) | (1, 1, 1) |
| Aspects | Quality (C1) | Cost (C2) | Delivery (C3) | Technology (C4) | Environment (C5) |
|---|---|---|---|---|---|
| Quality (C1) | 1 | 1.7321 | 1.7321 | 2.8284 | 1.7321 |
| Cost (C2) | 0.5774 | 1 | 3.8730 | 2.8284 | 0.5774 |
| Delivery (C3) | 0.5774 | 0.2582 | 1 | 0.3536 | 0.2582 |
| Technology (C4) | 0.3536 | 0.3536 | 2.8284 | 1 | 0.5774 |
| Environment (C5) | 0.5774 | 1.7321 | 3.8730 | 1.7321 | 1 |
| Total | 3.0856 | 5.0759 | 13.3064 | 8.7425 | 4.1450 |
| Aspects | Quality (C1) | Cost (C2) | Delivery (C3) | Technology (C4) | Environment (C5) | Priority Vector |
|---|---|---|---|---|---|---|
| Quality (C1) | 0.3241 | 0.3412 | 0.1302 | 0.3235 | 0.4179 | 0.3074 |
| Cost (C2) | 0.1871 | 0.1970 | 0.2911 | 0.3235 | 0.1393 | 0.2276 |
| Delivery (C3) | 0.1871 | 0.0509 | 0.0752 | 0.0404 | 0.0623 | 0.0832 |
| Technology (C4) | 0.1146 | 0.0697 | 0.2126 | 0.1144 | 0.1393 | 0.1301 |
| Environment (C5) | 0.1871 | 0.3412 | 0.2911 | 0.1981 | 0.2413 | 0.2518 |
| Total | 1 | 1 | 1 | 1 | 1 | 1 |
| Criteria | C11 | C12 | C13 | C21 | ||||||||
|---|---|---|---|---|---|---|---|---|---|---|---|---|
| C11. Supply availability | 1.00 | 1.00 | 1.00 | 1.22 | 1.93 | 2.86 | 0.52 | 0.87 | 1.55 | 0.31 | 0.46 | 0.87 |
| C12. Defect rate | 0.35 | 0.52 | 0.82 | 1.00 | 1.00 | 1.00 | 0.49 | 0.80 | 1.35 | 0.49 | 0.80 | 1.35 |
| C13. Customer complaint | 0.64 | 1.15 | 1.93 | 0.74 | 1.25 | 2.05 | 1.00 | 1.00 | 1.00 | 1.06 | 1.78 | 2.70 |
| C21. Purchasing cost | 1.15 | 2.17 | 3.18 | 0.74 | 1.25 | 2.05 | 0.37 | 0.56 | 0.94 | 1.00 | 1.00 | 1.00 |
| C22. Logistics cost | 0.49 | 0.80 | 1.35 | 0.74 | 1.25 | 2.05 | 0.74 | 1.25 | 2.05 | 0.30 | 0.43 | 0.76 |
| C23. Quantity discount | 0.39 | 0.61 | 1.08 | 0.56 | 0.87 | 1.43 | 0.49 | 0.80 | 1.35 | 0.39 | 0.61 | 1.08 |
| C31. Order fulfillment rate | 0.39 | 0.61 | 1.08 | 0.56 | 0.87 | 1.43 | 0.49 | 0.80 | 1.35 | 0.39 | 0.61 | 1.08 |
| C32. Just in time delivery | 0.52 | 0.87 | 1.55 | 0.74 | 1.25 | 2.05 | 1.64 | 2.70 | 3.73 | 2.35 | 3.37 | 4.37 |
| C41. Tracking and tracing system | 1.32 | 2.35 | 3.37 | 1.08 | 1.74 | 2.46 | 0.87 | 1.25 | 1.74 | 0.52 | 0.87 | 1.55 |
| C42. R&D capability | 0.46 | 0.74 | 1.18 | 1.32 | 2.35 | 3.37 | 1.22 | 1.93 | 2.86 | 0.52 | 0.87 | 1.55 |
| C51. Wastewater treatment | 1.06 | 1.78 | 2.70 | 0.26 | 0.36 | 0.57 | 0.87 | 1.25 | 1.74 | 0.52 | 0.87 | 1.55 |
| C52. Solid waste generation | 0.49 | 0.80 | 1.35 | 1.32 | 2.35 | 3.37 | 2.05 | 3.10 | 4.13 | 1.32 | 2.35 | 3.37 |
| C53. Energy consumption | 0.49 | 0.80 | 1.35 | 1.32 | 2.35 | 3.37 | 2.05 | 3.10 | 4.13 | 0.46 | 0.74 | 1.18 |
| C54. Air pollution | 0.49 | 0.80 | 1.35 | 0.46 | 0.74 | 1.18 | 2.05 | 3.10 | 4.13 | 0.46 | 0.74 | 1.18 |
| C55. Corporate social responsibility | 0.80 | 1.25 | 1.89 | 0.46 | 0.74 | 1.18 | 0.50 | 0.74 | 1.08 | 0.30 | 0.43 | 0.76 |
| Criteria | C22 | C23 | C31 | C32 | ||||||||
| C11. Supply availability | 0.74 | 1.25 | 2.05 | 0.92 | 1.64 | 2.55 | 0.92 | 1.64 | 2.55 | 0.64 | 1.15 | 1.93 |
| C12. Defect rate | 0.49 | 0.80 | 1.35 | 0.70 | 1.15 | 1.78 | 0.70 | 1.15 | 1.78 | 0.49 | 0.80 | 1.35 |
| C13. Customer complaint | 0.49 | 0.80 | 1.35 | 0.74 | 1.25 | 2.05 | 0.74 | 1.25 | 2.05 | 0.27 | 0.37 | 0.61 |
| C21. Purchasing cost | 1.32 | 2.35 | 3.37 | 0.92 | 1.64 | 2.55 | 0.92 | 1.64 | 2.55 | 0.23 | 0.30 | 0.43 |
| C22. Logistics cost | 1.00 | 1.00 | 1.00 | 0.80 | 1.25 | 1.89 | 0.87 | 1.32 | 1.97 | 2.99 | 4.04 | 5.07 |
| C23. Quantity discount | 0.53 | 0.80 | 1.25 | 1.00 | 1.00 | 1.00 | 1.78 | 2.86 | 3.90 | 0.92 | 1.43 | 2.05 |
| C31. Order fulfillment rate | 0.51 | 0.76 | 1.15 | 0.26 | 0.35 | 0.56 | 1.00 | 1.00 | 1.00 | 2.83 | 3.87 | 4.89 |
| C32. Just in time delivery | 0.20 | 0.25 | 0.33 | 0.49 | 0.70 | 1.08 | 0.20 | 0.26 | 0.35 | 1.00 | 1.00 | 1.00 |
| C41. Tracking and tracing system | 0.20 | 0.25 | 0.33 | 0.49 | 0.70 | 1.08 | 0.54 | 0.80 | 1.05 | 0.28 | 0.39 | 0.66 |
| C42. R&D capability | 0.51 | 0.76 | 1.15 | 0.35 | 0.40 | 0.46 | 0.34 | 0.51 | 0.87 | 0.85 | 1.35 | 2.17 |
| C51. Wastewater treatment | 0.56 | 0.87 | 1.43 | 0.35 | 0.40 | 0.46 | 0.28 | 0.39 | 0.66 | 0.28 | 0.39 | 0.66 |
| C52. Solid waste generation | 1.32 | 2.35 | 3.37 | 0.51 | 0.55 | 0.61 | 0.28 | 0.39 | 0.66 | 0.85 | 1.35 | 2.17 |
| C53. Energy consumption | 0.35 | 0.53 | 0.87 | 0.21 | 0.27 | 0.37 | 0.28 | 0.39 | 0.66 | 0.25 | 0.34 | 0.53 |
| C54. Air pollution | 0.35 | 0.53 | 0.87 | 0.26 | 0.30 | 0.37 | 0.34 | 0.51 | 0.87 | 0.40 | 0.56 | 0.87 |
| C55. Corporate social responsibility | 0.70 | 1.15 | 1.78 | 0.37 | 0.42 | 0.49 | 0.34 | 0.51 | 0.87 | 1.32 | 2.05 | 2.99 |
| Criteria | C41 | C42 | C51 | C52 | ||||||||
| C11. Supply availability | 0.30 | 0.43 | 0.76 | 0.85 | 1.35 | 2.17 | 0.37 | 0.56 | 0.94 | 0.74 | 1.25 | 2.05 |
| C12. Defect rate | 0.41 | 0.57 | 0.92 | 0.30 | 0.43 | 0.76 | 1.74 | 2.77 | 3.78 | 0.30 | 0.43 | 0.76 |
| C13. Customer complaint | 0.57 | 0.80 | 1.15 | 0.35 | 0.52 | 0.82 | 0.57 | 0.80 | 1.15 | 0.24 | 0.32 | 0.49 |
| C21. Purchasing cost | 0.64 | 1.15 | 1.93 | 0.64 | 1.15 | 1.93 | 0.64 | 1.15 | 1.93 | 0.30 | 0.43 | 0.76 |
| C22. Logistics cost | 2.99 | 4.04 | 5.07 | 0.87 | 1.32 | 1.97 | 0.70 | 1.15 | 1.78 | 0.30 | 0.43 | 0.76 |
| C23. Quantity discount | 0.92 | 1.43 | 2.05 | 2.17 | 2.51 | 2.83 | 2.17 | 2.51 | 2.83 | 1.64 | 1.82 | 1.97 |
| C31. Order fulfillment rate | 0.96 | 1.25 | 1.84 | 1.15 | 1.95 | 2.93 | 1.52 | 2.55 | 3.57 | 1.52 | 2.55 | 3.57 |
| C32. Just in time delivery | 1.52 | 2.55 | 3.57 | 0.46 | 0.74 | 1.18 | 1.52 | 2.55 | 3.57 | 0.46 | 0.74 | 1.18 |
| C41. Tracking and tracing system | 1.00 | 1.00 | 1.00 | 1.15 | 1.78 | 2.49 | 0.33 | 0.49 | 0.76 | 1.15 | 1.78 | 2.49 |
| C42. R&D capability | 0.40 | 0.56 | 0.87 | 1.00 | 1.00 | 1.00 | 1.93 | 2.64 | 3.27 | 1.00 | 1.32 | 1.72 |
| C51. Wastewater treatment | 1.32 | 2.05 | 2.99 | 0.31 | 0.38 | 0.52 | 1.00 | 1.00 | 1.00 | 0.30 | 0.43 | 0.76 |
| C52. Solid waste generation | 0.40 | 0.56 | 0.87 | 0.58 | 0.76 | 1.00 | 1.32 | 2.35 | 3.37 | 1.00 | 1.00 | 1.00 |
| C53. Energy consumption | 0.35 | 0.52 | 0.82 | 0.27 | 0.32 | 0.39 | 0.92 | 1.64 | 2.55 | 0.49 | 0.80 | 1.35 |
| C54. Air pollution | 0.35 | 0.52 | 0.82 | 0.27 | 0.32 | 0.39 | 0.49 | 0.80 | 1.35 | 0.37 | 0.56 | 0.94 |
| C55. Corporate social responsibility | 0.70 | 1.15 | 1.78 | 0.64 | 0.87 | 1.25 | 0.49 | 0.80 | 1.35 | 0.25 | 0.34 | 0.53 |
| Criteria | C53 | C54 | C55 | |||||||||
| C11. Supply availability | 0.74 | 1.25 | 2.05 | 0.74 | 1.25 | 2.05 | 0.53 | 0.80 | 1.25 | |||
| C12. Defect rate | 0.30 | 0.43 | 0.76 | 0.85 | 1.35 | 2.17 | 0.85 | 1.35 | 2.17 | |||
| C13. Customer complaint | 0.24 | 0.32 | 0.49 | 0.24 | 0.32 | 0.49 | 0.92 | 1.35 | 2.00 | |||
| C21. Purchasing cost | 0.85 | 1.35 | 2.17 | 0.85 | 1.35 | 2.17 | 1.32 | 2.35 | 3.37 | |||
| C22. Logistics cost | 1.15 | 1.89 | 2.83 | 1.15 | 1.89 | 2.83 | 0.56 | 0.87 | 1.43 | |||
| C23. Quantity discount | 2.70 | 3.73 | 4.74 | 2.70 | 3.31 | 3.90 | 2.05 | 2.40 | 2.72 | |||
| C31. Order fulfillment rate | 1.52 | 2.55 | 3.57 | 1.15 | 1.95 | 2.93 | 1.15 | 1.95 | 2.93 | |||
| C32. Just in time delivery | 1.89 | 2.93 | 3.95 | 1.15 | 1.78 | 2.49 | 0.33 | 0.49 | 0.76 | |||
| C41. Tracking and tracing system | 1.22 | 1.93 | 2.86 | 1.22 | 1.93 | 2.86 | 0.56 | 0.87 | 1.43 | |||
| C42. R&D capability | 2.55 | 3.17 | 3.76 | 2.55 | 3.17 | 3.76 | 0.80 | 1.15 | 1.55 | |||
| C51. Wastewater treatment | 0.39 | 0.61 | 1.08 | 0.74 | 1.25 | 2.05 | 0.74 | 1.25 | 2.05 | |||
| C52. Solid waste generation | 0.74 | 1.25 | 2.05 | 1.06 | 1.78 | 2.70 | 1.89 | 2.93 | 3.95 | |||
| C53. Energy consumption | 1.00 | 1.00 | 1.00 | 1.51 | 1.89 | 2.44 | 3.13 | 4.19 | 5.23 | |||
| C54. Air pollution | 0.41 | 0.53 | 0.66 | 1.00 | 1.00 | 1.00 | 2.48 | 3.10 | 3.86 | |||
| C55. Corporate social responsibility | 0.19 | 0.24 | 0.32 | 0.26 | 0.32 | 0.40 | 1.00 | 1.00 | 1.00 | |||
References
- Zhang, L.J.; Liu, R.; Liu, H.C.; Shi, H. Green supplier evaluation and selections: A state-of-the-art literature review of models, methods, and applications. Math. Probl. Eng. 2020, 2020, 1783421. [Google Scholar] [CrossRef]
- Your Supply Chain Needs a Sustainability Strategy. Available online: https://www.bcg.com/publications/2020/supply-chain-needs-sustainability-strategy (accessed on 12 July 2021).
- COVID-19 Impacts on Supply Chains, Sustainability and Climate Change. Available online: https://www2.deloitte.com/global/en/blog/responsible-business-blog/2020/covid-19-impacts-on-supply-chains-sustainability-and-climate-change.html (accessed on 12 July 2021).
- Gupta, S.; Soni, U.; Kumar, G. Green supplier selection using multi-criterion decision making under fuzzy environment: A case study in automotive industry. Comput. Ind. Eng. 2019, 136, 663–680. [Google Scholar] [CrossRef]
- Sánchez-Flores, R.B.; Cruz-Sotelo, S.E.; Ojeda-Benitez, S.; Ramírez-Barreto, M. Sustainable Supply Chain Management—A Literature Review on Emerging Economies. Sustainability 2020, 12, 6972. [Google Scholar] [CrossRef]
- Main Criteria in Supplier Evaluation. Available online: https://dnbvietnam.com/tu-van/tieu-chi-danh-gia-nha-cung-cap.html (accessed on 12 July 2021).
- Luthra, S.; Govindan, K.; Kannan, D.; Mangla, S.K.; Garg, C.P. An integrated framework for sustainable supplier selection and evaluation in supply chains. J. Clean. Prod. 2017, 140, 1686–1698. [Google Scholar] [CrossRef]
- Memari, A.; Dargi, A.; Jokar, M.R.A.; Ahmad, R.; Rahim, A.R.A. Sustainable supplier selection: A multi-criteria intuitionistic fuzzy TOPSIS method. J. Manuf. Syst. 2019, 50, 9–24. [Google Scholar] [CrossRef]
- Awasthi, A.; Govindan, K.; Gold, S. Multi-tier sustainable global supplier selection using a fuzzy AHP-VIKOR based approach. Int. J. Prod. Econ. 2018, 195, 106–117. [Google Scholar] [CrossRef] [Green Version]
- Chan, F.T.; Kumar, N.; Tiwari, M.K.; Lau, H.C.; Choy, K. Global supplier selection: A fuzzy-AHP approach. Int. J. Prod. Res. 2008, 46, 3825–3857. [Google Scholar] [CrossRef]
- Agarwal, G.; Vijayvargy, L. An application of supplier selection in supply chain for modeling of intangibles: A case study of multinational Food Coffee industry. Afr. J. Bus. Manag. 2011, 5, 11505–11520. [Google Scholar] [CrossRef]
- Mani, V.; Agrawal, R.; Sharma, V. Supplier selection using social sustainability: AHP based approach in India. Int. Strateg. Manag. Rev. 2014, 2, 98–112. [Google Scholar] [CrossRef] [Green Version]
- Dweiri, F.; Kumar, S.; Khan, S.A.; Jain, V. Designing an integrated AHP based decision support system for supplier selection in automotive industry. Expert Syst. Appl. 2016, 62, 273–283. [Google Scholar] [CrossRef]
- Fallahpour, A.; Olugu, E.U.; Musa, S.N.; Khezrimotlagh, D.; Wong, K.Y. An integrated model for green supplier selection under fuzzy environment: Application of data envelopment analysis and genetic programming approach. Neural Comput. Appl. 2016, 27, 707–725. [Google Scholar] [CrossRef]
- Govindan, K.; Kadziński, M.; Sivakumar, R. Application of a novel PROMETHEE-based method for construction of a group compromise ranking to prioritization of green suppliers in food supply chain. Omega 2017, 71, 129–145. [Google Scholar] [CrossRef]
- Azimifard, A.; Moosavirad, S.H.; Ariafar, S. Selecting sustainable supplier countries for Iran’s steel industry at three levels by using AHP and TOPSIS methods. Resour. Policy 2018, 57, 30–44. [Google Scholar] [CrossRef]
- Laosirihongthong, T.; Samaranayake, P.; Nagalingam, S. A holistic approach to supplier evaluation and order allocation towards sustainable procurement. Benchmark. Int. J. 2019, 26, 2543–2573. [Google Scholar] [CrossRef]
- Pishchulov, G.; Trautrims, A.; Chesney, T.; Gold, S.; Schwab, L. The Voting Analytic Hierarchy Process revisited: A revised method with application to sustainable supplier selection. Int. J. Prod. Econ. 2019, 211, 166–179. [Google Scholar] [CrossRef]
- Xu, Z.; Qin, J.; Liu, J.; Martinez, L. Sustainable supplier selection based on AHPSort II in interval type-2 fuzzy environment. Inf. Sci. 2019, 483, 273–293. [Google Scholar] [CrossRef]
- Dospinescu, N.; Dospinescu, O.; Tatarusanu, M. Analysis of the Influence Factors on the Reputation of Food-Delivery Companies: Evidence from Romania. Sustainability 2020, 12, 4142. [Google Scholar] [CrossRef]
- Manuele dos Santos, I.; Reis Peixoto Roselli, L.; Luiz Gomes da Silva, A.; Hazin Alencar, L. A Supplier Selection Model for a Wholesaler and Retailer Company Based on FITradeoff Multicriteria Method. Math. Probl. Eng. 2020. [Google Scholar] [CrossRef]
- Wang, C.-N.; Dang, T.-T.; Nguyen, N.-A.-T. Outsourcing Reverse Logistics for E-Commerce Retailers: A Two-Stage Fuzzy Optimization Approach. Axioms 2021, 10, 34. [Google Scholar] [CrossRef]
- Cheng, C.C.; Chang, Y.Y.; Chen, C.T. Construction of a service quality scale for the online food delivery industry. Int. J. Hosp. Manag. 2021, 95, 102938. [Google Scholar] [CrossRef]
- Wang, C.-N.; Nguyen, N.-A.-T.; Dang, T.-T.; Lu, C.-M. A Compromised Decision-Making Approach to Third-Party Logistics Selection in Sustainable Supply Chain Using Fuzzy AHP and Fuzzy VIKOR Methods. Mathematics 2021, 9, 886. [Google Scholar] [CrossRef]
- Wang, C.N.; Nguyen, N.A.T.; Dang, T.T.; Bayer, J. A Two-Stage Multiple Criteria Decision Making for Site Selection of Solar Photovoltaic (PV) Power Plant: A Case Study in Taiwan. IEEE Access 2021, 9, 75509–75525. [Google Scholar]
- Zhu, G.N.; Hu, J.; Qi, J.; Gu, C.C.; Peng, Y.H. An integrated AHP and VIKOR for design concept evaluation based on rough number. Adv. Eng. Inform. 2015, 29, 408–418. [Google Scholar] [CrossRef]
- Saaty, T.L. How to make a decision: The analytic hierarchy process. Eur. J. Oper. Res. 1990, 48, 9–26. [Google Scholar] [CrossRef]
- Wang, T.C.; Chen, Y.H. Applying consistent fuzzy preference relations to partnership selection. Omega 2007, 35, 384–388. [Google Scholar] [CrossRef]
- Seçme, N.Y.; Bayrakdaroğlu, A.; Kahraman, C. Fuzzy performance evaluation in Turkish banking sector using analytic hierarchy process and TOPSIS. Expert Syst. Appl. 2009, 36, 11699–11709. [Google Scholar] [CrossRef]
- Opricovic, S.; Tzeng, G.H. Extended VIKOR method in comparison with outranking methods. Eur. J. Oper. Res. 2007, 178, 514–529. [Google Scholar] [CrossRef]
- Lee, A.H.; Kang, H.Y.; Hsu, C.F.; Hung, H.C. A green supplier selection model for high-tech industry. Expert Syst. Appl. 2009, 36, 7917–7927. [Google Scholar] [CrossRef]
- Büyüközkan, G.; Çifçi, G. A novel fuzzy multi-criteria decision framework for sustainable supplier selection with incomplete information. Comput. Ind. 2011, 62, 164–174. [Google Scholar] [CrossRef]
- Shaw, K.; Shankar, R.; Yadav, S.S.; Thakur, L.S. Supplier selection using fuzzy AHP and fuzzy multi-objective linear programming for developing low carbon supply chain. Expert Syst. Appl. 2012, 39, 8182–8192. [Google Scholar] [CrossRef]
- Govindan, K.; Khodaverdi, R.; Jafarian, A. A fuzzy multi criteria approach for measuring sustainability performance of a supplier based on triple bottom line approach. J. Clean. Prod. 2013, 47, 345–354. [Google Scholar] [CrossRef]
- Shen, L.; Olfat, L.; Govindan, K.; Khodaverdi, R.; Diabat, A. A fuzzy multi criteria approach for evaluating green supplier’s performance in green supply chain with linguistic preferences. Resour. Conserv. Recycl. 2013, 74, 170–179. [Google Scholar] [CrossRef]
- Kannan, D.; Khodaverdi, R.; Olfat, L.; Jafarian, A.; Diabat, A. Integrated fuzzy multi criteria decision making method and multi-objective programming approach for supplier selection and order allocation in a green supply chain. J. Clean. Prod. 2013, 47, 355–367. [Google Scholar] [CrossRef]
- Dou, Y.; Zhu, Q.; Sarkis, J. Evaluating green supplier development programs with a grey-analytical network process-based methodology. Eur. Oper. Res. 2014, 233, 420–431. [Google Scholar] [CrossRef]
- Kannan, D.; de Sousa Jabbour, A.B.L.; Jabbour, C.J.C. Selecting green suppliers based on GSCM practices: Using fuzzy TOPSIS applied to a Brazilian electronics company. Eur. Oper. Res. 2014, 233, 432–447. [Google Scholar] [CrossRef]
- Wong, J.T. Dynamic procurement risk management with supplier portfolio selection and order allocation under green market segmentation. J. Clean. Prod. 2020, 253, 119835. [Google Scholar] [CrossRef]
- Çalık, A. A novel Pythagorean fuzzy AHP and fuzzy TOPSIS methodology for green supplier selection in the Industry 4.0 era. Soft Comput. 2021, 25, 2253–2265. [Google Scholar] [CrossRef]
- Zadeh, L.A. Fuzzy Sets. Inf. Control 1965, 8, 338–358. [Google Scholar] [CrossRef] [Green Version]
- Sun, C.C. A performance evaluation model by integrating fuzzy AHP and fuzzy TOPSIS methods. Expert Syst. Appl. 2010, 37, 7745–7754. [Google Scholar] [CrossRef]
- Rudnik, K.; Bocewicz, G.; Kucińska-Landwójtowicz, A.; Czabak-Górska, I.D. Ordered fuzzy WASPAS method for selection of improvement projects. Expert Syst. Appl. 2021, 169, 114471. [Google Scholar] [CrossRef]
- Amarasinghe, U.A.; Hoanh, C.T.; D’haeze, D.; Hung, T.Q. Toward sustainable coffee production in Vietnam: More coffee with less water. Agric. Syst. 2015, 136, 96–105. [Google Scholar] [CrossRef]
- Chou, Y.C.; Yen, H.Y.; Dang, V.T.; Sun, C.C. Assessing the Human Resource in Science and Technology for Asian Countries: Application of Fuzzy AHP and Fuzzy TOPSIS. Symmetry 2019, 11, 251. [Google Scholar] [CrossRef] [Green Version]
- Buckley, J.J. Ranking Alternatives Using Fuzzy Numbers. Fuzzy Sets Syst. 1985, 15, 21–31. [Google Scholar] [CrossRef]
- Top 10 Coffee Bean Suppliers in Vietnam. Available online: https://90scoffee.vn/tin-tuc/top-10-nha-cung-cap-ca-phe-uy-tin-tai-tphcm/ (accessed on 7 August 2021).
- Ghalehkhondabi, I.; Maihami, R.; Ahmadi, E. Optimal pricing and environmental improvement for a hazardous waste disposal supply chain with emission penalties. Util. Policy 2020, 62, 101001. [Google Scholar] [CrossRef]
- Wang, C.-N.; Dang, T.-T.; Nguyen, N.-A.-T.; Le, T.-T.-H. Supporting Better Decision-Making: A Combined Grey Model and Data Envelopment Analysis for Efficiency Evaluation in E-Commerce Marketplaces. Sustainability 2020, 12, 385. [Google Scholar] [CrossRef]
- Dobos, I.; Vörösmarty, G. Inventory-related costs in green supplier selection problems with Data Envelopment Analysis (DEA). Int. J. Prod. Econ. 2019, 209, 374–380. [Google Scholar] [CrossRef] [Green Version]


| Relevant Studies | Supply Availability | Defect Rate | Customer Complaint | Purchasing Cost | Logistics Cost | Quantity Discount | Order Fulfillment Rate | Just in Time Delivery | Tracking and Tracing System | R&D Capability | Wastewater Treatment | Solid Waste Generation | Energy Consumption | Air Pollution | Corporate Social Responsibility |
|---|---|---|---|---|---|---|---|---|---|---|---|---|---|---|---|
| Chan et al. (2008) [10] | ٧ | ٧ | ٧ | ٧ | ٧ | ٧ | |||||||||
| Agarwal and Vijayvargy (2011) [11] | ٧ | ٧ | ٧ | ||||||||||||
| Mani et al. (2014) [12] | ٧ | ٧ | ٧ | ٧ | ٧ | ||||||||||
| Dweiri et al. (2016) [13] | ٧ | ٧ | ٧ | ٧ | ٧ | ||||||||||
| Fallahpour et al. (2016) [14] | ٧ | ٧ | ٧ | ٧ | ٧ | ٧ | ٧ | ||||||||
| Govindan et al. (2017) [15] | ٧ | ٧ | ٧ | ٧ | ٧ | ٧ | ٧ | ٧ | ٧ | ٧ | |||||
| Azimifard et al. (2018) [16] | ٧ | ٧ | ٧ | ٧ | ٧ | ٧ | ٧ | ||||||||
| Laosirihongthong et al. (2019) [17] | ٧ | ٧ | ٧ | ٧ | ٧ | ||||||||||
| Pishchulov et al. (2019) [18] | ٧ | ٧ | ٧ | ٧ | ٧ | ٧ | ٧ | ٧ | ٧ | ||||||
| Xu et al. (2019) [19] | ٧ | ٧ | ٧ | ٧ | ٧ | ||||||||||
| Dospinescu et al. (2020) [20] | ٧ | ٧ | ٧ | ||||||||||||
| Santos et al. (2020) [21] | ٧ | ٧ | |||||||||||||
| Wang et al. (2021) [22] | ٧ | ٧ | ٧ | ||||||||||||
| Cheng et al. (2021) [23] | ٧ | ٧ | |||||||||||||
| Wang et al. (2021) [24] | ٧ | ٧ | ٧ |
| Relevant Studies | Methodologies/Techniques Used | Issues Addressed |
|---|---|---|
| Lee et al. (2009) [31] | Fuzzy AHP | Green supplier selection |
| Büyüközkan and Çifçi (2011) [32] | Fuzzy AHP | Sustainable supplier selection with incomplete information |
| Shaw et al. (2012) [33] | Fuzz AHP and Fuzzy Multi-Objective Linear Programming (MOLP) | Supplier selection for developing low carbon supply chain |
| Govindan et al. (2013) [34] | Fuzzy TOPSIS | Measurement of supplier performances based on sustainability |
| Shen et al. (2013) [35] | Fuzzy TOPSIS | Green supplier selection in global supply chain |
| Kannan et al. (2013) [36] | Fuzzy AHP and TOPSIS | Green supplier selection |
| Dou et al. (2014) [37] | Grey ANP | Evaluation of green supplier development programs |
| Kannan et al. (2014) [38] | Fuzzy TOPSIS | Green supplier’s selection based on GSCM practices |
| Luthra et al. (2017) [7] | AHP and VIKOR | Sustainable supplier selection |
| Azimifard et al. (2018) [16] | AHP and TOPSIS | Sustainable supplier selection |
| Awasthi et al. (2018) [9] | Fuzzy AHP and Fuzzy VIKOR | Multi-tier sustainable global supplier selection |
| Gupta et al. (2019) [4] | Fuzzy AHP, TOPSIS, MABAC and WASPAS | Green supplier selection |
| Memari et al. (2019) [8] | Intuitionistic fuzzy TOPSIS | Sustainable supplier selection |
| Wong (2020) [39] | Fuzzy goal programming | Green supplier selection with risk management |
| Çalık (2021) [40] | Pythagorean fuzzy AHP and fuzzy TOPSIS | Green supplier selection in the industry 4.0 era |
| Scale | Linguistic Expression | Scale of Fuzzy Number |
|---|---|---|
| Equivalent importance | (1, 1, 1) | |
| Weak | (1, 2, 3) | |
| Medium importance | (2, 3, 4) | |
| Preferable | (3, 4, 5) | |
| Strong importance | (4, 5, 6) | |
| Fairly | (5, 6, 7) | |
| Very important | (6, 7, 8) | |
| Absolute | (7, 8, 9) | |
| Extreme importance | (8, 9, 10) |
| n | 1 | 2 | 3 | 4 | 5 | 6 | 7 | 8 | 9 | 10 | 11 | 12 | 13 | 14 | 15 |
|---|---|---|---|---|---|---|---|---|---|---|---|---|---|---|---|
| RI | 0 | 0 | 0.58 | 0.9 | 1.12 | 1.24 | 1.32 | 1.41 | 1.45 | 1.49 | 1.51 | 1.48 | 1.56 | 1.57 | 1.59 |
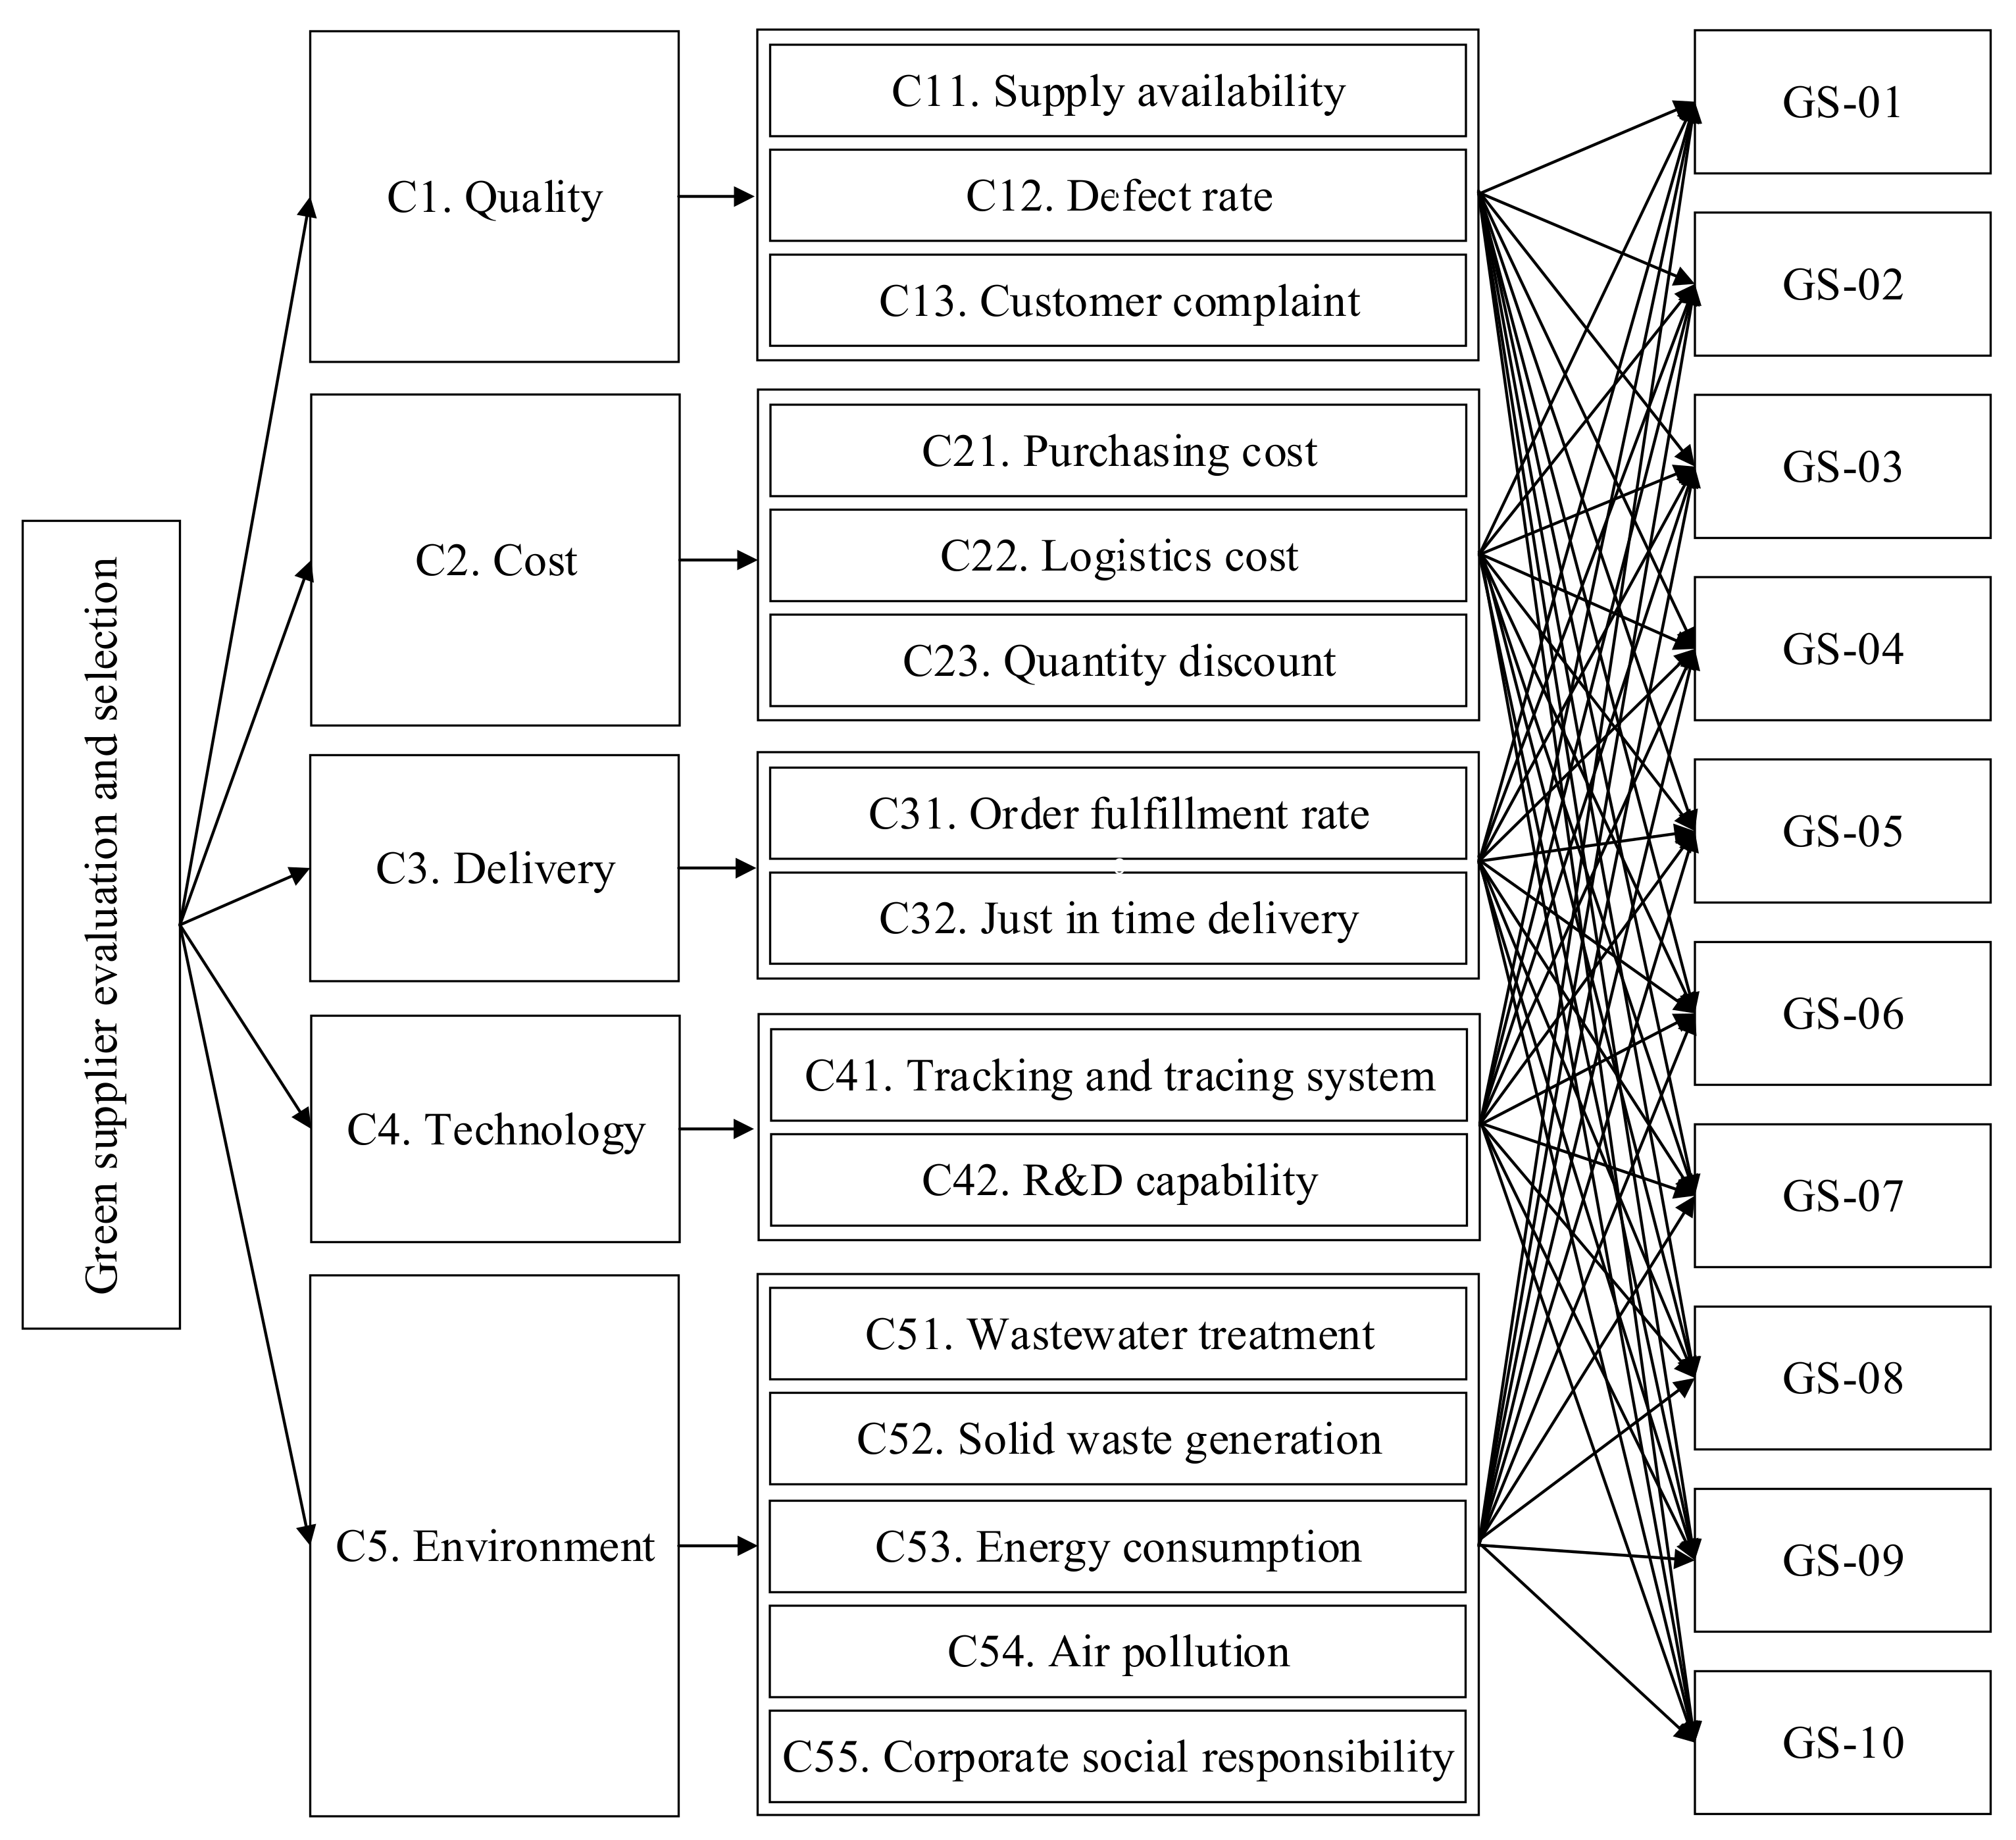
| Aspects | Criteria | Attribute | Definition |
|---|---|---|---|
| Quality (C1) | C11. Supply availability | Benefit | Supply capability of suppliers |
| C12. Defect rate | Cost | The rate of materials rejected by quality department | |
| C13. Customer complaint | Cost | The percentage of dissatisfaction of customers | |
| Cost (C2) | C21. Purchasing cost | Cost | Cost of materials from suppliers |
| C22. Logistics cost | Cost | Transportation cost to supply materials | |
| C23. Quantity discount | Benefit | Reduction in the materials cost with a large quantity | |
| Delivery (C3) | C31. Order fulfillment rate | Benefit | Ability of compliance with the predetermined order quantities |
| C32. Just in time delivery | Benefit | Ability to meet delivery schedules or promises | |
| Technology (C4) | C41. Tracking and tracing system | Benefit | Track and trace technologies of materials among suppliers and customers |
| C42. R&D capability | Benefit | Research and development infrastructure | |
| Environment (C5) | C51. Wastewater treatment | Benefit | Ability to remove contaminants from wastewater and convert it into an effluent |
| C52. Solid waste generation | Cost | Solid waste management such as collecting, treating, and disposing of solid material | |
| C53. Energy consumption | Cost | The amount of energy used in manufacturing process | |
| C54. Air pollution | Cost | Quantity control of hazardous emissions (COx, SOx, NHx) | |
| C55. Corporate social responsibility | Benefit | Labor policies, employee benefits, carbon footprints comply with CSR standards |
| No. | Suppliers | Symbol |
|---|---|---|
| 1 | Minh Hai Coffee | GS-01 |
| 2 | Son Viet Coffee | GS-02 |
| 3 | Buon Me Coffee | GS-03 |
| 4 | Café Motherland | GS-04 |
| 5 | Café R&A | GS-05 |
| 6 | 90S Coffee | GS-06 |
| 7 | Favio Coffee | GS-07 |
| 8 | Taf Coffee | GS-08 |
| 9 | Rocking Coffee | GS-09 |
| 10 | Nguyen Chat Coffee | GS-10 |
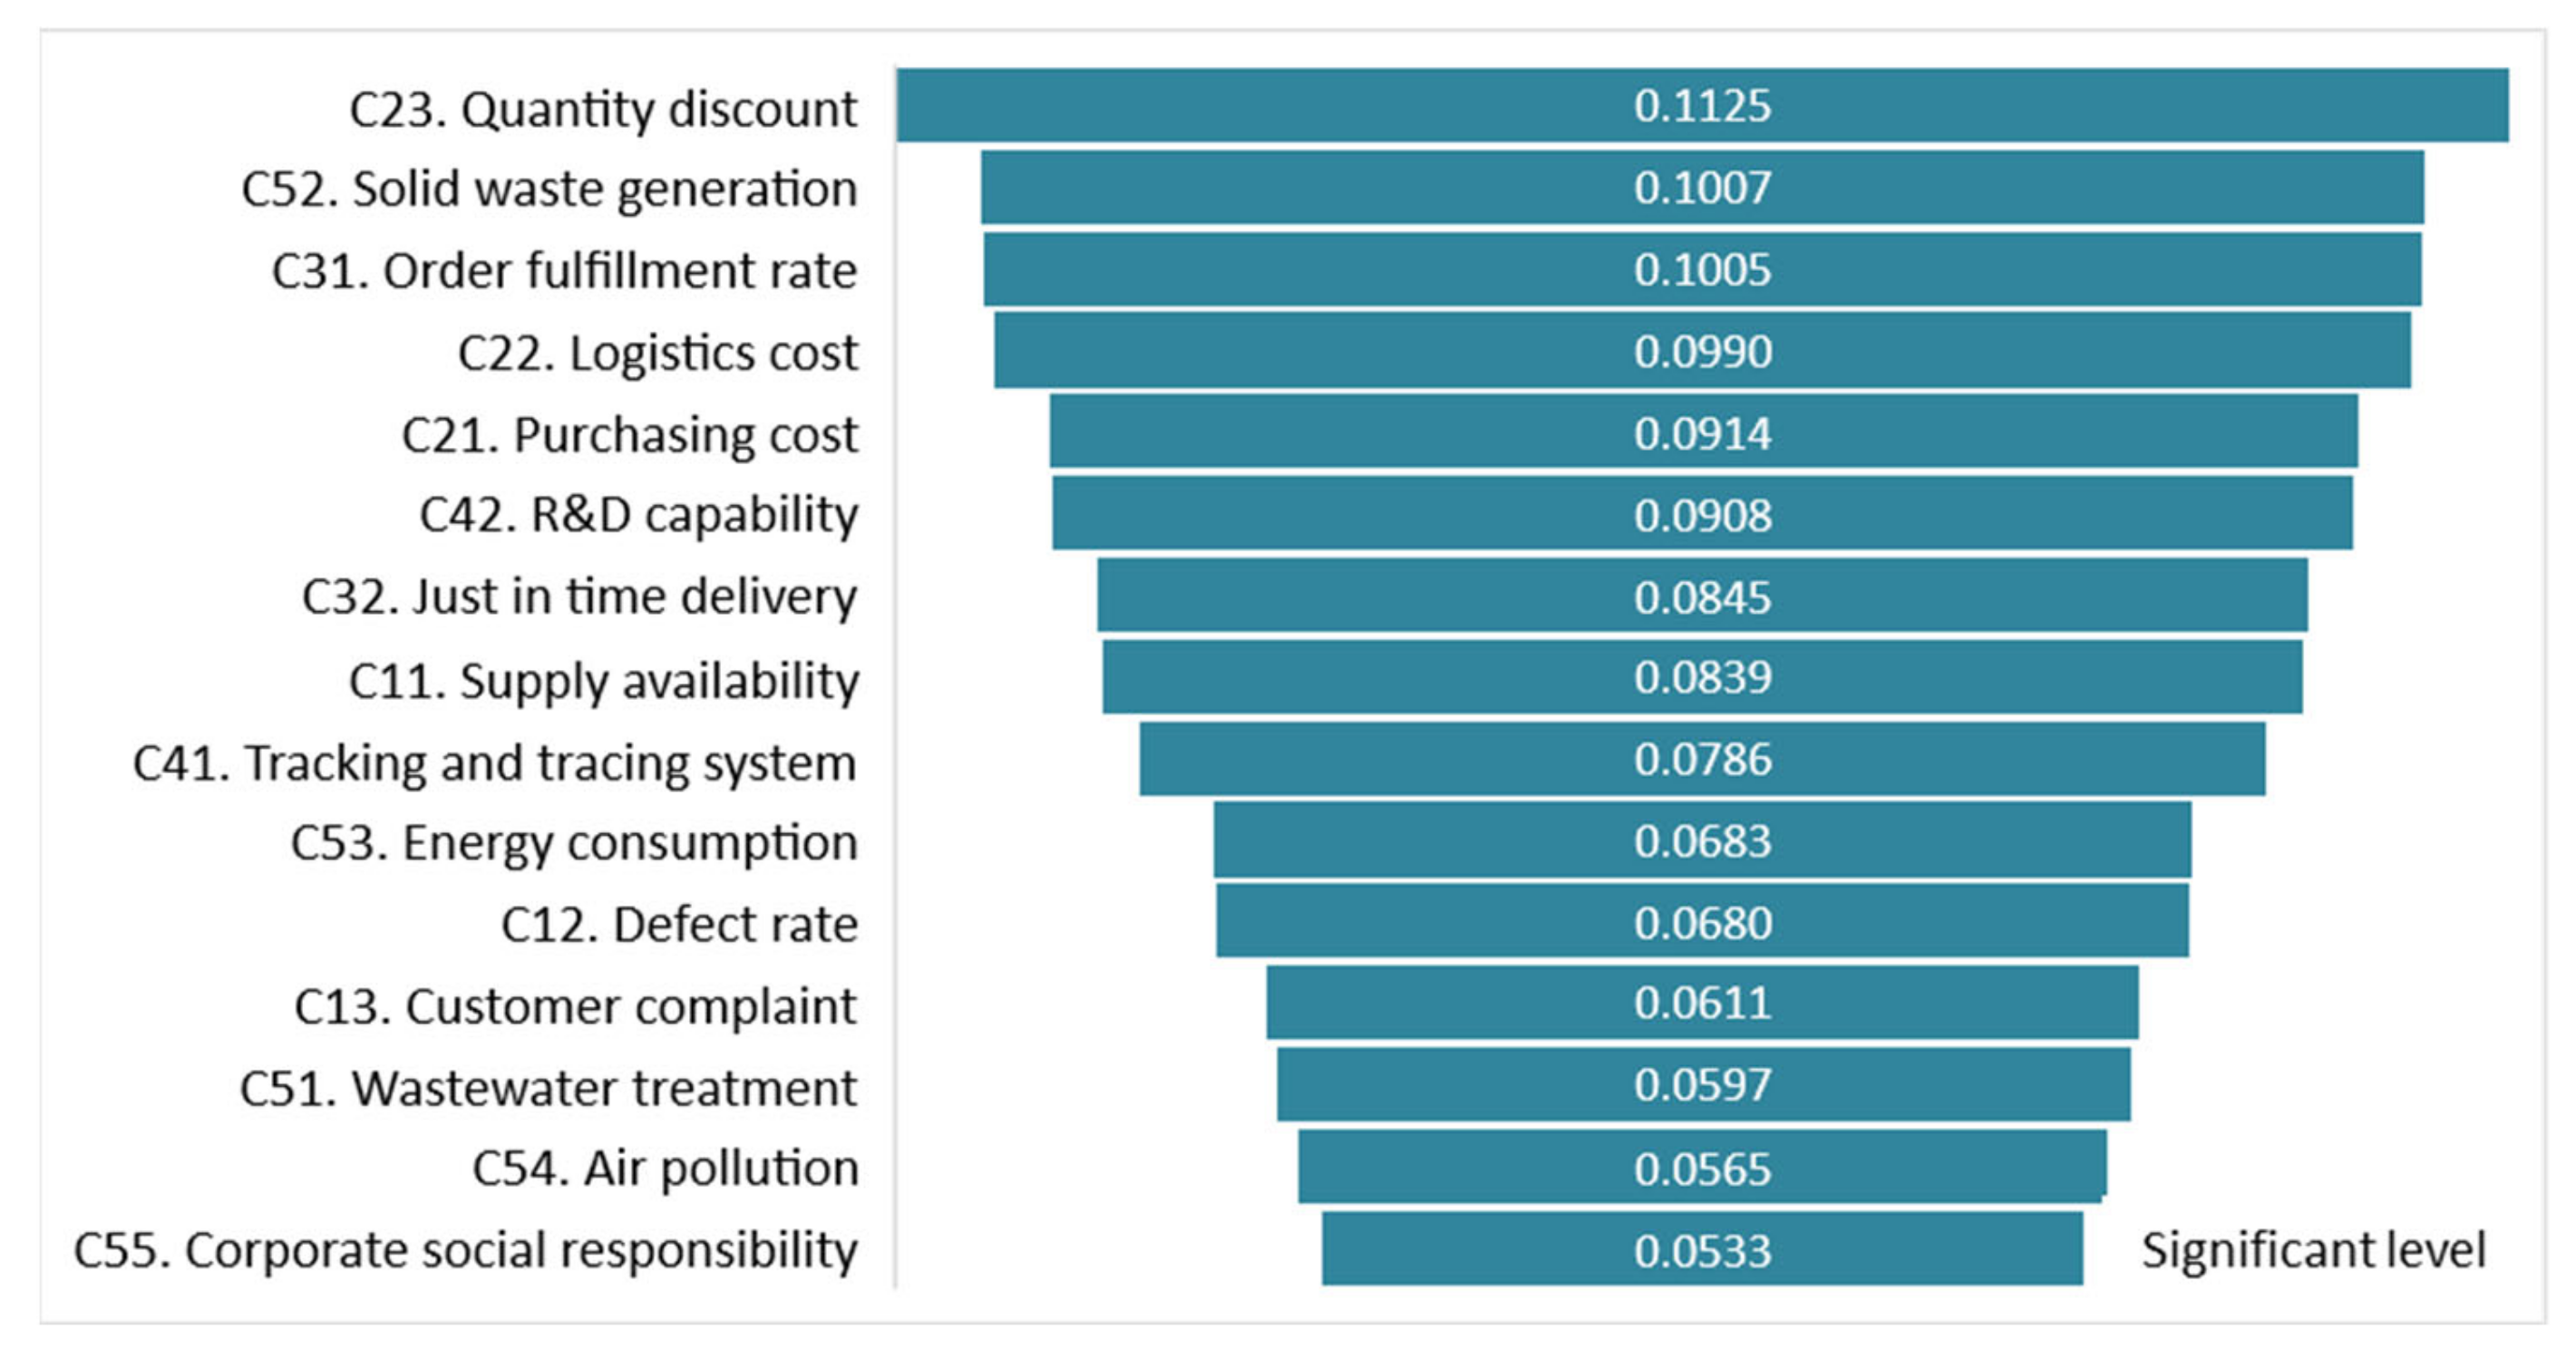
| Aspects | Criteria | Fuzzy Weights | Defuzzy | Normalize | ||
|---|---|---|---|---|---|---|
| Quality (C1) | C11. Supply availability | 0.0287 | 0.0666 | 0.1565 | 0.0839 | 0.0694 |
| C12. Defect rate | 0.0243 | 0.0539 | 0.1257 | 0.0680 | 0.0562 | |
| C13. Customer complaint | 0.0229 | 0.0495 | 0.1108 | 0.0611 | 0.0505 | |
| Cost (C2) | C21. Purchasing cost | 0.0314 | 0.0744 | 0.1684 | 0.0914 | 0.0756 |
| C22. Logistics cost | 0.0368 | 0.0810 | 0.1792 | 0.0990 | 0.0819 | |
| C23. Quantity discount | 0.0483 | 0.0968 | 0.1925 | 0.1125 | 0.0931 | |
| Delivery (C3) | C31. Order fulfillment rate | 0.0372 | 0.0829 | 0.1814 | 0.1005 | 0.0831 |
| C32. Just in time delivery | 0.0325 | 0.0711 | 0.1500 | 0.0845 | 0.0699 | |
| Technology (C4) | C41. Tracking and tracing system | 0.0302 | 0.0656 | 0.1399 | 0.0786 | 0.0650 |
| C42. R&D capability | 0.0373 | 0.0772 | 0.1579 | 0.0908 | 0.0751 | |
| Environment (C5) | C51. Wastewater treatment | 0.0228 | 0.0481 | 0.1081 | 0.0597 | 0.0494 |
| C52. Solid waste generation | 0.0384 | 0.0852 | 0.1785 | 0.1007 | 0.0833 | |
| C53. Energy consumption | 0.0270 | 0.0568 | 0.1211 | 0.0683 | 0.0565 | |
| C54. Air pollution | 0.0226 | 0.0468 | 0.1000 | 0.0565 | 0.0467 | |
| C55. Corporate social responsibility | 0.0213 | 0.0441 | 0.0945 | 0.0533 | 0.0441 | |
| Aspects | Criteria | Attribute | ||
|---|---|---|---|---|
| Quality (C1) | C11. Supply availability | Benefit | 0.0280 | 0.0082 |
| C12. Defect rate | Cost | 0.0065 | 0.0233 | |
| C13. Customer complaint | Cost | 0.0060 | 0.0213 | |
| Cost (C2) | C21. Purchasing cost | Cost | 0.0087 | 0.0321 |
| C22. Logistics cost | Cost | 0.0105 | 0.0342 | |
| C23. Quantity discount | Benefit | 0.0359 | 0.0135 | |
| Delivery (C3) | C31. Order fulfillment rate | Benefit | 0.0335 | 0.0147 |
| C32. Just in time delivery | Benefit | 0.0285 | 0.0132 | |
| Technology (C4) | C41. Tracking and tracing system | Benefit | 0.0271 | 0.0109 |
| C42. R&D capability | Benefit | 0.0313 | 0.0076 | |
| Environment (C5) | C51. Wastewater treatment | Benefit | 0.0197 | 0.0077 |
| C52. Solid waste generation | Cost | 0.0149 | 0.0323 | |
| C53. Energy consumption | Cost | 0.0063 | 0.0232 | |
| C54. Air pollution | Cost | 0.0070 | 0.0201 | |
| C55. Corporate social responsibility | Benefit | 0.0161 | 0.0054 |
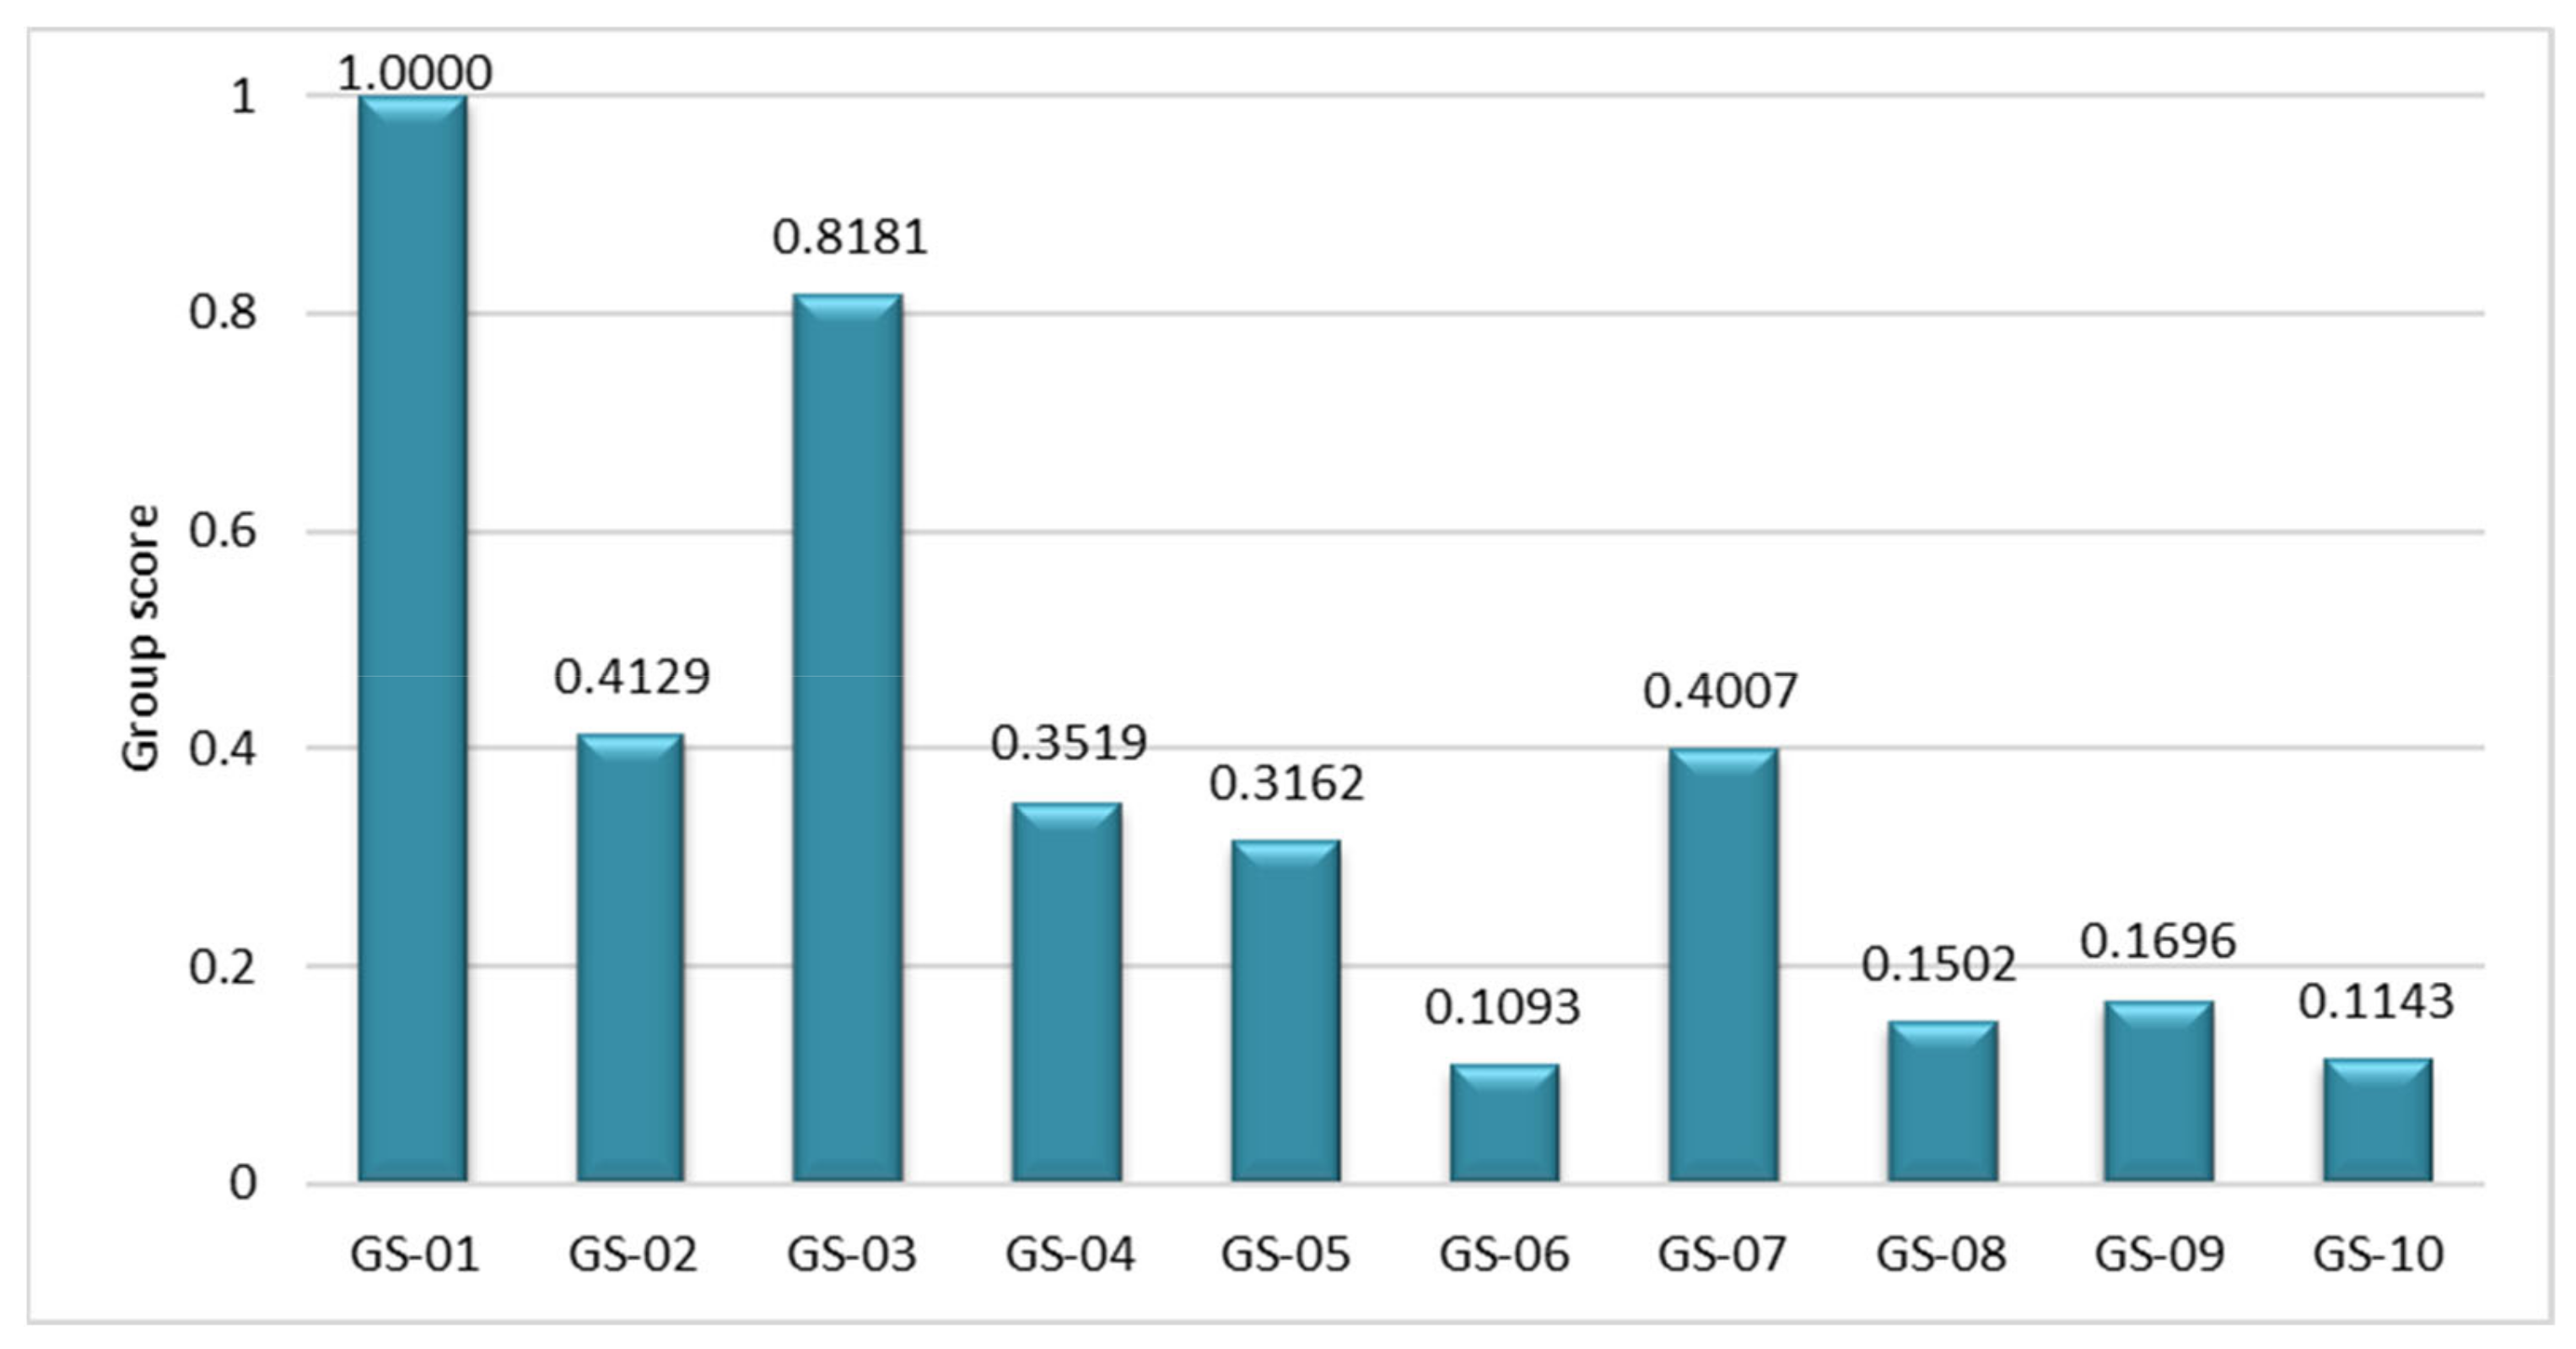
| Suppliers | Ranking | |||
|---|---|---|---|---|
| GS-01 | 0.5718 | 0.0931 | 1.0000 | 10 |
| GS-02 | 0.4403 | 0.0833 | 0.4129 | 8 |
| GS-03 | 0.5644 | 0.0831 | 0.8181 | 9 |
| GS-04 | 0.5076 | 0.0655 | 0.3519 | 6 |
| GS-05 | 0.5158 | 0.0615 | 0.3162 | 5 |
| GS-06 | 0.4530 | 0.0615 | 0.1093 | 1 |
| GS-07 | 0.4680 | 0.0768 | 0.4007 | 7 |
| GS-08 | 0.4605 | 0.0625 | 0.1502 | 3 |
| GS-09 | 0.4497 | 0.0660 | 0.1696 | 4 |
| GS-10 | 0.4198 | 0.0687 | 0.1143 | 2 |
Publisher’s Note: MDPI stays neutral with regard to jurisdictional claims in published maps and institutional affiliations. |
© 2021 by the authors. Licensee MDPI, Basel, Switzerland. This article is an open access article distributed under the terms and conditions of the Creative Commons Attribution (CC BY) license (https://creativecommons.org/licenses/by/4.0/).
Share and Cite
Nguyen, N.B.T.; Lin, G.-H.; Dang, T.-T. A Two Phase Integrated Fuzzy Decision-Making Framework for Green Supplier Selection in the Coffee Bean Supply Chain. Mathematics 2021, 9, 1923. https://doi.org/10.3390/math9161923
Nguyen NBT, Lin G-H, Dang T-T. A Two Phase Integrated Fuzzy Decision-Making Framework for Green Supplier Selection in the Coffee Bean Supply Chain. Mathematics. 2021; 9(16):1923. https://doi.org/10.3390/math9161923
Chicago/Turabian StyleNguyen, Ngoc Bao Tu, Gu-Hong Lin, and Thanh-Tuan Dang. 2021. "A Two Phase Integrated Fuzzy Decision-Making Framework for Green Supplier Selection in the Coffee Bean Supply Chain" Mathematics 9, no. 16: 1923. https://doi.org/10.3390/math9161923
APA StyleNguyen, N. B. T., Lin, G.-H., & Dang, T.-T. (2021). A Two Phase Integrated Fuzzy Decision-Making Framework for Green Supplier Selection in the Coffee Bean Supply Chain. Mathematics, 9(16), 1923. https://doi.org/10.3390/math9161923