Article

A Theoretical Analysis of Profile Conformance Improvement Due to Suspension Injection

by
Konstantin Mikhailovich Fedorov
1,
Alexander Yanovich Gilmanov
1,*,
Alexander Pavlovich Shevelev
1,
Alexander Vyacheslavovich Kobyashev
2 and
Denis Alekseevich Anuriev
2
1
Department of Modeling of Physical Processes and Systems, Institute of Physics and Technology, University of Tyumen, 6 Volodarskogo Str., 625003 Tyumen, Russia
2
Tyumen Petroleum Research Center, 79/1 Osipenko Str., 625000 Tyumen, Russia
*
Author to whom correspondence should be addressed.
Mathematics 2021, 9(15), 1727; https://doi.org/10.3390/math9151727
Submission received: 2 July 2021 / Revised: 15 July 2021 / Accepted: 19 July 2021 / Published: 22 July 2021
(This article belongs to the Special Issue Mathematical Models of Multiphase Flows in Porous Media)

Abstract

:
This study is focused on a solution for the problem of suspension penetration in a porous formation. Such a solution forms the basis of injection profile diversion technology for oil reservoir sweep improvement. A conventional model of deep-bed suspension flow was used to describe the suspension injection process. The suspension slug was followed by water injection, and the inflow injection profile before and after treatment was investigated. For the first time, the criteria that determine the effectiveness of the inflow profile improvement process are introduced. The effect of the suspension filtration coefficient on the particle penetration depth was studied. A specific filtration coefficient value for the maximum penetration depth was achieved. The obtained analytical solution was generalized on multi-reservoir strata with poor interlayer crosslinking. The efficiency of profile conformance improvement was described by the differences in the root-mean-square deviations of the inflow velocities in interlayers from mean values before and after the treatment. It was shown that the complex criterion of suspension treatment efficiency should include a reduction in total injectivity. An increase in suspension slug volume improves the injectivity profile but decreases the total injectivity of an injector.

1. Introduction

Secondary recovery, i.e., waterflooding, along with an increase in recovery efficiency, leads to early water breakthrough into producing oil wells. A common reason for early water breakthrough is the reservoir layered heterogeneity. Wells with high water cut must be shut-in or recompleted to other reservoirs within the field. Reducing the water cut in produced fluid extends the development of a reservoir and therefore increases the oil recovery factor (RF).
The goal of common treatments for water control with respect to injection is confinement profile improvement or redistribution of the injection profile, thus, increasing flow rates in low permeable interlayers and decreasing flow rates in high permeable streaks, and therefore reducing water cut in the nearest production wells [1]. Oil production increases if the liquid production rate is maintained the same level as before the treatment.
Injection of suspension stabilized with a weak polymer gel is one such treatment technology. Since the maximum amount of suspension inflows into the most highly permeable interlayers, particle entrapment occurs mostly in streaks and causes diversion of the flows among the layers [2]. By the end of the 20th century, specialists from the TATNEFT Company had proposed suspensions of clay colloids and fine particles of chalk or wood flour [3], which were stabilized using polymer or weak polymer gel. Approximately the same mixture formulation was proposed by scientists from the University of Petroleum [4], which they named the Clay Flocculation System. In several fields, the efficiencies of these technologies have been confirmed by injector treatments, in which various injection volumes, particle concentrations, and sizes have been used for designing an optimal process. The application of colloidal dispersion gel, preformed particle gel, and polymer microspheres for the same purpose were considered in [5].
Water cut reduction with respect to production is denoted as a shut-off treatment that uses “weaker” agents. These treatments are more complex because the production interval includes both waterflooded and oil saturated interlayers [6]. Often, damage to the oil saturated layers causes the treatment to be considered unsuccessful. A widely used water shut-off technology involves injecting a solution of a partially hydrolyzed polymer of polyacrylamide (PAA) with polyvalent metal ions such as aluminum citrate or chromium acetate into a production well. In the near wellbore zone, these systems form practically motionless gel, which consists of water by more than 90% [7]. By applying polymers with different molecular weights and varying the concentrations of the crosslinker, it has been possible to define the depth of the gel’s penetration into the near-wellbore zone [8]. In Western Siberia, the use of agents based on sodium silicates precipitated by acid or other agents has become widespread [9]. The advantages of this treatment technology are low prices of reactants and easy fluid makeup and injection.
In order to apply an optimization procedure for profile treatment, a mathematical model of the process is required, along with the necessary experimental information. Earlier experimental studies have been performed to analyze polymer and suspension with different particle size flows in porous samples from one of the fields in West Siberia [10]. To extract data on polymer and suspension flow parameters from the experimental studies, the well-known mathematical models of polymer and suspension slug transport in porous media were used [11,12]. The solutions to the direct and inverse problems were obtained; the solution to the inverse problem provided the suspension flow parameters [10,13].
The theory of deep-bed suspension flow shows that the main mechanism for the formation of a low permeability plug consists of inert particle mechanical entrapment in porous media. Mobilization of deposited particles can occur due to an increase in the flow rate [14]. At a certain stage of accumulation of precipitated particles on the inner surface of a well or a fracture through which the dispersed system is injected, a cake begins to form, preventing the penetration of particles deep into the reservoir [15]. Polymer flow through such a cake is not defined by the traditional Darcy’s law [16]. In this study, we present an analysis of the mechanisms of water inflow redistribution in a productive reservoir interval because of suspension slug injection, particle entrapment, and a reduction in the injectivity of layers.
Today there are no clear criteria that determine the success and effectiveness of the inflow profile improvement process. Therefore, the purpose of this study is to introduce and analyze such criteria.

2. Materials and Methods

Compositional or multiphase, multicomponent flow models are a common tool for simulation of fluid flow in reservoirs. These models use the standard specification of the specific phase density in terms of saturations and component mass concentrations [17]. Heterogeneous mechanics introduce the concepts of volumetric content of phases and mass concentration of components dissolved in a phase, as well as a pseudo homogeneous mixture, in which the velocities of the carrier phase and suspended particles coincide [18]. The latter is often called advective flow. As a result, under the condition of the incompressibility of particles, fluid, and rock matrix, the laws of particle mass conservation are reduced to the following equations:
α t + U α = J ,   σ t = J ,
where ∅ is porosity, α is volumetric particle content moving with the flow, σ is volumetric particle content trapped in the unit volume of porous media, U is fluid rate, J is particle entrapment rate, and t is time. Note that non-experimental data in the literature confirm the statement that particles move in porous media with the velocity of water flow and that suspension flow can be simulated as advective transport.
The particle entrapment rate is proportional to the particle flow J = λUα, where the empirical parameter λ is called the filtration coefficient [14]. This coefficient depends on the ratio of averaged particle size to mean pore radius. The empirical filtration coefficient as a function of the particle size ratio to the mean pore radius is usually represented in the form of the power law λ = λ0 (rp/D)n, where rp is the average particle radius and D is the mean pore radius, λ0 and n are empirical parameters. A traditional opinion on particle flow is that penetration is available when the particle size is less than that of the pore throats. The latest suspension application for profile conformance improvement is the manufacturing and application of so-called flexible profile control agents [19]. The use of special granulators enables production of gel particles with a controlled size. The results of the application of preformed particle gel, which becomes flexible, deformable, and swollen in water solution, have shown that such particles can penetrate into porous media even when the particle size prevails over pore throats [20]. Artificial manufactured gel particles are preferable over natural types of particles (clay, chalk, etc.), because, for example, chalk has poorly controlled particle size and depends on source minerals.
The fluid rate is determined by the Darcy’s law. A decrease in the permeability of the porous medium due to particle deposition has been described by different approaches [21]. The pore volume reduction due to particle entrapment could be associated with permeability decrease [22]. Even preferential plugging of narrow pores with rebuilding of pore size distribution after treatment can be taken into account in permeability change [23]. In the simplest approach, this factor is an empirical parameter interpreted from experimental data [10].
The second empirical parameter that characterizes reservoir plugging is the formation damage factor β, which appears in a modified Darcy’s law:
U = k μ 1 + β σ g r a d P ,
where k is absolute permeability coefficient, µ is effective suspension viscosity, P is in situ pressure, and β is damage factor.
Low polymer concentrations do not visibly influence suspension viscosity and the suspension effective viscosity is proportional to particle concentration [18], but, in practice, this concentration is too small to influence a suspension mixture. Note that in the analyzed process, the polymer component, on the one hand, plays the role of “glue” that fixes the trapped particles in the rock matrix, and on the other hand, stabilizes particles in the suspension state. As a result, there is no term in the particle entrapment rate that is responsible for the entrapped particle mobilization and their entrainment back into the flow [24]. In order to simplify the problem, we assumed that the polymer was present in the entire flow with a constant initial concentration. Neglecting the volume of trapped particles in relation to the pore volume, the general equations of deep-bed suspension flow are as follows:
α + σ t + U · α = 0 ,
σ t = λ U α ,
in addition to Equation (2).
This is the simplest form of a deep-bed suspension flow model [11,12]. There are two empirical parameters in the equations that describe the deposition of particles and the decrease in permeability, i.e., λ and β, respectively; the β factor is determined by the geometry of the pore space and trapped particles, the filtration coefficient λ is determined by the ratio of the average particle radius to the mean pore radius.
First, consider the problem of suspension injection into a vertical well penetrating a reservoir with a net thickness H, with a hydraulic fracture or a fracture formed by intensive injection and an excess of fracturing pressure with a length l and a height equal to the reservoir thickness. The reservoir consists of N layers with net thickness hi, porosity ∅i and permeability ki, where i is the layer number. A relatively small volume (slug) of a suspension mixture is injected into the reservoir through a well. A diagram of the well treatment process is shown in Figure 1. The flow in the near wellbore zone is considered to be linear and perpendicular to the fracture plane, and it is assumed that the near wellbore zone itself is waterflooded to residual oil saturation. During the injection of a relatively small slug (small time interval) into a reservoir with layered heterogeneity, the horizontal flow prevails on vertical leakage and the flow can be assumed as horizontal [25]. The permeability tensor usually has two independent components but, if only horizontal flow is considered, the only corresponding permeability component is taken into account.
Due to the fact that the injection volumes of the polymer-dispersed system are relatively small, vertical crossflows between interlayers can be neglected [12] and considered isolated from each other.
Because the injection volume of the suspension system is relatively small, vertical crossflows between interlayers may be neglected [25] and layers are considered to be isolated from each other. The fracture is assumed ideal, that is, the proppant resistance in the fracture may be neglected. A small injection volume is also the reason to consider the fluid outflow from the fracture to be one-dimensional flat geometry. Equations (2)–(4) under the adopted assumptions and formulated for the i-th layer are as follows:
i α i t + U i α i x = λ U i α i ,     σ i t = λ U i α i ,     U i = k i μ 1 + β σ i P x ,
where αi is volumetric particle content moving with the flow in the i-th layer, Ui is the fluid rate in the i-th layer, x is the linear coordinate perpendicular to the fracture inner surface, and σi is the volumetric particle content trapped in unit volume of porous media in the i-th layer.
Total suspension injection rate at the beginning of the treatment is defined as follows:
Q = 2 i l h i U i .
With a constant pressure drop between the reservoir (conditional point at the distance L from the fracture) and the fracture, the relationship between the total flow rate and the flow in the i-th layer during the injection time has the form:
l h i U i = Q k i h i 2 j k j h j ,
where j is the interlayer number.
Substituting this relationship into Equation set (5) and introducing dimensionless variables, one can obtain the following:
α i T + V i i α i X = Λ V i i α i ,     σ i T = Λ V i α i ,
where dimensionless variables have the form:
X = x L ; T = Q t 2 L H l ; Λ = λ L ; V i = k i H j k j h j .
Total volumetric rate is defined by the formula:
Q = 2 l j k j h j μ Δ P L ,
where ΔP is the pressure drop.
Consider the injection of suspension slug into such a layered stratum for a time t0 with a constant flow rate. The injected slug volume has the value Qt0 in this case and dimensionless volume is defined by formula:
T 0 = Q t 0 2 L H l .
The boundary and initial conditions for the formulated objective are as follows:
X = 0 , T 0 > T > 0 : Q = Q 0 , α i = α 0 ;
X = 0 , T > T 0 : Q = Q 1 , α i = 0 ;
T = 0 , 0 < X < 1 : α i = 0 , σ i = 0 ;
where α0 is the initial particle content in the injected flow, Q0 is the suspension injection rate, and Q1 is the water injection rate after well treatment.
The solution of the formulated objective can be obtained, for example, by the method of characteristics [11,14]. The volumetric content of suspended and trapped particles in the rock matrix are determined by the following expressions:
α = α 0 e x p Λ X , T T 0 V i i < X < T V i i ,
σ i = Λ V i α 0 e x p Λ X T i X V i , 0 < X < T V i i .
The steady-state distribution of trapped particles in the near wellbore zone after the treatment and water injection is determined by the following expression:
σ i = Λ V i α 0 e x p Λ X T 0 , X > 0 .
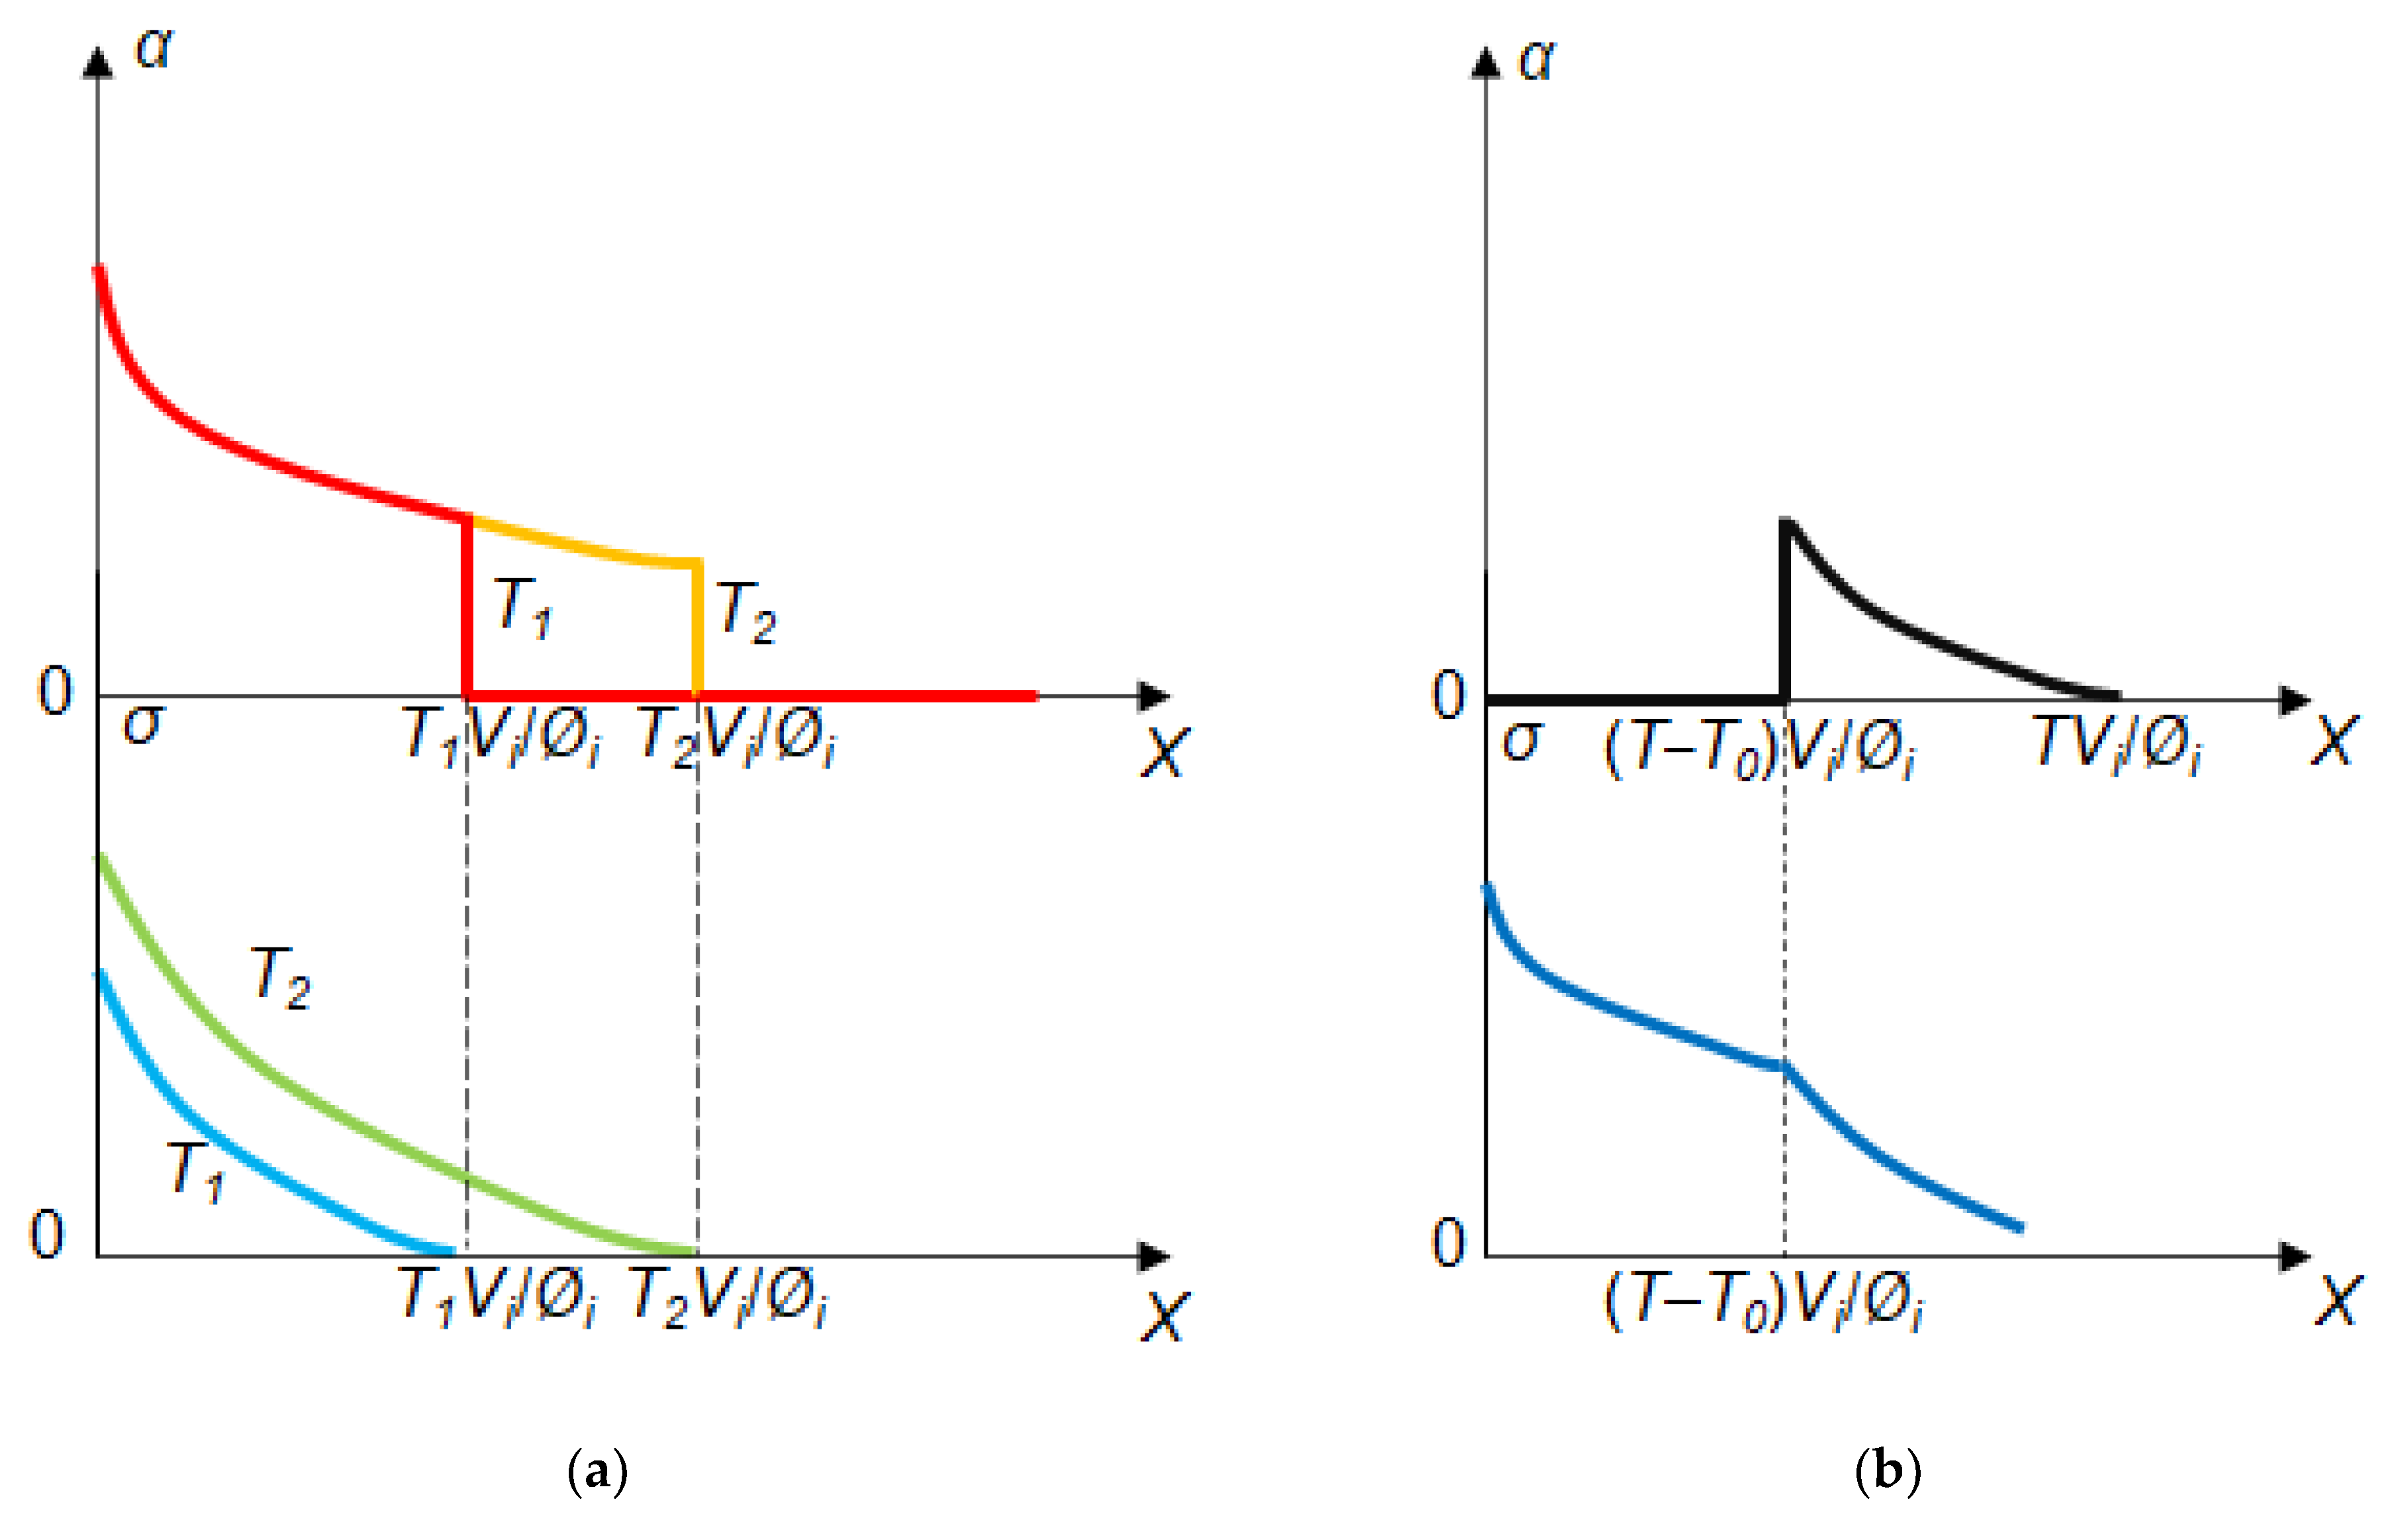
The distributions of suspended and deposited particles for one interlayer are shown in Figure 2. The first two times, T1 and T2 in Figure 2a, correspond to the injection of the suspension slug; the last time moment, in Figure 2b, corresponds to water injection but just before steady-state distribution of trapped particles.
The main purpose of well suspension treatment is redistribution of the flow profile between interlayers with high and low permeability, i.e., profile conformance improvement and water control. The result of treatment is water cut reduction in the nearest producers. The total injection rates before and after the treatment Q0 and Q1, as well as the inflow velocities in the interlayers Ui0 and Ui1, are determined through the pressure drops, ΔP0 and ΔP1, before and after the treatment:
Q 0 = 2 l j k j h j μ Δ P 0 L ,     Q 1 = 2 l μ j k j h j 0 1 1 + β σ i d X Δ P 1 L ,
U i 0 = k i μ Δ P 0 L ,     U i 1 = k i μ 0 1 1 + β σ i d X Δ P 1 L .
Here, the integral that determines the additional hydraulic resistance in the zone of trapped particles for i-th interlayer is defined by the formula:
g i = 0 1 1 + β σ i d X = 1 + β V i α 0 T 0 1 e x p Λ .
In this way the model of deep bed suspension flow was developed for the purpose of profile conformance improvement calculations. The basic model has undergone extensive validation, the results of which can be found in previous research (for example, [26]).

3. Results and Discussion

3.1. Suspension Penetration into a Homogeneous Layer

Before proceeding to the analysis of the flow redistribution mechanism in the near wellbore zone, let us consider the problem of suspension penetration into a homogeneous layer with the following properties: initial particle concentration α0 = 0.02, near wellbore size L = 40 m, permeability k = 5 × 10–15 m2, net thickness H = 10 m, porosity ∅ = 0.2, and fracture length l = 80 m. The dimensionless slug volume is 0.02, which corresponds to the dimensional volume of the slug of 1280 m3.
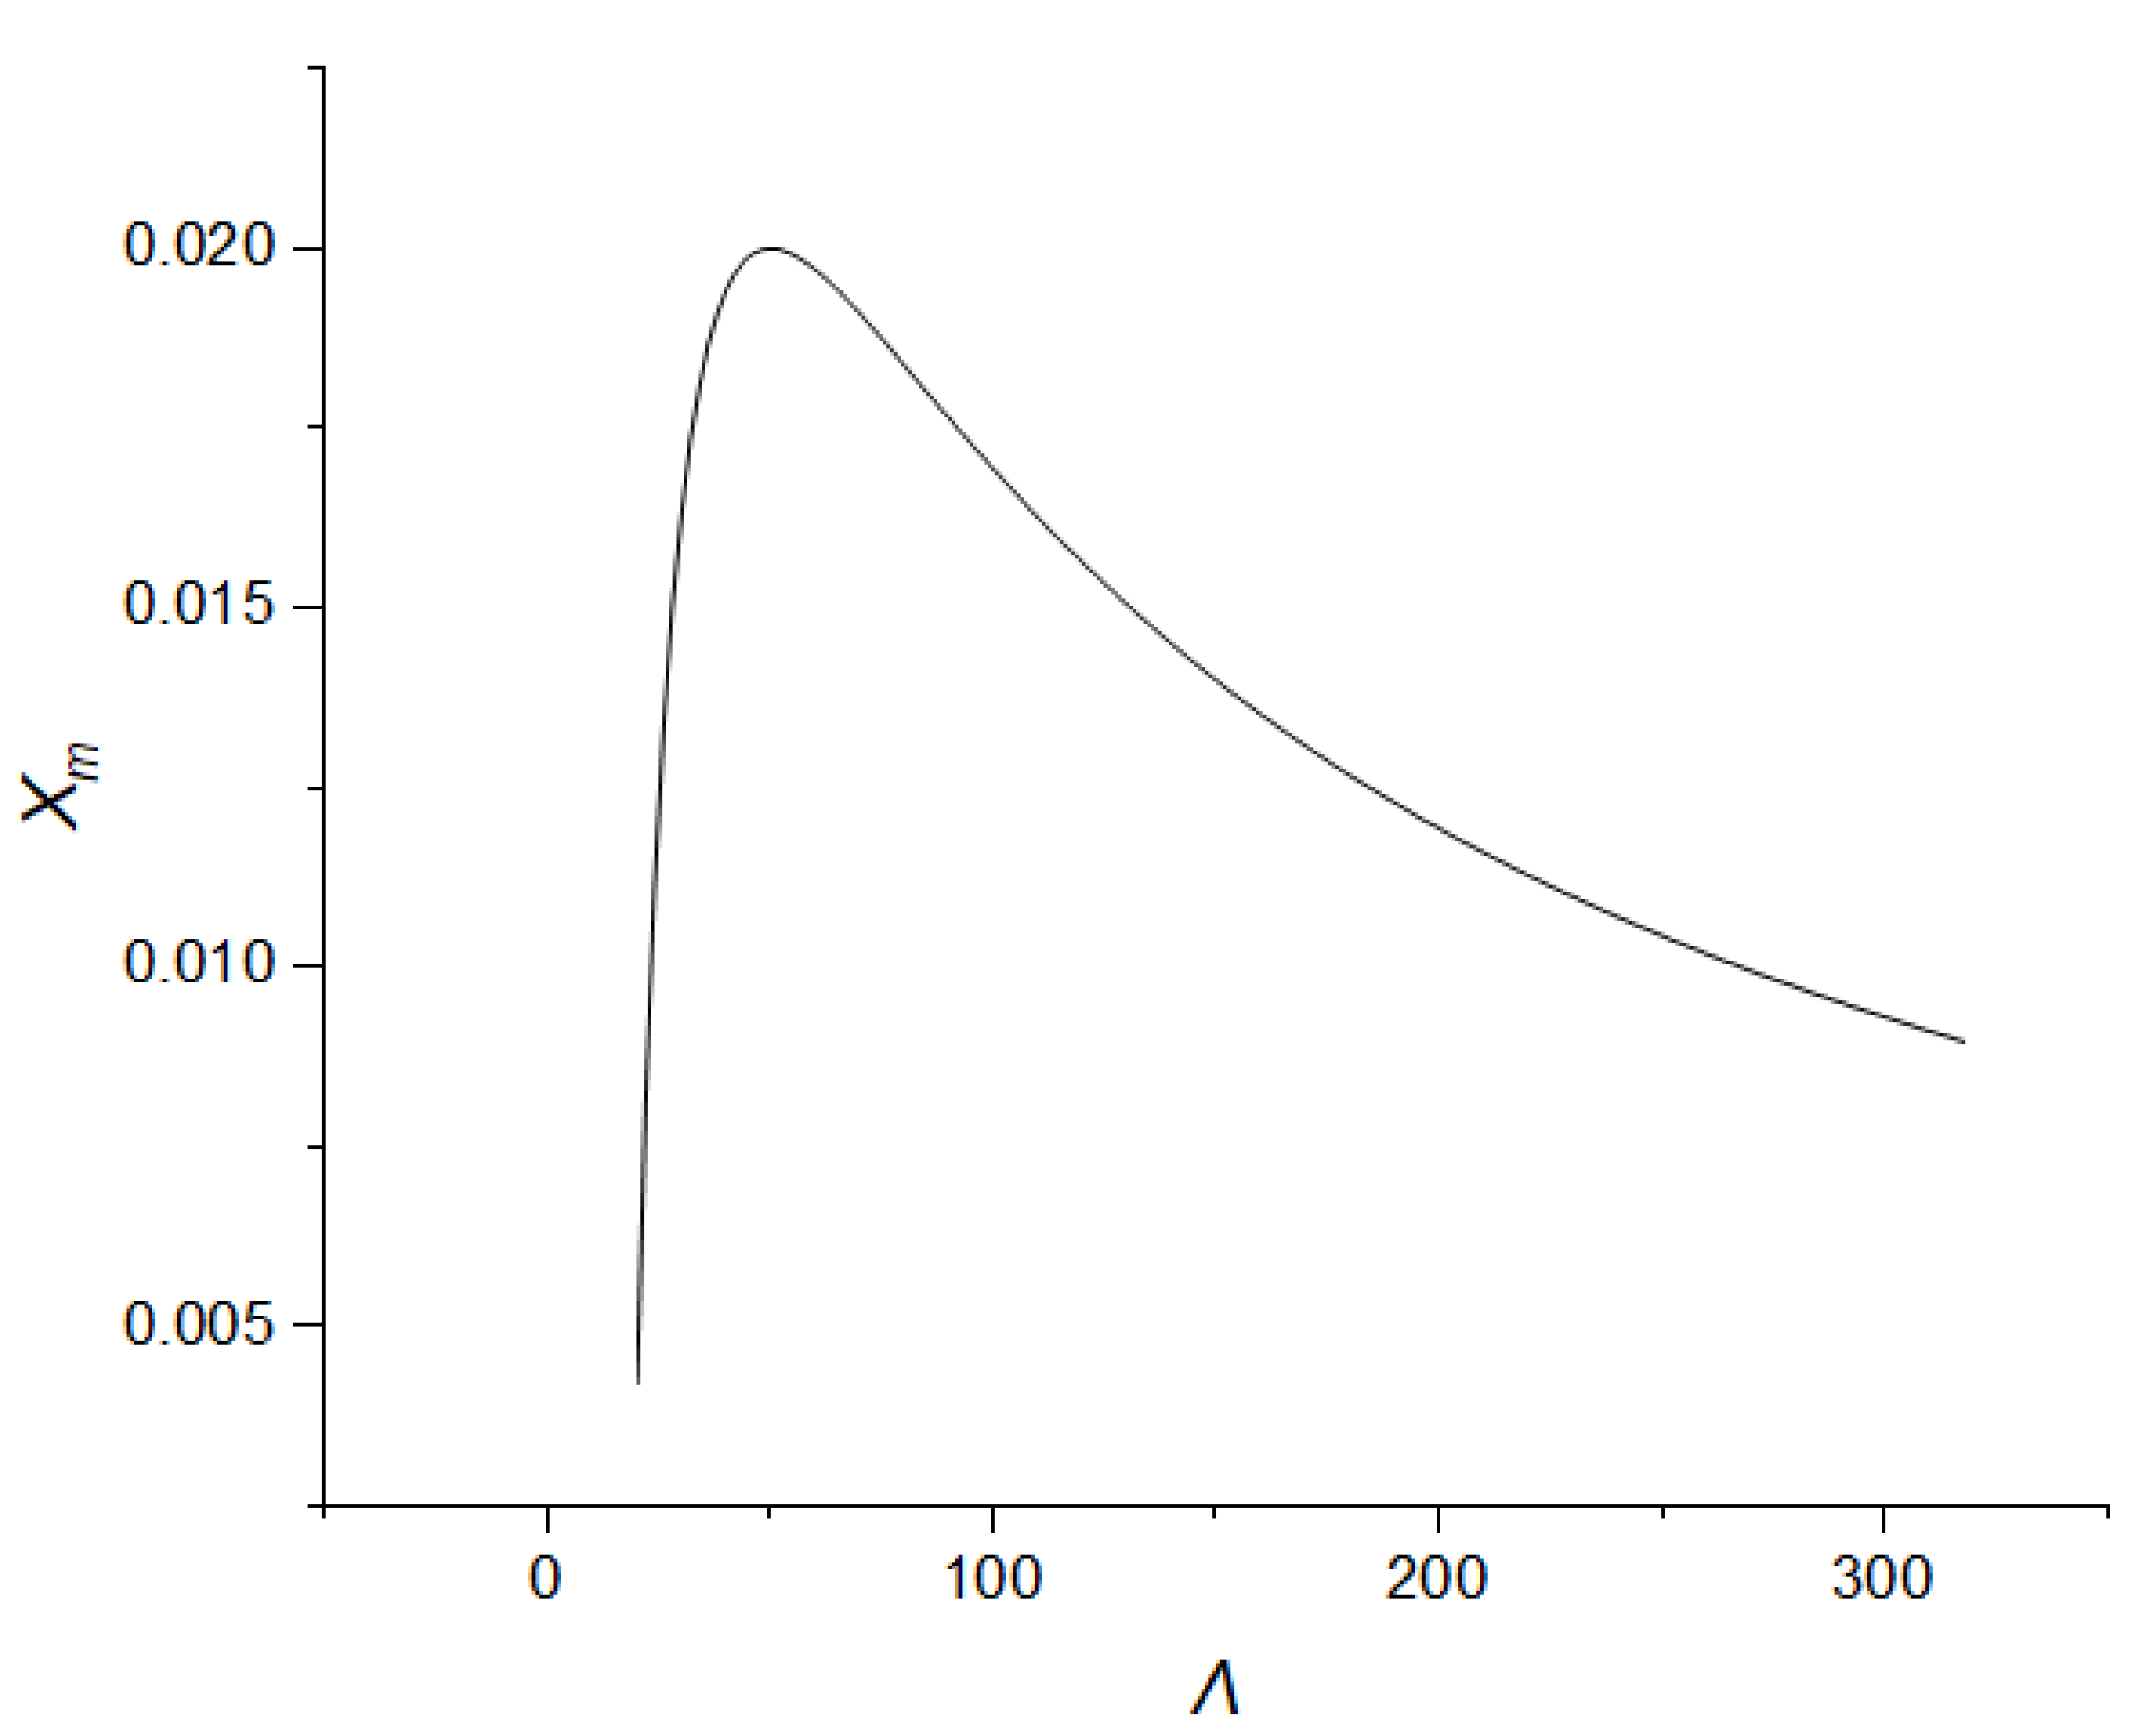
The objective is to determine the particle penetration depth. The penetration depth in a dimensionless form, as follows from the distribution for the trapped particles concentration (17), does not depend on the size of the near wellbore zone and the length of the fracture. Since the analytical solution to the distribution of the precipitated suspension has a close to exponential nature, the region of ultra-low values of the trapped particle content in the rock matrix does not play a significant role in the hydraulic resistance. Therefore, it is sufficient to restrict the analyzed region by the value X < Xm, where the content of trapped particles prevails over the injected concentration by more than e–1αo times. In this case, the penetration depth versus the filtration coefficient for the homogeneous layer is defined by the following formula:
X m = 1 Λ l n Λ T 0 e .
This function has the maximum value for the penetration depth when the dimensionless filtration coefficient is equal to Λ = 1/T0, and this maximum depth can be explained as follows: at low filtration coefficient values, the size of the suspension particles is too small, and they completely pass through the layer without being significant entrapped in the rock matrix and no lower-permeability zone is formed. With a high filtration coefficient value, the size of the suspension particles is too large in comparison with the pore sizes, and these particles cannot effectively penetrate the layer to a substantial depth. The superposition of these two factors gives a maximum Xm as a function of dimensionless filtration coefficient Λ.
The practical conclusion from this effect is that for a layer with a certain permeability there is a suspension with an optimal filtration coefficient value or average particle size (note that the filtration coefficient is defined by the ratio of average particle size to mean pore radius) and the treatment of this layer by such a suspension will give the maximum efficiency. Thus, the suspension must be selected according to particle size must be carried out considering the pore size of the target layer (the layer through which the injected water breaks into the production wells).
For the model reservoir, the optimal value of the filtration coefficient is Λ = 50 and the corresponding dimensional value is λ = 1.25 m–1, Figure 3. With such values, the maximum penetration depth of the particles is X = 0.02 or, for the dimensional value, it is 0.8 m.

3.2. Inflow Redistribution after Layered Strata Treatment

The uneven distribution of flows in a layered reservoir can be characterized by dispersion or standard deviation of the injection velocities in the interlayers from the mean value for the whole production thickness. The injection rate indicates the flow, but profile conformance improvement definitely means the equalization of the velocities in the interlayers. According to the definitions, these functions are equal:
U 0 a = 1 N i U i 0 ,     S 0 = 1 N i U i 0 U 0 a 2 ,
where U0a is mean value of injection velocities for interlayers and S0 is standard deviation of inflow before treatment.
In order that the redistribution characteristics of the flow in a reservoir are not tied to the pressure drop and are not dependent on the dimension, let us make the standard deviation dimensionless by the division on the average flow velocity in the reservoir:
S 0 d = 1 N i U i 0 U 0 a 1 2 .
The root-mean-square deviation after treatment will be similarly make dimensionless by the average velocity before treatment:
S 1 d = 1 N i U i 1 U 0 a U 1 a U 0 a 2 ,
where U1a is mean value of the inflow velocities in the interlayers after treatment:
U 1 a = 1 N i U i 1 .
In this case, in the formula for flow velocities in the interlayers after treatment (19), the pressure drop is assumed to be equal to the pressure drop before the treatment.
This root-mean-square deviation decreases with an increase in the injection volume, which indicates an equalization of the inflow velocities in the interlayers or an increase in the waterflooding efficiency. The difference between this deviation and the standard deviation before the treatment should serve as a dimensionless characteristic of the injection velocities redistribution or profile conformance improvement factor, as follows:
R 10 = S 0 d S 1 d .
For instance, let us consider a reservoir with five isolated layers with the parameters given in Table 1. The suspension flow characteristics have the following values: λ = 10 × 1/m and β = 400. The geometrical parameters of fracture and the near wellbore zone are as follows: l = 79 m and L = 40 m. The suspension parameters have the values: α0 = 0.02 and µ = 8 × 10⁻³ Pa∙s. The trapped particle distribution can be calculated using Equation (17), and the additional matrix resistivity, through (20). These calculations provide all information for the redistribution or the conformance improvement factor (26). The schematic algorithm of calculation is shown in Figure 4.
The calculation results are presented in Figure 5. With an increase in the injection volume, this factor increases from zero to a certain value determined by the initial spread of permeability. The calculations show that this factor is more sensitive to determination of interlayer heterogeneity and redistribution of the inflow than the Dykstra–Parson coefficient [27].
Another important characteristic of the process is a reduction in the total injectivity of the reservoir. This parameter characterizes the negative effect of the treatment. In order to maintain the injection rate, the wellhead pressure should be raised. Significant pressure growth requires changes in the operational conditions of a surface facility. The ratio of the total injectivity after treatment to the initial injectivity is determined by the formula
K 10 = W 1 W 0 = i k i h i g i j k j h j ,
where W0 and W1 are injection indexes before and after treatment.
Synthetic reservoir runs show that an increase in the injection volume causes a decrease in the introduced injectivity ratio parameter from a value of one to zero, Figure 6. For example, an injectivity ratio drop down to 70% of the initial value corresponds to an injection of T0 = 0.02 of near wellbore volume or 1302 m3.
The heterogeneity of the formation can be characterized by two parameters: standard deviation of inflow S0 and average permeability ka before treatment. A sensitivity analysis of the profile conformance improvement factor on these parameters was carried out to assess the impact of the reservoir heterogeneity. The input parameters were the same as in previous runs, but interlayer permeability was changed in order to set an average permeability 250 × 10–15 m2 and a standard deviation of inflow before treatment 6 × 10⁻⁶ m/s. The dimensionless volume of the injected suspension slug was defined as 0.05. Such a synthetic objective is selected as a basic variant. The profile conformance improvement factor R10 for the basic variant is equal to 0.662.
The average permeability of the synthetic reservoir was varied in the interval from 100 × 10–15 m2 to 400 × 10–15 m2 and the standard deviation of flow before treatment was changed from 3.5 × 10⁻⁶ m/s to 8.5 × 10⁻⁶ m/s. The variation of one factor with fixed value of another was provided by interlayers’ permeability variation. The relative change in the profile conformance improvement factor ΔR10 was introduced in order to compare the influence of various factors. This parameter is determined by the formula
Δ R 10 = R 10 R 10 a R 10 a ,
where R10a is an average profile conformance improvement factor for the boundary values of varied factors.
The results of the sensitivity analysis of the profile conformance improvement factor from the heterogeneity of the reservoir are shown in Figure 7. The increase in the factor values is determined by blue color, and decrease by dark red. Notably, for the basic variant the relative value of the average profile conformance improvement factor equals zero. Negative values mean preferential conditions for conformance improvement and positive magnitudes, on the contrary, mean worse conditions.

4. Conclusions

  • A deep-bed suspension migration model was used to solve the problem of well treatment for profile conformance improvement and water control.
  • An analytical solution to the stated problem was obtained. The distributions of suspended and trapped particles were analyzed.
  • It was established that the particle penetration depth versus the suspension filtration coefficient function had a pronounced maximum. This means that, for a layer with certain permeability, there is a suspension with an optimal filtration coefficient or average particle size and the treatment of this layer by such a suspension gives the maximum efficiency.
  • The dimensionless characteristic of the injection rate redistribution or profile conformance improvement factor, which characterizes the performance of suspension injector treatment, was introduced. This factor has increased from zero to a certain value determined by the initial distribution of permeability with an increase in suspension injection volume.
  • The negative factor of well suspension treatment was analyzed. Synthetic reservoir runs showed that an increase in the injection volume causes a decrease in the introduced injectivity ratio parameter value from one to zero.
  • Sensitivity analysis of the reservoir heterogeneity influence on the conditions of effective conformance improvement treatment gave unexpected results. It was shown that such a treatment is preferential in low permeable reservoirs.

Author Contributions

Conceptualization, K.M.F.; methodology, A.Y.G.; software, A.Y.G. and A.P.S.; formal analysis and investigation, A.P.S.; resources and data curation, A.V.K. and D.A.A.; writing—original draft preparation, K.M.F.; writing—review and editing, visualization, A.Y.G.; supervision, K.M.F.; project administration, A.V.K.; funding acquisition, A.Y.G. All authors have read and agreed to the published version of the manuscript.

Funding

This research was funded by the Russian Foundation for Basic Research and Tyumen Region, grant number 20-45-720002.

Institutional Review Board Statement

Not applicable.

Informed Consent Statement

Not applicable.

Data Availability Statement

The data presented in this study are available on request from the corresponding author. The data are not publicly available due to privacy.

Conflicts of Interest

The authors declare no conflict of interest.

Nomenclature

kAbsolute permeability coefficient (Unit: m2)
kiAbsolute permeability coefficient of the i-th interlayer (Unit: m2)
rpAverage particle radius (Unit: m)
kaAverage permeability before treatment (Unit: m2)
R10aAverage profile conformance improvement factor for the boundary values of varied factors (Unit: dimensionless)
βDamage factor (Unit: dimensionless)
XDimensionless coordinate (Unit: dimensionless)
ΛDimensionless filtration coefficient (Unit: dimensionless)
ViDimensionless injection index of i-th layer (Unit: dimensionless)
XmDimensionless penetration depth (Unit: dimensionless)
S1dDimensionless standard deviation of inflow after the treatment (Unit: dimensionless)
S0dDimensionless standard deviation of inflow before the treatment (Unit: dimensionless)
TDimensionless time (Unit: dimensionless)
T0Dimensionless volume of suspension slug (Unit: dimensionless)
μEffective suspension viscosity (Unit: Pa∙s)
nEmpirical dimensionless parameter (Unit: dimensionless)
λ0Empirical parameter with the dimension of the filtration coefficient (Unit: m–1)
λFiltration coefficient (Unit: m–1)
T1First dimensionless time moment (Unit: dimensionless)
UFluid rate (Unit: m/s)
UiFluid rate in the i-th layer (Unit: m/s)
Ui1Inflow velocity in the i-th interlayer after the treatment (Unit: m/s)
Ui0Inflow velocity in the i-th interlayer before the treatment (Unit: m/s)
α0Initial particle content in the injection flow (Unit: dimensionless)
W1Injection index after the treatment (Unit: m3/(Pa∙s))
W0Injection index before the treatment (Unit: m3/(Pa∙s))
Q0Injection rate during suspension inflow (Unit: m3/s)
PIn-situ pressure (Unit: Pa)
giIntegral that determines the additional hydraulic resistance in the zone of trapped particles for i-th interlayer (Unit: dimensionless)
iInterlayer number (Unit: dimensionless)
jInterlayer number (Unit: dimensionless)
lLength of a fracture (Unit: m)
LLength of a near wellbore zone (Unit: m)
xLinear coordinate perpendicular to the fracture inner surface (Unit: m)
DMean pore radius (Unit: m)
U0aMean value of injection velocities for interlayers before treatment (Unit: m/s)
U1aMean value of the inflow velocities in the interlayers after treatment (Unit: m/s)
hiNet thickness of the i-th interlayer (Unit: m)
HNet thickness of the reservoir (Unit: m)
NNumber of layers (Unit: dimensionless)
JParticle entrapment rate (Unit: s–1)
Porosity (Unit: dimensionless)
iPorosity of the i-th interlayer (Unit: dimensionless)
ΔPPressure drop (Unit: Pa)
ΔP1Pressure drop after the treatment (Unit: Pa)
ΔP0Pressure drop before the treatment (Unit: Pa)
R10Profile conformance improvement factor (Unit: dimensionless)
K10Ratio of the total injectivity after treatment to the initial injectivity (Unit: dimensionless)
ΔR10Relative change in the profile conformance improvement factor (Unit: dimensionless)
T2Second dimensionless time moment (Unit: dimensionless)
S0Standard deviation of inflow before the treatment (Unit: m/s)
tTime (Unit: s)
t0Time of the injection of suspension slug (Unit: s)
QTotal suspension injection rate (Unit: m3/s)
αVolumetric particle content moving with the flow (Unit: dimensionless)
αiVolumetric particle content moving with the flow in the i-th layer (Unit: dimensionless)
σVolumetric particle content trapped in the unit volume of porous media (Unit: dimensionless)
σiVolumetric particle content trapped in the unit volume of porous media in the i-th layer (Unit: dimensionless)
Q1Water injection rate after well treatment (Unit: m3/s)

References

  1. El-Karsani, K.S.M.; Al-Muntasheri, G.A.; Hussein, I.A. Polymer Systems for Water Shutoff and Profile Modification: A Review Over the Last Decade. SPE J. 2014, 19, 135–149. [Google Scholar] [CrossRef]
  2. Parasyuk, A.V.; Galantsev, I.N.; Sukhanov, V.N.; Ismagilov, T.A.; Telin, A.G.; Barinova, L.N.; Igdavletova, M.Z.; Skorokhod, A.G. Gel compositions for injection profile improvement with selective action. Neftyanoye Khozyaystvo = Oil Ind. 1994, 72, 64–68. (in Russian). [Google Scholar]
  3. Khisamov, R.S.; Gazizov, A.A.; Gazizov, A.S. Scientific and technological basis of suspension application for enhanced oil recovery. Neftyanoye Khozyaystvo = Oil Ind. 2002, 80, 52–56. (in Russian). [Google Scholar]
  4. Zhao, H.; Zhao, P.; Bai, B.; Xiao, L.; Liu, L. Using Associated Polymer Gels to Control Conformance for High Temperature and High Salinity Reservoirs. J. Can. Pet. Technol. 2006, 45, 49–54. [Google Scholar] [CrossRef]
  5. Caili, D.; Qing, Y.; Fulin, Z. In-depth Profile Control Technologies in China—A Review of the State of the Art. Pet. Sci. Technol. 2010, 28, 1307–1315. [Google Scholar] [CrossRef]
  6. Seright, R.S.; Prodanovic, M.; Lindquist, W.B. X-Ray Computed Microtomography Studies of Fluid Partitioning in Drainage and Imbibition Before and After Gel Placement: Disproportionate Permeability Reduction. SPE J. 2006, 11, 159–170. [Google Scholar] [CrossRef] [Green Version]
  7. Kabir, A. Chemical Water & Gas Shutoff Technology-An Overview. In Proceedings of the SPE Asia Pacific Improved Oil Recovery Conference, Kuala Lumpur, Malaysia, 8–9 October 2001; p. 72119. [Google Scholar]
  8. Seright, R.; Lane, R.; Sydansk, R. A Strategy for Attacking Excess Water Production. SPE Prod. Facil. 2003, 18, 158–169. [Google Scholar] [CrossRef] [Green Version]
  9. Khasanov, M.M.; Ismagilov, T.A.; Mangazeev, V.P.; Rastrogin, A.Y.; Kolchugin, I.S.; Tyan, N.S. Application of gelled polymer solutions for enhanced oil recovery. Neftyanoye Khozyaystvo = Oil Ind. 2002, 80, 110–112. (In Russian) [Google Scholar]
  10. Fedorov, K.M.; Shevelev, A.P.; Kobyashev, A.V.; Zakharenko, V.A.; Kochetov, A.V.; Neklesa, R.S.; Usoltsev, A.V. Determination of Suspension Filtration Parameters from Experimental Data. In Proceedings of the Day 4 Thu, Virtual. 29 October 2020; p. 202018. [Google Scholar]
  11. Herzig, J.P.; Leclerc, D.M.; Goff, P.L. Flow of Suspensions through Porous Media—Application to Deep Filtration. Ind. Eng. Chem. 1970, 62, 8–35. [Google Scholar] [CrossRef]
  12. Logan, J.D. Transport Modeling in Hydrogeochemical Systems; Springer Science and Business Media LLC: Berlin/Heidelberg, Germany, 2001; pp. 1–190. [Google Scholar]
  13. Alvarez, A.C.; Bedrikovetsky, P.; Hime, G.; O Marchesin, A.; Marchesin, D.; Rodrigues, J.R. A fast inverse solver for the filtration function for flow of water with particles in porous media. Inverse Probl. 2005, 22, 69–88. [Google Scholar] [CrossRef]
  14. Bedrikovetsky, P.; de Siqueira, F.D.; Furtado, C.A.; Souza, A.L.S. Modified Particle Detachment Model for Colloidal Transport in Porous Media. Transp. Porous Media 2010, 86, 353–383. [Google Scholar] [CrossRef]
  15. Sacramento, R.N.; Yang, Y.; You, Z.; Waldmann, A.; Martins, A.L.; Vaz, A.S.; Zitha, P.L.; Bedrikovetsky, P. Deep bed and cake filtration of two-size particle suspension in porous media. J. Pet. Sci. Eng. 2015, 126, 201–210. [Google Scholar] [CrossRef]
  16. Wang, J.; Liu, H.-Q.; Wang, Z.-L.; Hou, P.-C. Experimental Investigation on the Filtering Flow Law of Pre-gelled Particle in Porous Media. Transp. Porous Media 2012, 94, 69–86. [Google Scholar] [CrossRef]
  17. Barenblatt, G.I.; Entov, V.M.; Ryzhik, V.M. Theory of Fluid Flows through Natural Rocks; Springer Science and Business Media LLC: Berlin/Heidelberg, Germany, 1990; pp. 1–396. [Google Scholar]
  18. Nigmatulin, R.I. Dynamics of Multiphase Media; Hemisphere: New York, NY, USA, 1991; Volume 1, pp. 1–532. [Google Scholar]
  19. Rodriguez, E.; Bryant, S.L. Straining of Fine Particles in Gaps in Porous Media. In Proceedings of the SPE Annual Technical Conference and Exhibition, Anaheim, CA, USA, 11–14 November 2007; p. 110425. [Google Scholar]
  20. Bai, B.; Liu, Y.; Coste, J.-P.; Li, L. Preformed Particle Gel for Conformance Control: Transport Mechanism Through Porous Media. SPE Reserv. Eval. Eng. 2007, 10, 176–184. [Google Scholar] [CrossRef] [Green Version]
  21. Kaspar, P.; Sobola, D.; Částková, K.; Dallaev, R.; Šťastná, E.; Sedlák, P.; Knápek, A.; Trčka, T.; Holcman, V. Case Study of Polyvinylidene Fluoride Doping by Carbon Nanotubes. Materials 2021, 14, 1428. [Google Scholar] [CrossRef] [PubMed]
  22. Wang, J.; Liu, H.-Q.; Zhang, H.-L.; Sepehrnoori, K. Simulation of deformable preformed particle gel propagation in porous media. AIChE J. 2017, 63, 4628–4641. [Google Scholar] [CrossRef]
  23. Nikiforov, A.I.; Nikanshin, D.P. On Numerical Simulation of Oil Reservoir Colmatation by Various Size Particles. In Proceedings of the International Conference on Multiphase Systems, Ufa, Russia, 15–17 June 2000; pp. 437–439. [Google Scholar]
  24. Bedrikovetsky, P.; Zeinijahromi, A.; de Siqueira, F.D.; Furtado, C.A.; De Souza, A.L.S. Particle Detachment Under Velocity Alternation During Suspension Transport in Porous Media. Transp. Porous Media 2011, 91, 173–197. [Google Scholar] [CrossRef]
  25. Fedorov, K.; Zubkov, P. Placement of gels in stratified reservoirs using a sequential injection technique. J. Pet. Sci. Eng. 1996, 15, 69–80. [Google Scholar] [CrossRef]
  26. Vaz, A.; Bedrikovetsky, P.; Fernandes, P.; Badalyan, A.; Carageorgos, T. Determining model parameters for non-linear deep-bed filtration using laboratory pressure measurements. J. Pet. Sci. Eng. 2017, 151, 421–433. [Google Scholar] [CrossRef]
  27. Willhite, G.P. Waterflooding; Society of Petroleum Engineers: Richardson, TX, USA, 1986; pp. 1–326. [Google Scholar]
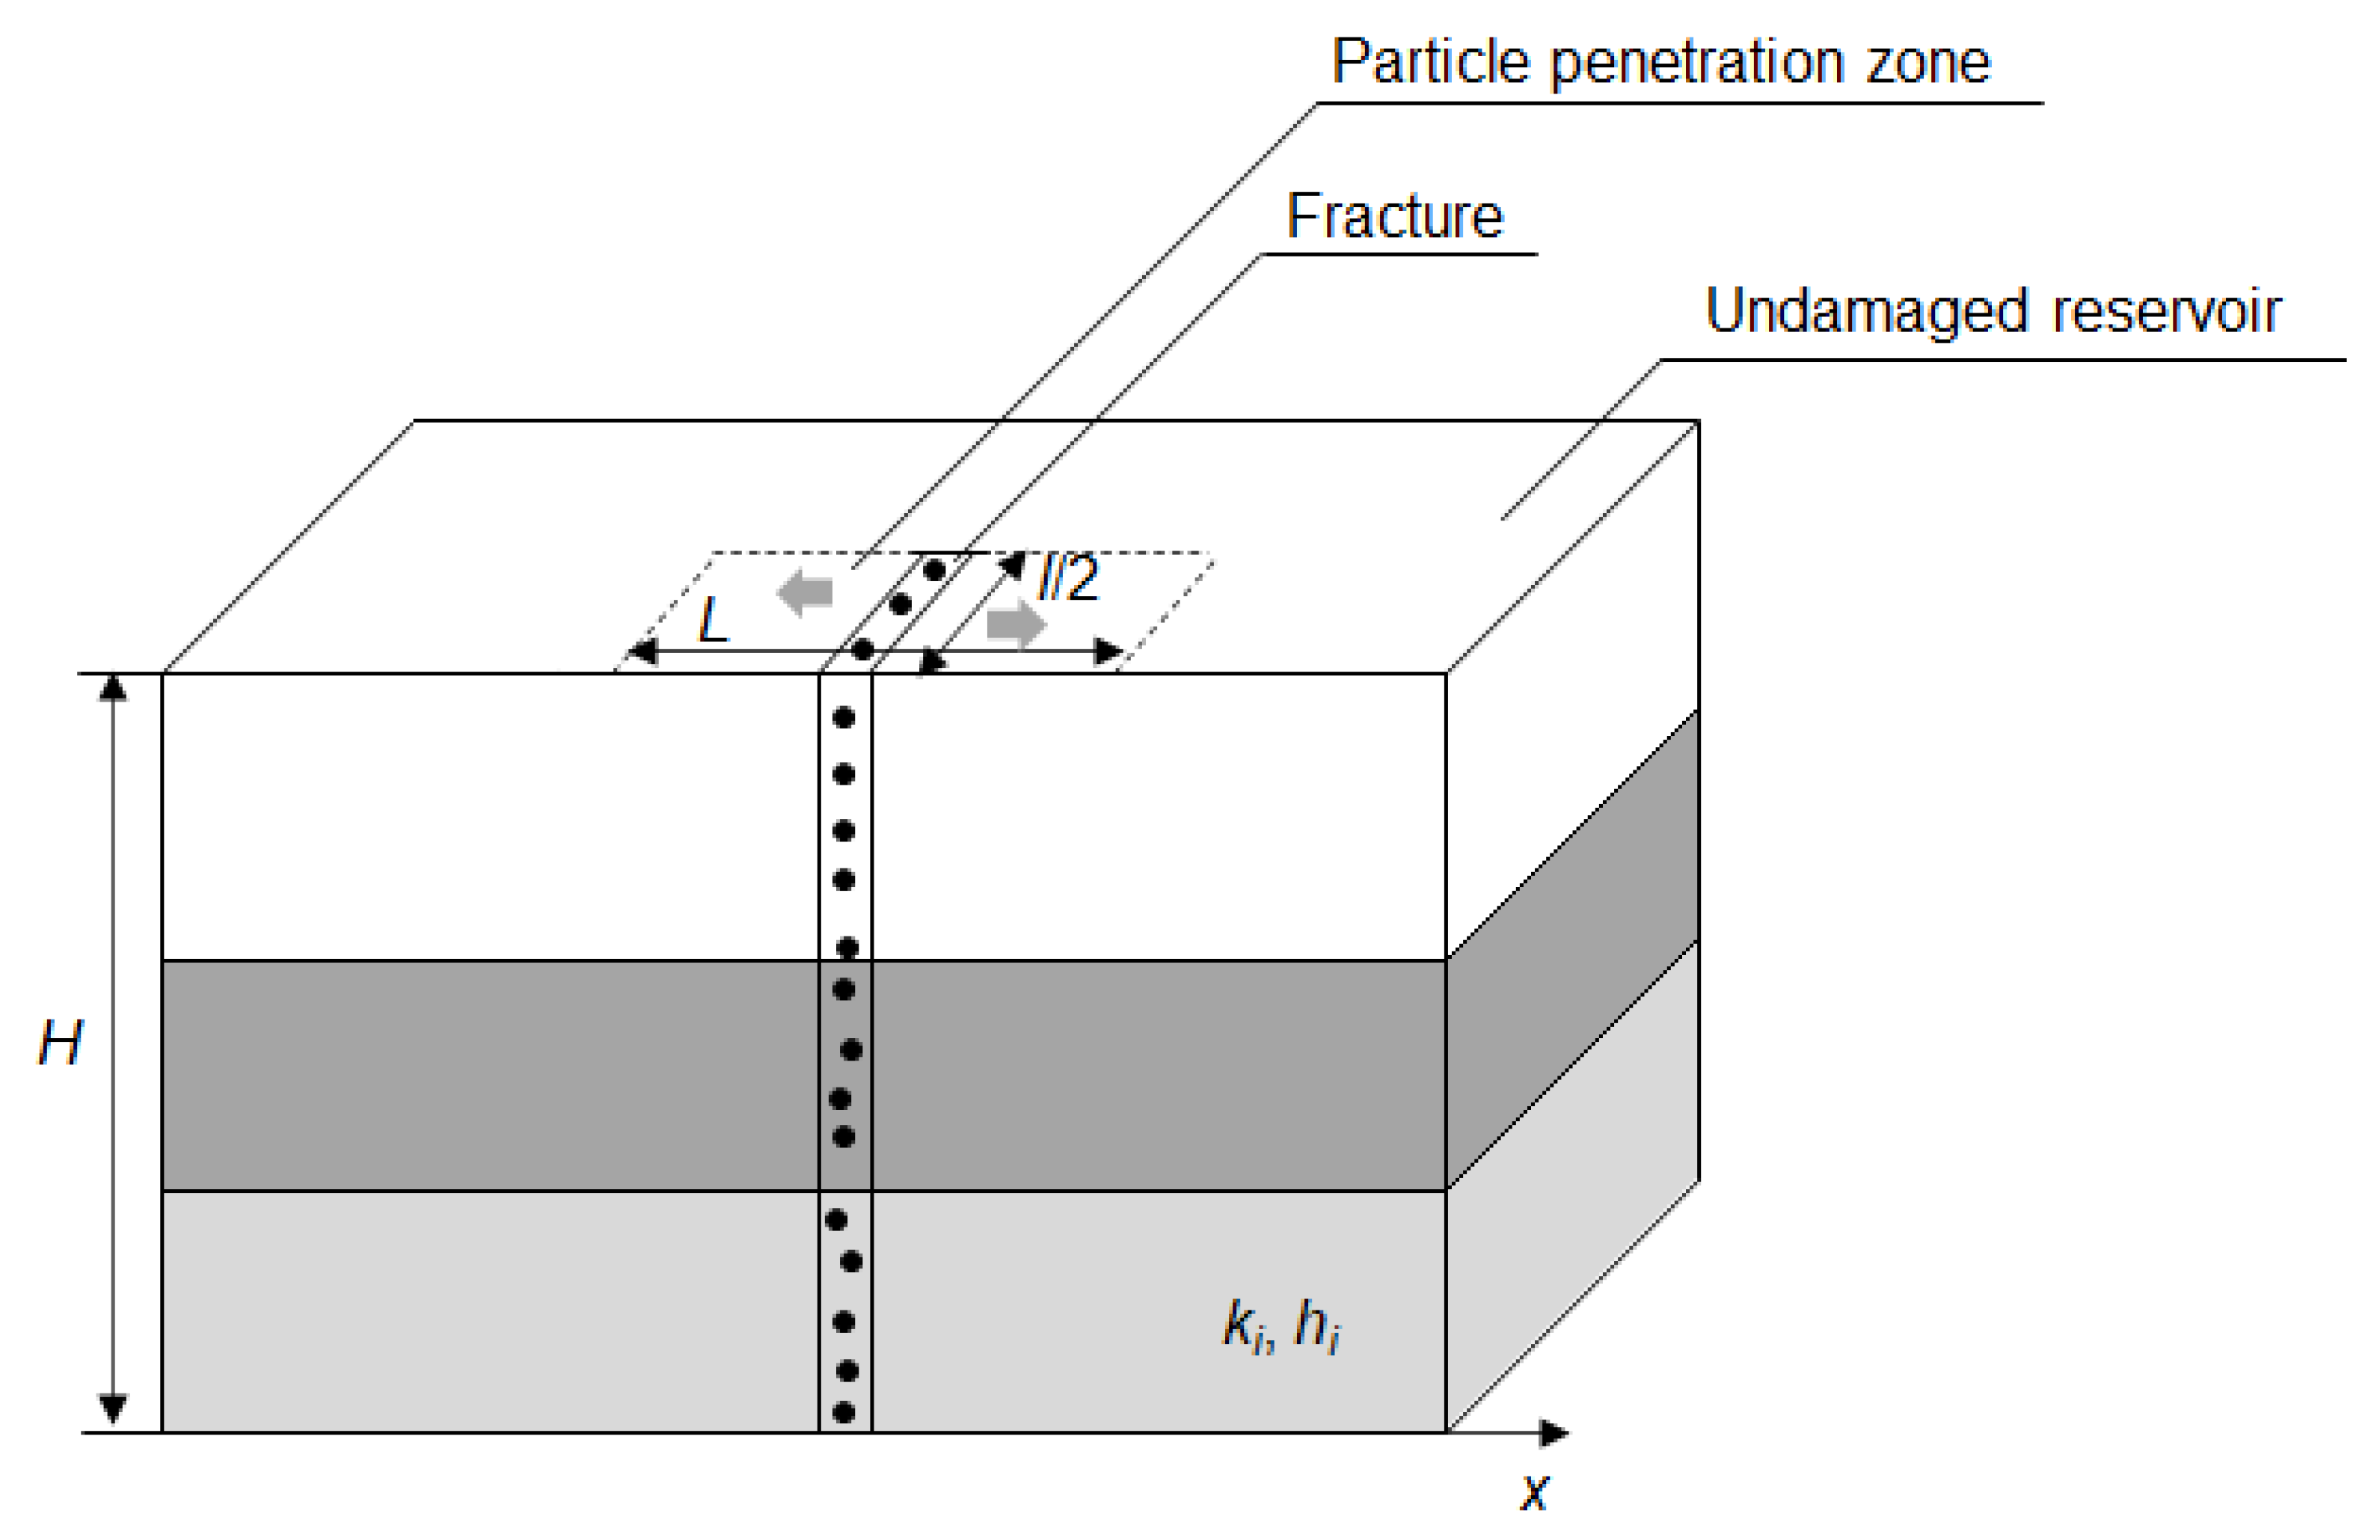
Figure 1. Schematic view of a suspension injection process in the layered strata through a fracture.
Mathematics 09 01727 g001
Figure 2. Distribution of suspended and trapped particles in three time moments: (a) During suspension injection for dimensionless time moments T1 and T2; (b) during suspension slug displacement by water.
Mathematics 09 01727 g002
Figure 3. Penetration depth of particles Xm as a function of dimensionless filtration coefficient Λ for a layer.
Mathematics 09 01727 g003
Figure 4. The schematic algorithm of calculation of conformance improvement factor.
Mathematics 09 01727 g004
Figure 5. Calculation data on flow profile redistribution R10 from the dimensionless suspension injected volume T0.
Mathematics 09 01727 g005
Figure 6. Variation of the total injectivity after the treatment divided by the initial value K10 with the suspension injected volume T0.
Mathematics 09 01727 g006
Figure 7. Sensitivity analysis of the profile conformance improvement factor from the heterogeneity of the reservoir.
Mathematics 09 01727 g007
Table 1. Parameters of the model reservoir layers.
Layer Numberkihii
11213 × 10–15 m21.30 m0.236
2371 × 10–15 m21.40 m0.209
352 × 10–15 m24.70 m0.189
4106 × 10–15 m21.60 m0.201
5135 × 10–15 m21.30 m0.196
Publisher’s Note: MDPI stays neutral with regard to jurisdictional claims in published maps and institutional affiliations.