1. Introduction
Atrial arrhythmias are the most commonly sustained cardiac arrhythmias in humans worldwide. Furthermore, the prevalence of atrial arrhythmias is increasing, but the understanding of the cause and mechanisms behind these arrhythmias is lacking. While atrial fibrillation is not a direct cause of mortality, it can nevertheless indirectly contribute to it through other means. There is a proven relationship between atrial fibrillation (AF) and strokes, myocardial infarctions, and heart failure [
1].
This connection with cardiovascular-based mortality has resulted in a clear motivation for the in-depth study of cardiovascular anatomy and physiology. This includes modelling the behaviour of the human atria from the cellular and sub-cellular scale [
2,
3,
4,
5,
6,
7,
8], through tissue models [
9] and whole atrial models [
10,
11,
12,
13,
14,
15], to full torso scale models [
16,
17].
In silico modelling is highly relied upon for developing our understanding of the atrial behaviour preceding, during, and resulting from atrial fibrillation [
1]. As a result, it is imperative that these models accurately represent the state and behaviour of the human atria under these conditions. One way in which this is managed is by collecting this information from patients to validate the models through experimental means and tissue samples [
18,
19,
20,
21,
22,
23,
24,
25,
26,
27,
28,
29,
30,
31,
32,
33,
34]. Experimental methods show a large range of variability, both in individual patients (cellular and regional electrophysiology) and between patients (electrophysiological and anatomical) [
18,
19,
20,
21,
22,
23,
24,
25,
26,
27,
28,
29,
30,
31,
32,
33,
34].
When creating an in silico model that represents the atrial behaviour of a patient, the framework for such a model requires all multiscale information in order to provide results that are both reliable and meaningful. Introducing the variability observed in patients into the in silico models can be both difficult and computationally expensive. For these reasons, most atrial in silico models contain regional electrophysiological variability, but lack the cellular variability within regions observed in the human atria. The assumption made is that cellular variability has a negligible impact on the electrophysiological behaviour of the atria due to the cell-to-cell coupling.
In recent years, however, there has been a push to investigate the impact of cellular variability through the use of the population of models approach [
2,
3,
6,
8]. To date, very few of these studies have been further pursued to introduce cellular variability into tissue models [
9] or the whole atrial model [
10]. To further complicate matters, there is a notable lack of histological data with regards to cellular behaviour and cellular variability in the regional tissues of patients suffering from atrial fibrillation [
8,
11,
15,
20].
Due to limited histological data, standard practices used to simulate atrial remodelling in tissues typically involves a percentage change in certain ion channels within the cells of the atria [
11]. These percentage changes, however, ignore the possibility of inter-channel conductance relationships [
2], and are yet to be applied to atrial models that include cellular variability, with the exception of one tissue study and one atrial study [
9,
10].
This paper aims to present the use of this typical method for AF remodelling within a population of models, and compare it to a proposed method using classification based on AP morphology. In the proposed method, histological data from the healthy human atria was combined with the limited information available regarding regional cellular histological data in AF patients. The proposed method requires the assumption that similar percentage changes would occur across all regions of the atria. The aim was to compare the two methods and determine whether either method was superior, or if both methods resulted in similar changes to the behaviour and histology of a population of atrial cells. Populations were created using two cellular models [
5,
7] to determine if the observed results were independent of or dependent on the model type.
2. Materials and Methods
2.1. Creation of POM
Using the Monte Carlo sampling method, a population of 200,000 unique action potentials was created using the Maleckar cellular model [
5]; varying 9 maximum channel conductances by a range of −100% to +200% of the standard value. This was accomplished by multiplying the set value for each maximum conductance by a value between zero and three. In the figures presented in this paper, this is denoted as an amplitude, such as AgTo for the gTo channel conductance. This population was duplicated using the Courtemanche cellular model [
7], resulting in two independent populations.
Other POM approaches are more sophisticated [
3,
6]. The method chosen for the creation of the POM is the simplest to implement and only relies on the action potential morphology for calibration. The large range in the POM enabled the inclusion of all possible channel expressions, from complete conductance block to overexpression due to compensation or remodelling. The larger distribution range, combined with the varying of 9 channel conductances independently, created a non-biased population that can be calibrated purely on the characteristics of the action potential morphology, without first assuming limitations or characteristics of the channel conductances.
The 9-maximum channel conductances that were varied for the population creation were: the sodium channel (gNa); the independent transient outward potassium current (gTo); the ultra-rapid rectifier potassium current (gKur); the rapid rectifier potassium current (gKr); the slow rectifier potassium current (gKs); the inward rectifier potassium channel (gK1); the L-type calcium channel (gCaL); the sodium-potassium pump (gNaK); and the sodium-calcium ion exchanger current (gNaCa).
The simulations were re-run, applying a 100 stimulus of amplitude −45 pico Amp per pico Farad, at a rate of 1 Hz and 1 ms duration with an additional single stimulus whereby the values of biomarkers were calculated. The stimulation protocol was followed by a pe-riod of 10 s without stimulation in order to observe the stability of the model.
Prior to clustering, exclusion criteria was used to prevent mathematically unstable, self exciting or unrealistic action potentials to be included in the populations. Exclusion criteria included any mathematically unstable action potentials, as for instance action po-tentials with spontaneous depolarization activity, any action potentials with an abnormal peak voltage, or peak voltages below zero, any with an APD larger than 1 s, a resting potential less negative than −50 mV.
The software packages used to create and stimulate the population was MATLAB 2019b (The Mathworks Inc., Natick, MA, USA). MATLAB 2019b (The Mathworks Inc.) was used to classify the created populations along with the statistical analysis methods presented.
2.2. Clustering Healthy Action Potentials
A complete characterization of the action potential morphology for all regions within the human atria does not currently exist. This is, in part, due to the large range of variability observed in experimental data [
3,
11,
15,
17,
20,
24,
27,
33,
35,
36], in addition to the difficulty in collecting, and therefore testing, human tissue from all atrial regions. There is, however, more experimental data available for other species [
19,
22,
23,
25,
28,
29,
34,
37,
38], which can be used to supplement the available human data. In this study, the data available for characterising human atrial regions [
3,
11,
15,
17,
20,
24,
33,
35,
36] was combined with available canine data [
19,
22,
23,
25,
28,
29,
34,
37,
38], and scaled appropriately. The choice of canine data was based on the similarities observed between human and canine action potential morphology.
For characterisation, five biomarkers were defined for eight atrial regions. The biomarkers used were the resting membrane potential (RMP), the action potential amplitude (APA), and the action potential at 20%, 50%, and 90% repolarization (APD20, APD50, and APD90, respectively). The eight atrial regions defined were the right and left atria (RA and LA, respectively); the right and left atrial appendages (RAA and LAA, respectively); the pectinate muscles (PM), the atrioventricular rings (AVR), the crista terminalis right Bachmann’s bundle (CTBBr), and the left side of the Bachmann’s bundle (BBl).
Human atria-based data is available mainly for the RAA region due to the difficulties associated with collecting atrial cells from patients. Data collated from [
3,
8,
20,
27,
33] provide a complete characterisation of the RAA region. The RMP and APA for the BB are presented in [
29]. Further, [
11,
15,
17] all show regional comparisons for APD90. Other regions lack published data for other biomarkers. For this reason, canine data was used to supplement human data for the other atrial regions.
RMP, APA, APD50, and APD90 in the canine atria were reported in [
34] for RA and LA regions. Experimental values for the LAA, RAA, CT, BB, PM, and AVR regions were reported in [
19]. Combining this data with the experimental data of human atrial myocytes created a near-complete characterization of the human atria. One complication, however, was that, though the canine action potential morphology is similar to human atrial action potentials, the canine action potential is typically smaller than that of the human atria. Therefore, to use canine data to supplement human data, scaling is required.
The scaling value used for each atrial region was calculated by comparing the change in the biomarker value between the canine data and human data for the RAA. It was assumed that the percentage change in each biomarker between canine and human data was consistent across atrial regions. The regional characterization of the RMP, APA, APD50, and APD90 for the atrial regions was therefore calculated by combining the canine values for the atrial regions and the scalar change in the biomarker result.
The APD20 was kept consistent across all regions due to the limited information available for APD20 in both canine and human cells.
Table 1 shows the values of the mean and standard deviations used to characterise each atrial region. For regional populations, a range of the mean plus-minus two standard deviations was accepted. For an individual action potential to be accepted into an atrial region, the value for all five biomarkers were within the defined range.
2.3. AF Remodelling Using the Percentage Method
As previously used in AF remodelling [
11], the percentage changes shown in
Table 2 were applied to each individual cellular model for the corresponding regions. The simulations were re-run, using the same protocol as the healthy population and the same exclusion criteria. The change in the gTo channel was constant across all regions, due to different papers reporting varying changes. These reports included RA and LA having the same impact on gTo [
34], changes of 50% [
13] or 45% in the RA and 75% in the LA [
11], which contradicted [
4], whereby RA was reduced by 80% and LA was reduced by 45%. Similarly, there were varying findings on the gKur channel conductance, and, as a result, the LA regions were set as 45% (lowest observed change) and the RA regions were set as 75% (highest observed change).
2.4. Biomarker-Based AF Remodeling
Using biomarkers for calibrating AF remodelled populations is more difficult than for healthy populations, owing to the lack of available data. As previously stated, a complete characterisation of regional action potential morphology does not exist. Further to this, there is even less experimental data available than that of the healthy atrial regions. For the purpose of regional classification, all available data was combined to create a complete set of biomarkers for each atrial region. It was assumed that the percentage changes between the healthy and AF remodelled tissue remained consistent across all atrial regions. Additionally, it was assumed, that, with the exception of the APD20, whereby there is experimental data [
8], the variability was unchanged due to AF remodelling.
Table 3 shows the final regional biomarkers mean and standard deviation for the AF remodelled case. The mean and two standard deviations were accepted for each regional biomarker. Using the same initial populations identified in
Section 2.1 for the Courtemanche and Maleckar models, the AF remodelled biomarkers created new populations for each atrial region.
2.5. Statistical Analysis
Boxplots were used to show the distribution of biomarkers and channel conductances across regions and between atrial models and AF remodelling methods. The boxplots are presented with confidence intervals, showing the median and interquartile ranges of each atrial region for each method.
Further analysis included the comparison of the different AF remodelling techniques through the percentage change for the mean biomarkers and mean channel conductances from the healthy atrial populations to the AF remodelled populations.
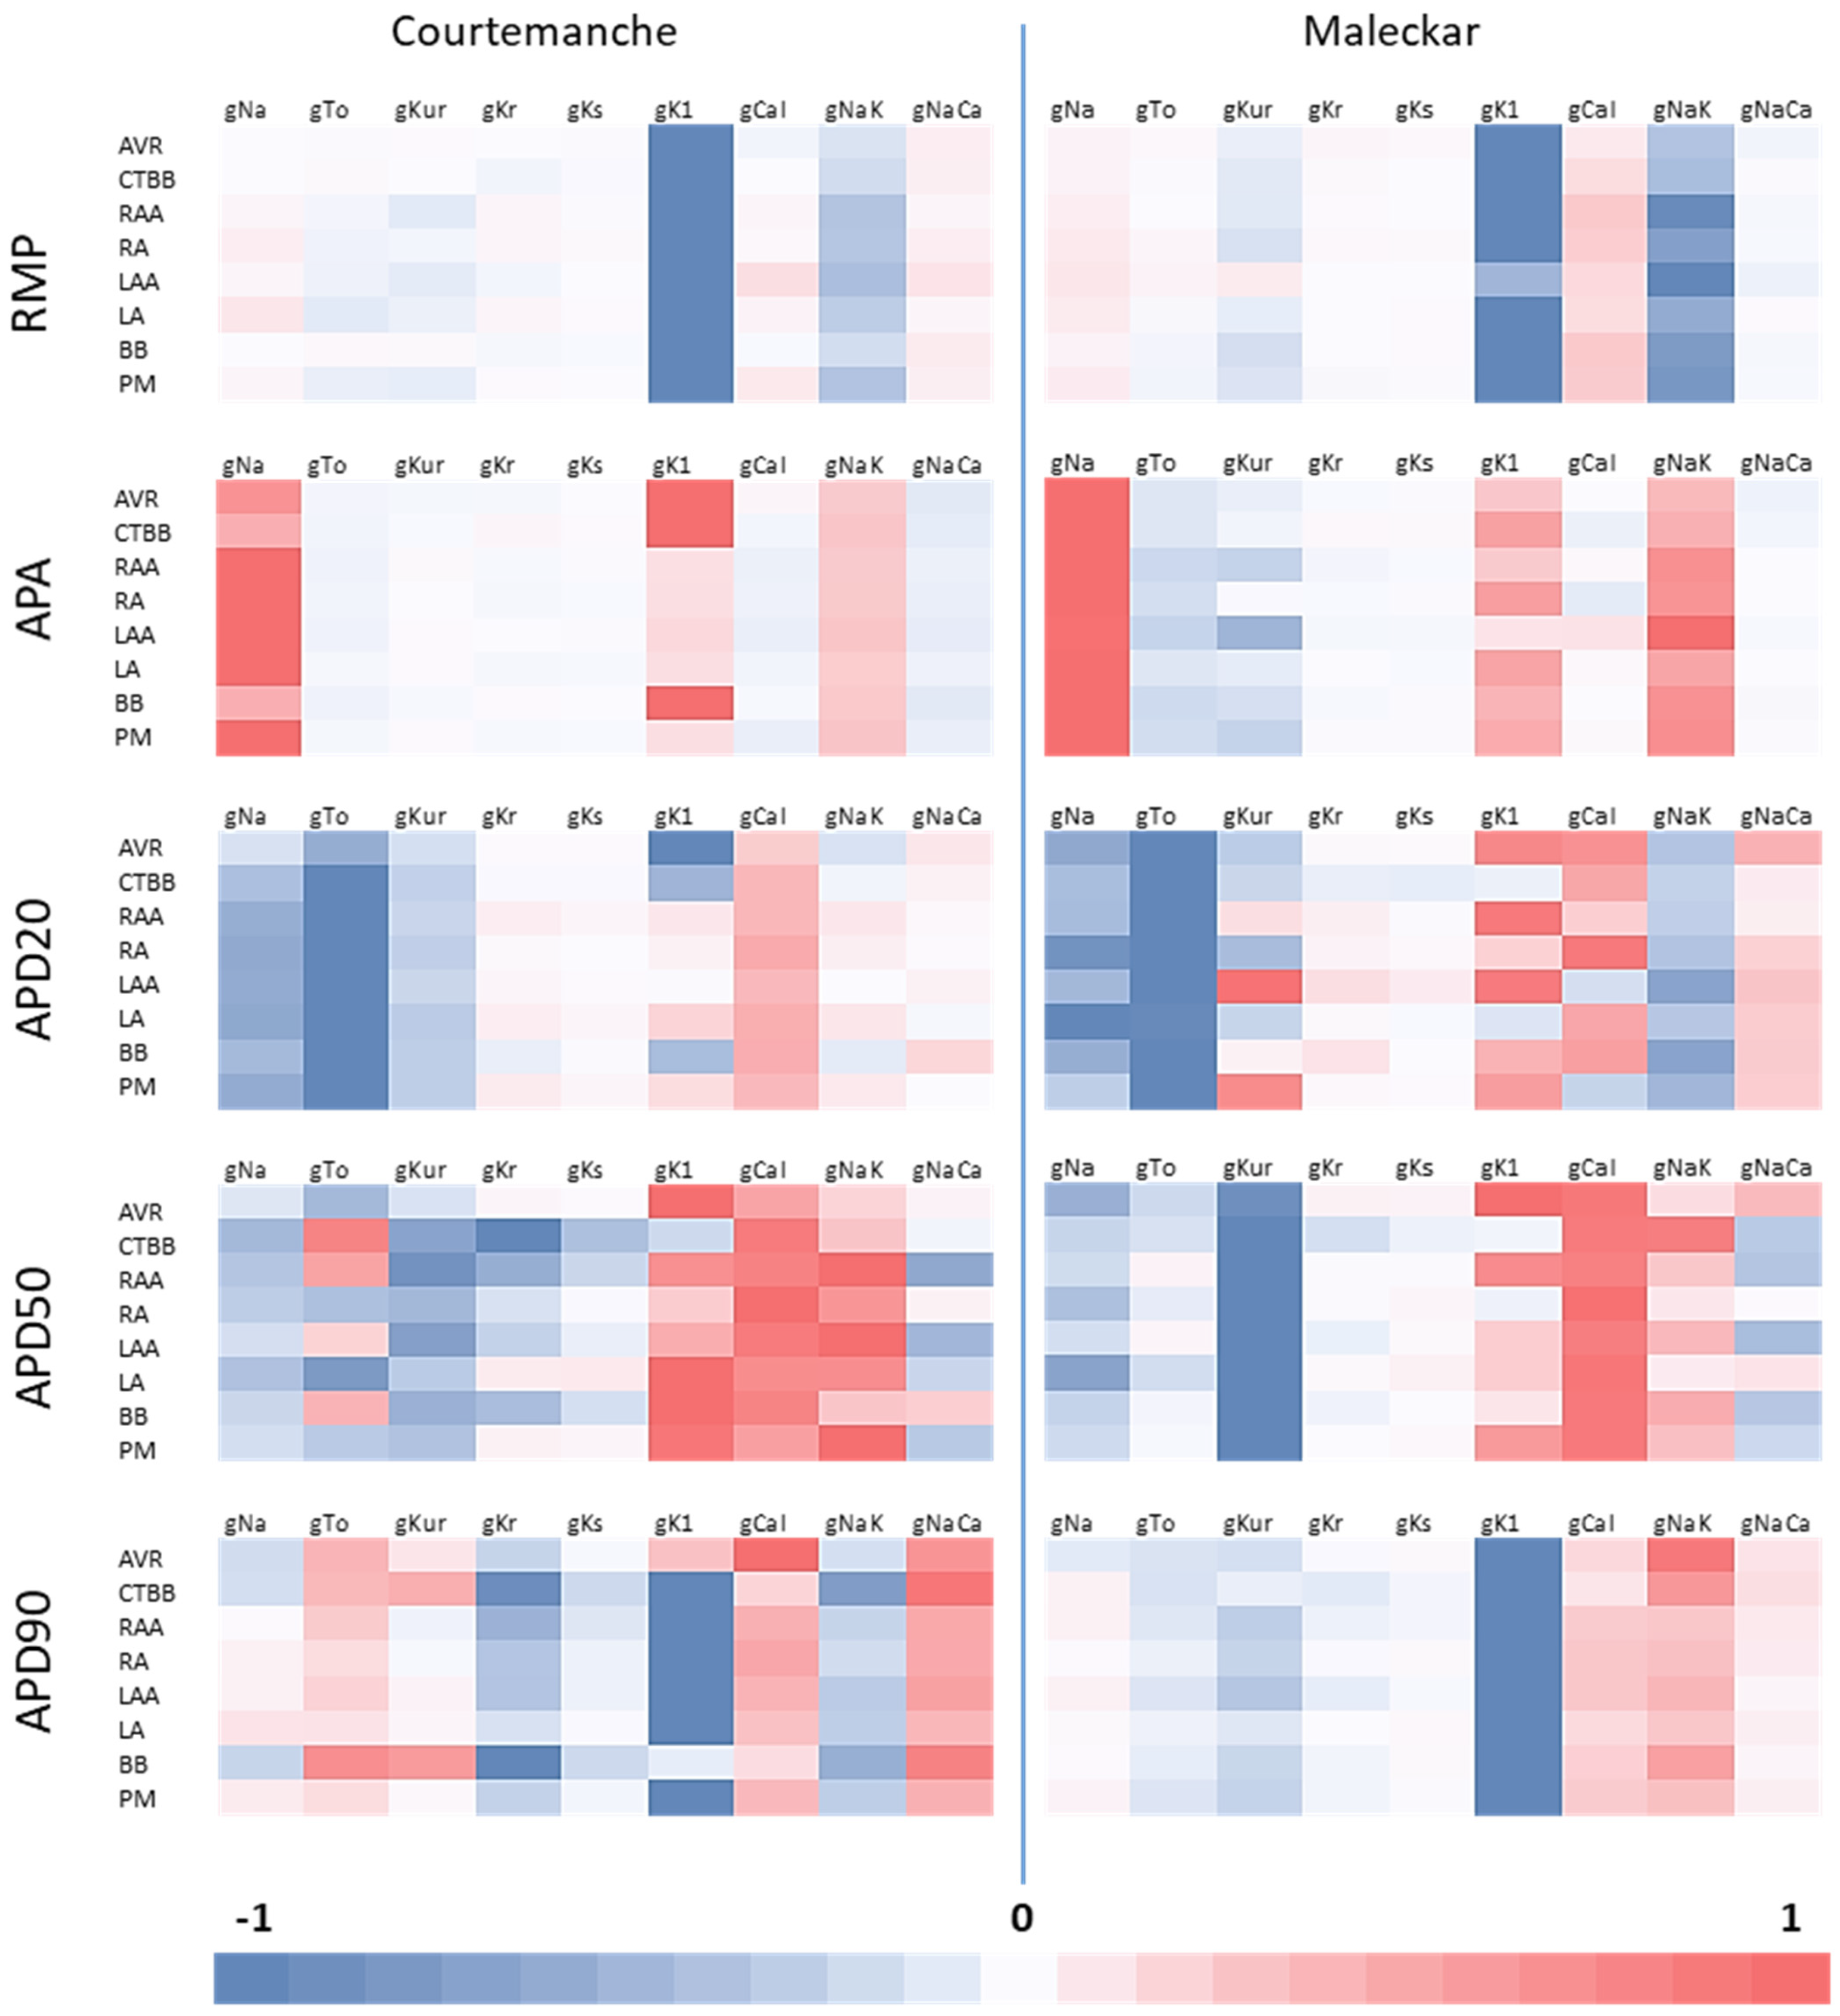
First and second order linear regression analysis was used to determine if inter-conductance relationships were reflected both in the biomarker method and the percentage method. Additionally, the regression analysis was used to identify possible causes for differences in population dynamics between the atrial cellular models and between the AF remodelling methods. The r-squared coefficient was calculated to determine the ability to capture the population behaviour. A two-sided Wilcoxon rank sum test, equivalent to a Mann-Whitney U-test, was used to determine if the populations were statistically different as a result of AF remodelling. A p-value of p < 0.025 was classed as significant.
4. Discussion
The differences in population size for all methods between cellular models showed that the Maleckar cellular model was far more sensitive to ion channel changes. This sensitivity was evident in the five-fold difference in the percentage of stable models identified for the Maleckar model (32,557) and for the Courtemanche model (162,971). This could also explain some of the differences observed between the cellular model populations resulting from AF remodelling. The reason for this was the tendency for the Maleckar model to result in action potentials with spontaneous depolarizations. The findings in [
3] also confirmed the tendency for the Maleckar model to result in delayed afterdepolarizations.
It is accepted that, based on experimental data, atrial regions have different AP morphologies and characteristics. It is therefore clear that atrial regions have different channel conductance expressions. What has not been considered is whether the relationships between channel conductance expression and AP morphology varies on a regional basis and, if so, how.
Comparing the channel conductance importance for different atrial regions has not previously been done. The results presented here could give insight into regional differences resulting from AF remodelling.
High order sensitivity analysis showed the relationships between channel conductances and biomarkers was highly non-linear (results not shown), indicating a significant interplay between different ionic currents and the AP morphological markers. In this regard, clustering action potentials into atrial regions based on biomarker classification maintained the highly non-linear relationships between channel conductance and biomarkers. Directly applying percentage changes to individual channel conductances for AF remodelling imposes an a priori imprinting in the ionic conductances that could result in action potentials outside of the physiological ranges.
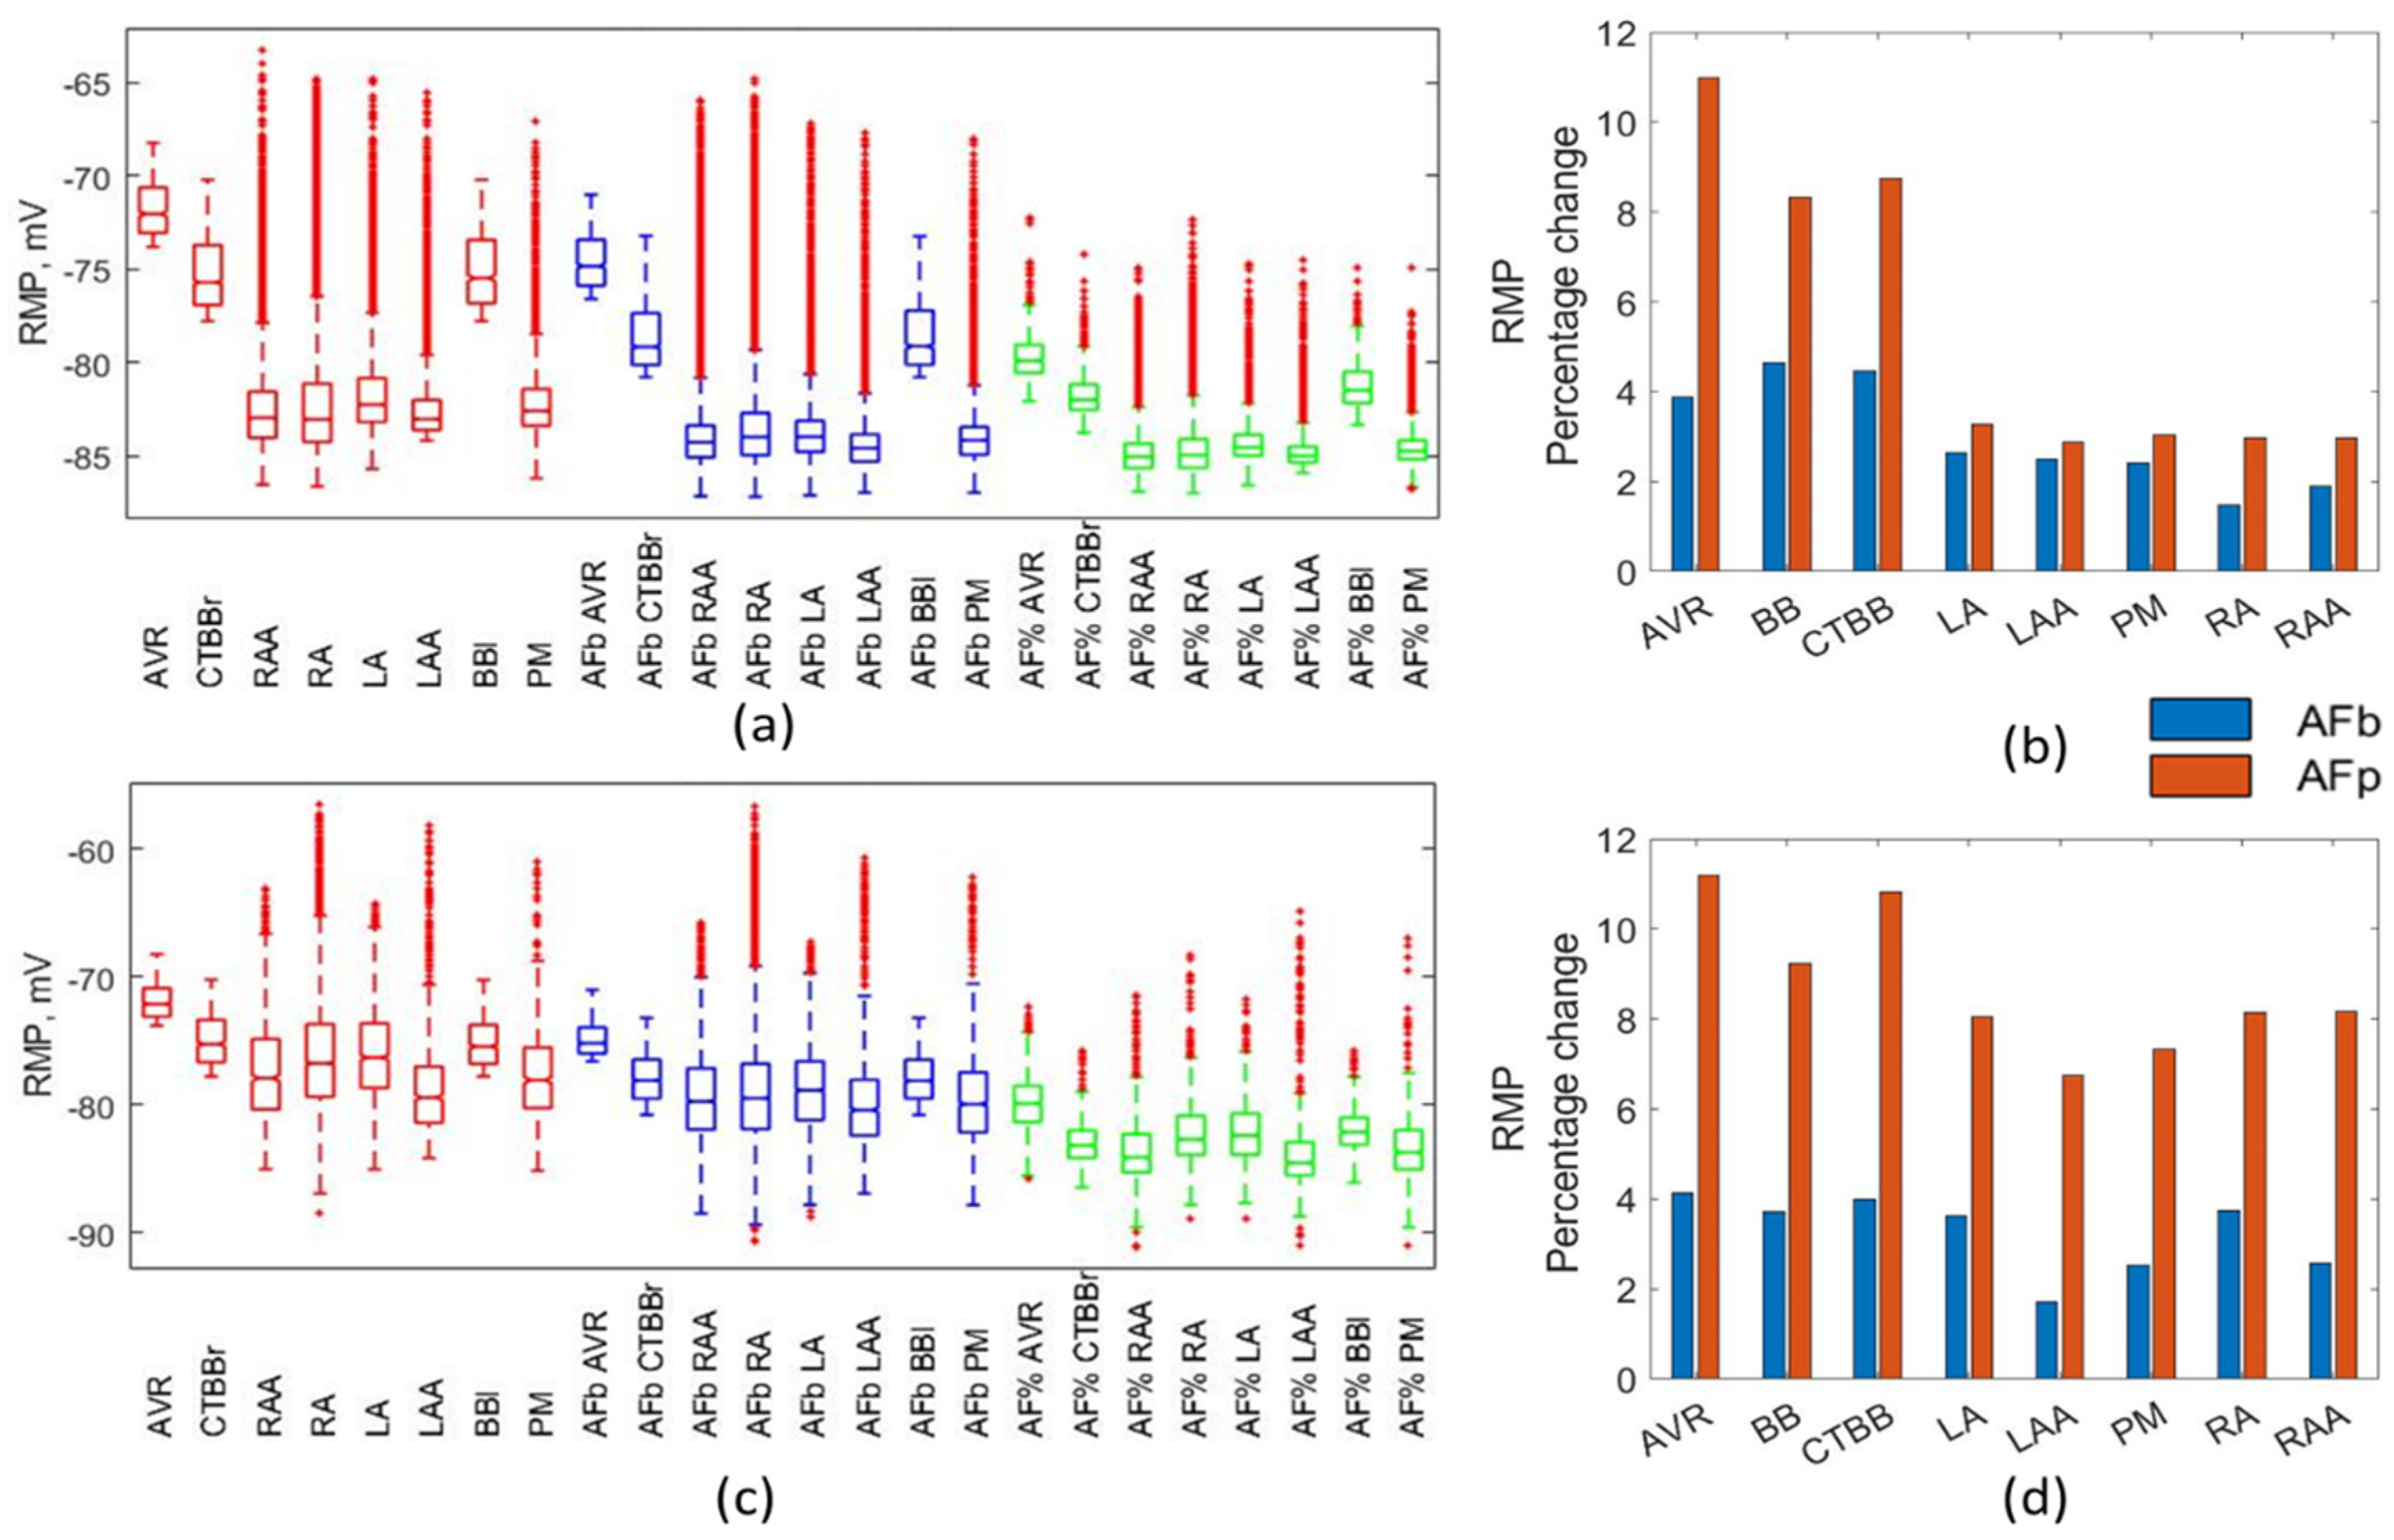
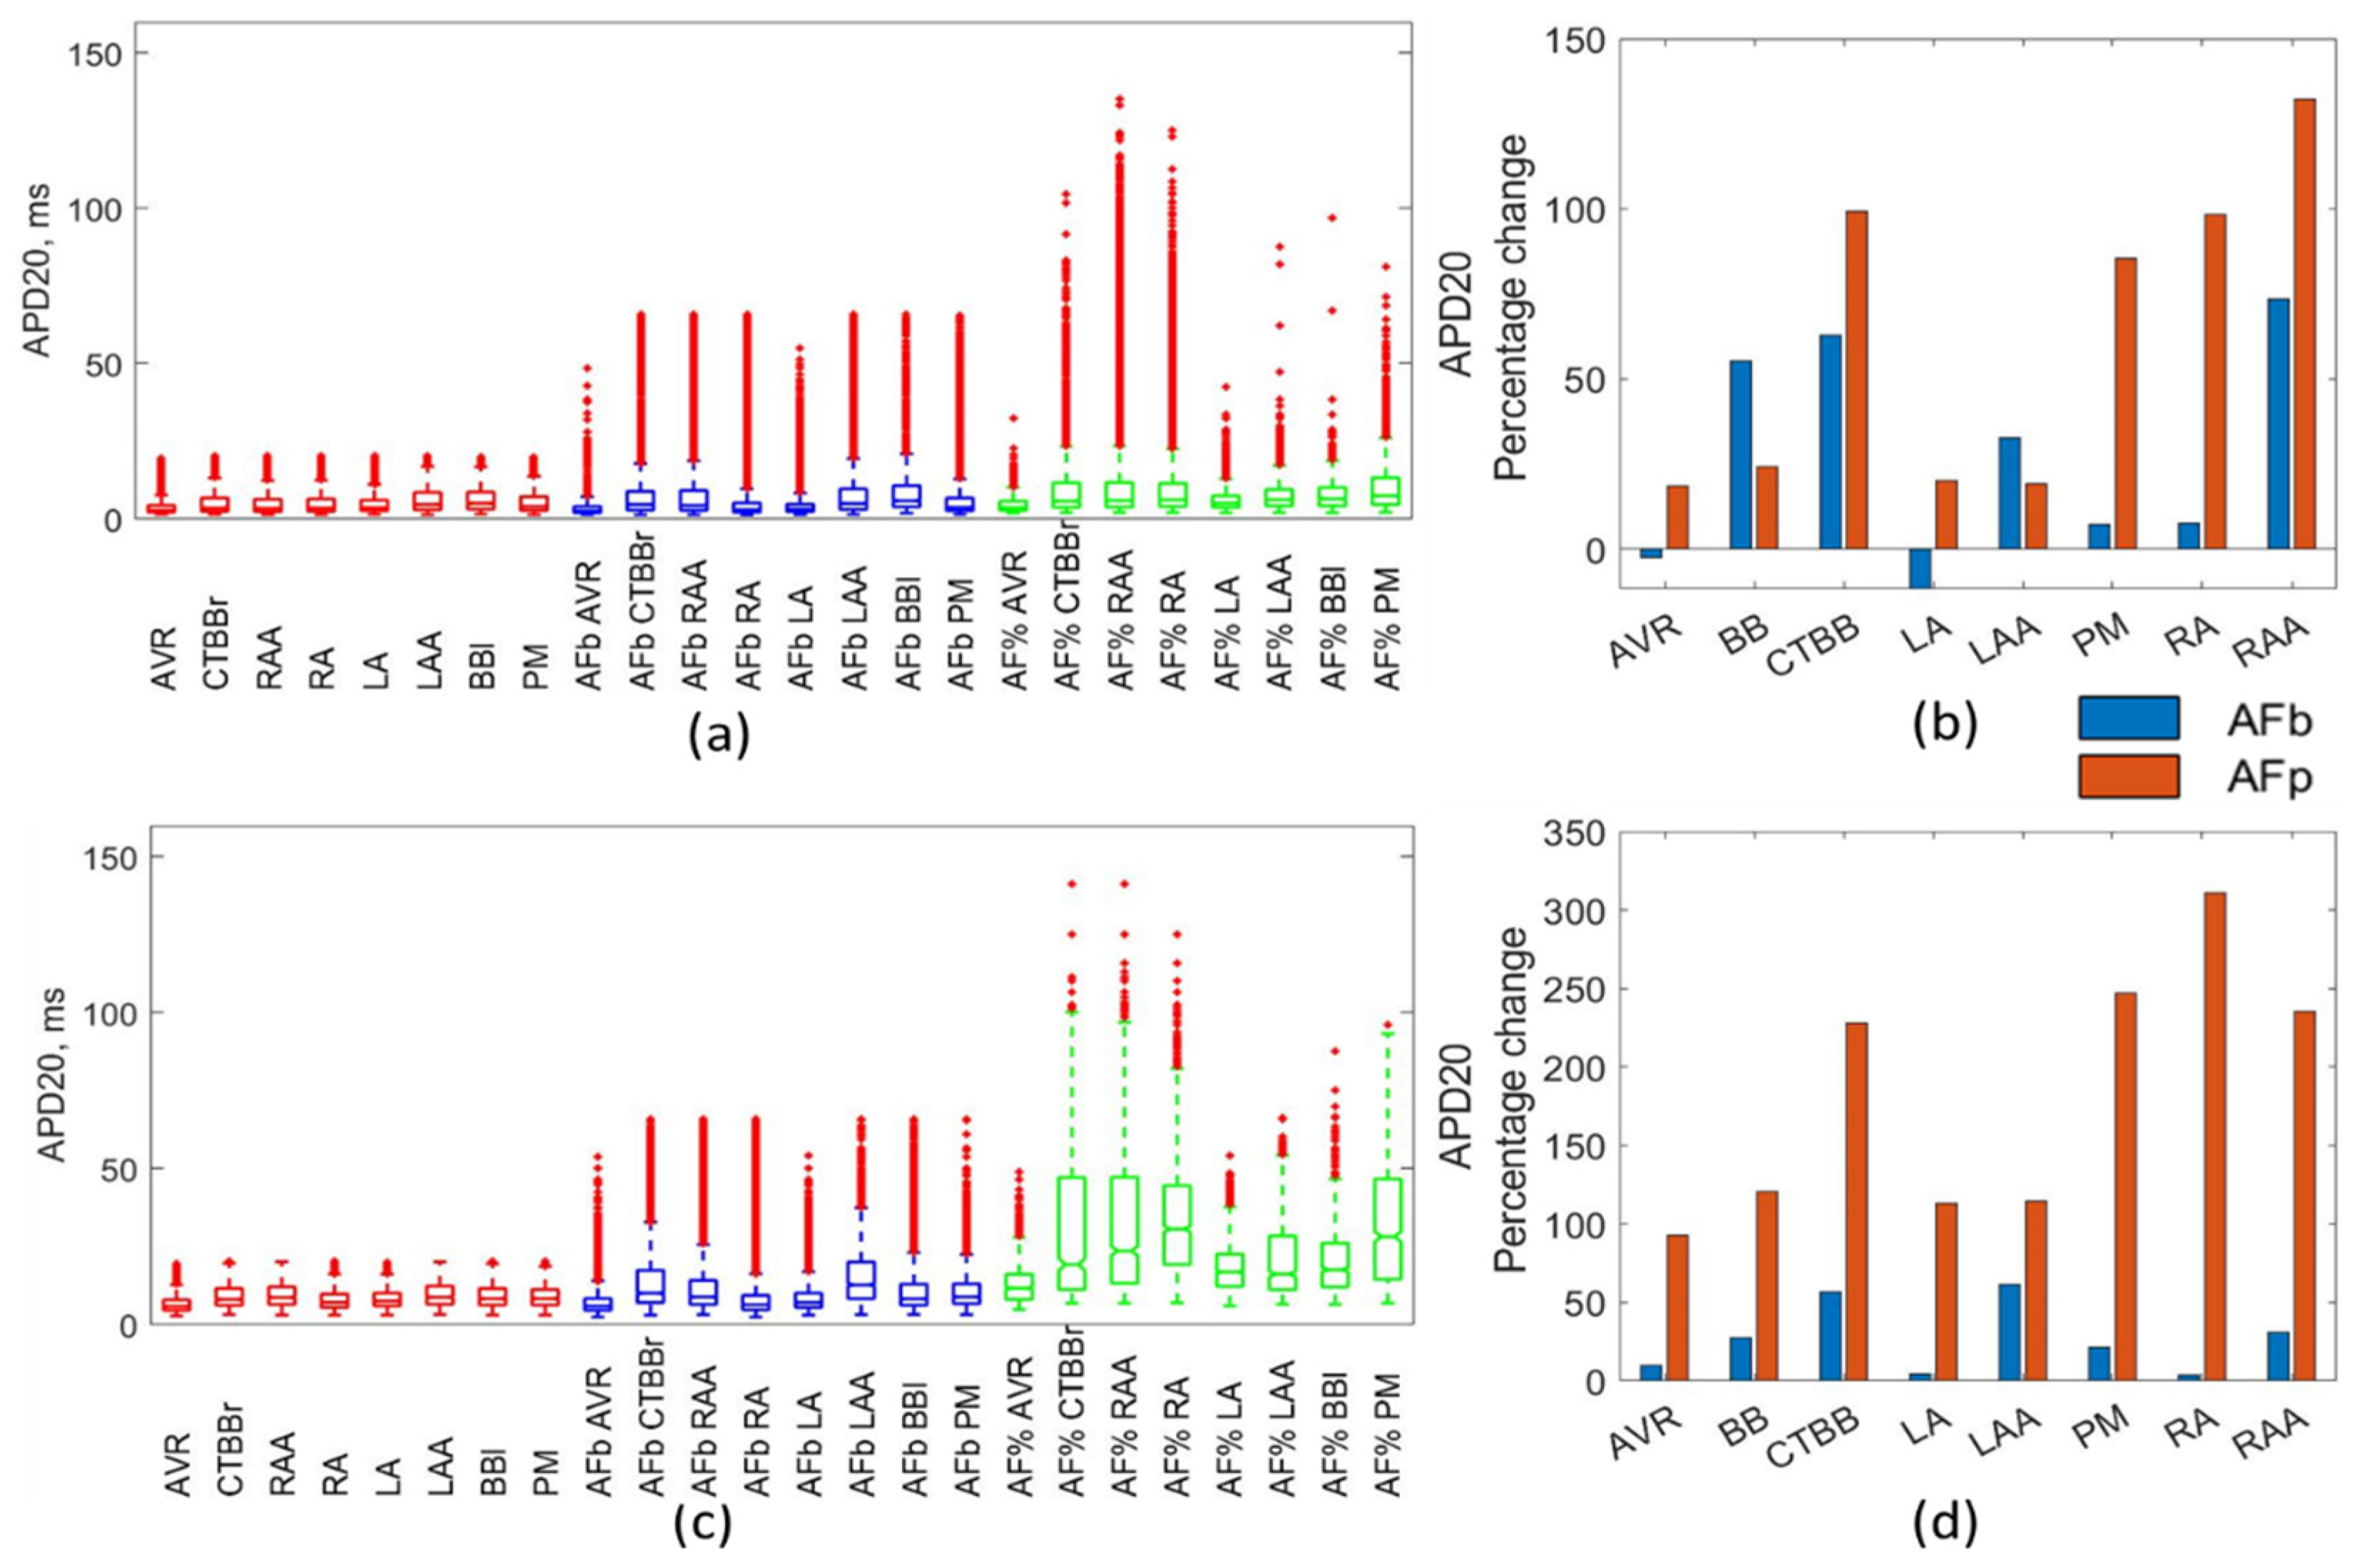
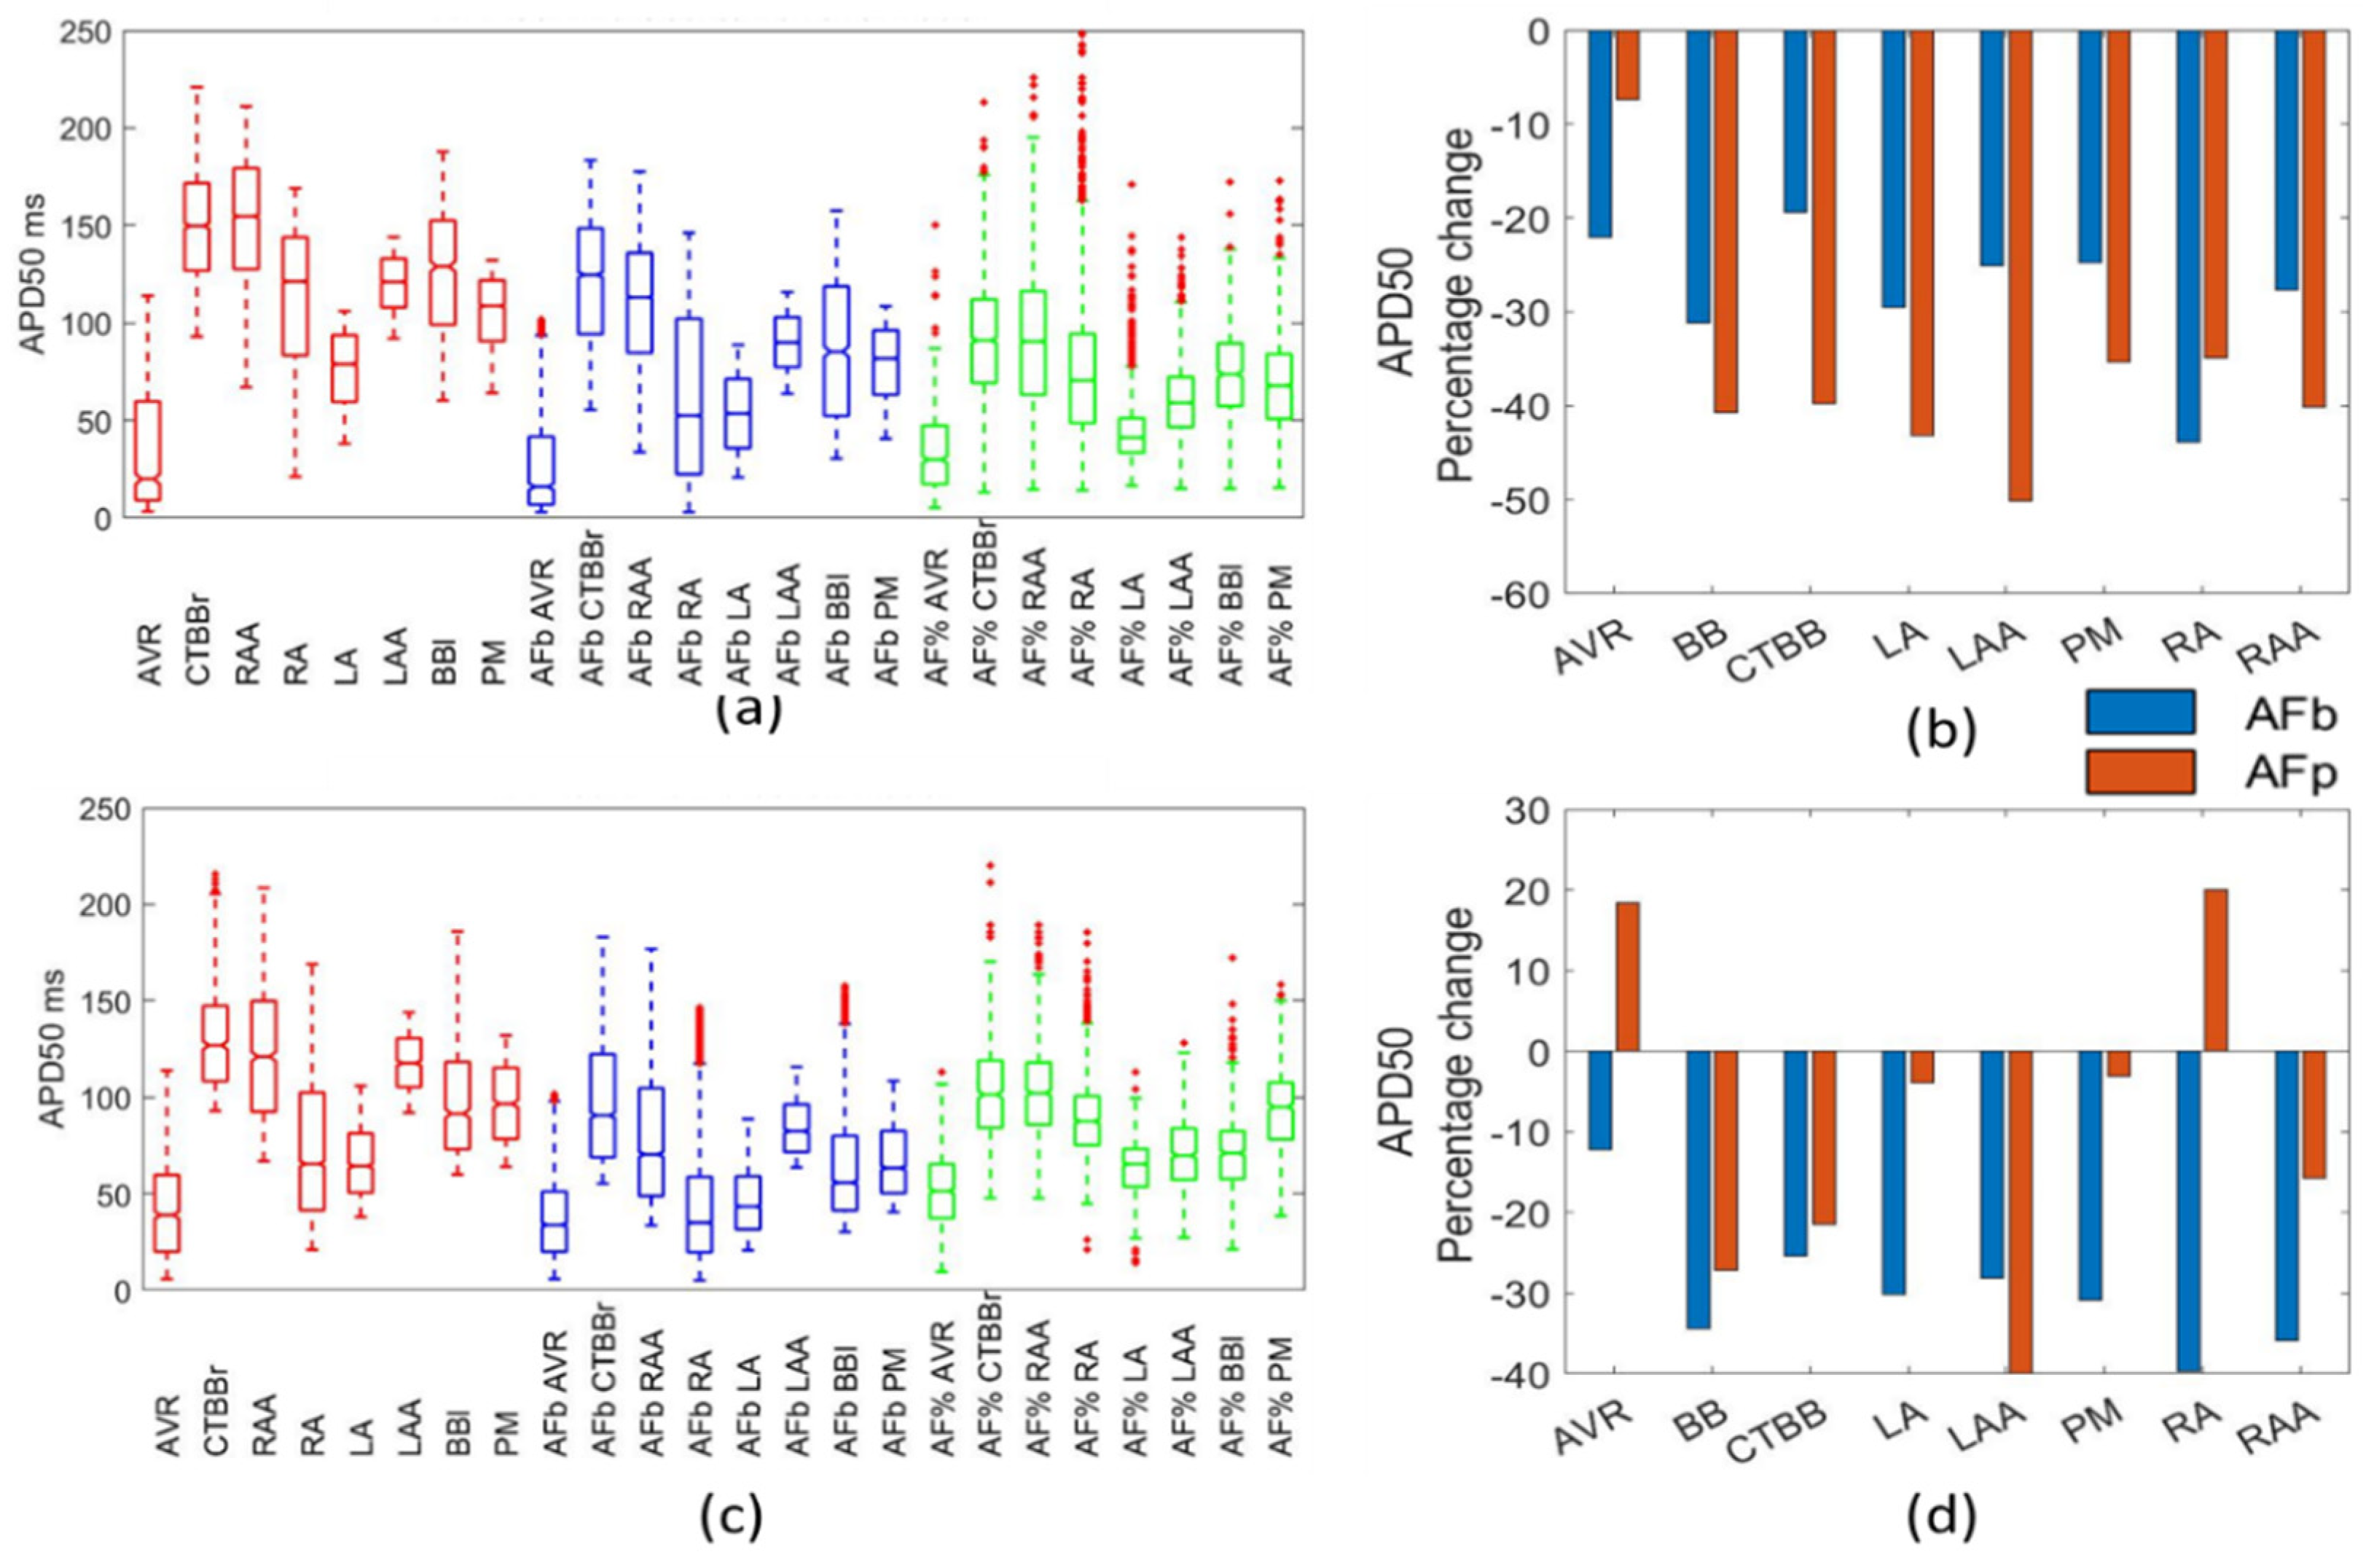
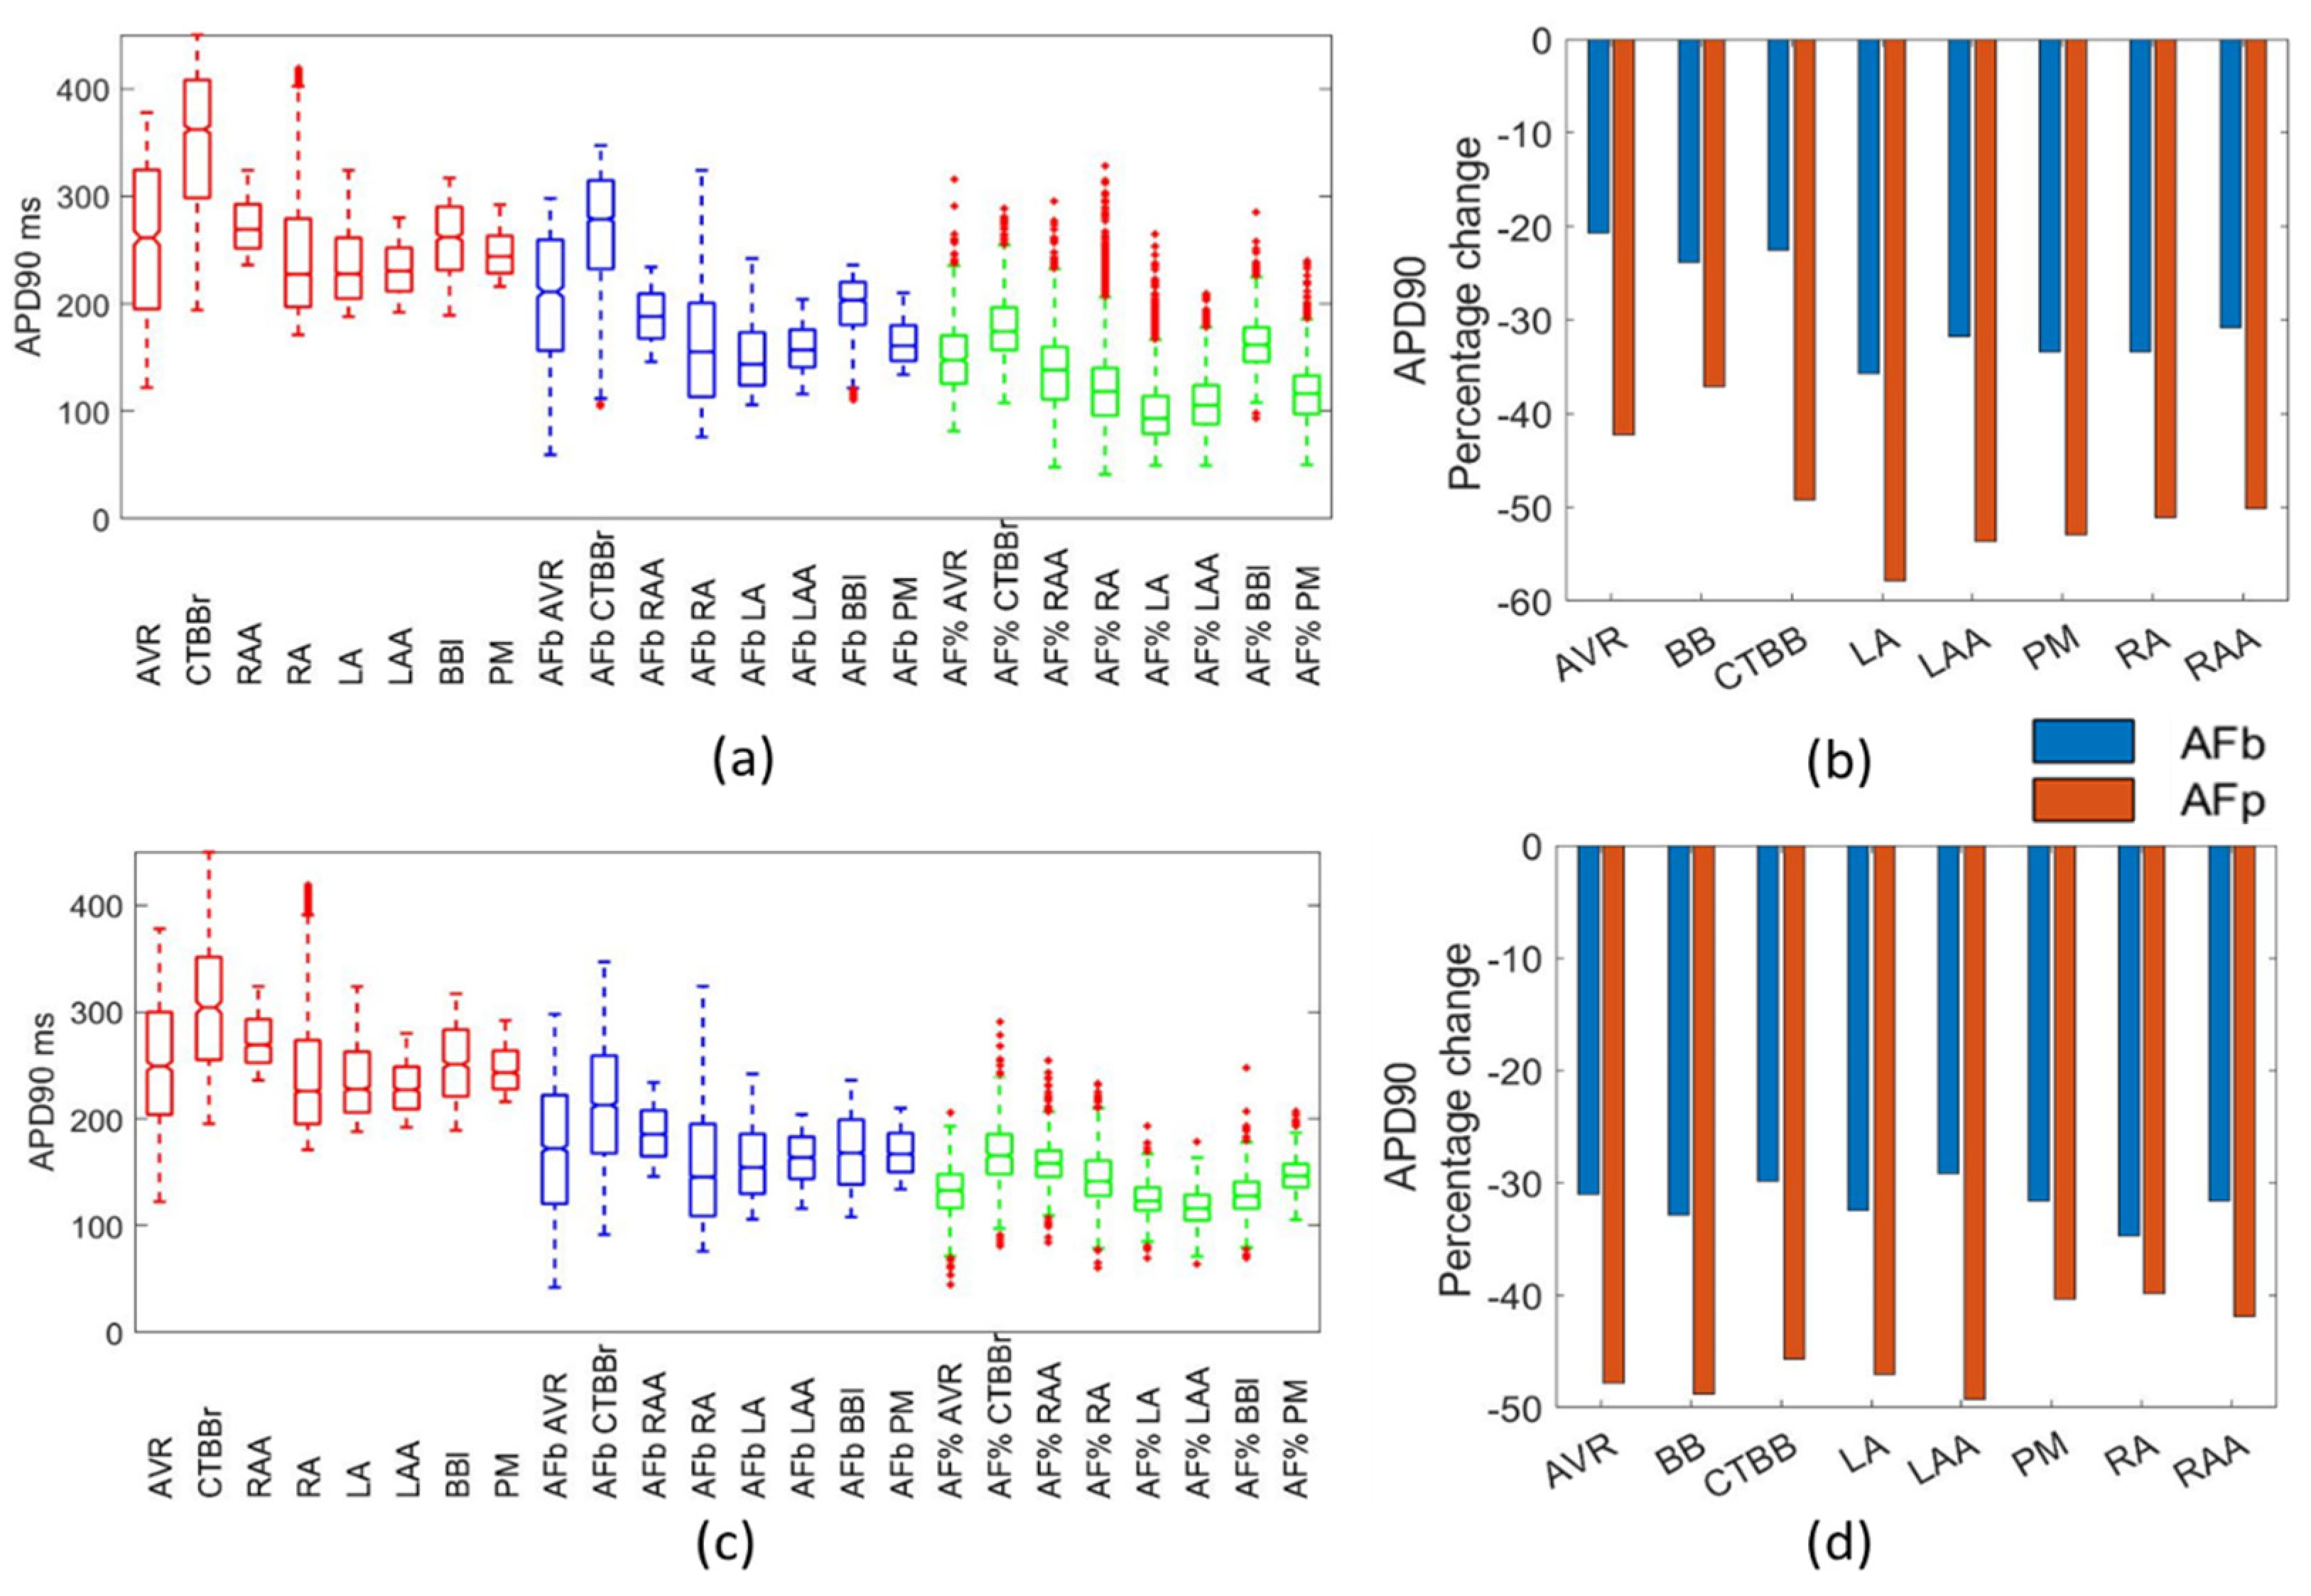
When compared to the available data, both the biomarker method and the percentage method replicated the particular aspects of changes in the action potential morphology as a result of AF remodelling. For the APD90, APD50, APA, and RMP, both methods were effective in replicating experimental results. For the APD20, the biomarker method was superior and prevented the inclusion of action potentials with APD20 values that far exceed experimental observations. To introduce cellular variability through a POM approach, the percentage method applied to the healthy population would require further filtering to remove physiologically impossible action potentials, particularly pertaining to the APD20 and APD50 biomarkers.
In the percentage method, a reduction of between 2.5% and 11% was observed in the RMP due to AF remodelling for both ionic models. These findings are consistent with other published work: Dobrev et al. [
20] observed a reduction of 3% in the mean RMP, and an increase of 7.6% in the standard deviation; Bosch et al. [
27] showed a reduction in RMP from −76.3 mV to −78.9 mV; and Loose et al. [
33] likewise showed a reduction of 3.5% for the mean RMP and a 64% reduction in the standard deviation. Both the biomarker and percentage methods resulted in RMP values within experimental ranges.
Despite limited data reporting on the changes to APD20 across different regions of the atria, Dobrev et al. [
20] reported an increase in APD20 as a result of AF remodelling in the multiple cell trabeculae. It reported APD20 for the control group as 7 ms compared with 25 ms for the cAF cells, an increase of 257%. Similarly, Loose et al. [
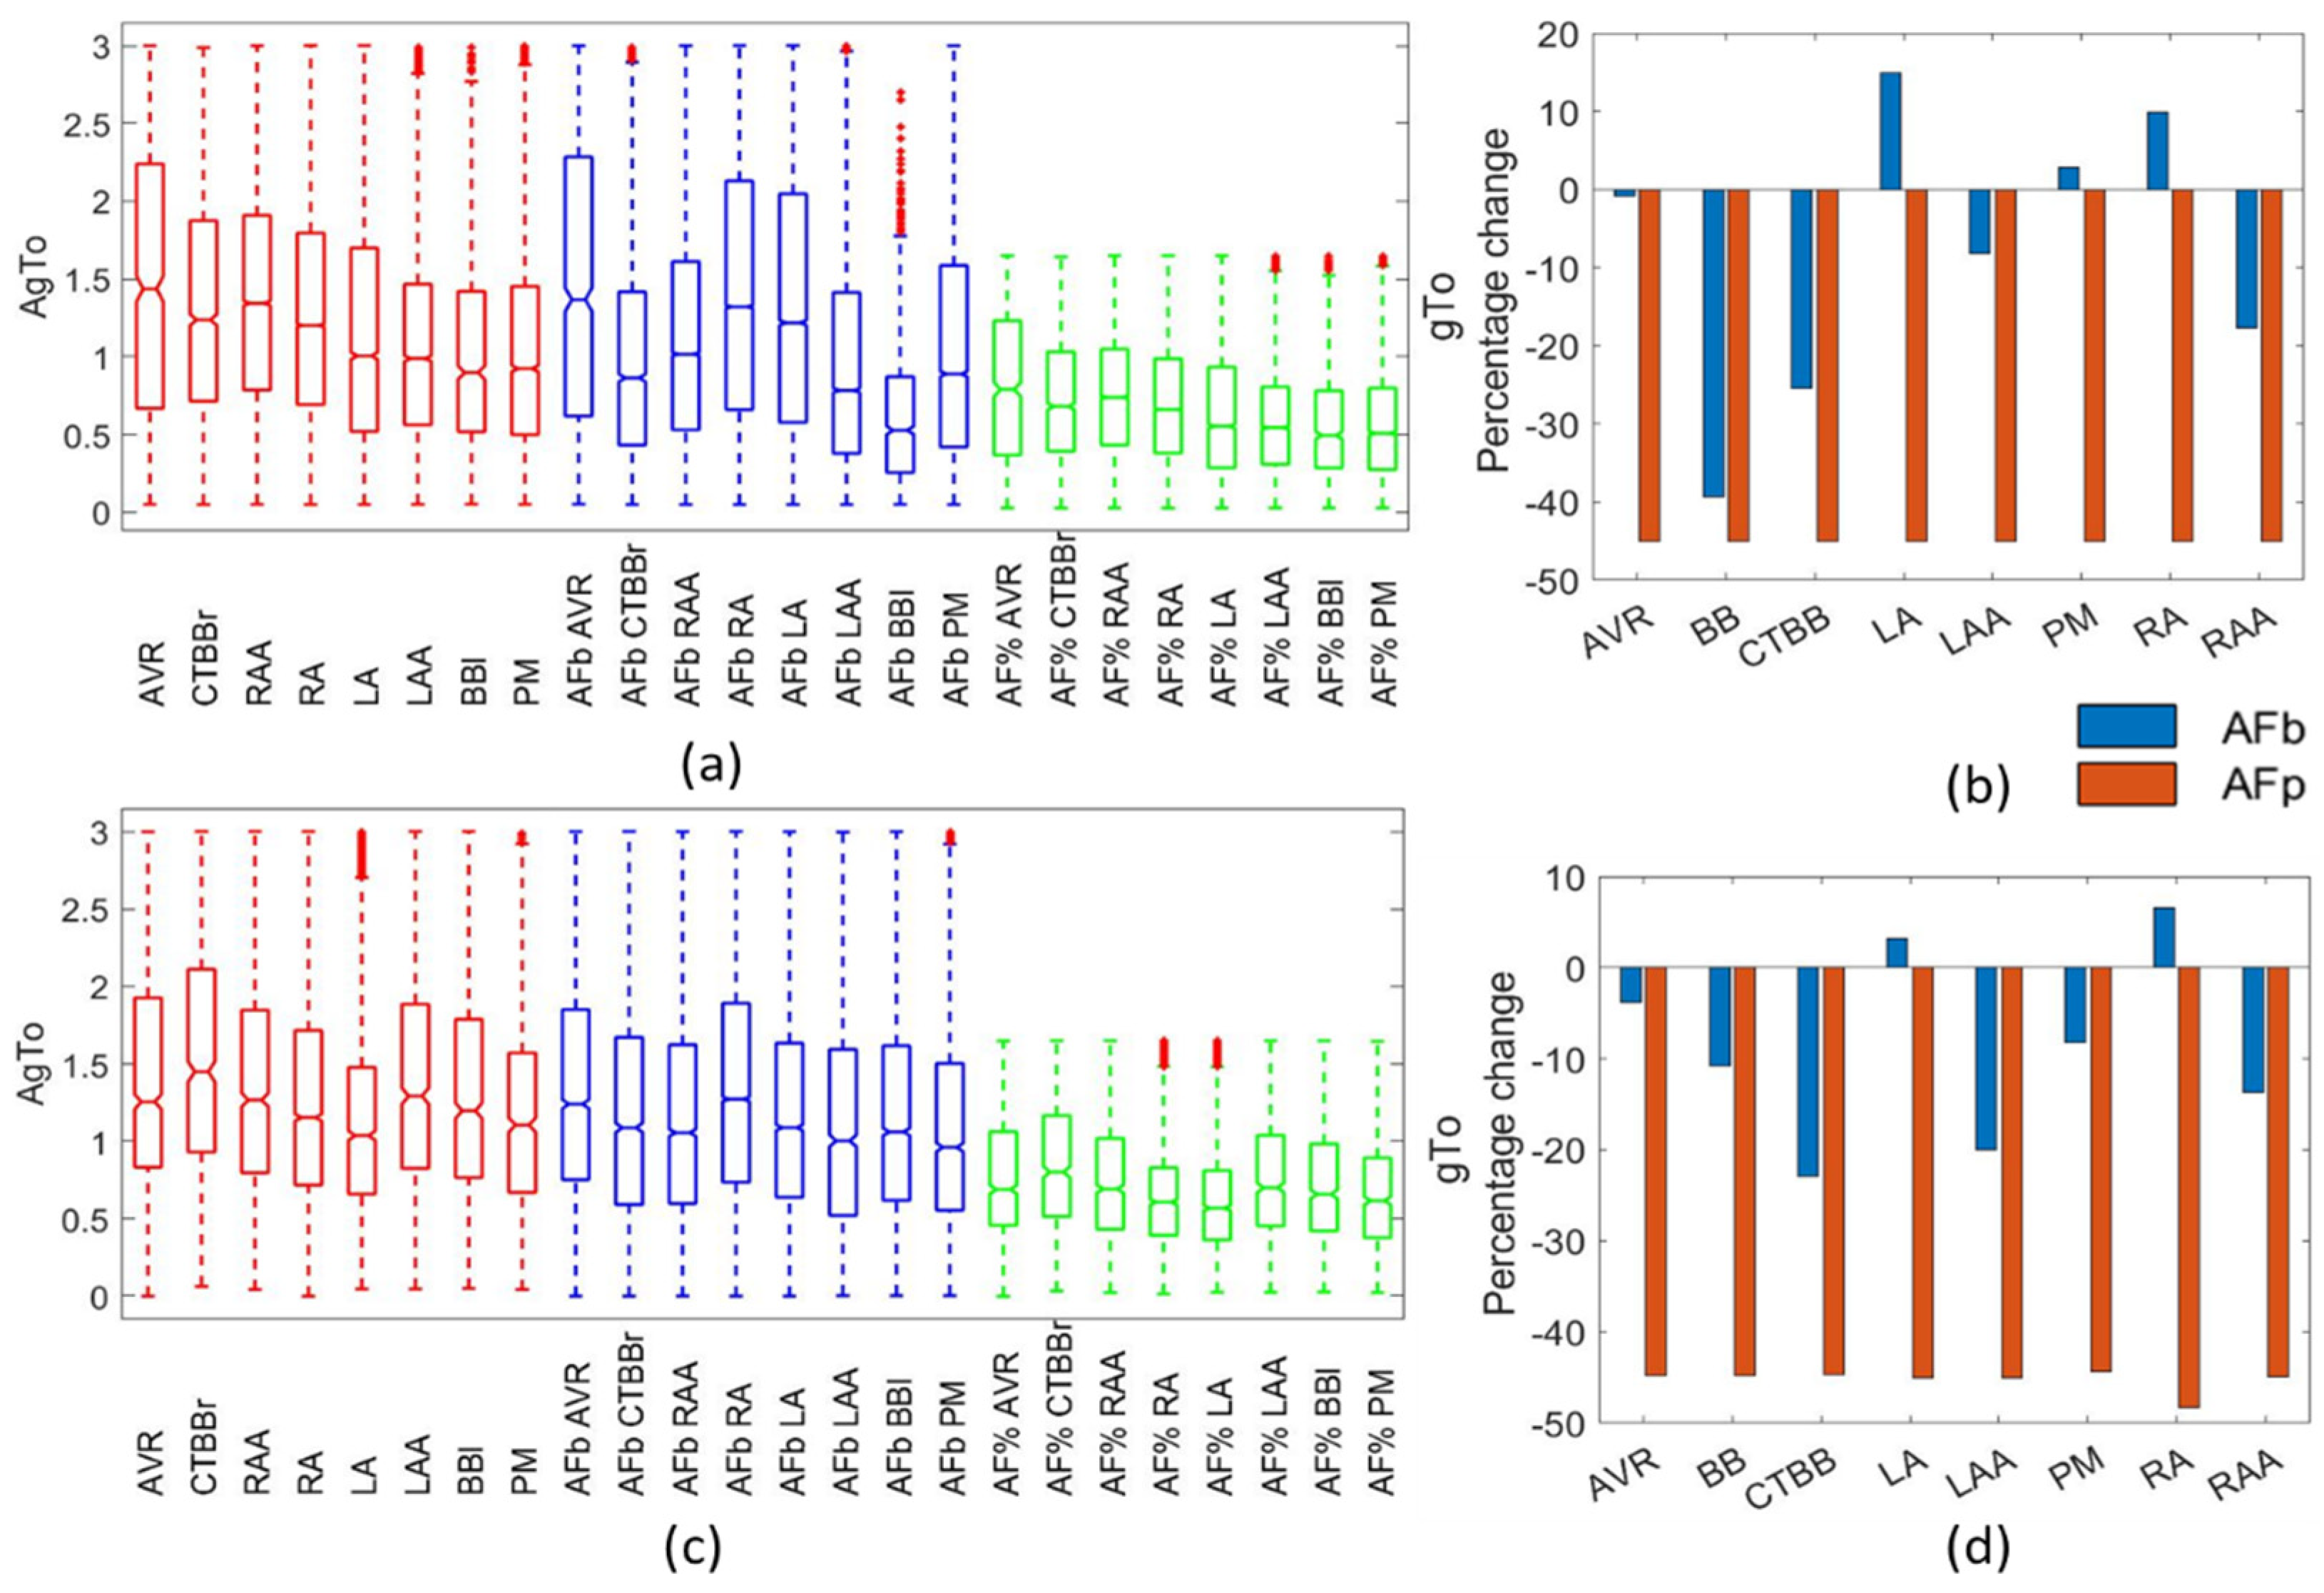
33] reported an increase in APD20 from 4 ms to 35.7 ms, with a large increase in standard deviation. The percentage method for both atrial models resulted in APD20 values far larger than those observed in human atrial cells. This behaviour was associated with the high sensitivity of this marker to changes in gTo. When applied to the physiological population, the percentage method led to values of gTo that caused an excessive increase in APD20 outside of the physiological range. This would suggest that for the APD20, the biomarker approach is preferable.
Dobrev et al. [
20] reported an increase in the APD50 of 8.6–16% for single cell and multiple cell observations. This contrasts not only the results reported here, but also data reported in Sanchez et al. [
8], whereby APD50 dropped from 139 ± 44 ms to 102 ± 28 ms (a reduction of 26% for the mean). Loose et al. [
33] also reported a drop in APD50 from 139 ms in the control to 104 ms in the cAF population, resulting in a 25% reduction in the mean. The results reported here show that the Maleckar biomarker method and both Courtemanche populations resulted in reductions in APD50 that are similar to the work of Loose et al. [
33] and Sanchez et al. [
8].
The APD90 has been reported to drop due to AF remodelling [
20,
27,
32,
33]. The work presented here shows a similar drop in APD90 resulting from the AF remodelling. Dobrev et al. [
20] showed a drop of 26.3–26.6% in single cell (cAF = 149 ms vs. control = 202 ms) and multiple cell trabeculae (cAF = 152 ms vs. control = 207 ms). Loose et al. [
33] presented a drop of 31%, with a 32% reduction in standard deviation. Bosch et. al. [
27] presented a reduction in APD90 from 255 ms ± 45 ms in the control group to 104 ms ± 9 ms in the cAF group, with a much larger drop of 145% and an 80% drop in standard deviation. The results presented in Bosch et al. showed a much larger drop in APD90 than those observed in the data presented here. Both the biomarker and percentage methods resulted in APD90 values within observed ranges, consistent with Loose et al. and Dobrev et al.
In general, AF populations built using the biomarker method showed alterations in the ionic conductances, with respect to the physiological population, that were in agreement with published work and patch clamp experimental results on isolated cardiomyocytes from healthy and cAF patients. This would suggest that the biomarker method is an effective way of applying AF remodelling. Additionally, the biomarker method proved to be more robust to variability than that of the percentage-based method.
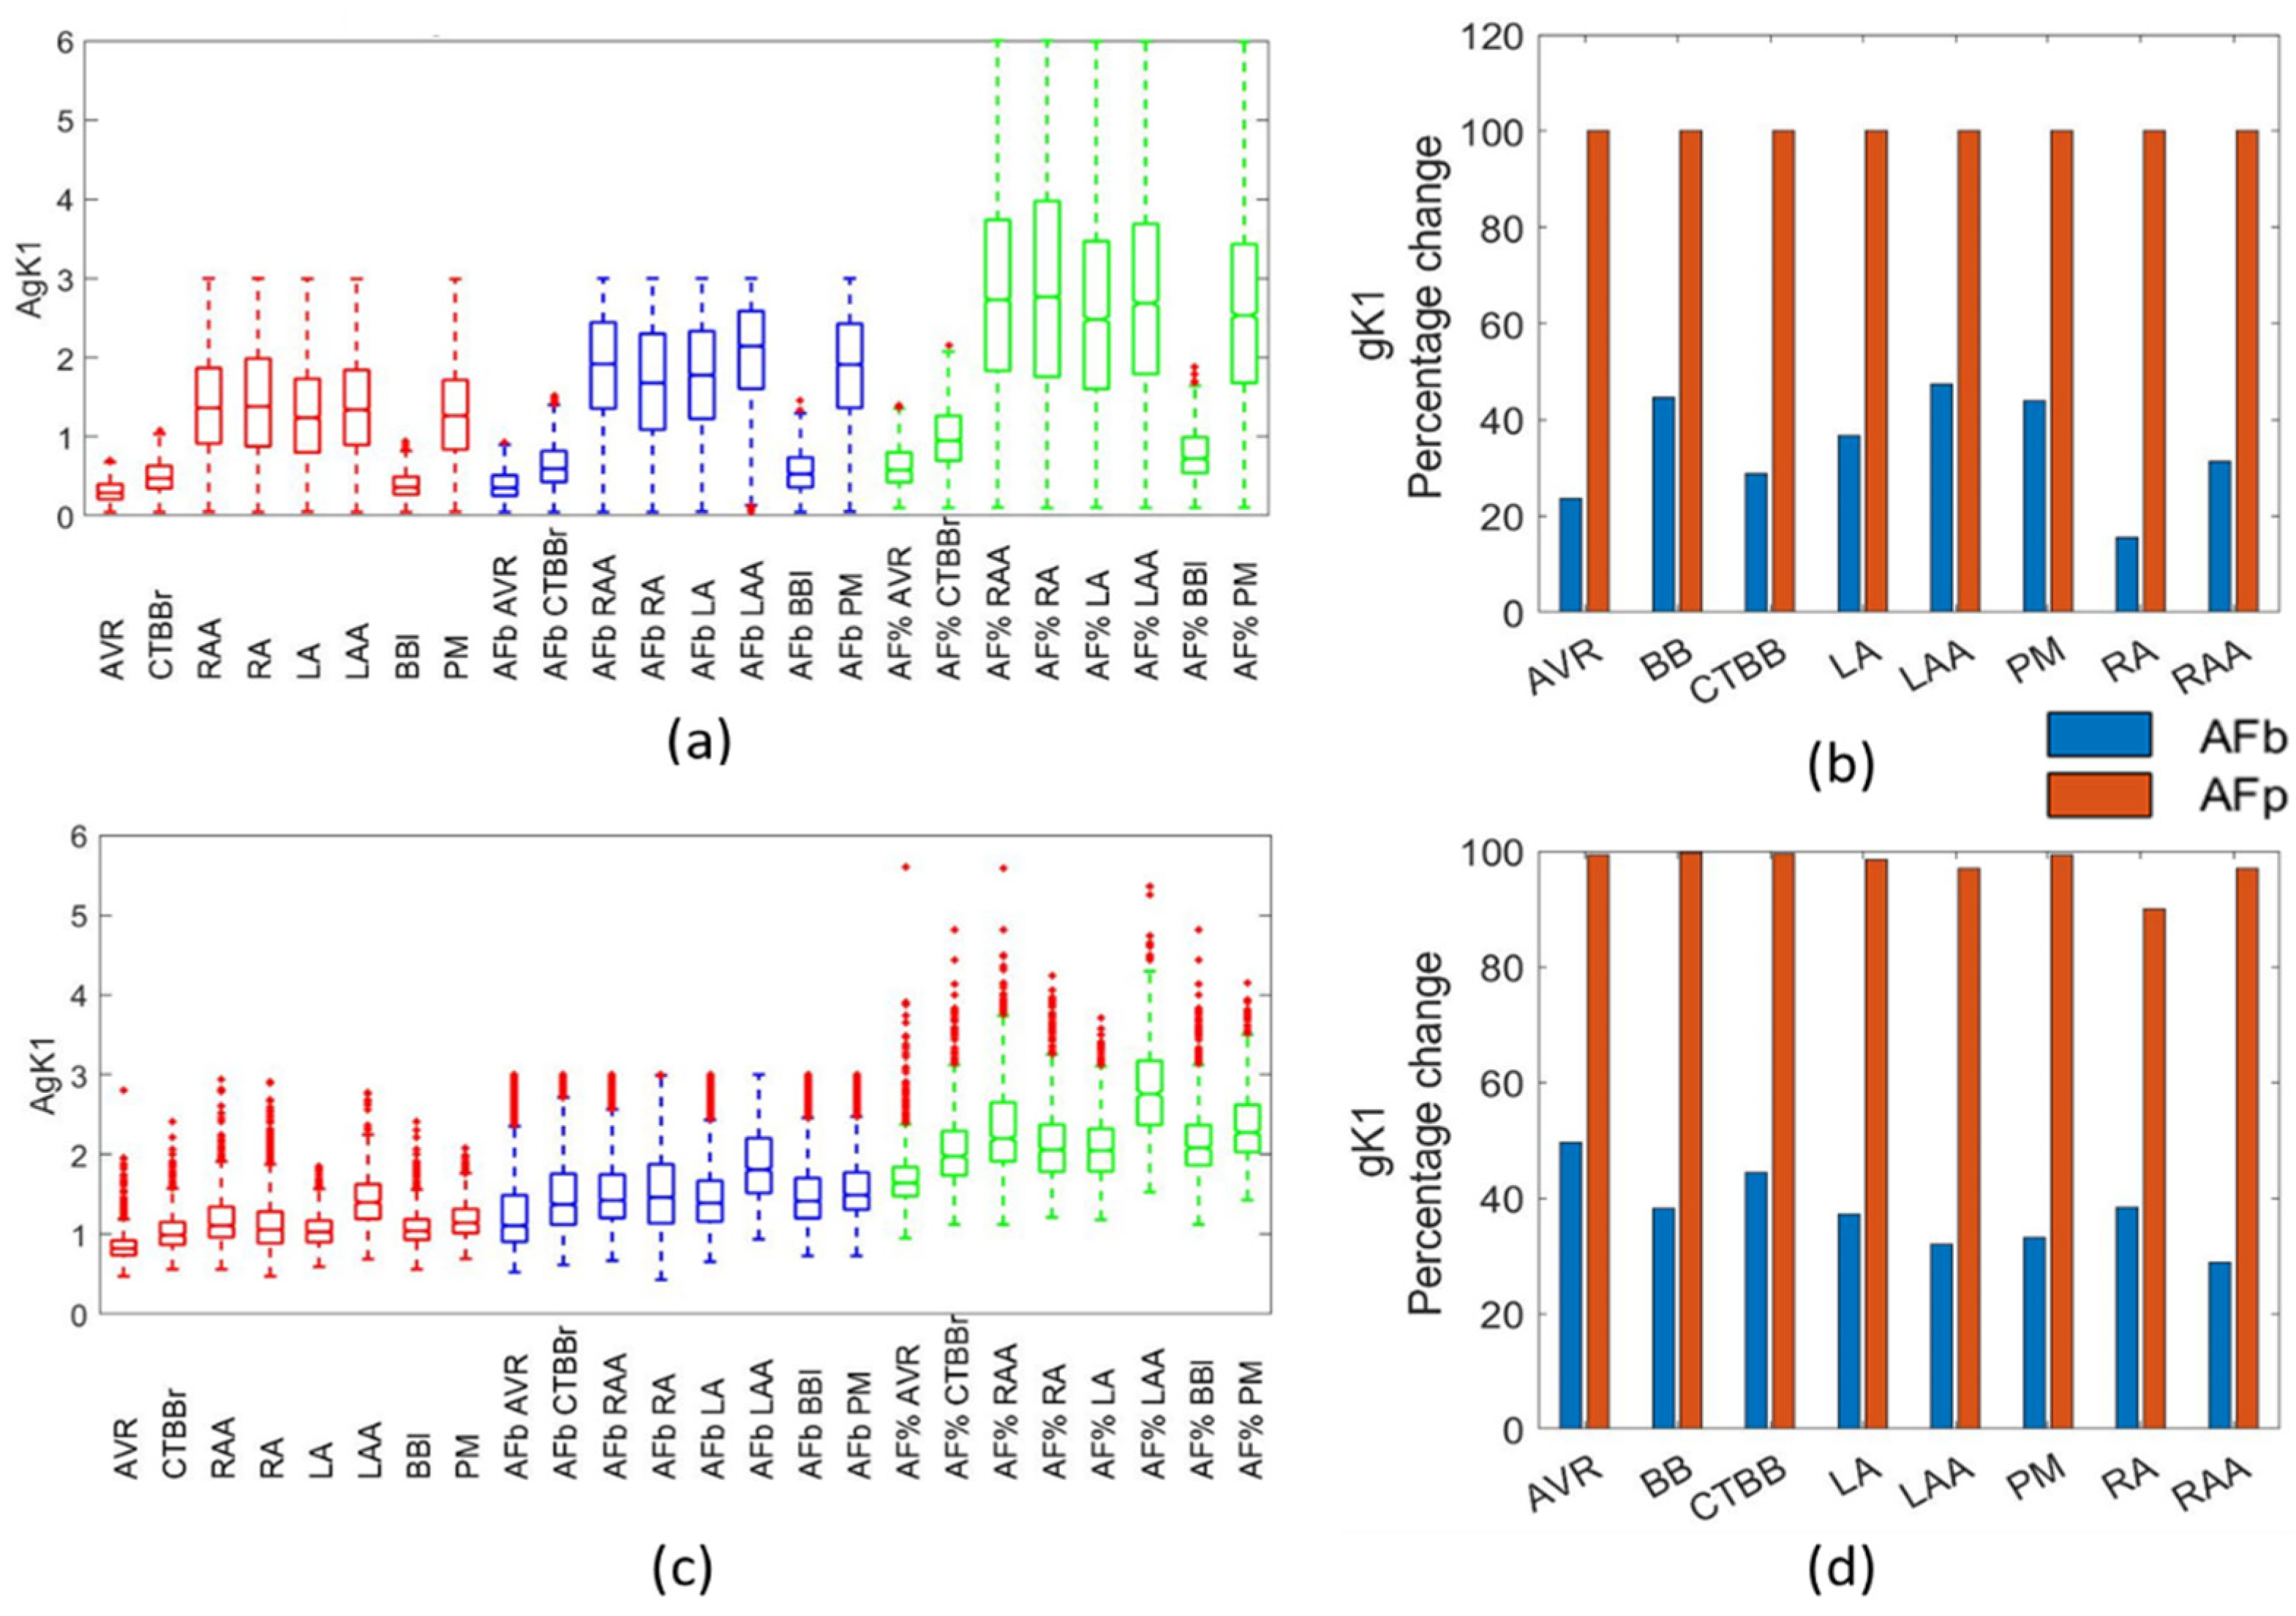
For both Maleckar and Courtemanche populations, gK1 was increased, gCaL and gTo were reduced, and gKs showed a small increase. Additionally, with unrealistically large channel conductance values occurring in gK1 and gKs as a result of the percentage method, the biomarker approach could be a more effective method by scaling the percentage change in each channel conductance with respect to the initial value. This could be why the channel conductances appeared to be under-adjusted in the biomarker method.
Other POM approaches use refinement to reduce populations in specific ways. Muszkiewiez [
3] used Latin hypercube sampling and sequential Monte Carlo methods to create the populations. The Courtemanche model in [
3] failed to reproduce experimental ranges in early repolarization. In this study, both the Courtemanche and Maleckar models successfully reproduced experimental data for both the healthy and AF remodelled biomarkers. This may be due to the increased range of variability in this study compared with the ±100% used in [
3].
Lawson [
6] used the sequential Monte Carlo method to create and refine populations to represent healthy and cAF remodelled cells. In response to AF remodelling, [
6] observed a small drop in gTo and gCaL in the Courtemanche model. This was consistent with the findings in the biomarker populations. The gKur channel conductance was also observed to not have a significant change in the population of models in [
6]. Similar to other studies, [
6] was calibrated based on RAA experimental data in both healthy and AF remodelled tissue.
For the gTo channel, van Wagoner et al. [
30] reported a reduction of 66% and 61% in the RAA and LAA regions, respectively. Bosch [
27] and Caballero [
39] also reported a reduction in gTo for the RAA and LAA regions due to AF remodelling. This, however, was not observed in paroxysmal AF, suggesting it was a result of AF maintenance as opposed to the cause of it. Grandi et al. [
4] reported a reduction in gTo of 80% in the RA and 45% in the LA. Li et al. [
34] reported no difference between LA and RA regions. Other literature reported reductions in gTo of between 50% and 85% [
6,
13,
15]. The biomarker method resulted in a decrease in gTo of up to 40% across regions, with significant differences between atrial regions. In the LAA and RAA regions, gTo was reduced by 10–25%, showing consistency with experimental data. Despite the percentage method better representing observed experimental changes in gTo, the APD20, which is significantly influenced by the gTo, was better represented in the biomarker method.
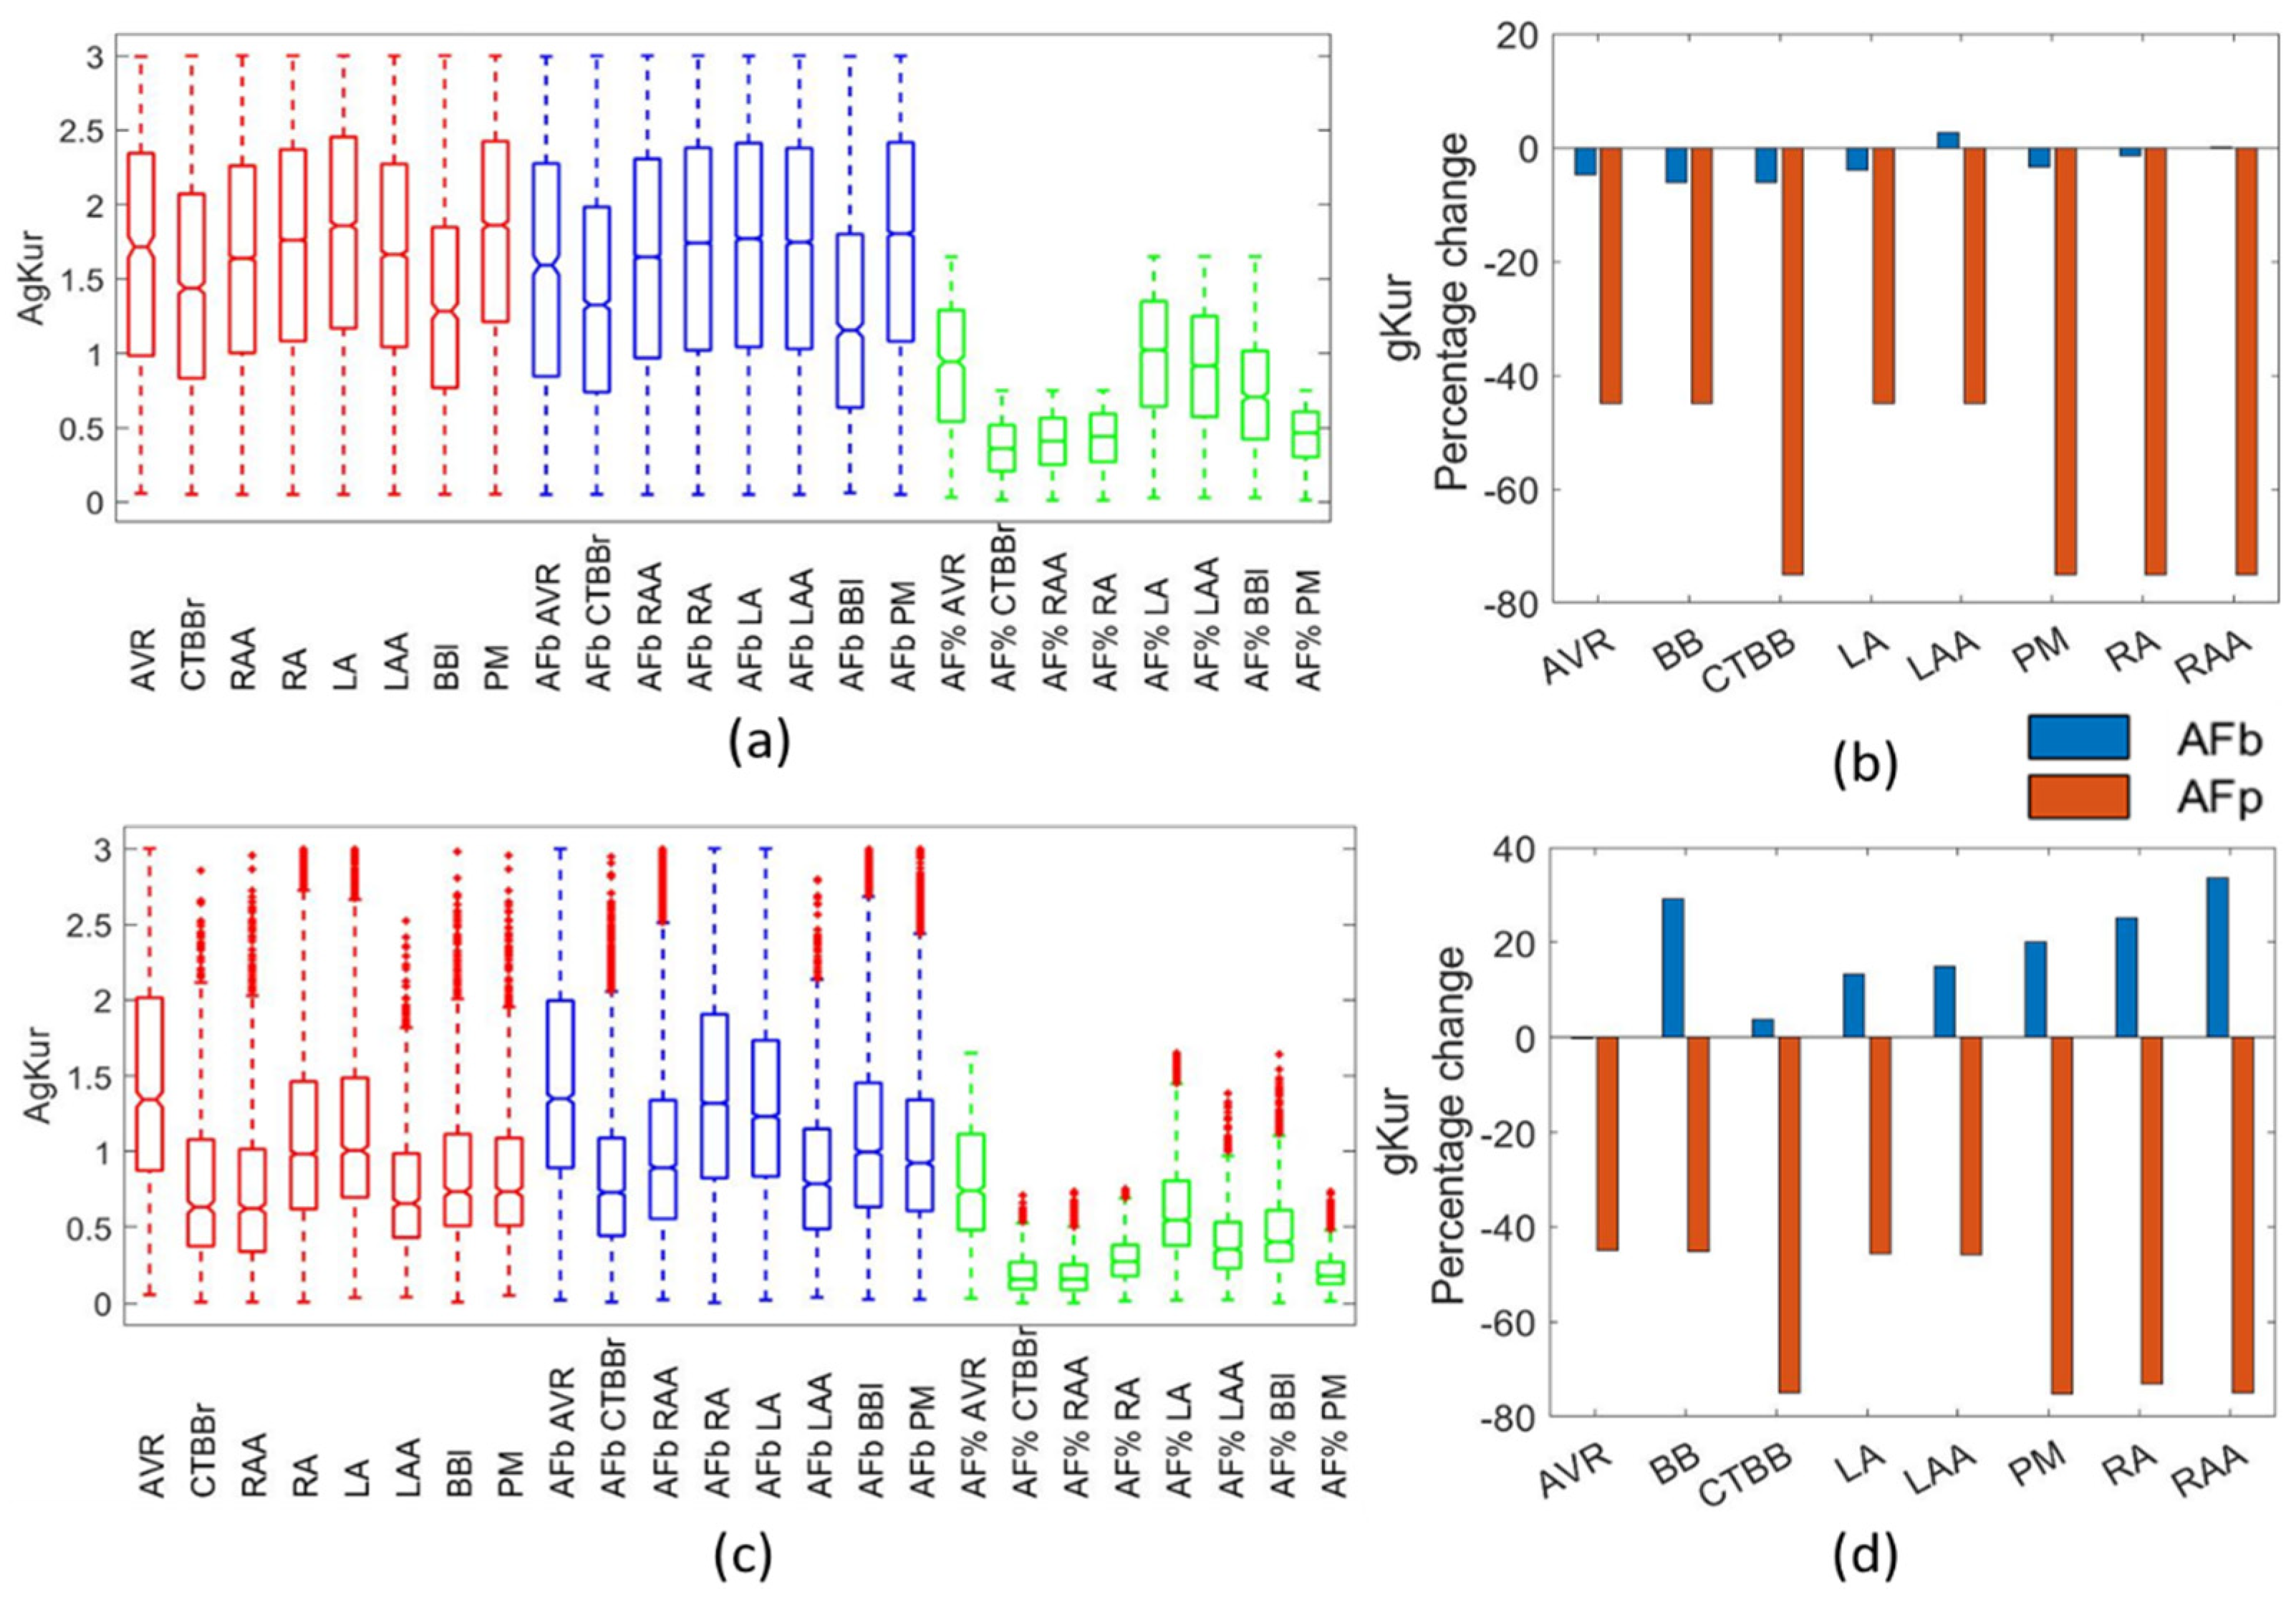
For the gKur channel conductance, there were contradicting reports as to the observed changes due to AF, suggesting a large variability in the impact of AF remodelling on gKur. Grandi et al. [
4] reported a 45% reduction in LA and a 55% reduction in RA. Conversely, [
11] showed a reduction of 60% for RA and a 45% reduction in LA due to AF remodelling. Various studies [
6,
8,
13,
15,
30] reported reductions in gKur of 40–50% due to remodelling. Bosch et al. [
27] reported no change in gKur from remodelling, while Li et al. [
34] reported no significant difference between RA and LA for gKur. The present study showed no significant changes in the gKur for the biomarker populations, with a slight increase in the mean value of gKur for most regions in the Maleckar populations. The Courtemanche biomarker populations showed a small reduction in the mean value of gKur, but, again, showed no significant changes in the population.
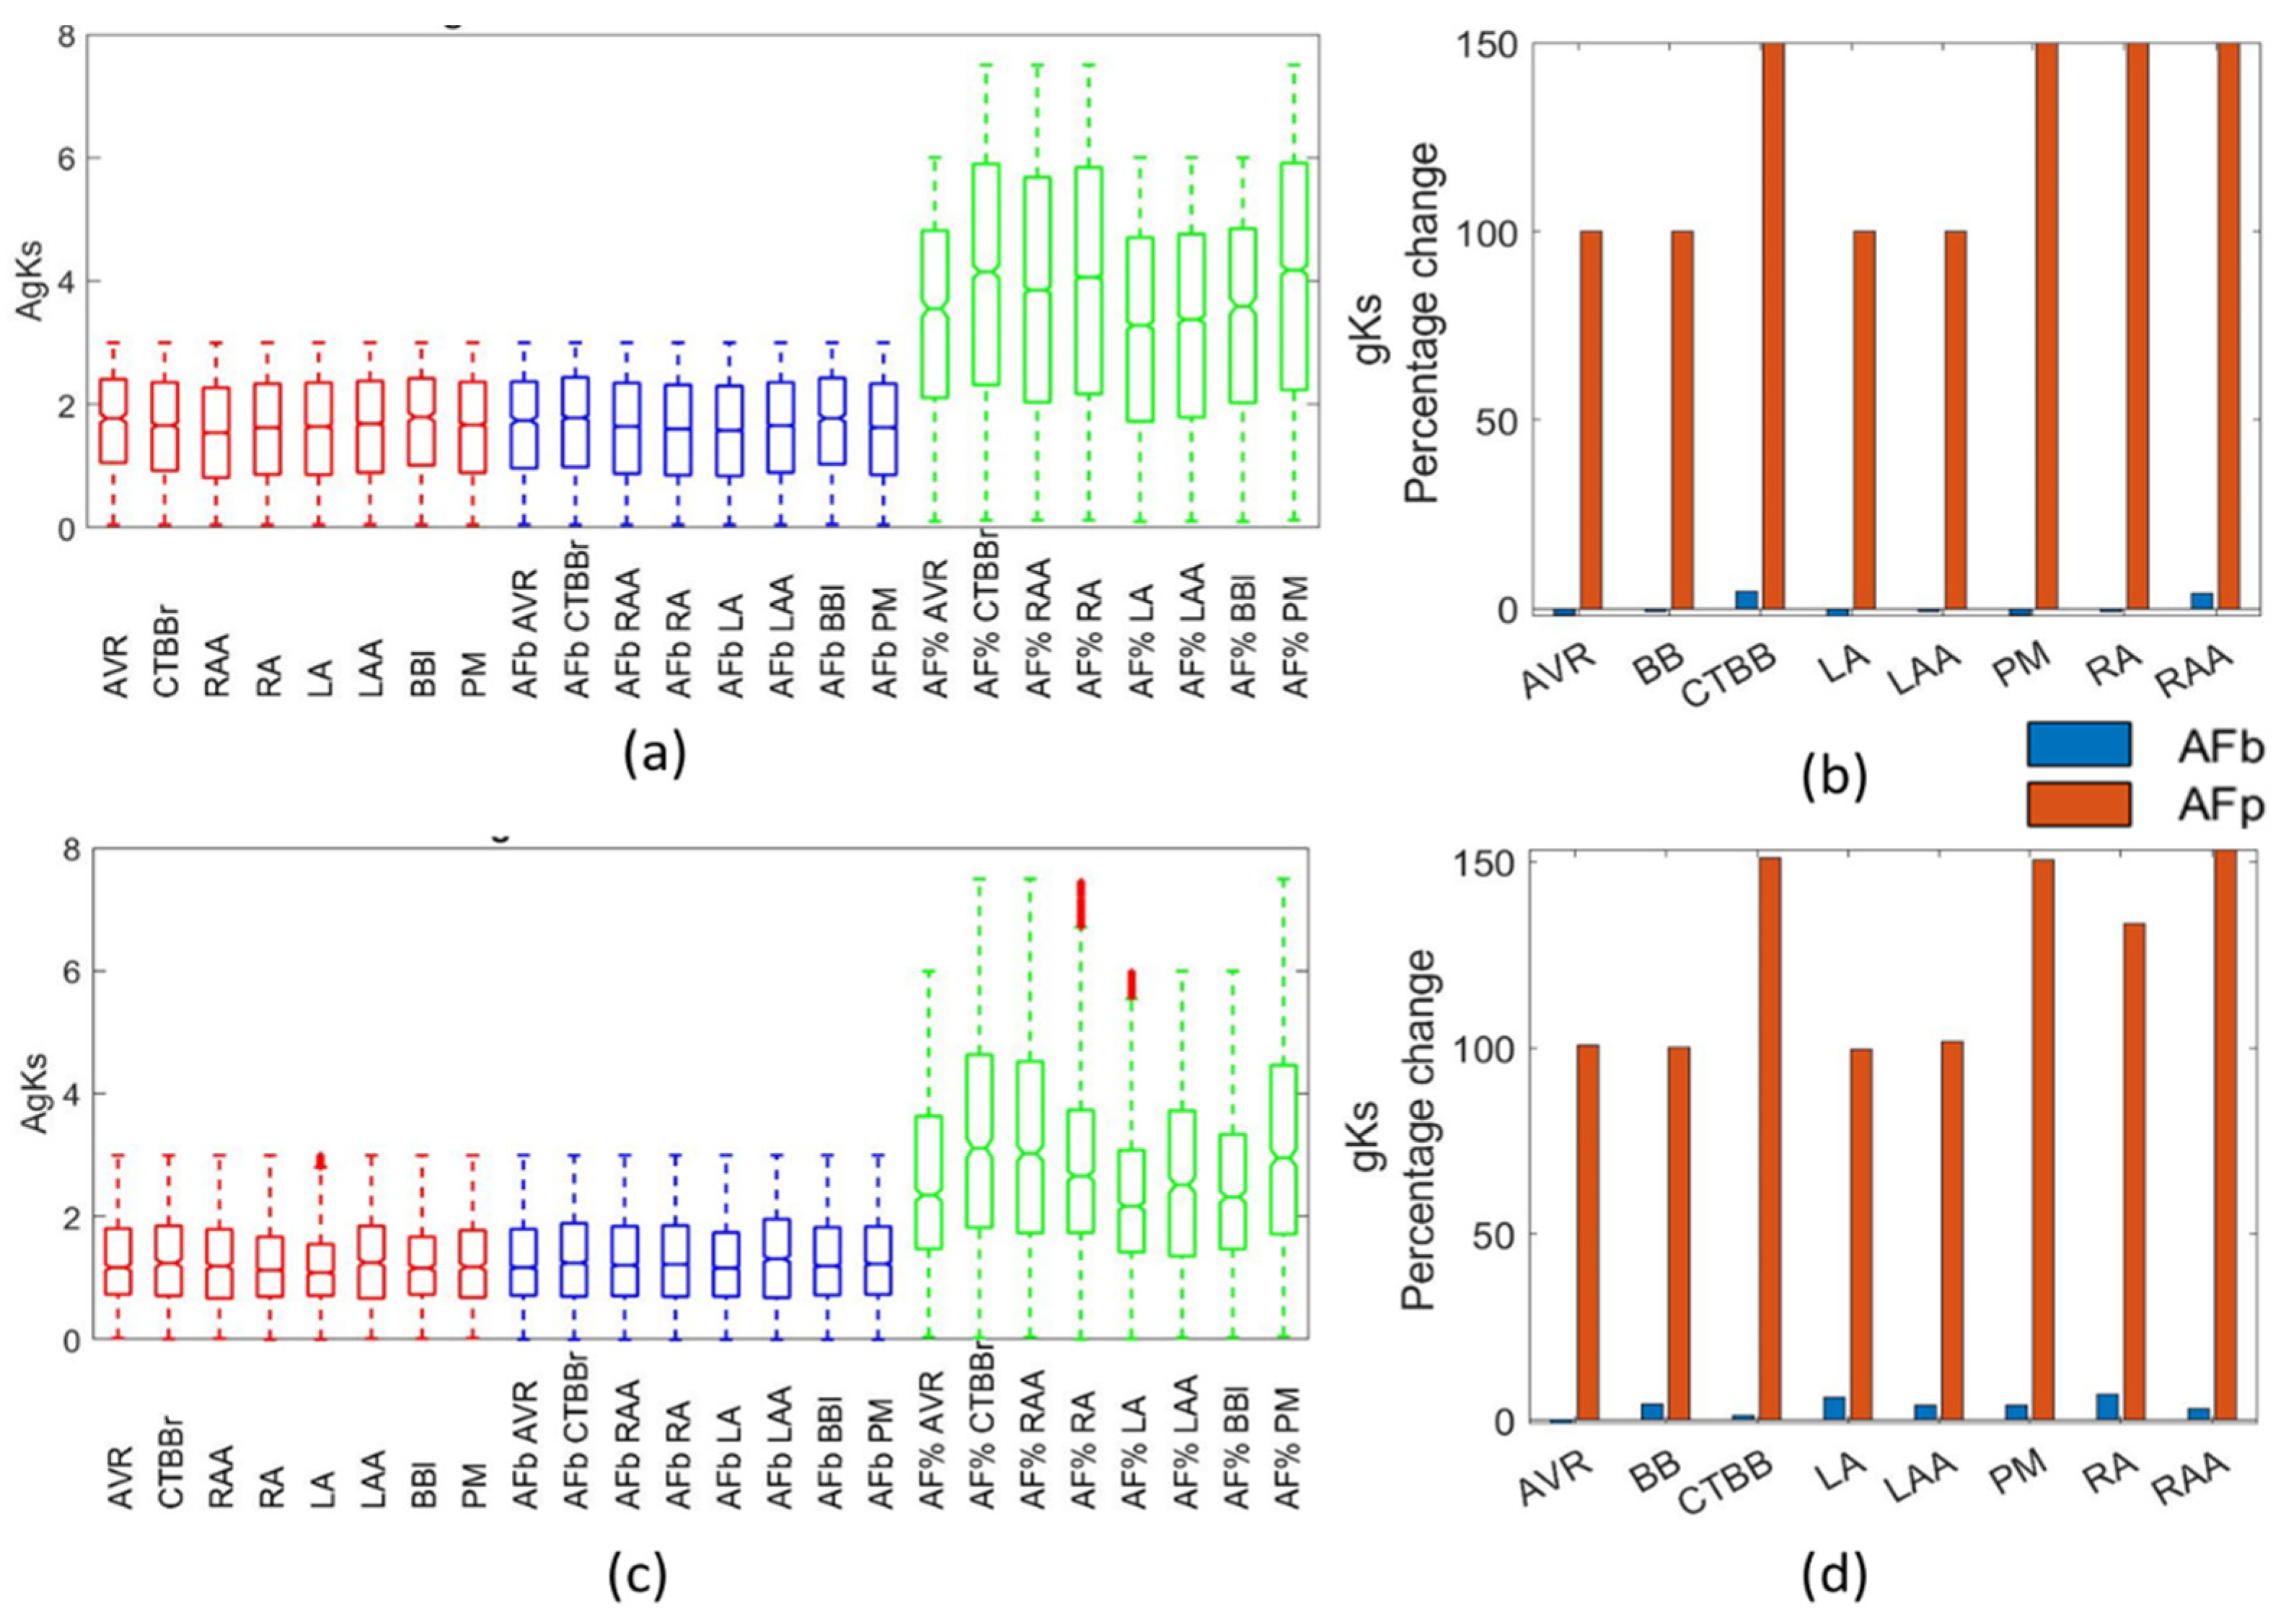
For the gKs channel conductance, the literature suggested either a large increase of 100% [
4,
15] or no change [
6] due to AF remodelling. The work from Caballero [
39] also showed a slight increase in IKs for LAA and RAA regions. Li et al. [
34] reported no significant difference in gKs between LA and RA regions. The biomarker methods in this study suggested no change to the gKs channel conductance, similar to [
6,
34], whereas the percentage method populations matched the findings in [
4,
15]. In this study, the percentage method resulted in raw values for the gKs that were far larger than the observed physiological range.
This study showed an increase in gK1 for the biomarker approach that was independent of the cellular model used. This tendency was found to be in agreement with the results reported in the literature [
6,
20,
40,
41]. In this particular study, for both the Maleckar and Courtemanche populations, the biomarker approach resulted in an increase of 30–50%, which was in line with Lawson [
6].
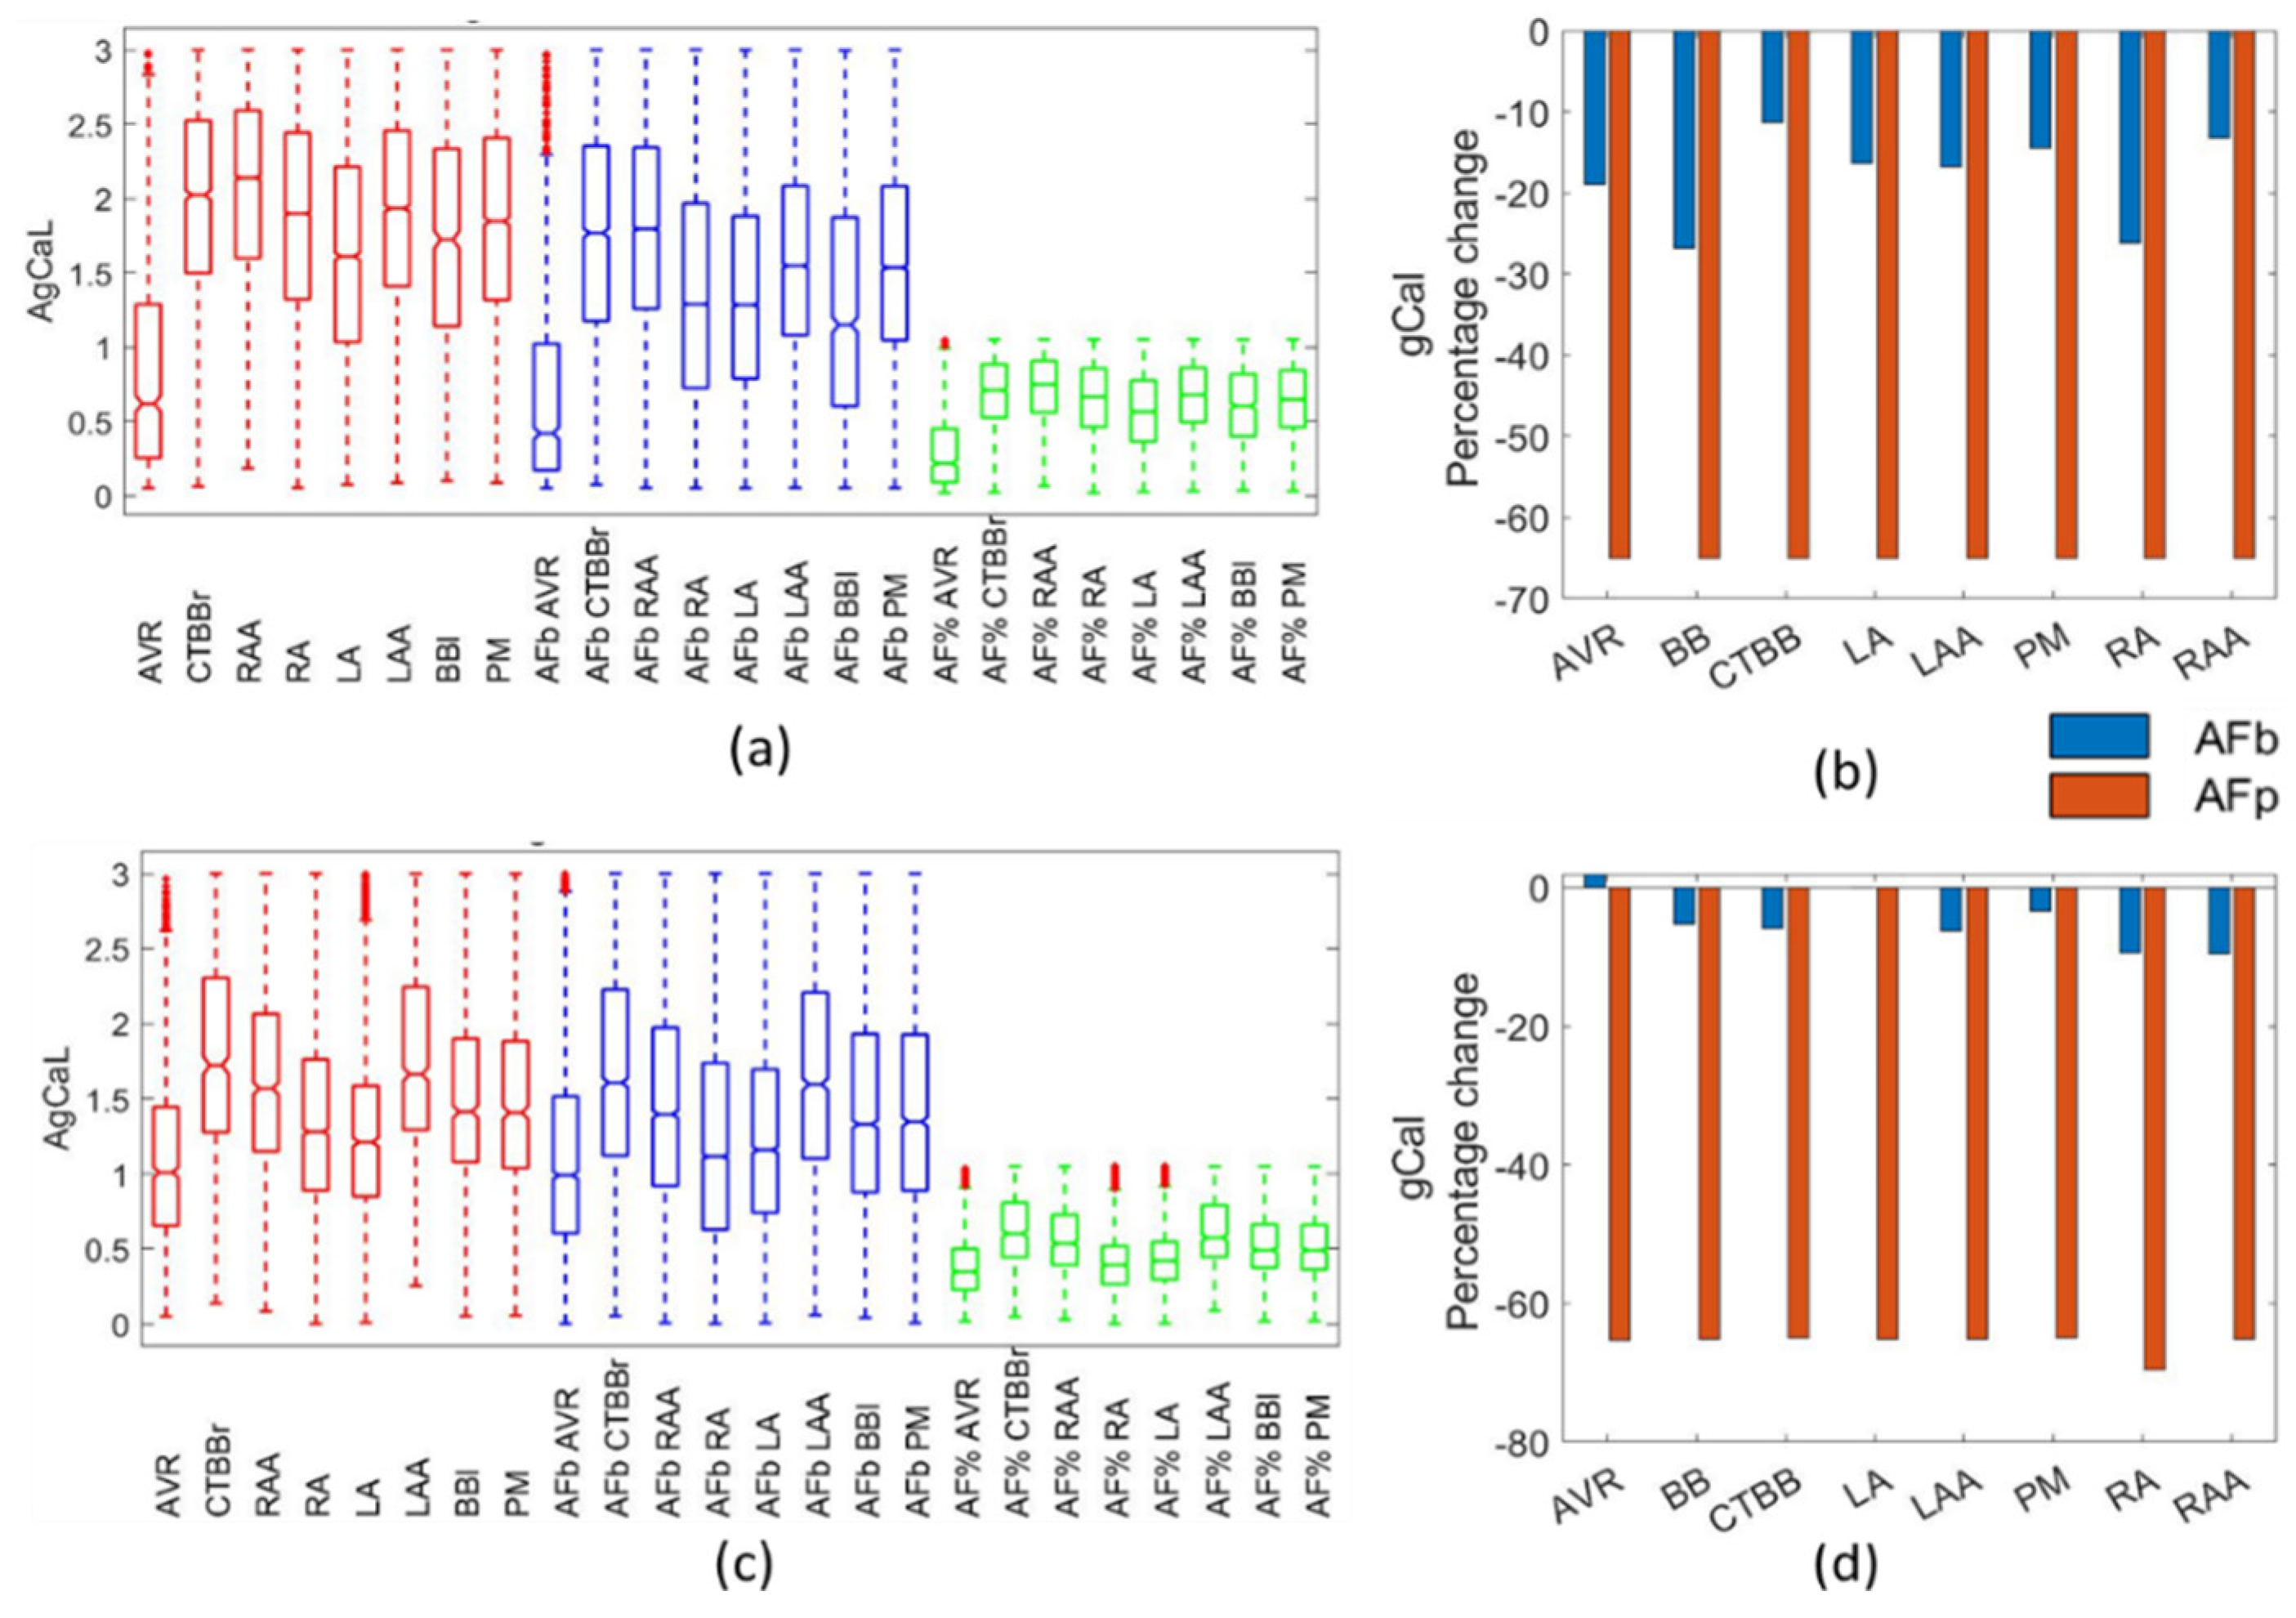
In this study, gCaL was significantly altered in both remodelling methods. The impact on gCaL, resulting from the percentage method, matched the reported findings in [
4,
6,
13,
15,
32], wherein gCaL was reduced by 50–70%. The biomarker method indicated a reduction on gCaL in all regions of the atria, which was consistent with experimental results by Workman [
40], van Wagoner [
30], and Bosch et al. [
27]. Li et al. [
34] reported no significant difference between LA and RA regions, which was observed both in the biomarker method and percentage method for both atrial models. Heijman et al. [
1] and Ridler et al. [
12] reported changes to gCal in cAF, but not in pAF lasting less than 6 months. The action potentials with shortened APDs in the biomarker approach, which do not have a reduction in gCal, could model the pAF action potentials. Feng et al. [
22] reported AVR and CTBB to have the smallest and largest gCaL, respectively. In the present study, this was observed in both the biomarker approach and percentage method for both models.
Overall, it is worth noting that published experimental data is typically collected from the RAA and LAA regions only. The results presented here showed changes to channel conductances in the appendage populations, which was consistent with published works.
This study also showed that the impact on different atrial regions varied as a result of AF remodelling. OLR results showed differences in non-linear relationships between biomarkers and channel conductances across regions and between cellular models. This could account for the differences in channel conductance expression due to AF remodelling in the biomarker method, and supports the suggestion that the impact of AF remodelling differs between atrial regions.
5. Conclusions
The focus of this paper was to compare two different methods for applying AF remodelling to variable populations. In doing so, the robustness of each method was evaluated against its ability to replicate experimental data. Furthermore, this is the first study to look at channel relationships and AF remodelling on a regionally specific basis. Due to the limited availability of data for AF remodelling across different atrial regions, typically AF remodelling is applied based on the assumption that all tissue in the right or left atria will be impacted in the same way. This paper hypothesized and confirmed that this is not the case due to the known differences between atrial regions for AP morphology.
Linear regression analysis showed the complex relationship between the channel conductance expression and AP morphology differences for each atrial region. These differences in relationships would suggest consistent changes to channel conductances across all atrial regions would have regionally specific changes. This was seen in the percentage method, whereby adjusting channel conductances across regions by the same percentage resulted in different impacts on atrial regions.
The percentage-based method is typically used for modelling AF patients in in silico tissue and whole-atria simulations. To date, this method has not been tested for its robustness to variability. In spite of this, more recent studies showed that the introduction of cellular variability was an important factor to consider when modelling the atrial electrophysiological behaviour. This study found that the introduction of variability was not compatible with the percentage-based method for AF remodelling. While the trends for the AP morphology due to AF remodelling were correct, the percentage method typically had an exaggerated impact on particular biomarkers. For example, the APD20 and APD50 were overly impacted in the percentage method.
The biomarker-based method for AF remodelling proved to be an effective way of adjusting the population, while maintaining the highly non-linear relationships between channel conductances and AP morphology. The general trend of the channel conductances, as a result of AF remodelling, was consistent with the percentage-based method, but showed clear variation between atrial regions.
The regionally specific nature of this study is unique in the literature, therefore comparing the results to other published work is difficult. It is, however, possible to compare the results specifically for the RAA and LAA regions, where experimental data is available. The results presented here show changes to channel conductances in the appendage populations that are consistent with published works.
Despite the fact that atrial regions have different AP characteristics and, therefore, different channel conductance expressions, the consideration that AF remodelling would differ across these regions has not been fully investigated. This study is possibly the first step in attempting to quantify the different impacts AF remodelling could have across different atrial regions. In the very least, this paper presents the ability for two methods for AF remodelling to adapt to variability, and proves the biomarker-based method is superior for AF remodelling. Additionally, there was sufficient evidence presented to confirm AF remodelling requires personalization across atrial regions for both methods.
Due to the excessive impact on certain biomarkers from remodelling using the percentage method, this method clearly requires adjusting for variability. One possible adaptation to the percentage method would be to scale the changes to channel conductances based on their initial value. This would require further investigation into the ability to replicate AF remodelling, but would likely solve the tendency to result in non-physiological biomarkers.
The biomarker method maintained inter-channel relationships that may occur, unlike the percentage method. Additionally, the biomarker method successfully impacted the channel conductance expression in a manner consistent with published experimental data. Using the biomarker method for AF remodelling in whole-atrial simulations minimises unintentional bias through channel conductance restraints. The large range of variability within experimental data shows the importance of minimizing this bias. For this reason, it is suggested that clustering, based on biomarkers, when applying AF remodelling is a superior method for whole-atrial simulations when introducing cellular variability.
This study showed the importance of tailoring the AF remodelling to individual regions. For both remodelling methods, it was clear that the non-linear relationships between channel conductances and biomarkers varied between atrial regions. To this effect, it is important to consider this when modelling the AF remodelled atria, rather than taking a uniform approach across the whole atrial model.
A limitation in using the biomarker method for AF remodelling was that the reported results were subject to limited available experimental data. The performance of the biomarker method could be further improved through experimental methods to determine a complete characterization of regional action potential characteristics in AF remodelled atria.


