Abstract
This paper studies the economically significant problem of the optimization of customs fraud control, which is a critical issue for many countries. The European Union (EU) alone handles 4693 tons of goods every minute (2018 figures). Even though 70% of goods are imported at zero tariff, the EU raised EUR 25.4 billions in 2018, and customs-related income transferred by member states to the EU accounts for nearly 13% of its overall budget. In this field, (a) the conflicting objectives are qualitative and cannot be reduced to a common measure (security and terrorism, health, drug market access control, taxes, etc.); (b) each submitted item has dozens of characteristics; (c) there are constraints; and (d) risk analysis systems have to make decisions in real time. Although the World Customs Organization has promoted the use of artificial intelligence to increase the precision of controls, the problem is very complex due to the data characteristics and interpretability, which is a requirement established by customs officers. In this paper, we propose a new Bayesian-based hybrid approach combining machine learning and multi-objective linear programming (MOLP), called multi-objective Bayesian with dynamic optimization (MOBADO). We demonstrate that it is possible to more than double (with a 237% increase) the precision of current inspection systems, freeing up almost 50% of human resources, and outperform past results with respect to each of the above objectives. MOBADO is an optimization technique that could be combined with any artificial intelligence approach capable of optimizing the quality of multi-objective risk analysis in real time.
1. Introduction
The action of making the best use of resources for a purpose is called optimization. In the field of social sciences, many problems are characterized by the coexistence of multiple criteria and conflicting objectives. This paper studies the economically significant problem of the optimization of customs fraud control. Even though 70% of imports now enter the EU at zero tariff, nearly EUR 25.4 billions were raised in 2018, and the amount transferred by member states to the EU accounts for nearly 13% of its overall budget [1]. This economic importance is greater in South America and less advanced economies.
The decision objects, namely imported goods, are specified on customs declarations, known as single administrative documents (SADs). SADs contain information about the characteristics—type, origin, value, etc.—of the goods, and customs offices must decide which have to be inspected, taking into consideration many conflicting objectives (trade facilitation, tax enforcement, security, defense of intellectual property, drug smuggling prevention and many others). In other words, the decision has multiple attributes.
In this problem, (a) the conflicting objectives are qualitative and cannot be reduced to a common measure (security and terrorism, health, drug market access control, taxes, etc.); (b) each item has dozens of characteristics; (c) there are constraints; and (d) the decision-making process is continuous, and successive decisions must be made continuously. Therefore, the risk analysis system has to make decisions in real time.
We propose a new Bayesian-based hybrid approach combining machine learning and multi-objective linear programming (MOLP), called multi-objective Bayesian with dynamic optimization (MOBADO).
2. Description of the Problem
In the past, customs offices inspected each and every declared import. The globalization of commerce imposed a clearance philosophy dominated by risk analysis (World Customs Organization, Compendium, (I), p. 3). In the 1970s, customs administrations deployed the concept of channels. A rule-based system sends declarations (SADs) to different channels: green for immediate clearance, orange for document control and red for physical control.
Most risk analysis systems, such as the United Nations ASYCUDA system used by more than 90 countries, include a list of Boolean conditions (e.g., if code of the good = 84.02.01.01.00 and country of origin is China) associated with actions. Each rule is associated with a distribution. For a specific combination expressed with a rule, the system assigns, for example, 85% of declarations to the green channel, with goods going through customs formalities without inspection, 10% to the orange channel for document inspection, and 5% to the red channel for physical inspection. The systems provide the list of actions to be performed by the inspector in each case. Specific controls have been established on the grounds of health (e.g., vaccines, mask or protective materials quality), tax enforcement or security. More specifically, the orange channel leads to document controls, where the inspector must check certificate validity or declared values by inspecting invoices and price lists. The system is maintained by groups of experts (e.g., the Spanish Tax Agency’s system contains more than 1200 rules) that translate the information gathered by risk analysis units and promote administrative cooperation.
These rules are independent and the output is a “list of things to do”, control actions, inspections, which can produce many types of results: suspension and seizure in the case of drug smuggling or terrorism, settlement of customs or other excise/alcohol duties, VAT, sanctions, etc.
We considered two problems:
- Problem 1. Create an evidence-based algorithmic method to optimize decisions in this type of multi-attribute problem.
- Problem 2. Quantify the benefits in terms of precision and efficacy of the proposed solution with respect to current techniques.
To sum up, we studied a dynamic, real-time, multi-objective risk optimization problem in the field of customs risk analysis.
This research reviewed the following:
- The literature on analytical optimization problem-solving methods and decision-making methods, which is included in [2,3,4], and the methods for solving MADM problems [5].
- Risk analysis approaches [6], specifically when applied to customs [7,8,9], including the Bayesian approaches [10], and many studies addressing customs fraud control [11,12,13,14,15].
- Studies related to the use of machine learning and artificial intelligence (AI) techniques, using decision trees, neural networks and hybrid systems [16,17].
- Best practices, including smart customs in Korea, the use of deep learning in Nigeria [14], machine learning in New Zealand [18,19] and the Netherlands [20,21,22] using Bayesian networks and deep learning, AI use in Canada [23], the Connect system of the U.K. [24], and Brazil’s SISAM system [25,26] as well as China’s and Indonesia’s approaches [27,28].
We found that decision makers use many approaches to search for the best solution. These approaches are described in the literature as multi-criteria decision making (MCDM), multi-attribute decision making (MADM), multi-criteria decision analysis (MCDA), multi-attribute decision analysis (MADA) or multi-criteria analysis (MCA). They use a plethora of methods: AHP (analytic hierarchical process), MAUT (multi-attribute utility theory), SAW (simple additive weighting), TOPSIS (technique for ordering preference by similarity to an ideal solution), COPRAS (complex proportional assessment), MOORA (multi-objective optimization on the basis of ratio analysis) or PROMETHEE (preference ranking organization method for enrichment evaluation).
We studied the evolution of best practices. In a continuing trend since the 1980s, the number of physical controls has been reduced [29,30]. Some countries physically control 25% of imports, but the rate of physical and document control is very low in most of the advanced customs administrations, for example, 5.53% in Brazil [31]. The problem of control optimization is becoming critical. According to the Pitney Bowes Index, more than 100,000 million parcels will be sent globally in 2021, which is a 35% increase over 2016.
3. Problem Settings and Methodology
3.1. Problem Settings
We use as a toy example of the problem, see Table 1, a case with two features (HS10 and country), two attributes (precision in tax levied (T) or suspension (S)), and three constraints.

Table 1.
Precision estimated in toy example.
Declarants submit SADs to customs continuously. Each SAD can contain one or more types of goods in which case they are declared as successive sad.items. A subset of ten sad.items is shown in the rows of Table 1. Many variables, including HS10 code, are declared for each sad.item, indicating product type (e.g., a phone) and country of origin (e.g., China).
Customs offices must consider unrelated objectives (i.e., tax enforcement, drug detection). When a forbidden good is detected, the good is seized and no taxes are settled, but both objectives can, in some exceptional cases, be achieved, for instance, when a drug is hidden in a container of undervalued fruit without the owner’s knowledge.
There are many constraints:
- The control of some specific objectives is mandatory (i.e., all controls related to terrorism must be executed, and 100% are channeled to red).
- The total percentage of sad.items inspected cannot exceed a specified percentage of all documents. Customs have to reconcile control with trade facilitation.
- There is an established level of service, and decisions must be made in a time window due to logistical constraints.
Suppose that a set of 100 sad.items is submitted to the customs office and entered in the rule-based system. The customs office cannot accumulate more than a set of, for example, 10 documents pending decision because it has to maintain the level of service. The decision maker must optimize decision making and should control a maximum (e.g., 8%) of documents within this group.
In Table 1, sad.item 1 has the code , and country of origin A. The rule-based system establishes that this item should be cleared, that is, assigned to the green chanel, 90% of the time. There is past evidence that this type of good with this origin was inspected once and was found to be non-compliant. It was a case of drug smuggling, and the result was a seizure with suspension of clearance (S). The decision maker should decide, taking into account the evidence and subject to the constraints, which documents of the group should be inspected, and repeat the decision afterward for successive sets of documents, optimizing control.
Using the precision of the controls established in the past as risk criteria, a sad.item declared with HS10(11)*Country(A), should be associated with a precision of 100%. The decision can be made taking in account the probability of non-compliance using a combination of one feature or several features. If the decision maker were to consider only the feature HS10 (11), the available data are with , and inspected items = 60 + 1 = 61; therefore, the estimated precision would be 25/61.
The decision maker has to deal with at least five issues:
- Absence of a vector of preferences: It is not reasonable to ask customs experts to create a vector of preferences for such a complex combination of qualitatively diverse objectives (decide between security risks vs. health risks) because these are political and ethical questions to which no firm answer can be obtained in writing. In other words, it is impossible to get a vector of criterion weights or a prior articulation of preferences.
- A sparse scoring matrix: The decision will be based on evidence of fraud probabilities. Due to their high cardinality, however, the evidence is sparse. For example, there were 131,854 possible combinations of HS10 and country in 2019, of which 44,111 were inspected, with non-compliance being found in only 5320 cases, that is, 4.03 % of the combinations. If we consider a three-element feature cross, such as an HS10*country*exporter, we will have a scoring matrix where only 1/10,000 of its elements have non-zero content.
- Levels of service: Declarants should be given an answer in more or less real time. It is not acceptable for documents to be retained pending the best decision. At all customs offices, there is a limit on the number of documents or the time that they have to wait for a decision.
- What are the best predictors of fraud?
- What are the criteria for deciding the best option?
Therefore, the problem can be stated as follows.
Problem:
Given an import trade flow t, along with its importer u, declarant d, and code c and country of origin, optimize the controls, maximizing objectives subject to constraints.
3.2. Methodology
Precision (p):
Efficacy (e): The efficacy of b with respect to a is the ratio of non-compliance:
Features and cross-features of a sad.item. One SAD contains more than 50 boxes with data, such as the HS10 code, country of origin, declarant, importer, customs value, etc. We use the term feature to denote an attribute of the sad.item (e.g., HS10 code or tax identification number), and cross-feature for a combination of two or more features (e.g., HS10*Country of Origin). For simplicity of notation, we will always use cross-feature , even if there is only one feature. Therefore, each sad.item (s) is defined by its cross-feature .
Flow of commerce. It is the flow of goods submitted to the customs office. Each element of this flow is identified by the combination of the customs office code (e.g., 2801 Madrid airport, type (e.g., I = Import), year and a sequential number. We simplify the notation by referring to customs code and type of commerce.
Suppose that we have a continuous import trade flow documented with sad , , each of them composed of that are cleared with a stopping time, and the total number of SADs so far t from the opening of the customs office (i.e., would be the ith sad submitted at a customs office).
Alternatives. In each time period , the customs office must select a subset , verifying a set of constraints for control (e.g., the number of with cross-feature f must represent a percentage of the total). Each group of selectable elements is an alternative. Therefore, , where is composed of sad.items with cross-feature , .
Objectives. There are objectives , such as tax, health, drugs control, etc.
Estimated Bayesian precision. We use a Bayesian approach. In each period t, the ratio between non-compliance and inspected sad.items is known for each objective . Let us suppose that, at the beginning of the period, the precision for objective of cross-feature f was and we know that the results of controlling these goods in the period is after inspecting . According to Bayes, the estimated precision for objective at the end of t is as follows:
With this definition and the current system, the precision values may be greater than 100%. The current system sends sad.items to the red channel, in which case it is mandatory to physically inspect the goods. In orange or green channels, however, the inspector can decide to change the original channel and inspect the goods. If non-compliance is found in these cases, we have results that do not have a prior inspection order handed out by the system. The inspector can decide to control four parcels, leading to three results, whereas the system ordered only one parcel to be controlled. In this case, precision is 300% (three results for one inspection ordered by the system).
Precision for an objectiveof an alternativeis as follows:
Precision of an alternative, given by the precision resulting from the control of each objective in t is as follows:
Record. Overall precision for the previous year, , where each , that is, precision for objective in the different cross-features.
We use precision as a bridge for evidence optimization. We choose an alternative in in each period t using three elements:
- Cross-features f of the sad.items .
- Bayesian evidence for each cross feature f and objective .
- Record for the objectives .
The problem is how to choose the best f, that is, the best characteristics of the documents, to capitalize on the evidence and predict .
Optimal cross-features
An optimal cross-feature maximizes the discrimination of distributions of precision. We first studied , which is used by current systems. Afterward, we stated the problem in terms of signal detection theory (SDT). Detection theory is a means to measure the ability to differentiate between information-bearing patterns. It is used by psychologists to measure how we make decisions under conditions of uncertainty, such as how we perceive distances in foggy conditions or during eyewitness identification [32]. This approach considers the distribution of something (precision, intensity) produced by two sources (signal and noise or, in this case, compliances and non-compliances), represented in Figure 1 (left) by two normal distributions.
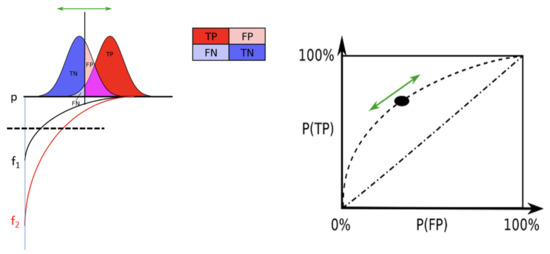
Figure 1.
SDT concepts.
A receiver operating characteristic curve or ROC is a graph of a function that illustrates the diagnostic ability of a binary classifier system as its discrimination threshold is varied. In this case, the variable used is precision. We use this theory, considering, by analogy, non-compliance as a stimulus and inspection decision as signal present [33,34].
Different cross-features, see in Figure 1 have different functional relationships with precision, and a different discrimination threshold should be established for each one. Figure 1 (left) illustrates that a sad.item can be qualified with a different using different cross-features ( or ) with a unique discrimination threshold.
Table 2 shows the outcomes of a binary classifier. The classical psychological approach is shown on the left side (grey), and our problem is illustrated on the right side (white).
Table 2.
Outcome of a binary classifier.
The notation that is used in customs analysis is as follows:
Inspection rate,
Accuracy,
Recall, and .
Based on the proportions of these types of trials, numerical estimates of sensitivity can be output using statistics, such as the sensitivity index [35].
The capability of each feature to discriminate distributions differs. In other words, for some features, the ROC is further away from the non-discrimination diagonal, and the AUC is bigger. Using other words, some variables are better at predicting fraud than others. Using different thresholds, we get different inspection and seizure rates [36], and it is possible to select the threshold that optimizes different criteria. The more false positives there are, the more seizures take place at the cost of reducing control precision. This is illustrated in the bottom right-hand corner of Figure 1 based on data output by the control of electronic commerce in China [36].
Modeling the problem
This type of problems cannot be regarded in strict machine learning terms, that is, as classification problems where the system is trained, using techniques such as discrimination trees or neural networks, to inspect documents that have a higher probability of detecting fraud, because this approach is unable to process the problem constraints and the existence of multiple attributes.
These constraints include, at least, the minimum and maximum number of controls for each attribute, and maximum delay for clearance. On the other hand, a decision has to be made on how to express the structure of the problem. We evaluated several approaches:
- A MCDM problem, traditionally expressed as follows:
This approach cannot be used to address our problem because it is impossible to obtain a function from without a vector of preferences and a function for maximization.
- 2.
- An optimization problem, expressed in mathematical terms as follows:where is the objective function or criterion; D is the set of permissible areas of the optimized objects, is an element, and is the minimum or maximum value of the function . We conclude that it is possible to address the problem as a continuous optimization if each decision is optimal. Bayesian decision theory is concerned with choosing between different decisions based on one specific type of information: evidence. The information space is , and each piece of information in this space is , such that . To solve this problem, we need to define a loss function:
We propose a five-stage methodology (MOBADO) as depicted in Figure 2.
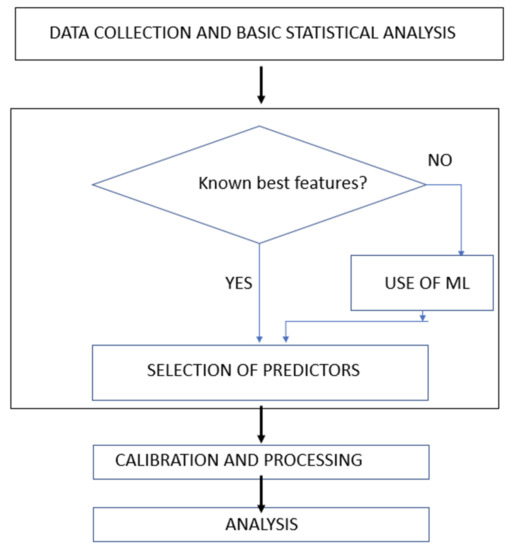
Figure 2.
MOBADO stages.
- Data collection. The source of the data are SAD documents, retrieved from the Spanish Tax Agency database. We have used only one table containing all the information related to SADs and clearances. It contains eight million rows/year, but the number of data related to inspections and non-compliance is around 0.5 million (see Table 3). In this specific case, the data were downloaded in CSV format from a SAP warehouse and were processed with R. In other cases (Section 5) requiring the use of all the data, we used Python.
Table 3. Example of decision-making process.
We conducted a basic descriptive analysis of variables (see Table 3).
- 2.
- Objective definition. We believe that MOBADO is the first approach to multi-objective optimization in customs. Until now, customs considered each objective (control of drugs, health, etc.) separately because mostly customs offices have to run checks ordered by other authorities.
Looking at the collected data, data scientists should consider the different types of output from different inspections, number of records processed by the customs office, sample sizes, etc., to decide the best approach.
We suppose that, when inspecting a sad.item with rules created with features = “Coffee from Brazil” and = “imported by a new postal commerce declarant”, we obtain and , always as a percentage of inspected , where 0.1 is the probability of for objective and 0.6 for when is inspected.
Let us suppose that the flow of imports was 2500 sad.items Therefore, 200 is the maximum number of documents to be inspected.
Let us suppose that the risk analysis units have already assigned 100 sad.items to the red channel for control. Therefore, the customs office must optimize the control of an additional number of 100 documents. Suppose also that the riskiest sad.items are of two types, a and b. Items labeled a are selected using and those labeled b using . The customs office must decide to control items of each type. What would be the best decision? Table 3 shows the expected results using Bayesian inference for each objective for several values of . For example, when inspecting 60 items of class a, we could expect 18 non-compliance cases for the first objective and 48 for the second one. It is a matter of selecting the best x, and this requires knowledge of which of the possible expected outcomes (e.g., is optimal.
The selected criteria is to outperform the last “record” obtained in the previous year. If decision makers cannot express their preferences, it is a good strategy to accept criteria that continuously outperform past results. Figure 3 illustrates the rationale. The ordinates on the plane are counts of the control of the attributes. Customs offices must control a minimum number of sad.items looking for drugs and a minimum of such items for tax enforcement (undervaluation), and the total number of controls cannot be above a specified threshold. Therefore, the feasible region for control is a triangle. Given a new sad.item, its control will be feasible if every constraint is satisfied.
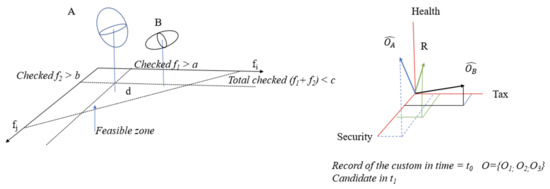
Figure 3.
Dimensions of the decision.
Let us suppose that there are two possible options at any time, A and B, and we must decide which of them should be inspected with a record of (0.21; 0.40). Let us suppose that the control of subset A will get an expected output of (26, 36), and the control of subset B yields (18, 48). Which subset should be inspected? For each of these results, only one subobjective can be improved. We select the option that most reduces the distance to the objective in the most delayed dimension.
We represent non-compliance vs. inspected features for each element on the z ordinate—precision. It is possible to study the precision for this point in each dimension.
If we have candidates to be controlled, each with attributes and each , where are the cross-features of :
In our case,
Therefore, we should choose B.
- 3.
- Selection of a fraud predictor. We need (Figure 1 left) to decide the best feature, in other words the best function to discriminate compliance and non-compliance and afterwards to get the best threshold. We will use machine learning techniques to select the best predictor.
- 4.
- MOBADO calibration and processing. We will specify the threshold, that is, the value of the predictor that optimizes the decision, using SDT. This threshold is affected by the distribution of precision (in the classical approach to Gaussian curves, and in this case, a Bayesian estimation of these values calculated from the experience of past years at each customs office), that is, the stopping rule established to satisfy the level of service and constraints.
For the decision on the stopping rule, we used a strategy that applies the secretary problem concept built in decision theory [37]. The problem is to select the best of a set of candidates in a succession of interviews after which each candidate is immediately accepted or rejected. The best strategy is to select the first candidate that outperforms the first group passing the interview. On the boundary, we know that the probability of getting the highest-ranking list item is 1/e, where compliance is randomly distributed over time [37].
If, as in our case, we want to select the best candidate to be inspected from a set of documents submitted in succession and we are obliged to decide whether or not each one is the best without any knowledge about the future sad.items, the solution can be to apply the above mentioned rule.
Figure 4 illustrates the comparison between the optimal strategy and random selection from N = 1 to N = 50. The values when B changes from 1 to 9 are shown in the top left corner. The solution converges toward 1/e, that is, 0.368.
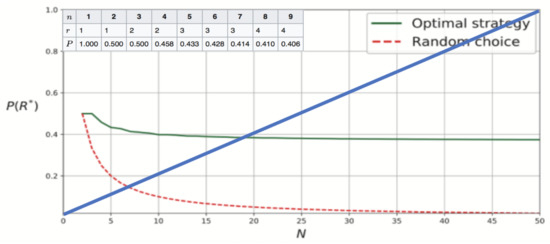
Figure 4.
Probabilities and costs associated with different stopping times.
Figure 4 represents the cost of withholding the release of up to 50 documents. The document submitted first would have to wait 49 time intervals, the second one 48 and so on. For trade facilitation purposes, customs offices must balance the cost of the decision to impose a stopping time, for example, a half-hour delay, against the improvement of the optimized record.
- 5.
- Validation of results and analysis of external validity. The findings are evaluated according to a two-part process:
- (a)
- Contrafactual evaluation of benefits and calibration using training data.
The proposed contrafactual was as follows: what should the results of using MOBADO in 2019 have been? For each day in the past, we know what documents were inspected following the instructions of the current rule-based system, the number of associated compliance and non-compliance cases and the precision for that day.
We can estimate what should have happened using MOBADO in the feasible region to calculate the following:
and estimate the improvement as a ratio and its distribution:
- (b)
- Testing of MOBADO using 2020 test data. We studied the external validity of calibrating the 2019 training data with 2020 test data. In our research, we did the following:
- (i)
- Calibrated and analyzed MOBADO with 2019 data.
- (ii)
- Tested against current practices with 2020 data.
- (iii)
- Estimated the potential benefits.
After assessing the external validity of a classical approach verifying the increase in precision (training and test), we provide a counterfactual estimation of what could have been the benefits of MOBADO.
4. Results
4.1. Calibrating MOBADO (2017–2019)
Step 1. Data collection
Table 4 shows Spanish customs data for the period 2017–2019. Microdata that do not affect privacy, as is the case of sanctions, can be downloaded. In any case, we take full responsibility for the conclusions of this paper, which were not reviewed by the Spanish Tax Agency.
Table 4.
Spanish customs office results in the period 2017–2019 (own elaboration based on Spanish Tax Agency data).
The bottom two rows list the number of sad.items and the number of inspections performed when goods are directed along the orange or red channels, that is, whenever clearance is not automatic:
- The percentage of controls (inspections) is of the order of 7% of submitted sad.items. Customs offices cannot perform more than the above rate of inspections for each period t.
- The analysis includes four measures and three objectives : (i) initiated sanction procedures; (ii) total number of settlements of tax due after inspection (termed actas tributarias in Spanish), composed of two subgroups customs tax non-compliance cases (b1) or additional tax due (b2); and (iii) number of cases of clearance suspensions after the discovery of forbidden goods, mostly on security or drugs-related grounds.The records are listed as percentages on the right of the table, first with respect to the number of inspections and second with regard to the total number of declared sad.items.
- The overall precision of the system is around 4%. Data by years are shown in Table 4 (see row % vs. inspections).
The efficacy for 2018 and 2019 is calculated with respect to 2017 (the baseline).
The items under the % inspected heading in Table 3 are considered the records (R) that must be outperformed in the next period. For example,
Total precision (% of non-compliance vs % inspected in 2019 was 4.58. We have identified three objectives: sanctions, tax enforcement (summing the cases of sub-objectives b1 and b2), and suspended clearance. This is the 2018 record that should be outperformed in 2019.
We apply the proposed methodology subject to the constraints below:
- Every document in the red channel must be controlled.
- The maximum control percentage is 8% of sad.items for each alternative, that is, 8% for the office as a whole.
- Maximum elapsed time, t, one hour for a customs office open to taxpayers for eight hours.
Step 2. Predictor selection and calibration
We explained that the conventional approach is to evaluate risks in terms of the cross-feature. In other words, rule-based systems aim to control combinations such as based on evidence that many taxpayers undervalue their declaration of these goods purchased over a platform. We must optimize the inspections because is useful for establishing rules, but it is not a good predictor of fraud.
Figure 5 shows the observed distribution of the precision. In 2019, 332,057 shipments arrived from China. Point A represents the cross-feature , which was controlled 4,997 times with 826 non-compliance cases ( = 16.52%), and point B, with a of 0.643%. Customs offices inspect, for diverse reasons, goods with high and low non-compliance risks (i.e., looking for weapons of terrorists).
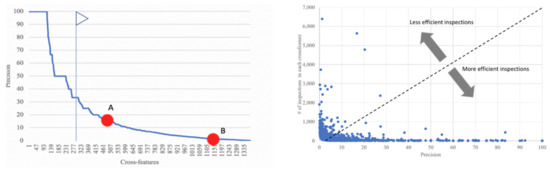
Figure 5.
Precision.
Figure 5 (left) shows that the estimated is greater than 30 % for only 282 cross-features. Figure 5 (right) crosses precision with effort (# of inspections). There is a region of low precision inspections and a high number of controls that could be improved. According to the rule-based system, some goods must be inspected on security grounds, even though there is a low probability of non-compliance, but the decision should be optimized within the bounded feasible region open to the decision maker.
We observed several important facts:
- The type of products imported each year change with globalization and show new cross features; see Table 5 column in .
Table 5. Control results for different cross-features.
- While the number of cross-features with a precision of 100% is high, Figure 6 left, it is very uncertain. For example, there were 1123 cross features in 2018 (with only one non-compliance case per inspection in many cases).
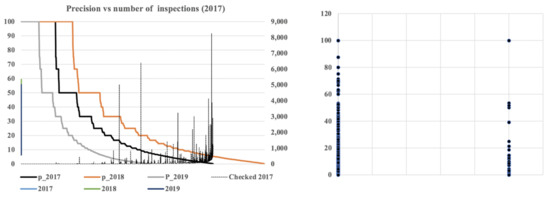 Figure 6. Evolution and distribution of precision.
 - Customs offices use inspection rules that do not consider all cases of risk. Many high-risk cross-features are not inspected because the rule-based systems cannot provide the granularity to cross features with a cardinality in the range of 130 K.
- The lessons learning process could be better. For example 38.22.00.00.00 is the code for laboratory reagents. When combined with country of origin U.S.A., it was inspected 8256 times with = 0.37 %. It is clear that, after verifying that a provider is regularly compliant, rules should be updated using a Bayesian strategy to avoid the reiteration of useless inspections. The rule-based systems does not have this flexibility.
There is room for improvement, but the solution to the optimization is not trivial for many reasons:
- There is not enough evidence to optimize the decision. In Figure 6 (right), points are cross-features (e.g., China) for the goods submitted on a random day (2 December 2019). Some of them were compliant, and others, non-compliant. The ordinate shows the estimated Bayesian precision prior to their control. We find that there were cases of compliance and non-compliance for a single level of estimated precision, and also many non-compliance cases were found for high values of expected fraud (precision).
- A switch to low cardinality variables, such as country of origin, does not solve the problem because the highest probability of fraud is for countries of origin with low traffic (e.g., Australia with 77 non-compliance cases for 82 sad.items), and the country with the most detected non-compliance cases is China, with 7784 non-compliance cases in 332,057 sad.items (), that is, a low probability.
- There are conflicting objectives. Figure 7 (left) shows the top ten countries by flow of imports and their respective percentage with respect to each type of results (i.e., China accounts for 60% of all sanctions and is followed in order of importance by the USA).
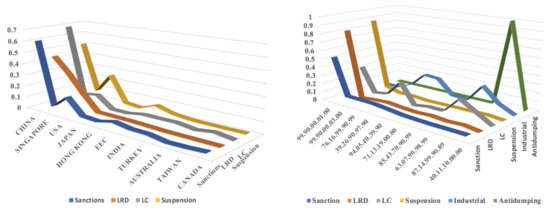 Figure 7. Top countries and codes.
 - When we include these and other possible attributes, such as the control of antidumping taxes, identified by their code, we find, for example, that the control of position 87.14.99.90.89 is important for antidumping, although it is irrelevant for other objectives. It is complicated to optimize all objectives.
We resumed the facts and the obstacles, and we now describe the solution proposed.
In order to select a predictor of fraud, we search the optimal cross-feature using SDT. Figure 8 (left) represents precision (with the cross-feature). We use the analogy of stimulus intensity with the possibility of distinguishing signal noise, to study compliance vs. non-compliance, as shown in Figure 1. Figure 8 (right) represents the ROC curve.
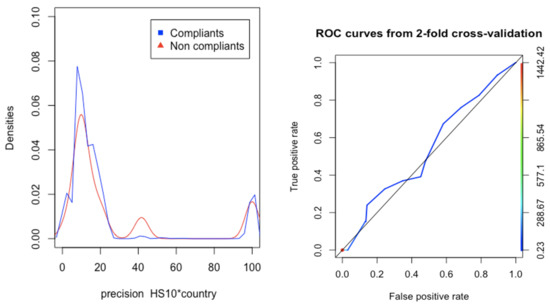
Figure 8.
Classifier using as the cross-feature.
Figure 8 illustrates that, using this cross-feature, there is no clear distinction between the distribution of compliant, and non-compliant documents, the AUC in the ROC is low, and we get a result that is not much better that a random classifier.
The strategy adopted to improve the results was to increase granularity. The first step was to look for a better cross-feature combining four variables: .
Figure 9 shows the results of several tests using weighted precision values, applying a linear transformation, followed by an exponential transformation (green curve) of precision. We see that the density of the non-compliant distribution has moved upward. Therefore, it is easier to identify compliance in the interval of low values of weighted precision. In a third step, we used a logistic regression to search for the optimal classification for sad.items, using a combination of variables as the predictor. Precision, importer status as private person (Yes/No), importer status as Authorized Economic Operator (Yes/No), importer legal status (natural person, PLC, corporation), weight and value of the goods. The final results are illustrated in Figure 9 (right), where the blue line provides a better classification of non-compliance cases at the top of the curve.
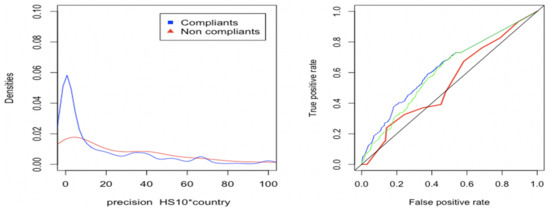
Figure 9.
Using high-order cross-features.
With an answer to the problem of the selection of features we move to the problem of dynamic optimization.
Calibration of MOBADO for Adolfo Suarez Airport
We studied the characteristics of the selected customs office, Adolfo Suarez Airport, in Madrid, see Table 6. We selected one type of traffic because the type and rate of goods cleared differs from one office to another, and a joint analysis of the mixture would be less precise. The system has to be adjusted for each problem because non-compliance is local.
Table 6.
Example of data submitted to Adolfo Suarez Airport.
A total of 1,812,269 sad.items were submitted at this office, with a mean of 4952 per day.
Of the 55,874 different cross-features presented to inspectors at this customs office, 1432 were found to be fraudulent. This accounts for 1432/5320 = 27% of the total national non-complaint cross-features, see Table 5 (last ine).
Figure 10 (left) represents the number of sad.items by importer on the abscissa. Of the total traffic, citizens that use this customs service only once a year, for example, to buy a book or a phone, account for 85%, that is, most are low-value imports by natural persons. The number of non-compliance cases by type is listed in the columns. The evolution of the number of items and importers is shown on the right.
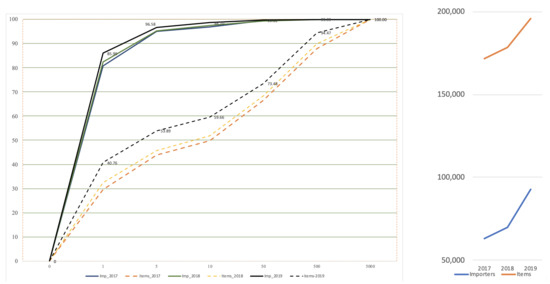
Figure 10.
Importers at Adolfo Suarez Airport.
Figure 11 illustrates the data for this airport in 2020. This illustrates the reduction of traffic due to the COVID-19 pandemic, and the partial recovery at the end of the year.
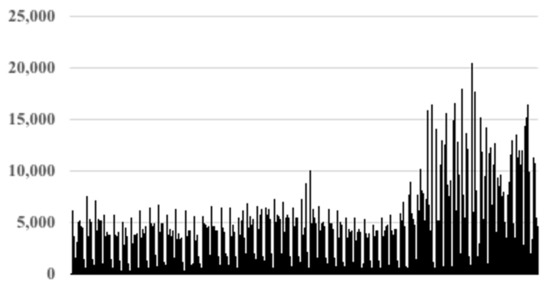
Figure 11.
Number of sad.items over the year 2020 at Adolfo Suarez Airport.
The calibration has three components:
- Decision about the feature used as a predictor.
Figure 12 (right) shows the distribution of the cross-feature precision with the histogram and a multimodal curve that fits the density distribution in 2017 (blue). The fitted distribution changes over time, red (2018) and green (2019), showing that the use of an evidence-based Bayesian approach improves the quality of the evidence over time.
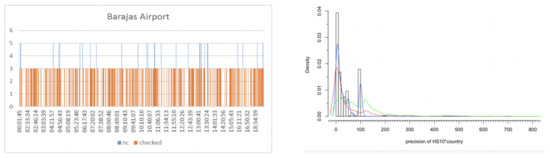
Figure 12.
Rate of clearance and characteristics of precision.
We know that the mean value of the number of sad.items submitted at the airport is 4952. The interval within which declarants can submit documents is from 12:00 a.m. to 6:35 p.m. Therefore, the rate of flow is 43 documents per minute.
- 2.
- Setting of constraints.
The number of controls must not account for more than 8% of documents.
All documents in the red channel must be inspected.
- 3.
- Decision on the optimal stopping rule 1 hour.
- 4.
- Decision about the threshold.
In our case, every document must be channeled during the day, so we must study the problem in a day by day basis. We show one working day of each month of 2019 at Adolfo Suarez Airport in Madrid. We report the results for the current system. Table 7 and Table 8 show the control date (1), the number of inspections established by the current system, red channel (2) and channels other than green (3), the number of non-compliances detected via the red (4) and other channels (5).
Table 7.
Analysis with one day per month sample for 2019.
Table 8.
Analysis with one day per month sample for 2019 (Continue).
The current rule-based system uses the variable p of the cross-feature, although we proved that it is not a very good predictor. We obtain the number of estimated results that would have been obtained using the estimated Bayesian probability when inspecting only the sad.items with a p higher than each of the thresholds considered. We made an assay with several discrimination thresholds and we present in Table 8 several of them.
For example, on 2 January 2019, 239 sad.items surpassed the threshold of , and we can estimate that their control would have identified 28 non-compliance cases. In this case, the customs office would have been identified 3 non-compliance cases in red channel controls and 28 in other inspections, totaling 31 non-compliance cases with the stated precision and efficacy.
We find that the number of inspected sad-items decreases (i.e., from 2554 to 239) as the threshold increases (50, 100, 200,…) in the data for 2 January 2019, and the mean estimated number of non-compliance cases increases (from 12.85, (level 10), to 28 (level 250)). The estimated number is greater because we are selecting only sad.items with a higher probability of fraud.
Figure 13 summarizes the efficacy (auxiliary ordinate axis) and precision (principal ordinate axis) for each of these twelve days presented in the table—samples of the months of the year. With a threshold of , the customs office would have inspected 3645 sad.items, that is, 82.89% of the inspections (4397) that were performed by the customs office on these days), increasing the precision fourfold from 4.58 (see Table 1) to 18.57 (mean value for the specified dates). Looking back at Figure 1, a different threshold changes the ratio of the inspection to seizure rate. With a threshold of 250, the customs office would have inspected 2615 documents with a precision of 26.98.
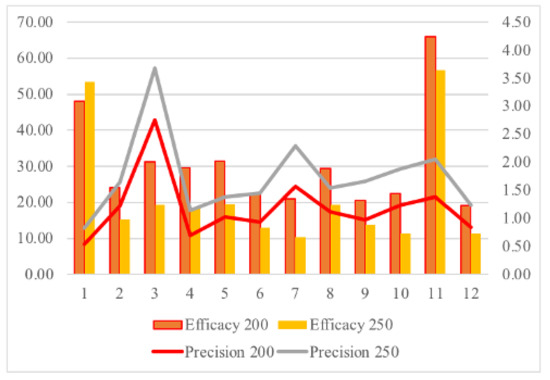
Figure 13.
Adolfo Suarez Airport Customs Office clearances (2020).
4.2. Validation of MOBADO with Evidence from 2020
We use 2020 data to test the external validity of the solution using MOBADO trained with 2019 data. We used the same days, that is, a sample with 53,336 elements for the test. Customs offices inspected 4433 of the elements, 228 of which were assigned to the red channel with mandatory control, and we detected 36 non-compliance cases.
We found 201 non-compliance cases for a MOBADO selection of 2605 inspections. Therefore, total precision was as follows:
The solution satisfies all the constraints, and records from previous years.
The 2020 optimization more than doubled (with a 237% increase) the precision of the customs 2020 record. The number of controls non ordered by the rule-based systems decreases from 4397 to 2605 and that frees up 40.52% of the resources dedicated to control.
The results could be optimized even further if the customs office were to adopt a new inspection strategy, explaining a new method that combines stopping time and lines of desire to increase precision. The result is a precision of 23.23% with an increase of 1.8 times in expected efficacy.
These results were achieved using a stopping time (one hour for orange and red SADs) instead of continuous decision making. However, the combination of both papers provides the framework for decision learning, considering costs and benefits.
5. Discussion
There remain many open questions. These are good results, but could they be even better? What determines the quality of the results? To answer these questions, we need to return to MOBADO stage and discuss two issues.
- What is the best possible result with only one objective (e.g., tax inspection)? Figure 14 shows the results for the Adolfo Suarez Airport in Barajas with all the data for 2020, using the gradient boosting classifier and all the useful features of a SAD (43 items).The resulting ROC-AUC was 0.999965 for the training set (70% with a sample size of 81.655) and 0.98755 for the test set. The right side depicts the relative importance of features (box 4: type of previous document or summary declaration; box 8: legal personality (natural or legal person); box 29: customs office; box 1: country, etc., ranked in order of importance).
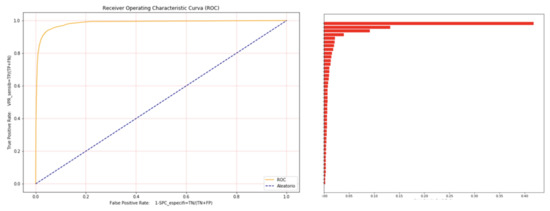 Figure 14. Classification with gradient boosting (Barajas 2020).
At the optimal point, we output 2083 true positives and 31,152 true non-compliance cases, 1630 false positives and 130 false negatives with a precision of 56.10%. These are better results than those reported in Section 4 and are consistent with or better than the best results reported in the literature [17]. The crux of the matter, however, is that this approach, despite raising precision from 3.57 to 56.10 (an incredible 1571%), does not provide a real solution to the problem.
In customs control, the observed fraud (see Table 3) with respect to inspected documents is in the range of 3%. Therefore, the precision of a classifier predicting that every SAD is compliant would be 97%. We did not apply gradient boosting to outperform other ML tools, nor did we aim to select only the “most promising SADs” because customs offices have to investigate terrorism or drug smuggling, even if the risk is low. We wanted to optimize control under real conditions in a multi-objective context with real constraints.
Therefore, the answer to the question is as follows:
- (a)
- The results could be improved by forsaking “low precision controls”, such as those to drug smuggling- and terrorism-related inspections.
- (b)
- It only makes sense to compare results for controls by different customs administrations that have the same mix of objectives and a similar fraud baseline.
- 2.
- What is the best result achievable by any country in a multi-objective context using a less detailed document, while meeting commerce facilitation constraints?
We must take into account that the control of low-risk, albeit dangerous, shipments is high in terms of precision.
Figure 15 shows the cost of misclassification in the control of China’s e-commerce. As the inspection rate grows (health- and terrorism-related checks) or due to extensive customs checks, the seizure rate decreases. There is a tradeoff between inspection extension and precision.
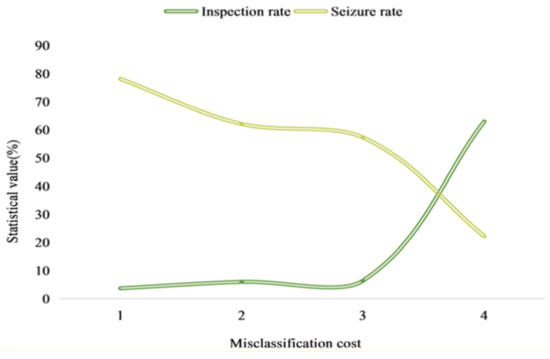
Figure 15.
Cost of misclassification. (Source [36]).
How is it possible to manage all these elements? This is the question that MOBADO solves, as it does the following:
- Increases the precision by 237%.
- Outperforms the current system in each and every regard (tax collection, drugs, etc.).
- Is applicable with just the basic features used in every country.
- Can be combined with ML approaches and bridges with current rule-based systems.
- Provides an iterative method to increase inspection quality because performance is better year on year, which frees up resources that can be used to combine the “exploitation” of evidence and the “exploration” of new forms of fraud.
Finally, what determines the quality of practical results?
- 6.
- The quality of previous work of inspection done by customs offices because the training set used in the analysis contains the data previously selected and inspected by customs offices.
- 7.
- The quality of the practical results depends on the possibility of building a bridge between MOBADO results and the real-time rule-based transactional system performing risk analysis.
6. Conclusions
The use of machine learning techniques in the field of customs control from its origins [25] to present day [17] has had to overcome two type of difficulties: the adaptation of legacy rule-based systems and the need to fulfill the mission of customs, which must meet multiple objectives simultaneously, some of which are quantifiable and respond to measurable risks and others not.
This paper reports an original approach, setting out a hybrid method that is compatible with any artificial intelligence approach to optimize the inspection task at a customs office within a multi-attribute and multi-objective setting.
Author Contributions
Conceptualization, I.G.G. and A.M.C.; methodology, I.G.G. and A.M.C.; software, I.G.G.; validation, I.G.G. and A.M.C.; formal analysis, I.G.G. and A.M.C.; investigation, I.G.G.; resources, I.G.G.; data curation, I.G.G.; writing—original draft preparation, I.G.G.; writing—review and editing, I.G.G. and A.M.C.; visualization, I.G.G.; supervision, A.M.C.; project administration, A.M.C.; funding acquisition, A.M.C. All authors have read and agreed to the published version of the manuscript.
Funding
This research was supported by the Ministry of Economy and Competitiveness, project MTM2017- 86875-C3-3-R.
Institutional Review Board Statement
Not applicable.
Informed Consent Statement
Not applicable.
Data Availability Statement
Not applicable.
Conflicts of Interest
The authors declare no conflict of interest.
References
- European Commission. The European Union Explained: Customs. Available online: https://op.europa.eu/en/publication-detail/-/publication/98af8cf1-93fa-11ea-aac4-01aa75ed71a1/language-en (accessed on 22 April 2021).
- Vinogradova, I. Multi-Attribute Decision Making Methods as a Part of Mathematical Optimization. Mathematics 2019, 7, 915. [Google Scholar] [CrossRef]
- Mardani, A.; Jusoh, A.; Nor, K.; Khalifah, Z.; Zakwan, N.; Valipour, A. Multiple criteria decision-making techniques and their applications—A review of the literature from 2000 to 2014. Econ. Res. 2015, 28, 516–571. [Google Scholar] [CrossRef]
- Belton, V.; Stewart, T.J. Multiple Criteria Decision Analysis: An Integrated Approach; Kluwer: Alphen van den Rijn, The Netherlands, 2002. [Google Scholar]
- Hwang, C.L.; Yoon, K. Multiple Attribute Decision Making: Methods and Applications a State-of-the-Art Survey; Springer: Berlin/Heidelberg, Germany, 1981. [Google Scholar]
- Baesens, B.; Vlasselaer, V.; Verbeke, W. Fraud Analytics Using Descriptive Predictive and Social-Network Techniques; Wiley: Hoboken, NJ, USA, 2015. [Google Scholar]
- Vanhoeyveld, J.; Martens, D.; Peeters, B. Customs fraud detection: Assessing the value of behavioral and high-cardinality data under the imbalanced learning issue. Pattern Anal. Appl. 2020, 23, 1457–1477. [Google Scholar] [CrossRef]
- Canrakerta, A.; Hidayanto, A.N.; Ruldeviyani, Y. Application of Business Intelligence for Customs Declaration: A Case Study in Indonesia. J. Phys. Conf. Ser. 2020, 1444, 012028. [Google Scholar] [CrossRef]
- Desiderio, D. Data Analysis Techniques for Enhancing the Performance of Customs, Big Data and Government: How the Public Sector Leverages Data Insights Hortonworks. 2020. Available online: https://hortonworks.com/article/big-data-and-government-how-the-public-sector-leverages-data-insights/ (accessed on 22 April 2021).
- Filho, J.J.; Wainer, J. Using a hierarchical Bayesian model to handle high cardinality attributes with relevant interactions in a classification problem. In Proceedings of the 20th International Joint Conference on Artificial Intelligence IJCAI, Hyderabad, India, 6–12 January 2007; pp. 2504–2509. [Google Scholar]
- Biljan, J.; Trajkov, A. Risk management and Customs performance improvements: The case of the Republic of Macedonia. Procedia Soc. Behav. Sci. 2012, 44, 301–313. [Google Scholar] [CrossRef][Green Version]
- Geourjon, A.M.; Laporte, B.; Coundoul, O.; Gadiaga, M. Inspecting Less to Inspect Better: The Use of Data Mining for Risk Management by Customs Administrations Working Papers. Fondation Pour les Études et Recherches sur le Développement International. 2012. Available online: http://www.ferdi.fr/sites/www.ferdi.fr/files/publication/fichiers/P46-eng_WEB_0.pdf (accessed on 22 April 2021).
- Chermiti, B. Establishing risk and targeting profiles using data mining: Decision trees. World Customs J. 2019, 13, 39–58. [Google Scholar]
- Kavoya, J. Machine learning for intelligence- driven Customs management. Afr. Tax Cust. Rev. 2020, 3, 50–58. [Google Scholar]
- Laporte, B. Risk management systems: Using data mining in developing countries customs administrations. World Customs J. 2011, 5, 17–27. [Google Scholar]
- Regmi, R.H.; Timalsina, A.K. Risk Management in customs using Deep Neural Network. In Proceedings of the IEEE International Conference on Computing, Communication and Security, Kathmandu, Nepal, 25–27 October 2018; pp. 33–137. [Google Scholar]
- Kim, S.; Tsai, Y.C.; Singh, K.; Choi, Y.; Ibok, E.; Li, C.T.; Cha, M. DATE: Dual Attentive Tree-aware Embedding for Customs Fraud Detection. In Proceedings of the ACM SIGKDD International Conference on Knowledge Discovery and Data Mining (KDD), San Diego, CA, USA, 23–27 August 2020. [Google Scholar]
- New Zealand Customs Service. Available online: https://www.customs.govt.nz/about-us/about-customs/our-history/ (accessed on 22 April 2021).
- New Zealand Customs Service. Privacy by Design. Available online: https://www.customs.govt.nz/about-us/your-information/your-personal-information/privacy-by-design/ (accessed on 22 April 2021).
- Triepels, R.; Feeldeers, A.; Daniels, H. Uncovering Document Fraud in Maritime Freight Transport Based on Probabilistic Classification Computer information systems and industrial management, Lecture Notes in Computer Science; Springer: Berlin/Heidelberg, Germany, 2015; Volume 9339, pp. 282–293. [Google Scholar]
- Triepels, R.; Feeldeers, A.; Daniels, H. Data-driven fraud detection in international shipping. Expert Syst. Appl. 2018, 99, 193–202. [Google Scholar] [CrossRef]
- Tsois, A.; Lema, C.; Makridis, M.; Checchi, E. Using container status messages to improve targeting of high-risk cargo containers. In Proceedings of the Research Track at the 5th World Customs Organization Technology and Innovation Forum, Rotterdam, The Netherlands, 27 October 2015. [Google Scholar]
- Slowey, C. Data Analysis for Effective Border Management. The Canadian Experience. WCO News 2017, 82. Available online: https://mag.wcoomd.org/magazine/wco-news-82/data-analysis-for-effective-border-management-the-canadian-experience/ (accessed on 22 April 2021).
- Rigney, P. The All-Seeing Eye—An HMRC Success Story? Available online: https://www.ifa.org.uk/media/653935/Tax-HMRC-Connect-system.pdf (accessed on 22 April 2021).
- Jambeiro, J.; Wainer, J. A model for handling BN nodes with high cardinality parents. J. Mach. Learn. Res. 2008, 9, 2141–2170. [Google Scholar]
- Jambeiro, J. Artificial intelligence in the customs selection system through machine learning (SISAM). Receita Fed. Brasil 2015, 1, 1–49. [Google Scholar]
- Zhou, X. Data mining in customs risk detection with cost-sensitive classification. World Cust. J. 2019, 13, 115–130. [Google Scholar]
- Zhu, F.; Ma, Z.; Li, X.; Chen, G.; Chien, J.T.; Xue, J.H.; Guo, J. Image-text dual neural network with decision strategy for small-sample image classification. Neurocomputing 2019, 328, 182–188. [Google Scholar] [CrossRef]
- Castilla, M. Mejores Practicas y Futuro de las Aduanas Interamerican Development Bank. 1998. Available online: https://publications.iadb.org/publications/spanish/document/Mejores-prácticas-y-futuro-de-las-aduanas.pdf (accessed on 22 April 2021).
- Appeals, T.; Swimland, H. Rolling back the frontiers: The customs clearance revolution. Int. J. Logist. Manag. 1998, 9, 111–118. [Google Scholar] [CrossRef]
- Coelho, F. From “Red Tape” to “Red Carpet”: How the Brazilian AEO Programm Has Brought Customs Procedures to an Entire New Level; WCO News: Brussels, Belgium, 2019; Volume 88, Available online: https://mag.wcoomd.org/magazine/wco-news-88/brazil_aeo/ (accessed on 23 April 2021).
- Clark, S.E.; Benjamin, A.S.; Wixted, J.T.; Mickes, L.; Gronlund, S.D. Eyewitness Identification and the Accuracy of the Criminal Justice System. Policy Insights Behav. Brain Sci. 2015, 2, 175–186. [Google Scholar] [CrossRef]
- Stanislaw, H.; Todorov, N. Calculation of signal detection theory measures. Behav. Res. Methods Instrum. Comput. 1999, 31, 137–149. [Google Scholar] [CrossRef] [PubMed]
- Green, D.M.; Swets, J.A. Signal Detection Theory and Psychophysics; Wiley: New York, NY, USA, 1966. [Google Scholar]
- Swets, J.A. Signal Detection Theory and ROC Analysis in Psychology and Diagnostics: Collected Papers; Lawrence Erlbaum Associates: Mahwah, NJ, USA, 1996. [Google Scholar]
- Quing, H.; Zheng, G.; Fu, D. Risk Data Analysis of Cross Border E-commerce Transactions Based on Data Mining. J. Phys. Conf. Ser. 2011, 1744, 032014. [Google Scholar] [CrossRef]
- Ferguson, T.S. Who Solved the Secretary Problem? Stat. Sci. 1989, 4, 282–289. [Google Scholar] [CrossRef]
Publisher’s Note: MDPI stays neutral with regard to jurisdictional claims in published maps and institutional affiliations. |
© 2021 by the authors. Licensee MDPI, Basel, Switzerland. This article is an open access article distributed under the terms and conditions of the Creative Commons Attribution (CC BY) license (https://creativecommons.org/licenses/by/4.0/).