Abstract
In supervised learning, classifiers range from simpler, more interpretable and generally less accurate ones (e.g., CART, C4.5, J48) to more complex, less interpretable and more accurate ones (e.g., neural networks, SVM). In this tradeoff between interpretability and accuracy, we propose a new classifier based on association rules, that is to say, both easy to interpret and leading to relevant accuracy. To illustrate this proposal, its performance is compared to other widely used methods on six open access datasets.
1. Introduction
The problem of classification is crucial in many applications. For example, in handwritten digit recognition, a digitized image of the written digit (the input) is processed, and each character must be classified as one of the digits 0–9 (ten classes in all). In a SPAM filter, each message is processed and must be classified as SPAM or ham (not SPAM). The inputs are features of the messages (the frequency of some key words, of capital letters, etc.). In medicine, inputs such as blood indicators and patients’ other pieces of information can be used to decide if a disease is present or absent. The last two examples are instances of binary classification. In general, each classifier is a flexible model that learns from data, in its particular way, using a large database of observations for which the ground truth is known (the training set). Once the classifier is tuned up in order to have a small misclassification rate over the training set, it can be tested with new observations (new handwritten character images, new messages, new patients). It will assign to each observation the most plausible class (i.e., the most likely letter or number, whether it is SPAM or not, whether the patient suffers from the disease or not) and its accuracy can be tested against a test set [1].
Among the many existing classification methods, one can cite decision tree algorithms, support vector machines, Bayesian algorithms, rule-based algorithms, neural networks, distance based methods, genetic algorithms and associative classification [2].
Focusing on the rule-based algorithms, one can highlight the seminal work [3] and the papers [4,5,6,7], which lead to classification algorithms with good results. Those methods are based on the mining of rules by the well known Apriori algorithm [8], which has been improved since, and has been successfully applied to very large datasets, mining all the possible rules concerning frequent itemsets (sacrificing only small support rules). In the context of classification, class association rules are rules implying a particular category of the classification variable. In [3], the authors introduced the first serious classification based on association rules (CBA), by relating classification rules under a precedence order, so that the observations can be classified using, the strongest rules, and if not applicable, a default class, so that the misclassification rate is small [9,10]. The strength of the rules is measured by the confidence, as it estimates the probability of the class given the other features of the rule. Their results are successful with respect to the ROC curves, but they usually produce rather complex structures describing the classification process.
Another rule-based method with two main differences from the CBA strategy is proposed. First, only 2-length classifying rules are considered (and are combined for classification improvement). Then, a new quality measure is used, taking into account both the confidence of the rules and the statistical effect of the premises over the conclusions of the rules.
For this second aspect of the rules, the concept of implication intensity of Statistical Implicative Analysis (SIA) (see [11,12]) is used in this work. SIA is a data analysis method for both hierarchical clustering and association rules. It uses statistical independence (among the variables) as a baseline, to measure the similarity between variables (for the clustering task) and the quality of rules (for association rule task). SIA was initially developed in the field of Didactics of Mathematics [12], and is now being used in a wider range of data and domains [13,14,15,16,17].
In this work, it will be compared to other classification methods of widespread use in the literature (Naïve Bayes, radial basis neural networks, decision trees J48 and simple CART) with breast cancer open access datasets from UCI Machine Learning repository, namely Wisconsin Breast Cancer (WBC), Wisconsin Diagnosis Breast Cancer (WDBC) and Wisconsin Prognosis Breast Cancer (WPBC) [18], through the computation of the confusion matrices: accuracy, precision, sensitivity and specificity. These datasets have been used in order to test classifiers such as in [2,19,20,21,22,23]. In addition, the Haberman dataset has been used to test algorithms in [24]. The EEG Eye State Data Set (IDs_mapping) has been used in [25] for classification of eye state using k-Nearest Neighbors algorithm and multilayer perceptron neural networks models, and also used in [26], which proposes a novel EEG eye state identification approach based on Incremental Attribute Learning (IAL). The Cervical Cancer Behavior Risk Data Set (SOBAR) in [27] was also used in this study.
All the computations in this paper have been conducted by means of the R Statistical Software [28].
2. Methodology
The aim of this paper is to define an accurate and easy to interpret binary classifier, and to show that it is as competitive as other widely used and more complex classifiers. For that aim, a quality measure taken from the Statistical Implicative analysis, described in Section 2.1, was used. The rationale of the classifier is exposed in Section 2.2, and the criteria for comparing the performance of the competing algorithms are given in Section 2.4.
In Section 2.3, the open access datasets used for the test are introduced, and the results of the comparison are shown in Section 3. Finally results are discussed in Section 4.
2.1. A New Quality Measure of Association Rules
Association rules are endowed with several quality (or interestingness) measures. The most widely used ones are confidence, support, and lift, and they can be easily displayed when rules are mined through the Apriori algorithm [8], implemented in the popular arules R package [29].
There are several other quality measures, each one extracting a slightly different facet of the considered rule [30,31,32]. For the sake of good prediction rates, the confidence is the most important one, since it measures how likely the right-hand side (rhs) of the rule is observed for an individual who is seen to hold the left-hand side (lhs) of the rule.
For very large datasets, the computation is an issue, and the Apriori algorithm needs to sacrifice rules affecting a low proportion of the sample, in order to finish in a reasonable time. The support of a rule is the fraction of observations (relative frequency) holding both the lhs and rhs of the rule, and only rules exceeding a minimum support and a minimum confidence are mined.
The lift of a rule is the proportion between the confidence of the rule and the support of the rhs. It can be interpreted as the effect of the lhs over the rhs: when lift > 1, the lhs ‘raises’ the chances of observing the rhs, while a lift < 1 means that the lhs ‘reduces’ the chances of observing the rhs.
Lift and confidence are neither completely independent nor tightly related. One can have rules with a confidence such as (hence giving a good predictive ability), but a lift of only , meaning that the lhs reduces the initial chances of the rhs by 10%. Although the best prediction is the occurrence of the rhs, because of the confidence, the effect of the lhs should not be overlooked.
All the quality measures are descriptive, therefore subject to a natural variability under the sampling scheme that has led to our dataset. In order to measure the effect of the lhs over the rhs, one can use the statistical inference over the value of the lift of a rule in the whole population. To that aim, the implication intensity of [11] is used.
Definition 1.
Let a and b be two binary variables. The implication intensity of the rule is the probability that a lack of relationship between a and b produces more counter examples than the ones observed in the sample. Formally, , where stands for a random variable accounting for the number of counter examples observed in a random sampling, and stands for the number of observed counter examples in the current sample.
Depending on the random sampling scheme, the distribution of can be Binomial or Poisson, and a Gaussian approximation is feasible for large sample sizes [11]. Other probabilistic approaches to define the interestingness of rules can be seen in [33].
Example 1.

If binary variables a and b hold the joint distribution given in Table 1, the implication intensity of is . We can see A as the outcome of Bernoulli trials of parameter , and similarly for B, with parameter . Under statistical independence, we can see the observations of counterexamples () as Bernoulli trials of parameter . Assuming statistical independence between A and B, the observed number of counterexamples is exceeded with probability . Although the confidence of the rule is poor, , the lift is , showing how the fact that an itemset contains A () doubles the chances of that itemset containing B (). The implication intensity accounts for this extraordinary significant effect of A over B.
Table 1.
Joint frequency table of binary variables a and b of Example 1 illustrates the concepts of confidence, lift and implication intensity.
Remark 1.
The implication intensity coincides with the (complement to 1 of the) p-value of the statistical hypothesis test “ lift vs. lift ”, when using the test statistic , and the procedure “reject if ” for some c.
Bearing this in mind, the authors want to build a classifier based upon strong rules, showing a large confidence, but also significant rules. Moreover, the goal is to choose rules whose lhs shows a significant positive effect on the rhs (i.e., when the implication intensity is strong). Then, the notion of implifidence (a term formed by the contraction of implication and confidence) as a useful quality measure is used.
Definition 2
([34]). The implifidence of a rule is defined as
where , I and C denote, respectively, implifidence, implication intensity, and confidence, and the rule is the transposition of the mined rule .
The properties of with respect to the confidence and the intensity are studied in [34], where the authors show, under several conditions, their relationship.
2.2. The Proposed Approach
Usually, input variables are numerical or categorical data. In order to extract association rules, they are turned it into transactions. Numerical data can be binned into a small number of intervals (for example, variable has a range of data that can be split into intervals , , ). For each , one can define the binary variable , indicator of interval (i.e., reaching value 1 only for data whose variable belong to interval , and 0 elsewhere). The number of intervals for the numeric variables is the first parameter of our classifier.
The output binary classification variable Y is replaced by two other binary variables and , each one indicator of the corresponding class.
The notion of implifidence [34], introduced in the previous section as the quality measure that takes into account both the confidence (best for prediction) and a statistically significant effect of the lhs over the rhs, can be used. Every 2-length classifying rule (i.e., whose lhs is a binary input variable and whose rhs is either or ) can be mined. The implifidence threshold is the second parameter of the model, and it will filter the rules in order to keep only the significant ones.
Once the significant rules have been detected, the involved variables are said to be the significant variables for the classification process.
The more variables are used to define the classification process, the lower prediction error may be reached. In contrast, the more complex would be the resulting classification method, and less comprehensible for the practitioner. In order to get a trade-off, a third parameter has to be chosen, an odd number to group significant variables, and classify by majority voting.
The final group of significant variables shall be the one with the lowest sample prediction error, and it will conform to the final classification method.
To summarize, the process is the following:
- Transform every input variable into a set of binary variables , , (here one has one or more parameters, the number of intervals in which each numeric variable is categorized). The classification variable Y is doubled into the binary variables and .
- Mine all the 2-length classifying rules (whose lhs is a binary input variable and rhs is either or ). This choice allows us to mine all the rules without the sacrifice of a minimum support, even for large datasets, in a reasonable time.
- Choose a threshold (this is a new parameter in ) for implifidence, and filter the rules exceeding that implifidence. They can be called significant rules. Any original variable such that all its binary related variables (, , ) are the lhs of a significant rule, it can be called significant variable.
- Extract the subset of significant variables (in this step, variables with low effect on the classification variable Y are discarded).
- Make the table of 1-predictor classifications, using the significant rules, where each individual (row) is classified in accordance to each of the selected significant variables (column).
- Choose a low odd number m of ‘premises’ (another parameter). Rules will be built with at most m premises in order to classify data).
- For every combination of m significant variables:
- Classify each individual in the sample using the classifying rules involving the m variables, by majority voting among the outcomes of those rules.
- Compare classification with the true class.
- Assess the prediction of the m-tuple by the four measures of performance (accuracy, precision, sensitivity, specificity).
- Choose the m-tuple with best performance (accuracy by default, but any other can be chosen).
- Return final classifier that uses the m-tuple leading to the best performance.
For example, if a variable V has 3 categories a, b and c, one then considers the rules where each category implies the positive class (, and ), and the rules where each category implies the negative class (, and ). If for category a, both of its rules are not significant, it will not be possible to use this variable V to classify an individual for who . Then V is not a significant variable.
We have implemented the algorithm in a convenient R package for Linux, freely available in [35]. It contains the function SIAclassif(), that develops the algorithm, and returns the classifier, as well as the function predict.SIA(), which takes the object given by the previous function and applies it to new data, returning the predicted class of all the instances present in a new dataset.
In the Appendix A, one can find the text output of our algorithm, which explains to the user how the instances are classified according to their values in the significant variables.
2.3. Data Description
Our approach has been tested using six widely used datasets: Wisconsin Breast Cancer (WBC), Wisconsin Diagnosis Breast Cancer (WDBC), Wisconsin Prognosis Breast Cancer (WPBC), Haberman’s survival (Haberman), EEG Eye State Data Set (IDs_mapping) and Cervical Cancer Behavior Risk Data Set (SOBAR) [18].
The WBC dataset relates the malignancy of tumors (2 for benign, 4 for malignant) to 10 attributes like clump thickness, uniformity of cell size, uniformity of cell shape, marginal adhesion, single epithelial cell size, bare nuclei, bland chromatin, normal nucleoli, mitoses, and class. It has 683 records with a class distribution of 444 negative and 239 positive records.
The WDBC dataset relates the diagnosis (M = malignant, B = benign) to ten cell nuclei features, extracted by computer vision diagnostic system: radius, texture, perimeter, area, smoothness, compactness, concavity, concave points, symmetry and fractal dimension [36]. For each image, as it contains several cells, three values of each feature are kept: the mean value, the standard error, and the mean of the three largest values. In summary, there are 569 records with 30 input features, and a class distribution of 212 positive and 357 negative records.
In the WPBC dataset, the outcome (R = recurrent, N = non-recurrent) is related to time (recurrence time, for recurrent, and disease-free time, for non-recurrent), as well as to features such as in the WDBC dataset, and tumor size and lymph node status. In summary, there are 194 records on 30 input features with 46 positive and 148 negative records.
The Haberman dataset reflects a study on the survival of patients who had undergone surgery for breast cancer. It contains 306 instances and 3 attributes (the age of patient at the time of operation, the year the patient underwent surgery and the number of positive auxiliary nodes detected) as well as the survival status class (1 = the patient survived 5 years or longer, and 2 = the patient died within 5 years). It gives 81 positive and 225 negative records.
EEG Eye State classification is important and useful to detect humans’ cognition state. The dataset includes 14 continuous EEG measurements. The eye state was detected via a camera during the EEG measurement and added later manually to the file after analyzing the video frames. A ‘1’ indicates the eye-closed and ‘0’ the eye-open state, with an amount of 6723 positive and 8257 negative records.
The Cervical Cancer Behavior Risk Data Set contains 18 explanatory attributes regarding ca cervix (1 = has cervical cancer, 0 = no cervical cancer) in 72 instances, with 21 positive and 51 negative records [37].
2.4. Classifier Comparison Criteria
To evaluate our approach, we have compared our results to those of the different classifiers (J48, Naive Bayes, svmRadial, CART and K-nearest neighbors). All machine learning algorithms used for the comparison in this paper were conducted using RWeka [38]. The RWeka package provides a collection of functions that give R access to the machine learning algorithms in the Java-based Weka software package [39].
The level of effectiveness of the classification model is calculated with the number of correct and incorrect classification in each possible value of the variable being classified in the confusion matrix [1,40].
The entries in the confusion matrix have the following meaning in the context of our study: TP is the number of true positives (the number of correct predictions that an instance is positive), TN is the number of true negatives (the number of correct predictions that an instance is negative), FP is the number of false positives (the number of incorrect predictions that an instance is positive) and FN is the number of false negatives (the number of incorrect predictions that an instance is negative).
The accuracy is the proportion of the total number of predictions that were correct (). The precision is the measure of accuracy provided that a specific class has been predicted (). The sensitivity is the measure of the ability of a prediction model to select instances of a certain class from a data set (). The specificity corresponds to the true negative rate, which is commonly used in two class problems () [20,22].
3. Results
As stated in Section 2.4, the decision was made to use 5-fold cross-validation. The datasets were randomly divided into five groups. Fixing one of such groups, all methods were fitted to all the instances in the other groups. Then, all fitted methods were asked to classify the instances in the fixed group, from which the confusion matrix and the four performance criteria were computed. Repeating the process for each of the five groups and averaging the obtained values, the results shown in Table 2 and represented for ease of interpretation in Figure 1 are obtained. These results are discussed in Section 4.
Table 2.
Classification results for the ML methods applied to each dataset. Values are obtained by averaging under 5-fold cross validation. NA values arise when some class may not appear in the training/test set, and the performance criteria involve the fraction 0/0 for some of the classifiers.
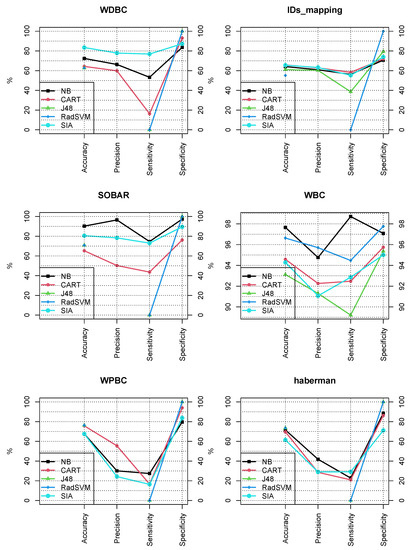
Figure 1.
Comparison of the performance of the compared methods in the six open access datasets. Values are obtained through 5-fold cross validation. Our approach (SIA) proves to be competitive and its added value is the simple interpretability (see Appendix A).
When the classes are unbalanced, some classes may not appear in some training/test sets, and it leads to undefined values of the performance criteria (because of the fractions ).
The classifier has been implemented in an R package, and it can be freely downloaded from [35] and used as follows under Linux:
- Place the Clasif.zip file in a local folder (that we denote as path_to_file)
- Run install.packages(path_to_file, repos = NULL, type="source") in the R Console. The package will be installed from source.
- Run library(Classif) in the R Console
- Run Classif() in the R Console. It provides a comfortable windows interface where the user can pick the dataset file and select the number of votes without writing code. Its output is the comparison among the classifiers that we show in Table 2. The object rules (that the user can print just typing rules in the R Console) contains the classifying rules and the accuracy for each possible number of votes.
- Internally, the function SIAclassif() is the one that performs all the steps of our algorithm, according to the implifidence threshold and the maximum number of votes. It computes the implifidence of all the rules, it selects the significant variables, and it computes all the combinations of groups of significant variables and the resulting classification for each one, taking the one which maximizes the accuracy (by default, or any other criterion specified by the user). It prints a sentence explaining the rule for classification. As an example, the result for the WBC dataset is shown in Appendix A.
- The function predict.SIA() requires, as a first argument, the object returned by the function SIAclassif(), and as a second argument, a data frame with the new instances, in order to apply the classification and produce the predicted output.
4. Conclusions
We have proposed a machine learning algorithm for classification based on association rules, using a rather novel quality measure, the implifidence (see Section 2.1), and a majority vote among a set of significant rules.
Our approach has been tested using six well known open access datasets, and its results have been compared with four other well established algorithms for classification (Naive Bayes, Radial basis neural networks, Decision trees J48 and simple CART), using 5-fold cross-validation in order to keep away from overfitting.
As can be seen in Figure 1, our proposal gets a top or second position among the five classifiers in four of the six datasets, with regard to accuracy, precision and sensitivity. Our model is ranked top or second in only two of the datasets regarding specificity.
The worthiest benefit of our approach is the simplicity of interpretation of the classification rule (see Appendix A for an example), since the classification is directly related to the observed variables.
One can consider that, in the trade-off between accuracy and interpretability of the model, our proposal overcomes all the other tested methods. Even if J48 and CART are also interpretable, their trees are usually more complex than the rules we get with our method.
In this study, the default parameters for all the classifiers have been kept. The effect of choosing different parameters in every model will be analysed in detail in a forthcoming research.
Author Contributions
All authors have contributed equally to all the steps of this piece of research, from conceptualization to review and editing. All authors have read and agreed to the published version of the manuscript.
Funding
This work was partially supported by the EIPHI Graduate School (contract ANR-17-EURE-0002).
Institutional Review Board Statement
Not applicable.
Informed Consent Statement
Not applicable.
Data Availability Statement
The data presented in this study are openly available in UCI Machine Learning Repository at http://archive.ics.uci.edu/ml.
Conflicts of Interest
The authors declare no conflict of interest.
Appendix A
As an example for practitioners, we show below the output of our classifier, the function SIAclassif(), stored in an object called rules, for the WBC dataset, using up to 7 significant variables. Output classes are “malignant” and “benign”, while input features are V1, V2, …, V8 and V9.
- If the user wants to use only one variable, the best classification is done by checking V2, which predicts the class “malignant” for an individual whenever it takes one of the values 10, 3, 4, 5, 6, 7, 8 or 9. The accuracy of this classifier is .
- If the user accepts to use up to three variables, the best classification reaches an accuracy of by checking the variables V8, V3 and V6. The rule forecasts the class “malignant” for a record, if at least two of the variables V8, V3 and V6 take one of their listed values (see component [[2]] below).
- In general, the user decides on a particular classifier according to the importance given to the accuracy, as well as to the simplicity of the rule. In any case, the interpretation of the classification of our approach is easy, contrary to other classifiers, because the practitioner only needs to check the values of a few of the original variables in order to decide the output class.
The user can choose to maximize other criteria such as precision, sensitivity, specificity, or any linear combination of all the four measures. If the user types rules in the R Console, the output is the following:
- [1] "rules"[[1]][1] "Classify as ’malignant’ iff at least 1 of the following variables hold: V2={10,3,4,5,6,7,8,9}; . The ’accuracy’ is 0.926793557833089."
- [[2]][1] "Classify as ’malignant’ iff at least 2 of the following variables hold: V8={10,3,4,5,6,7,8,9}; V3={10,3,4,5,6,7,8,9}; V6={10,3,4,5,6,7,8,9}; . The ’accuracy’ is 0.961932650073206."
- [[3]][1] "Classify as ’malignant’ iff at least 2 of the following variables hold: V7={10,4,5,6,7,8,9}; V3={10,3,4,5,6,7,8,9}; V6={10,3,4,5,6,7,8,9}; . The ’accuracy’ is 0.961932650073206."
- [[4]][1] "Classify as ’malignant’ iff at least 3 of the following variables hold: V8={10,3,4,5,6,7,8,9}; V7={10,4,5,6,7,8,9}; V3={10,3,4,5,6,7,8,9}; V6={10,3,4,5,6,7,8,9}; V1={10,6,7,8,9}; . The ’accuracy’ is 0.972181551976574."
- [[5]][1] "Classify as ’malignant’ iff at least 3 of the following variables hold: V7={10,4,5,6,7,8,9}; V5={10,3,4,5,6,7,8,9}; V2={10,3,4,5,6,7,8,9}; V6={10,3,4,5,6,7,8,9}; V1={10,6,7,8,9}; . The ’accuracy’ is 0.972181551976574."
- [[6]][1] "Classify as ’malignant’ iff at least 3 of the following variables hold: V7={10,4,5,6,7,8,9}; V5={10,3,4,5,6,7,8,9}; V3={10,3,4,5,6,7,8,9}; V6={10,3,4,5,6,7,8,9}; V1={10,6,7,8,9}; . The ’accuracy’ is 0.972181551976574."
- [[7]][1] "Classify as ’malignant’ iff at least 3 of the following variables hold: V7={10,4,5,6,7,8,9}; V2={10,3,4,5,6,7,8,9}; V3={10,3,4,5,6,7,8,9}; V6={10,3,4,5,6,7,8,9}; V1={10,6,7,8,9}; . The ’accuracy’ is 0.972181551976574."
- [[8]][1] "Classify as ’malignant’ iff at least 4 of the following variables hold: V8={10,3,4,5,6,7,8,9}; V7={10,4,5,6,7,8,9}; V5={10,3,4,5,6,7,8,9}; V2={10,3,4,5,6,7,8,9}; V3={10,3,4,5,6,7,8,9}; V6={10,3,4,5,6,7,8,9}; V1={10,6,7,8,9}; . The ’accuracy’ is 0.97510980966325."
- [[9]][1] "Classify as ’malignant’ iff at least 4 of the following variables hold: V8={10,3,4,5,6,7,8,9}; V7={10,4,5,6,7,8,9}; V5={10,3,4,5,6,7,8,9}; V3={10,3,4,5,6,7,8,9}; V6={10,3,4,5,6,7,8,9}; V1={10,6,7,8,9}; V4={10,2,3,4,5,6,7,8,9}; . The ’accuracy’ is 0.97510980966325."
References
- Han, J.; Kamber, M.; Pei, J. Data Mining: Concepts and Techniques, 3rd ed.; Morgan Kaufmann: San Mateo, CA, USA, 2011. [Google Scholar]
- Mitchell, T. Machine Learning; McGraw Hill: New York, NY, USA, 1997. [Google Scholar]
- Liu, B.; Hsu, W.; Ma, Y. Integrating classification and association rule mining. In Proceedings of the 4th International Conference on Knowledge Discovery and Data Mining, New York, NY, USA, 27–31 August 1998; pp. 80–86. [Google Scholar]
- Yin, X.; Han, J. CPAR: Classification based on predictive association rules. In Proceedings of the SIAM International Conference on Data Mining (SDM’03), San Francisco, CA, USA, 1–3 May 2003; pp. 331–335. [Google Scholar]
- Li, W.; Han, J.; Pei, J. CMAR: Accurate and efficient classification based on multiple class-association rules. In Proceedings of the 1st IEEE International Conference on Data Mining, San Jose, CA, USA, 29 November–2 December 2001; pp. 369–376. [Google Scholar]
- Thabtah, F.; Cowling, P.; Peng, Y. MMAC: A new multi-class, multi-label associative classification approach. In Proceedings of the 4th IEEE International Conference on Data Mining, Brighton, UK, 1–4 November 2004; pp. 217–224. [Google Scholar]
- Vo, B.; Le, B. A novel classification algorithm based on association rule mining. In Proceedings of the 2008 Pacific Rim Knowledge Acquisition Workshop (Held with PRICAI’08), LNAI 5465, Ha Noi, Vietnam, 15–19 December 2008; pp. 61–75. [Google Scholar]
- Agrawal, R.; Srikant, R. Fast Algorithms for Mining Association Rules in Large Databases. In Proceedings of the 20th International Conference on Very Large Data Bases, VLDB ’94, Santiago, Chile, 12–15 September 1994; Morgan Kaufmann Publishers Inc.: San Francisco, CA, USA, 1994; pp. 487–499. [Google Scholar]
- Abdelhamid, N.; Ayesh, A.; Hadi, W. Multi-label rules algorithm based association. Parallel Process Lett. 2014. [Google Scholar] [CrossRef]
- Abdelhamid, N.; Ayesh, A.; Thabtah, F. Emerging trends in associative classification data mining. Int. J. Electron. Electr. Eng. 2015, 3, 50–53. [Google Scholar] [CrossRef][Green Version]
- Gras, R.; Suzuki, E.; Guillet, F.; Spagnolo, F. (Eds.) Statistical Implicative Analysis, Theory and Applications; Studies in Computational Intelligence; Springer: Berlin/Heidelberg, Germany, 2008; Volume 127. [Google Scholar]
- Gras, R. Contribution à l’Étude Expérimentale et à l’Analyse de Certaines Acquisitions Cognitives et de Certains Objectifs en Didactique des Mathématiques. Ph.D. Dissertation, Université de Rennes 1, Rennes, France, 1979. [Google Scholar]
- Croset, M.; Trgalova, J.; Croset, J. Student’s Algebraic Knowledge Modelling: Algebraic Context as Cause of Student’s Actions. In Statistical Implicative Analysis; Gras, R., Suzuki, E., Guillet, F., Spagnolo, F., Eds.; Studies in Computational Intelligence; Springer: Berlin/Heidelberg, Germany, 2008; Volume 127. [Google Scholar]
- Kuzniak, A. Personal Geometrical Working Space: A Didactic and Statistical Approach. In Statistical Implicative Analysis; Gras, R., Suzuki, E., Guillet, F., Spagnolo, F., Eds.; Studies in Computational Intelligence; Springer: Berlin/Heidelberg, Germany, 2008; Volume 127. [Google Scholar]
- Ramstein, G. Statistical Implicative Analysis of DNA microarrays. In Statistical Implicative Analysis; Studies in Computational Intelligence; Gras, R., Suzuki, E., Guillet, F., Spagnolo, F., Eds.; Springer: Berlin/Heidelberg, Germany, 2008; Volume 127. [Google Scholar]
- David, J.; Guillet, F.; Briand, H.; Gras, R. On the use of Implication Intensity for matching ontologies and textual taxonomies. In Statistical Implicative Analysis; Gras, R., Suzuki, E., Guillet, F., Spagnolo, F., Eds.; Studies in Computational Intelligence; Springer: Berlin/Heidelberg, Germany, 2008; Volume 127. [Google Scholar]
- Huynh, H.; Phan, N.; Duong-Trung, N.; Nguyen, H. Collaborative Filtering Recommendation Based on Statistical Implicative Analysis. Commun. Comput. Inf. Sci. 2020, 1287, 224–235. [Google Scholar] [CrossRef]
- Dua, D.; Graff, C. UCI Machine Learning Repository; School of Information and Computer Sciences, University of California: Irvine, CA, USA, 2019; Available online: https://archive.ics.uci.edu (accessed on 1 January 2021).
- Inan, O.; Uzer, M.S.; Yılmaz, N. A new hybrid feature selection method based on association rules and pca for detection of breast cancer. Int. J. Innov. Comput. Inf. Control 2012, 9, 727–739. [Google Scholar]
- Rajagopalan, G.S.; Abdelhalim, M.; Zeid, M. Breast Cancer Diagnosis on Three Different Datasets Using Multi-Classifiers. Int. J. Comput. Inf. Technol. 2012, 1, 36–43. [Google Scholar]
- Ibrahim, A.; Hashad, I.; Shawky, N.; Maher, A. Robust Breast Cancer Diagnosis on Four Different Datasets Using Multi-Classifiers Fusion. Int. J. Eng. Res. Technol. (IJERT) 2015, 4, 114–118. [Google Scholar]
- Aruna, S.; Rajagopalan, S.; Nandakishore, L. Knowledge Based Analysis of Various Statistical Tools in Detecting Breast Cancer. In Proceedings of First International Conference on Computer Science, Engineering and Applications (CCSEA 2011); Wyld, D.C., Wozniak, M., Eds.; AIRCC Publishing Corporation: Chennai, India, 2011; Volume 1, pp. 37–45. [Google Scholar]
- Orr, M. Radial Basis Function Networks; Technical Report; Edinburgh University: Edinburgh, UK, 1996. [Google Scholar]
- Srimani, P.; Koti, M.S. Medical Diagnosis Using Ensemble Classifiers—A Novel Machine-Learning Approach. J. Adv. Comput. 2013, 2, 9–27. [Google Scholar] [CrossRef]
- Sabanci, K.; Koklu, M. The classification of eye state by using KNN and mlp classification models according to the EEG signals. Intell. Syst. Appl. Eng. 2015, 3, 127–130. [Google Scholar] [CrossRef]
- Wang, T.; Guan, S.; Man, K.; Ting, T. Time Series Classification for EEG Eye State Identification Based on Incremental Attribute Learning. In Proceedings of the 2014 International Symposium on Computer, Consumer and Control, Taichung, Taiwan, 10–12 June 2014. [Google Scholar] [CrossRef]
- Fang, H.; Shi, C.; Chen, C.H. BioExpDNN: Bioinformatic Explainable Deep Neural Network. In Proceedings of the 2020 IEEE International Conference on Bioinformatics and Biomedicine (BIBM), Seoul, Korea, 16–19 December 2020; pp. 2461–2467. [Google Scholar] [CrossRef]
- R Core Team. R: A Language and Environment for Statistical Computing; R Foundation for Statistical Computing: Vienna, Austria, 2019. [Google Scholar]
- Hahsler, M.; Chelluboina, S.; Hornik, K.; Buchta, C. The arules R-Package Ecosystem: Analyzing Interesting Patterns from Large Transaction Datasets. J. Mach. Learn. Res. 2011, 12, 1977–1981. [Google Scholar]
- Vaillant, B.; Lallich, S.; Lenca, P. On the Behavior of the Generalizations of the Intensity of Implication: A Data-Driven Comparative Study. In Statistical Implicative Analysis; Gras, R., Suzuki, E., Guillet, F., Spagnolo, F., Eds.; Studies in Computational Intelligence; Springer: Berlin/Heidelberg, Germany, 2008; Volume 127, pp. 421–447. [Google Scholar]
- Lallich, S.; Vaillant, B.; Lenca, P. A probabilistic framework towards the parameterization of association rule interestingness measures. Methodol. Comput. Appl. Probab. 2007, 9, 447–463. [Google Scholar] [CrossRef]
- Lallich, S.; Lenca, P.; Vaillant, B. Variations autour de l’intensité d’implication. In Proceedings of the Third International Conference A.S.I. Implicative Statistic Analysis, Palermo, Italy, 6–8 October 2005. [Google Scholar]
- Armand, A.; Totohasina, A.; Feno, D. An extension of Totohasina’s normalization theory of quality measures of association rules. Int. J. Math. Math. Sci. 2019, 2019. [Google Scholar] [CrossRef]
- Gras, R.; Couturier, R.; Gregori, P. An arranged mariage between Implication and Confidence. In Analyse Statistique Implicative. Des Sciences dures aux Sciences Humaines et Solciales, Proceedings of the VIII International Conference SIA Statistical Implicative Analysis, Radès, Tunisia, 11–14 November 2015; Regnier, J.C., Slimani, Y., Gras, R., ARSA Association, Eds.; Bibliothèque National de Tunisie: Tunisia, Tunisia, 2015; pp. 47–68. [Google Scholar]
- Ghanem, S. An R Package for SIA Binary Classification. 2021. Available online: https://github.com/souhilabsl/SIAclassification (accessed on 30 January 2021.).
- Nick Street, W.; Wolberg, W.; Mangasarian, O. Nuclear feature extraction for breast tumor diagnosis. In Proceedings of the SPIE—The International Society for Optical Engineering, San Diego, CA, USA, 11–16 July 1993; Volume 1905, pp. 861–870. [Google Scholar] [CrossRef]
- Sobar; Machmud, R.; Wijaya, A. Behavior determinant based cervical cancer early detection with machine learning algorithm. Adv. Sci. Lett. 2016, 22, 3120–3123. [Google Scholar] [CrossRef]
- Hornik, K.; Buchta, C.; Zeileis, A. Open-Source Machine Learning: R Meets Weka. Comput. Stat. 2009, 24, 225–232. [Google Scholar] [CrossRef]
- Witten, I.; Frank, E. Data Mining: Practical Machine Learning Tools and Techniques, 2nd ed.; Morgan Kaufmann: San Francisco, CA, USA, 2005. [Google Scholar]
- Altman, D.; Bland, J. Statistics Notes: Diagnostic tests 1: Sensitivity and specificity. BMJ 1994, 308, 1552. Available online: https://www.bmj.com/content/308/6943/1552.full.pdf (accessed on 20 January 2021). [CrossRef] [PubMed]
Publisher’s Note: MDPI stays neutral with regard to jurisdictional claims in published maps and institutional affiliations. |
© 2021 by the authors. Licensee MDPI, Basel, Switzerland. This article is an open access article distributed under the terms and conditions of the Creative Commons Attribution (CC BY) license (https://creativecommons.org/licenses/by/4.0/).