
Q or R Factor Analysis for Subjectiveness Measurement in Consumer Behavior? A Study Case on Durable Goods Buying Behavior in Romania


Abstract
1. Introduction and Short Literature Review (Q Factor Analysis)
- A total of 42% of Romanian households bought durable goods with loans, based on Romanian government politics to increase the household’s endowment and to accept loans only with identity cards.
- Only 9% of households made acquisitions for increasing the family, with the majority having a Veblenian behavior.
- A significant percentage (34%) still trusts Romanian brands (e.g., Arctic), but 54% prefer foreigner brands.
- Half of the households (48.3%) will buy durable goods in the near future.
- Romanian households manage to buy goods but with restrictions in other areas; this means a low level of purchasing power.
- The price is the most important criterion when buying durable goods.
- A total of 25% of households have second-hand durable goods.
2. Materials and Methods
- Xi—variable i from a model and standardized,
- Aij—a standardized multiple regression coefficient of the variable i for common factor j (known as factor loading),
- Fj—a common factor (known as factor score),
- Vi—a standardized multiple regression coefficient of the variable i for unique factor i, and
- n—number of common factors.
- zi = the Z score of the statement,
- c = the category, and
- nc = the number of the statements from category c.
- rxx = fidelity coefficient and
- p = the number of subjects which define that factor.
- SEx = standard error of the factorial scores for factor X and
- σx = standard deviation of forced distribution imposed in the structure of the Q-sort.
3. Results
3.1. Results for Q Factor Analysis (Q Methodology)
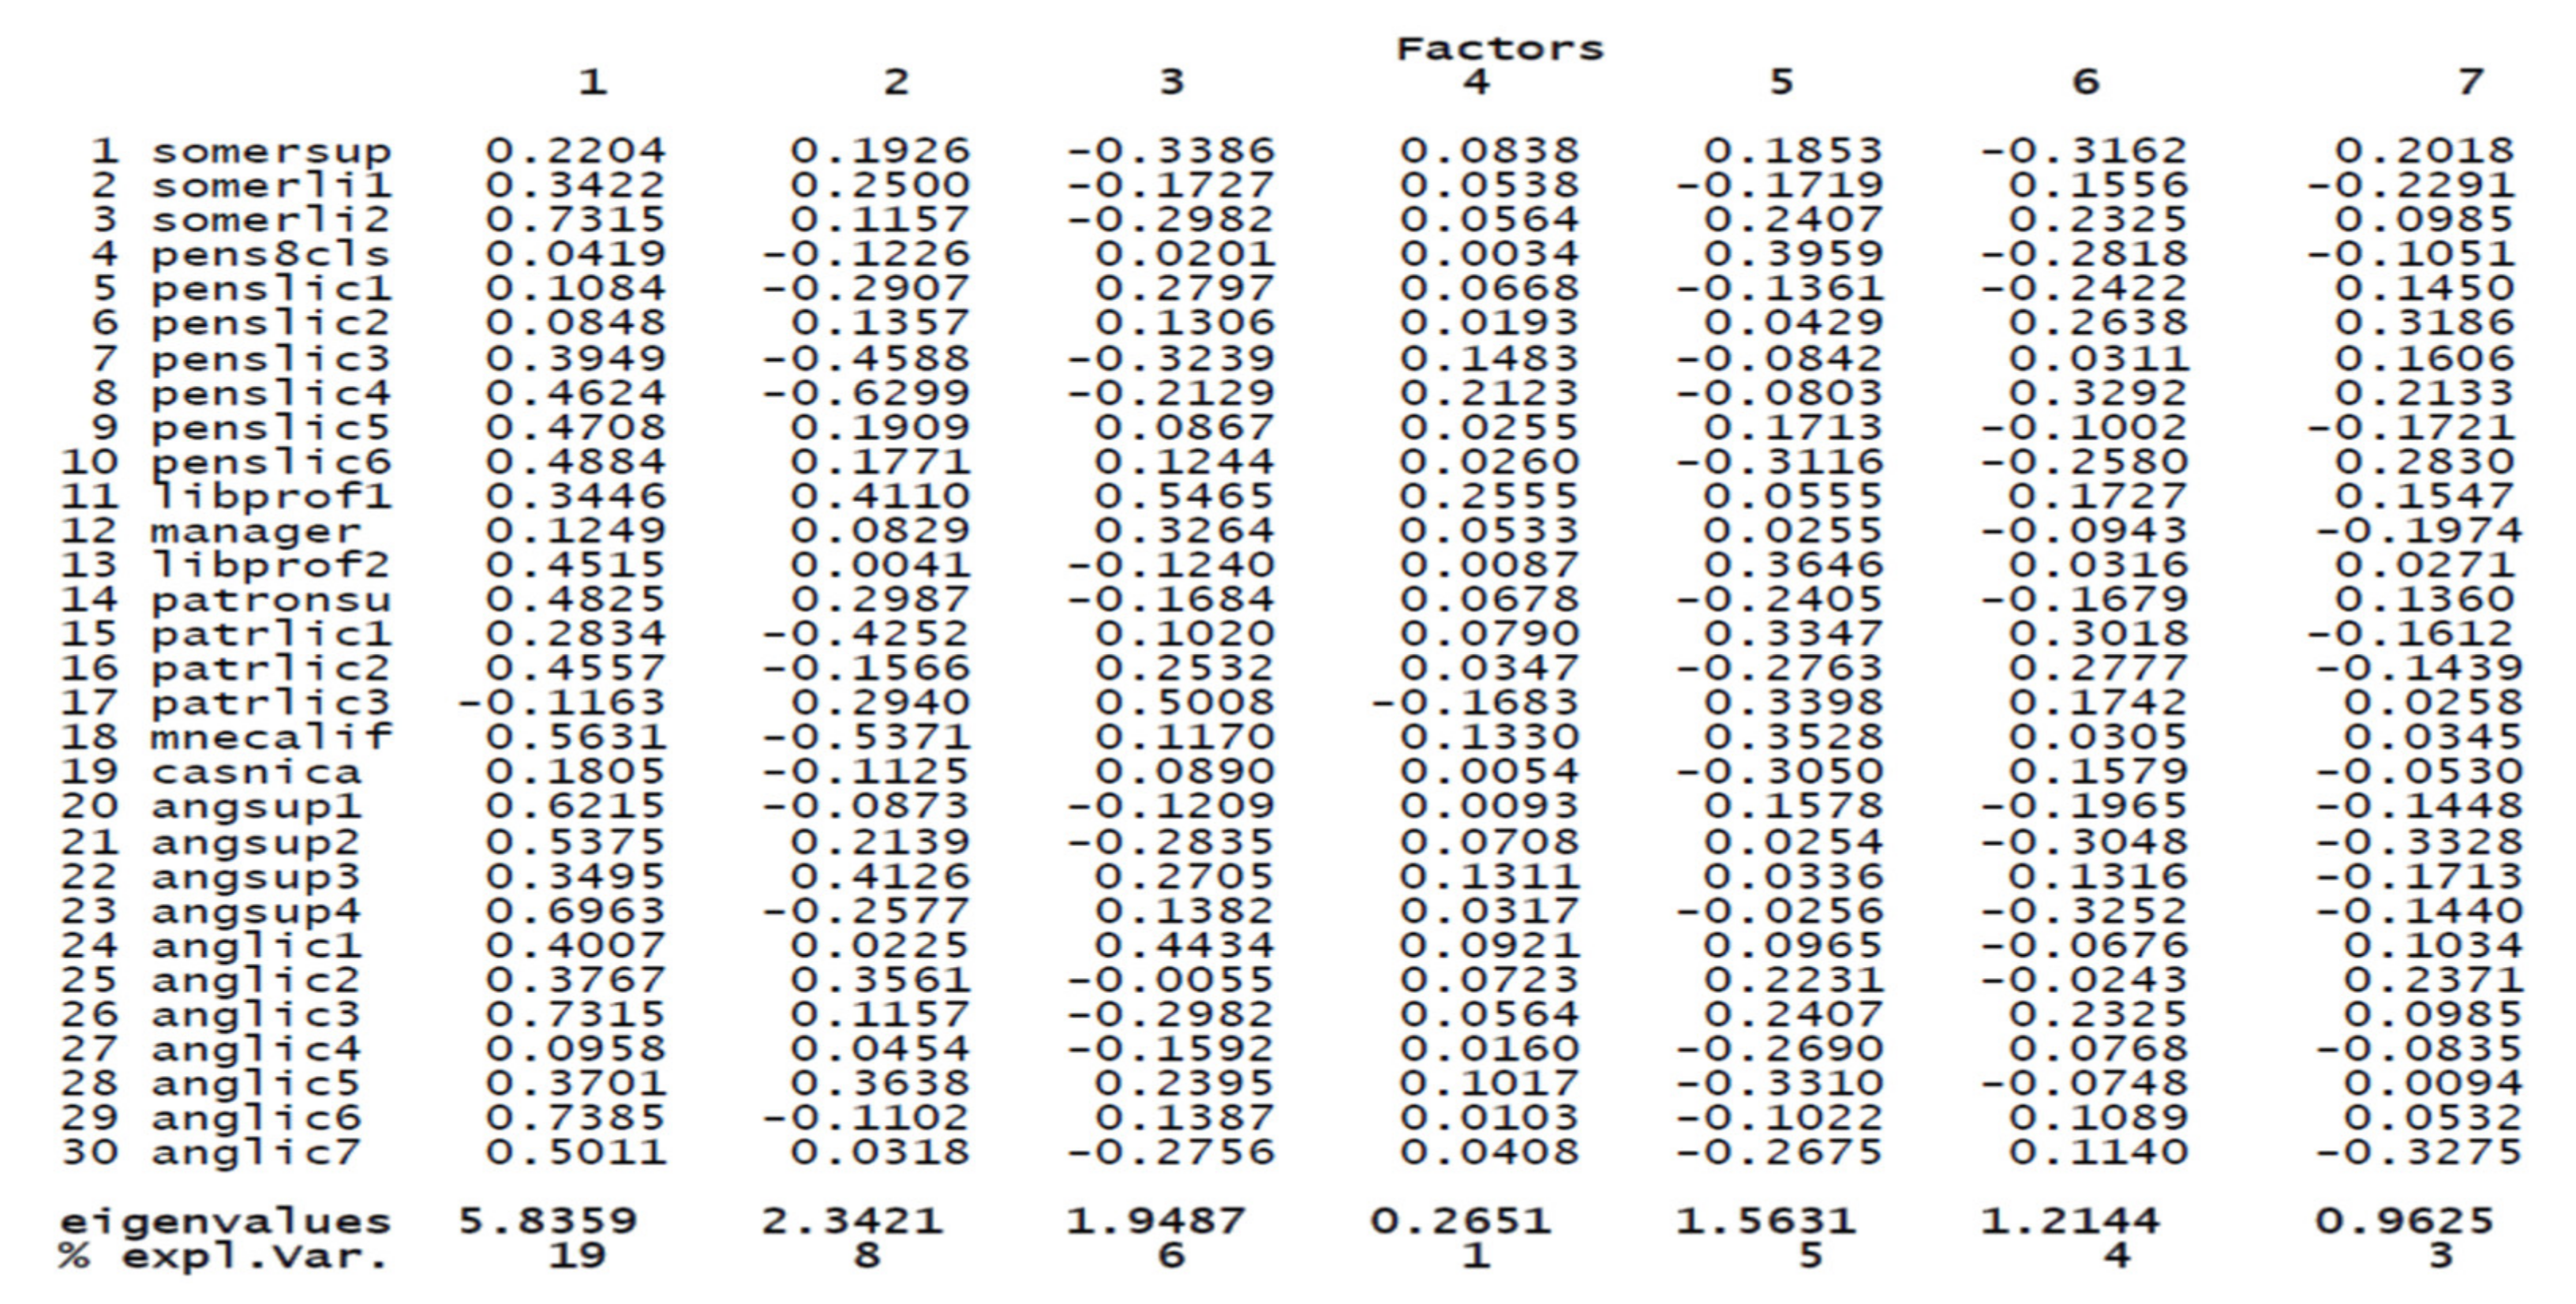
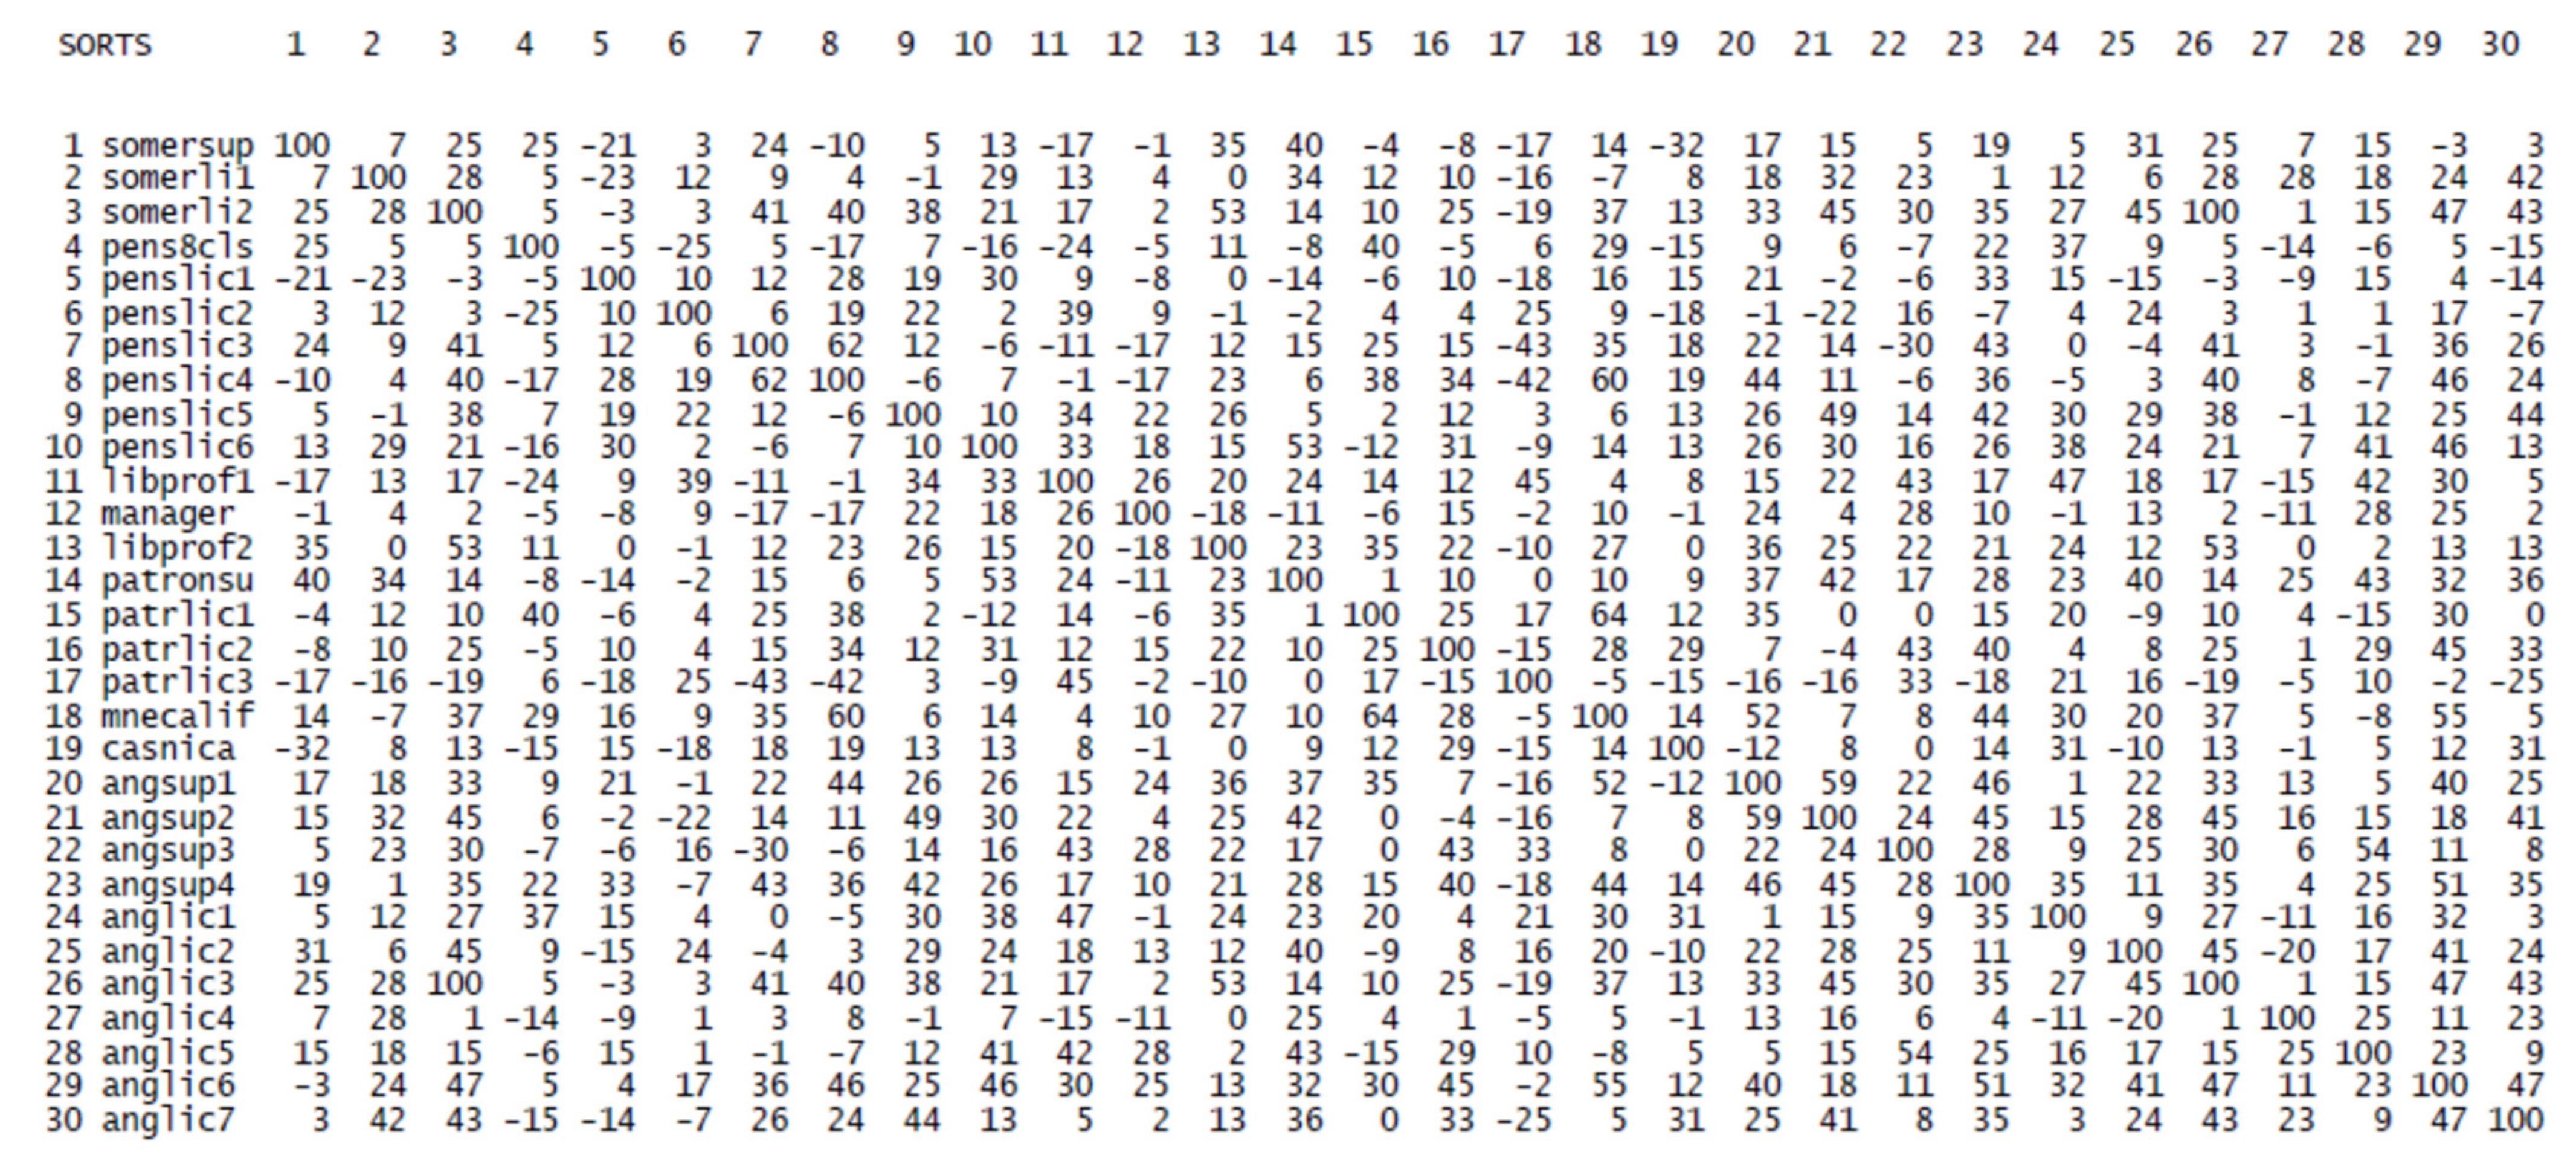
- Preponderant negative correlations, which mean opposite perceptions, subjectiveness, and opinions in the P-sample between, for example, subjects 5—a retired person with secondary education—and 17—a business owner with secondary education;
- Preponderant positive correlations, with, for example, all seven employees with secondary education having similar opinions for the rest of the P-sample; and medium positive correlations.
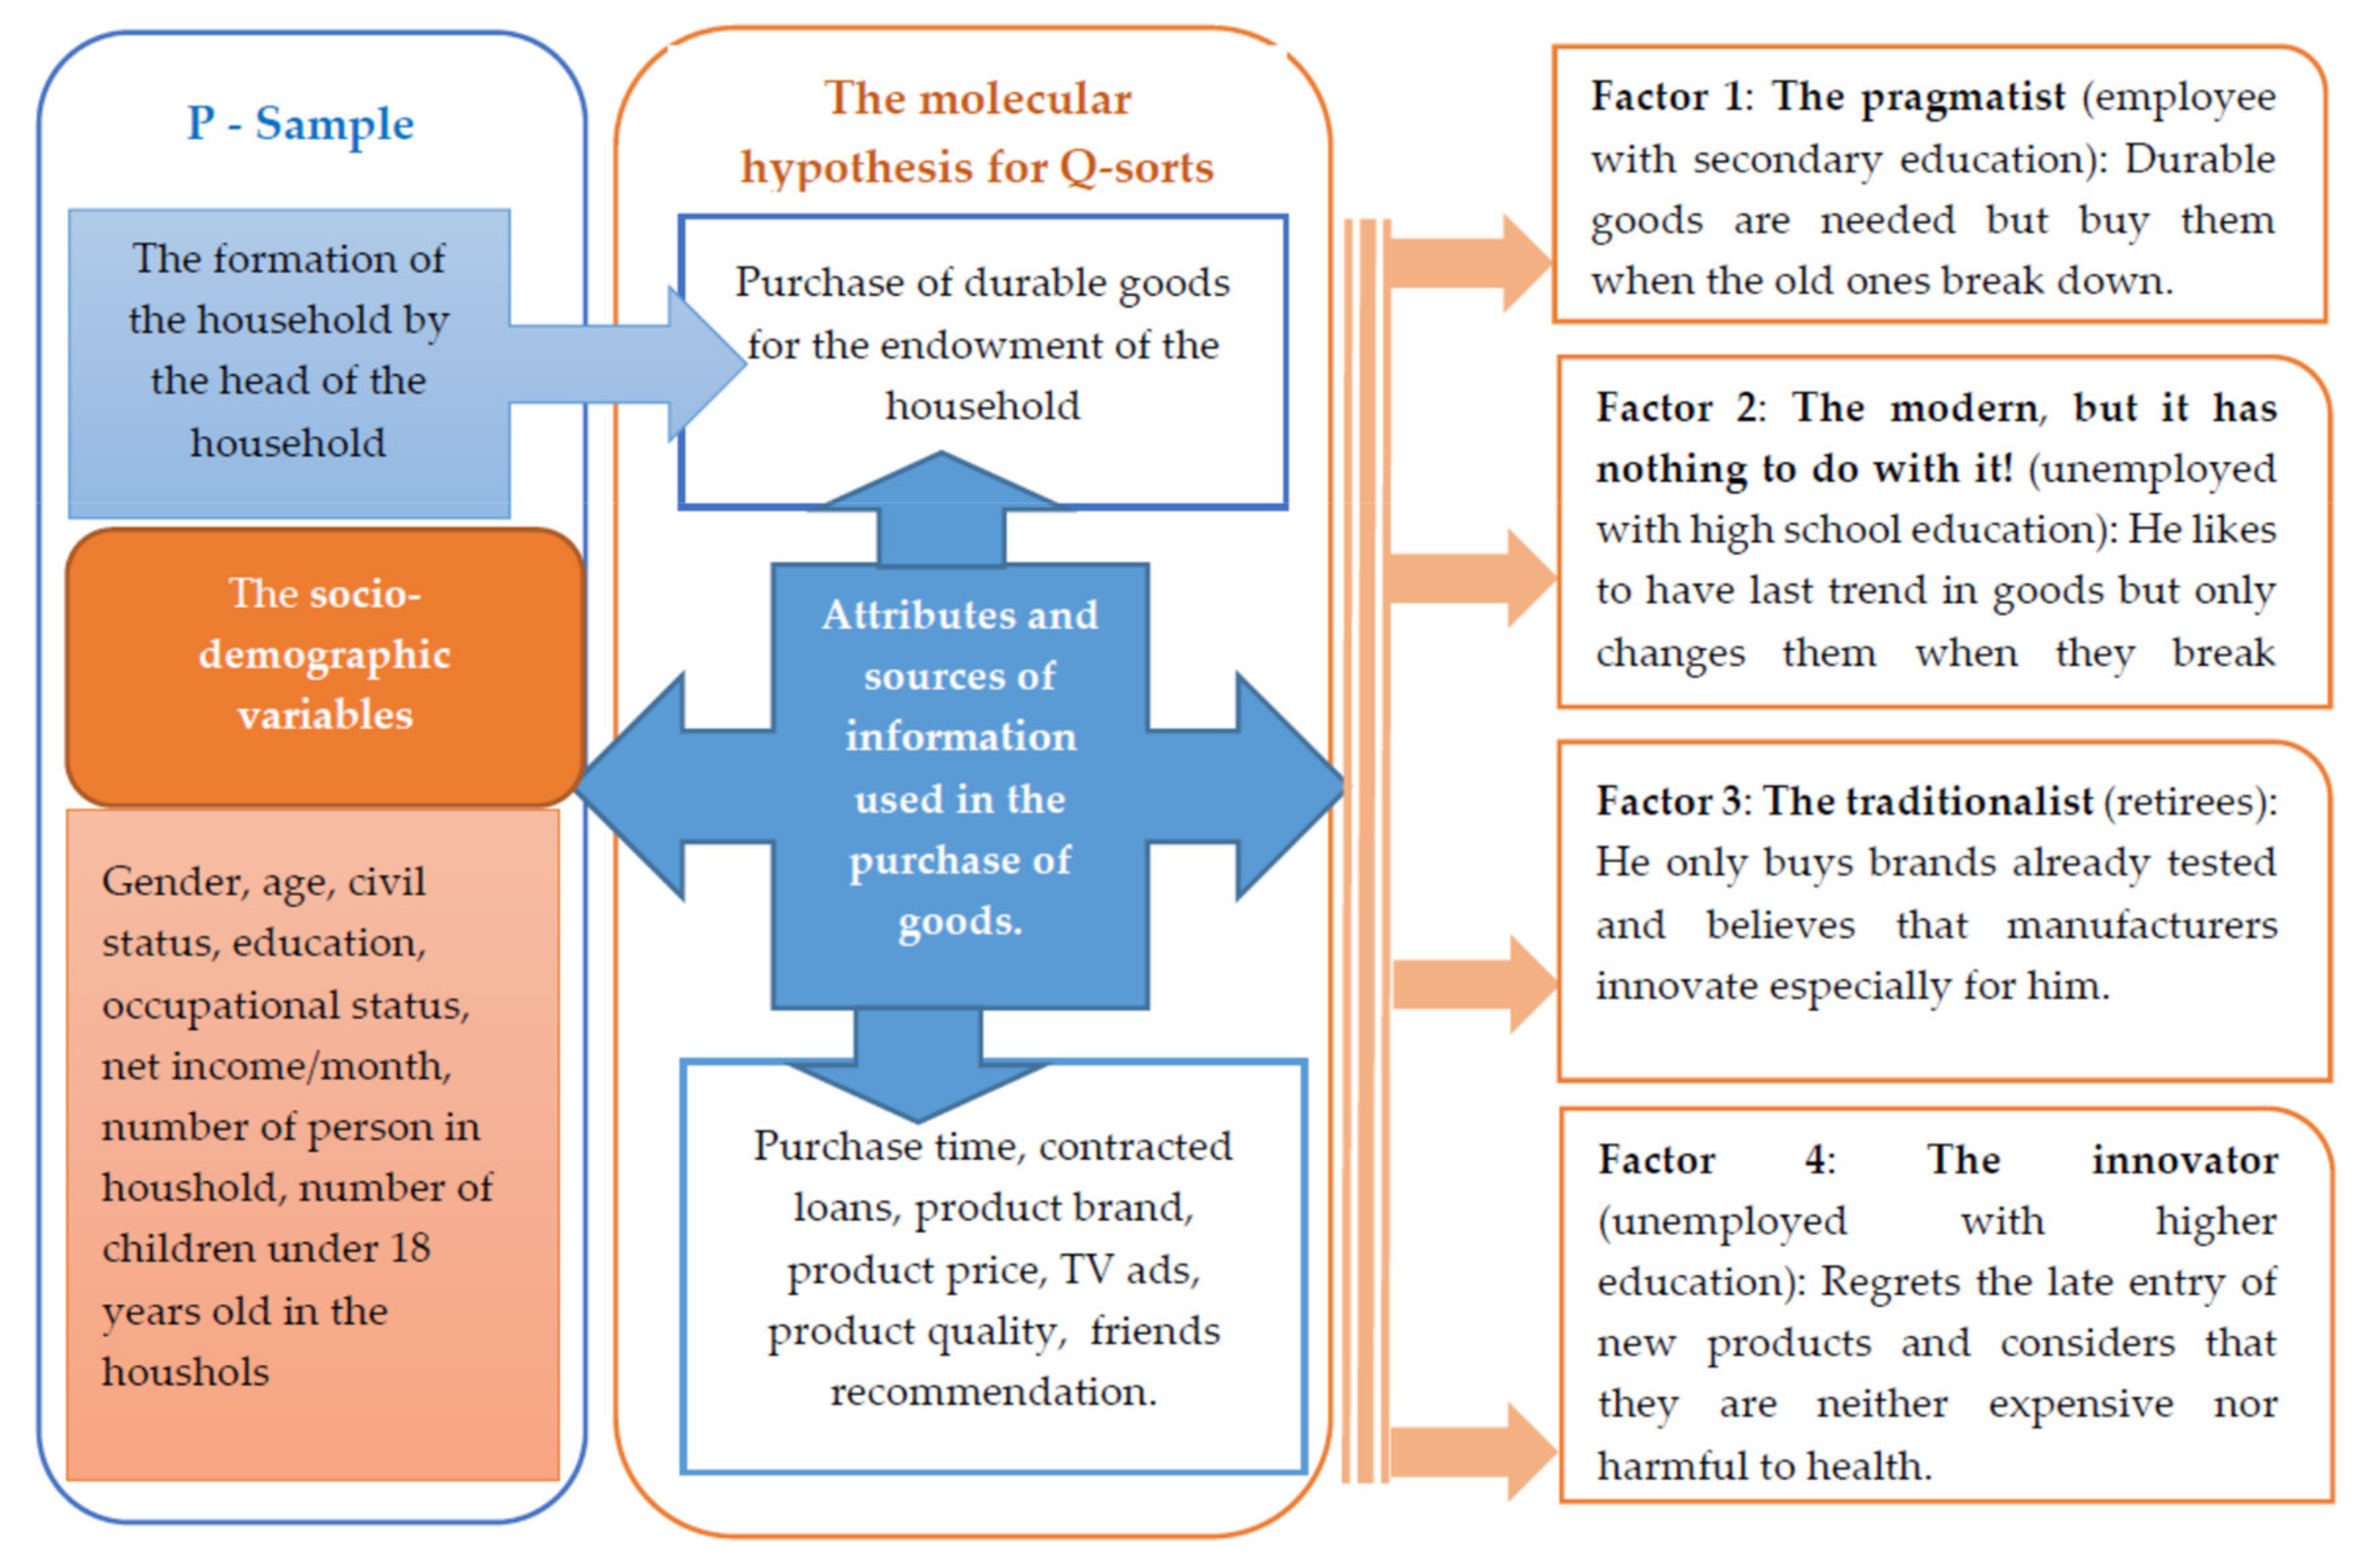
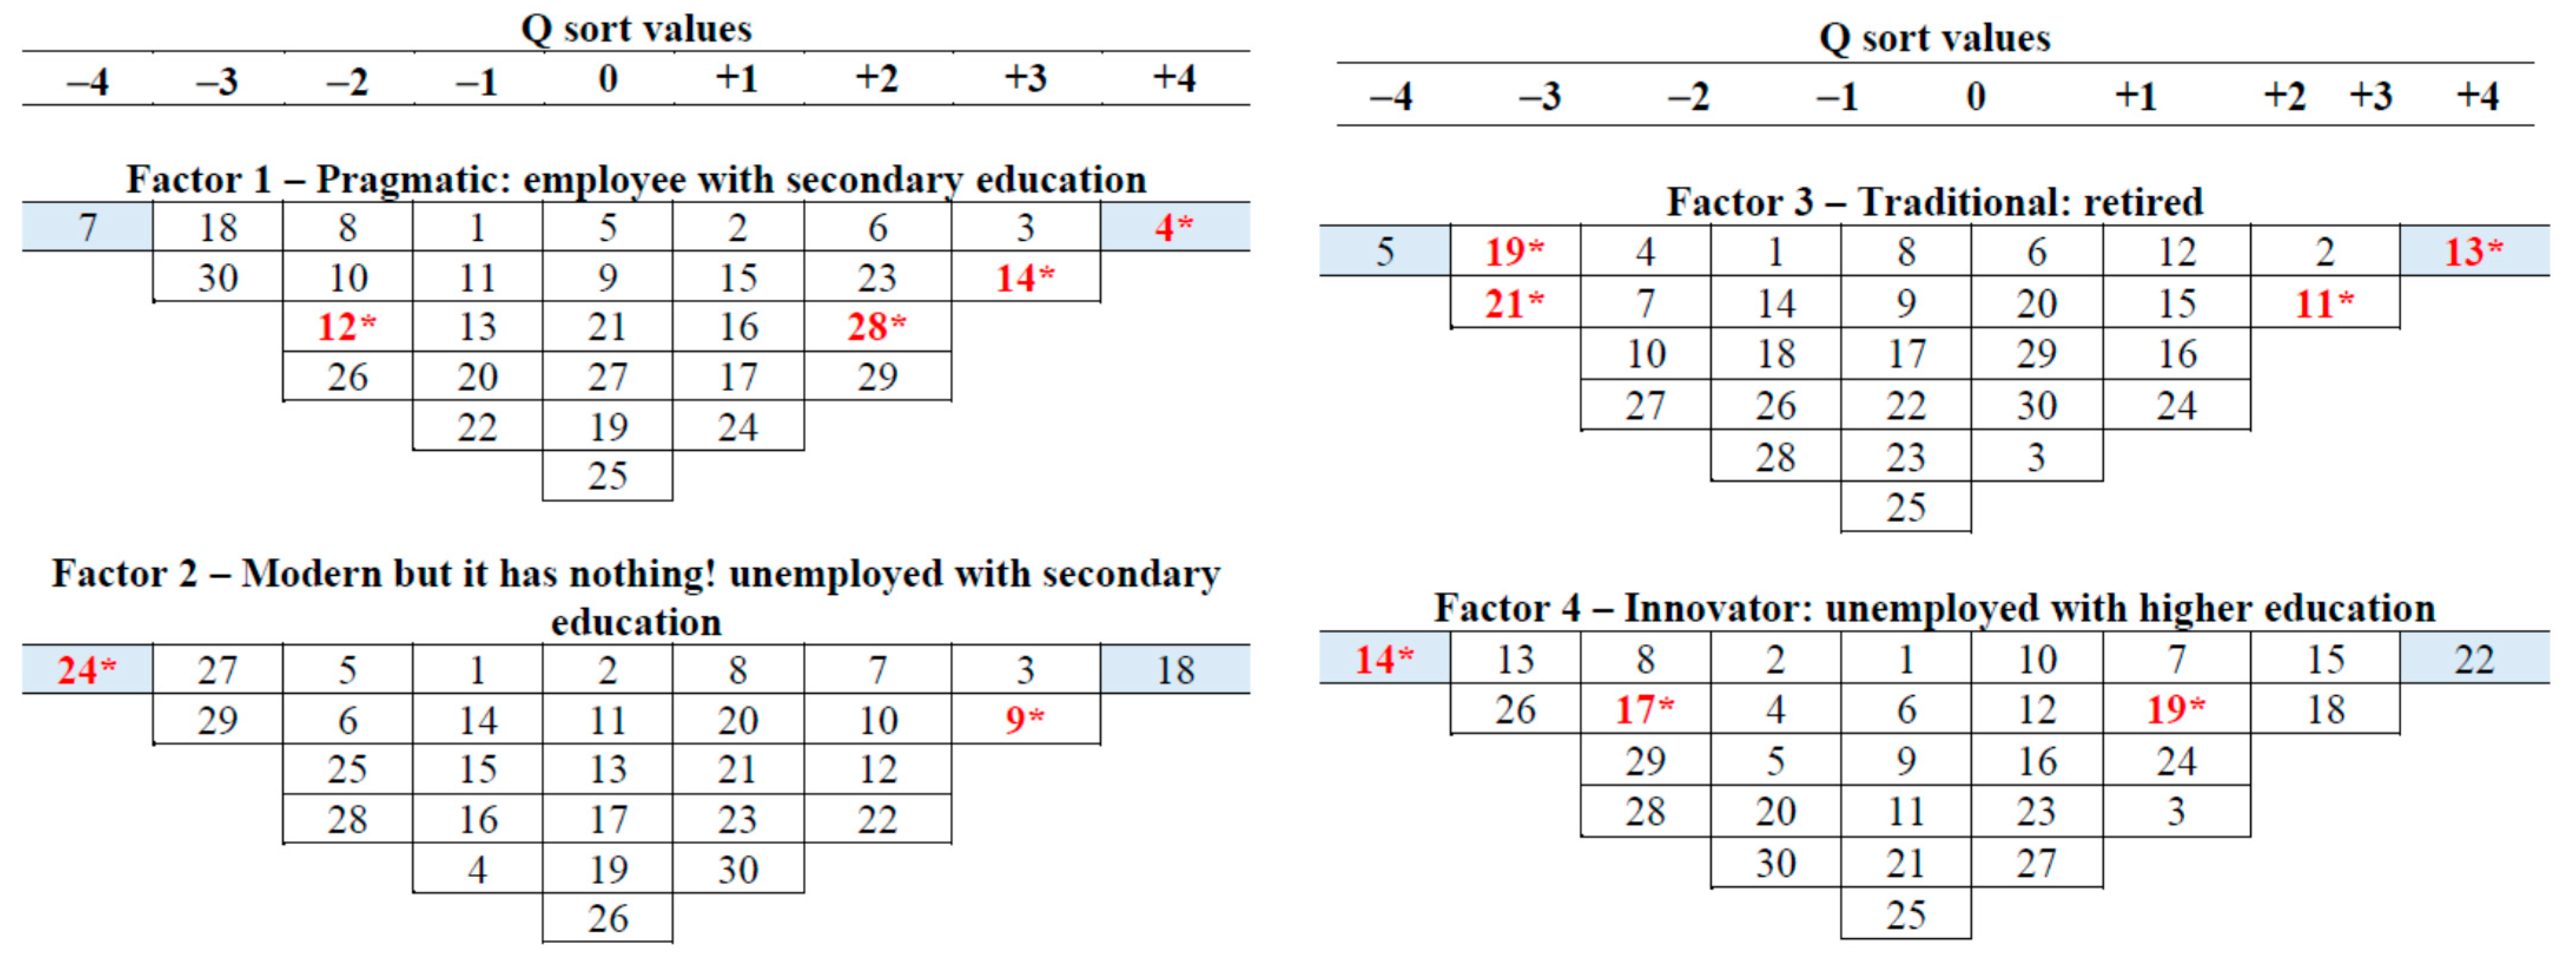
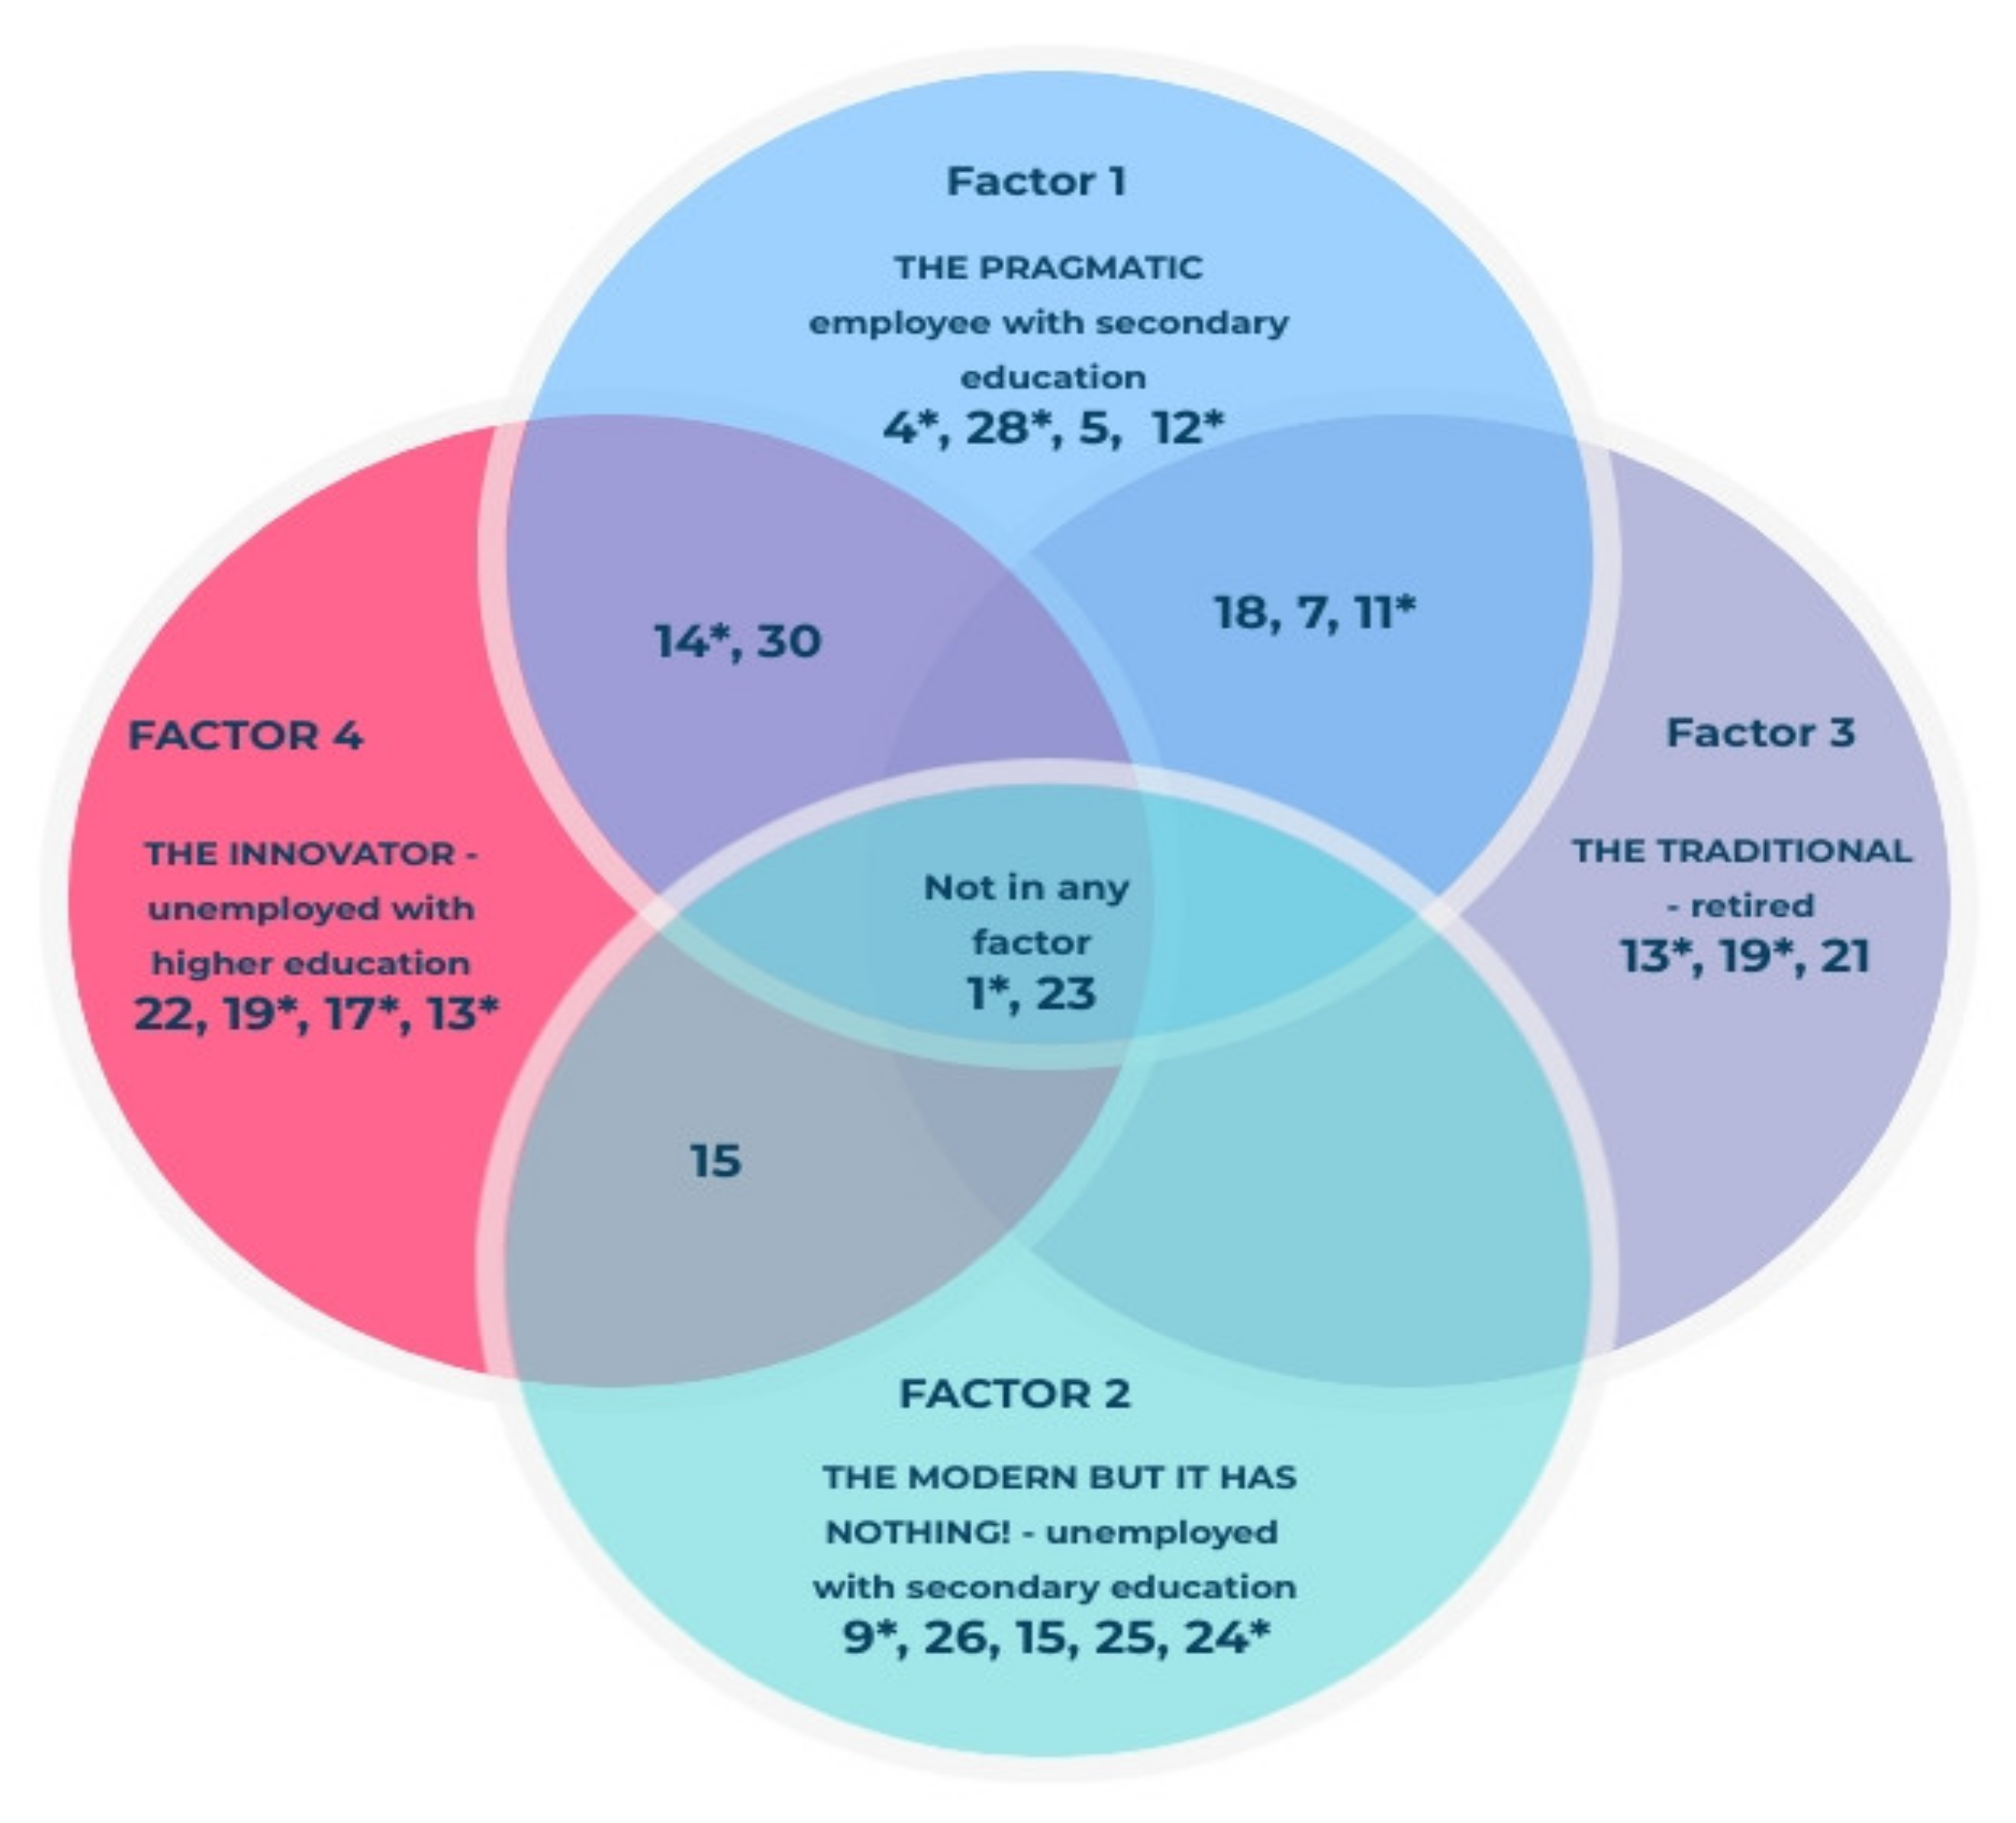
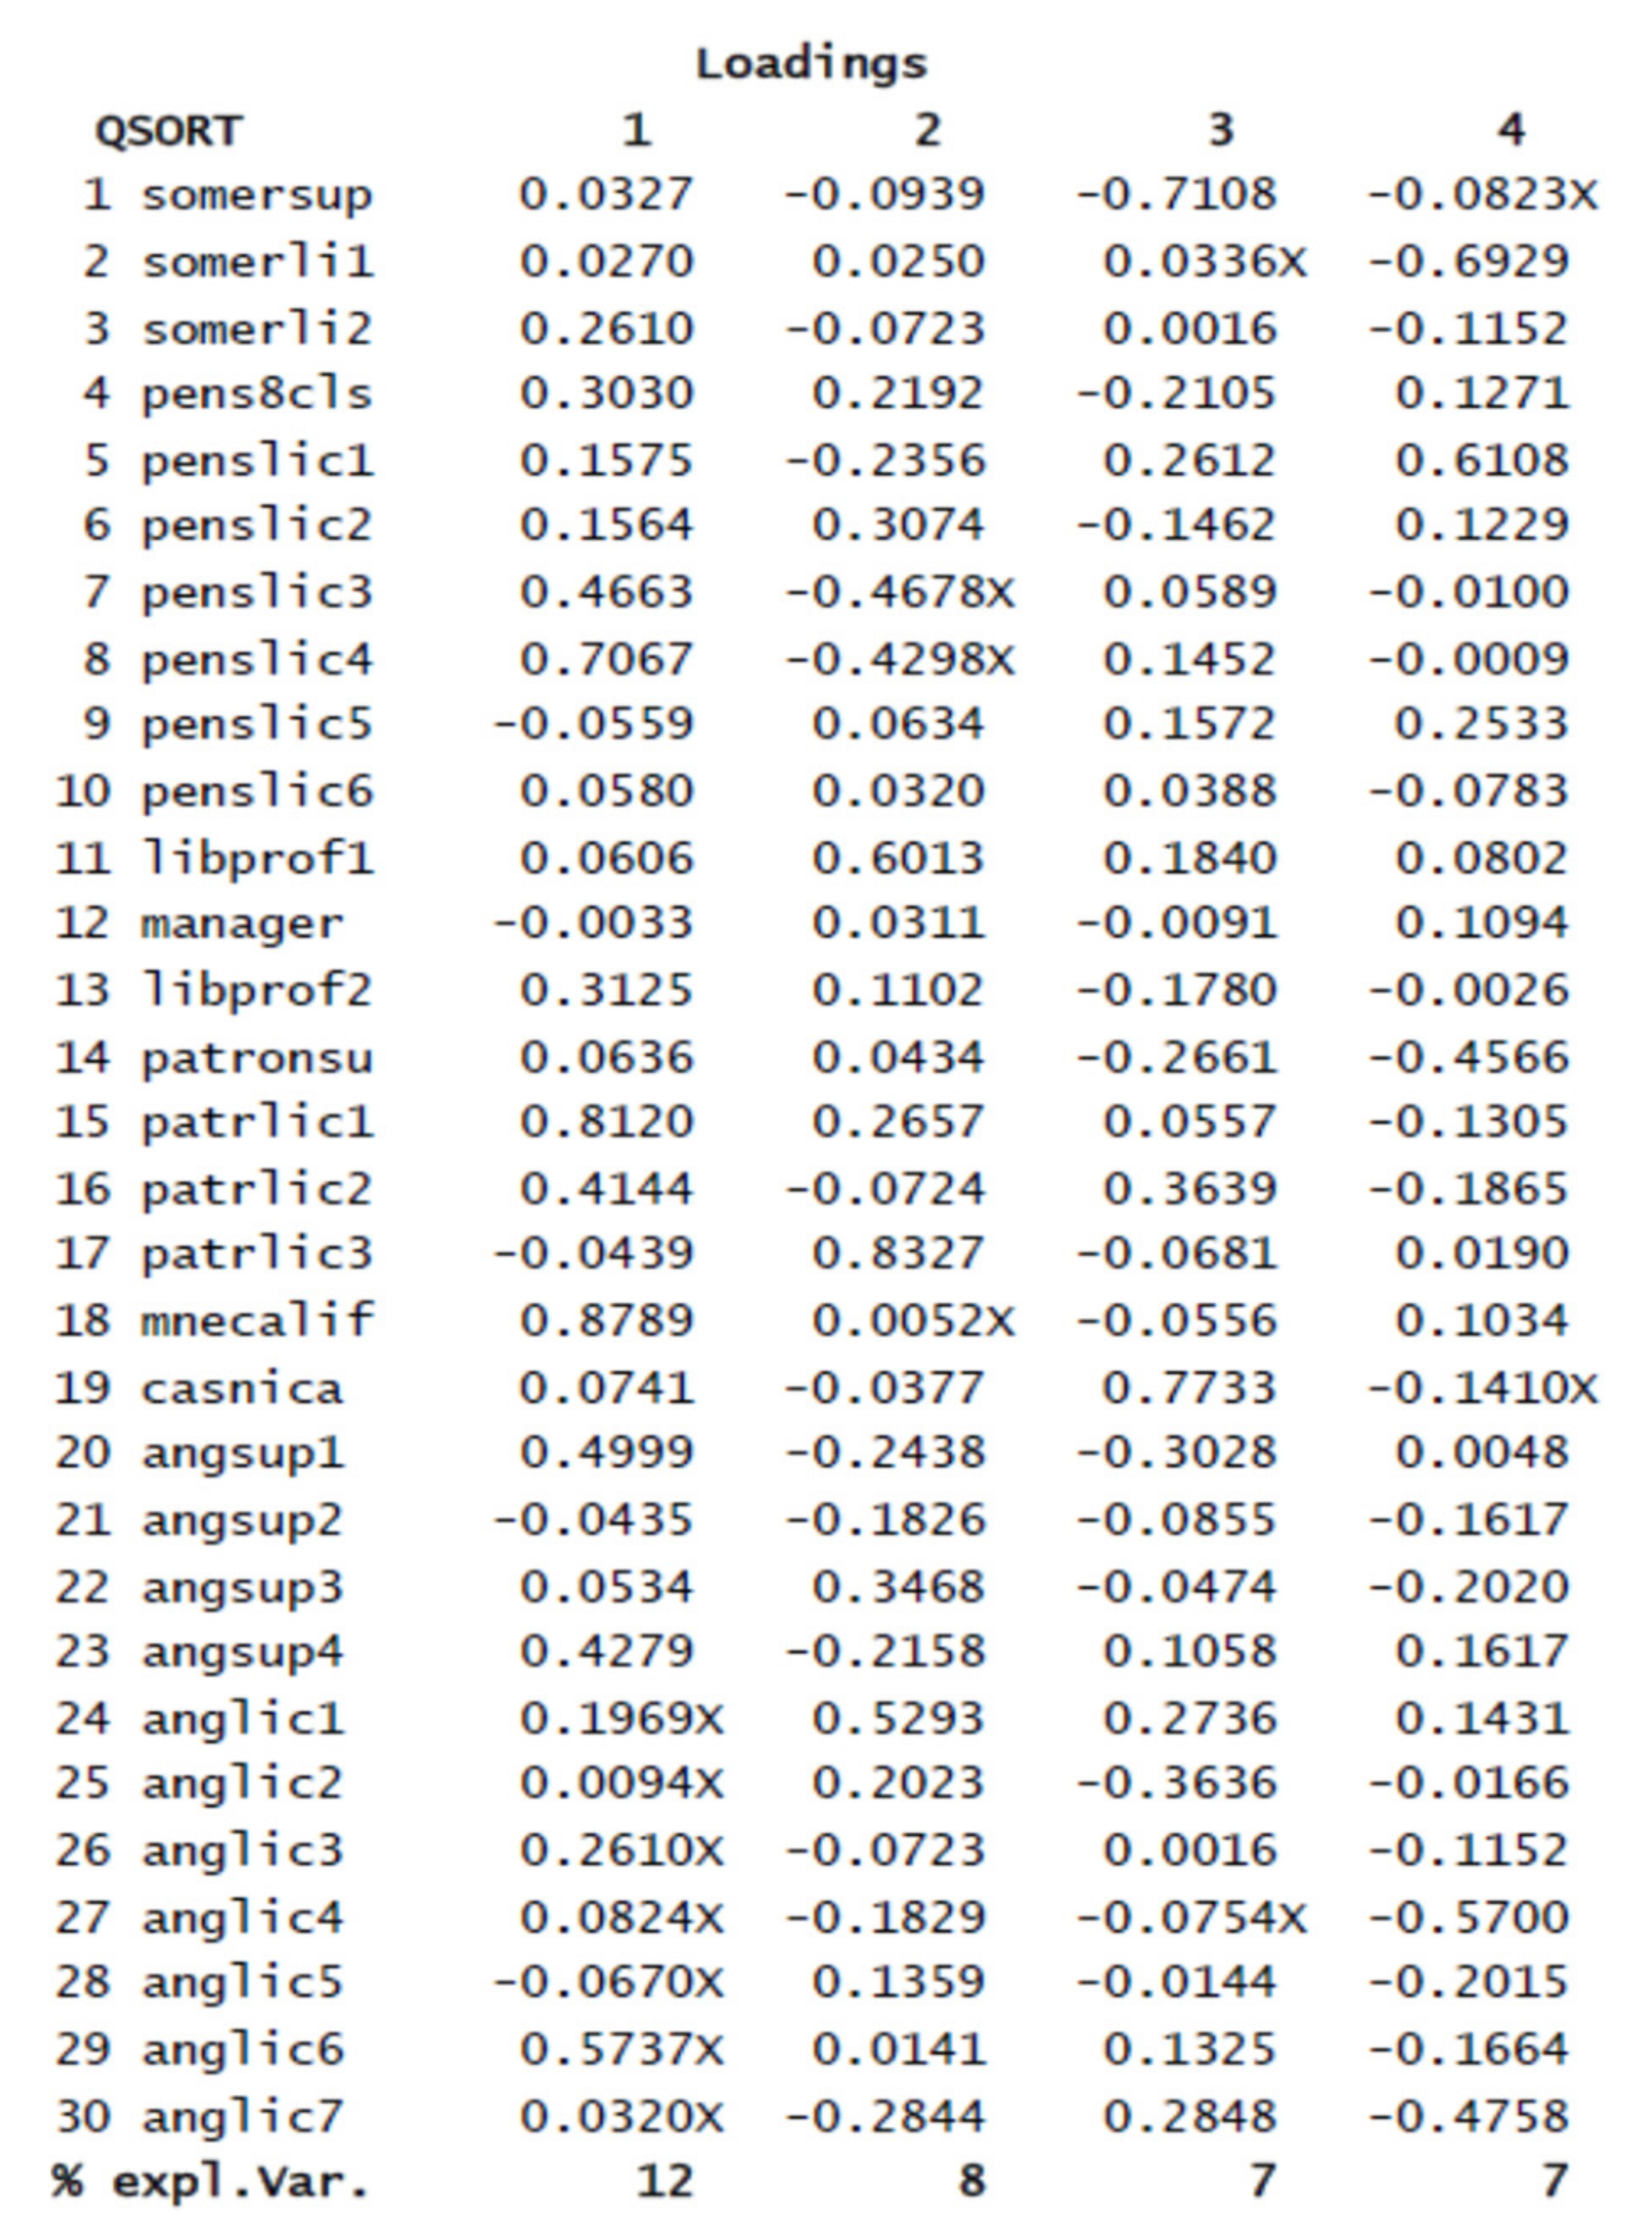
- Factor 1—The Pragmatic, represented by the employees with secondary education. Opposite statements for factor 1 are (4) The durable goods are a must in any household and (7) The new technologies are good for health.
- Factor 2—The Modern but it has nothing! represented by the unemployed with secondary education. Opposite statements for factor 2 are (18) A high price means a guaranteed quality and (9) I like to have the last generations of durable goods in comparison to (24) I change the durable goods when they break down only.
- Factor 3—The Traditional consumer, represented by the retired subjects of this study. Opposite statements for factor 3 are (13) Manufacturers of durable goods are constantly innovating to make household chores easier and increase comfort and (5) Romanian brands are competitive on the market.
- Factor 4—The Innovator, represented by the unemployed with higher education. Opposite statements for factor 4 are (22) Imported durable goods are better than Romanian one and (14) Durable goods made radiation harmful to health (microwave oven, tube monitors, mobile phones, TVs, etc.).
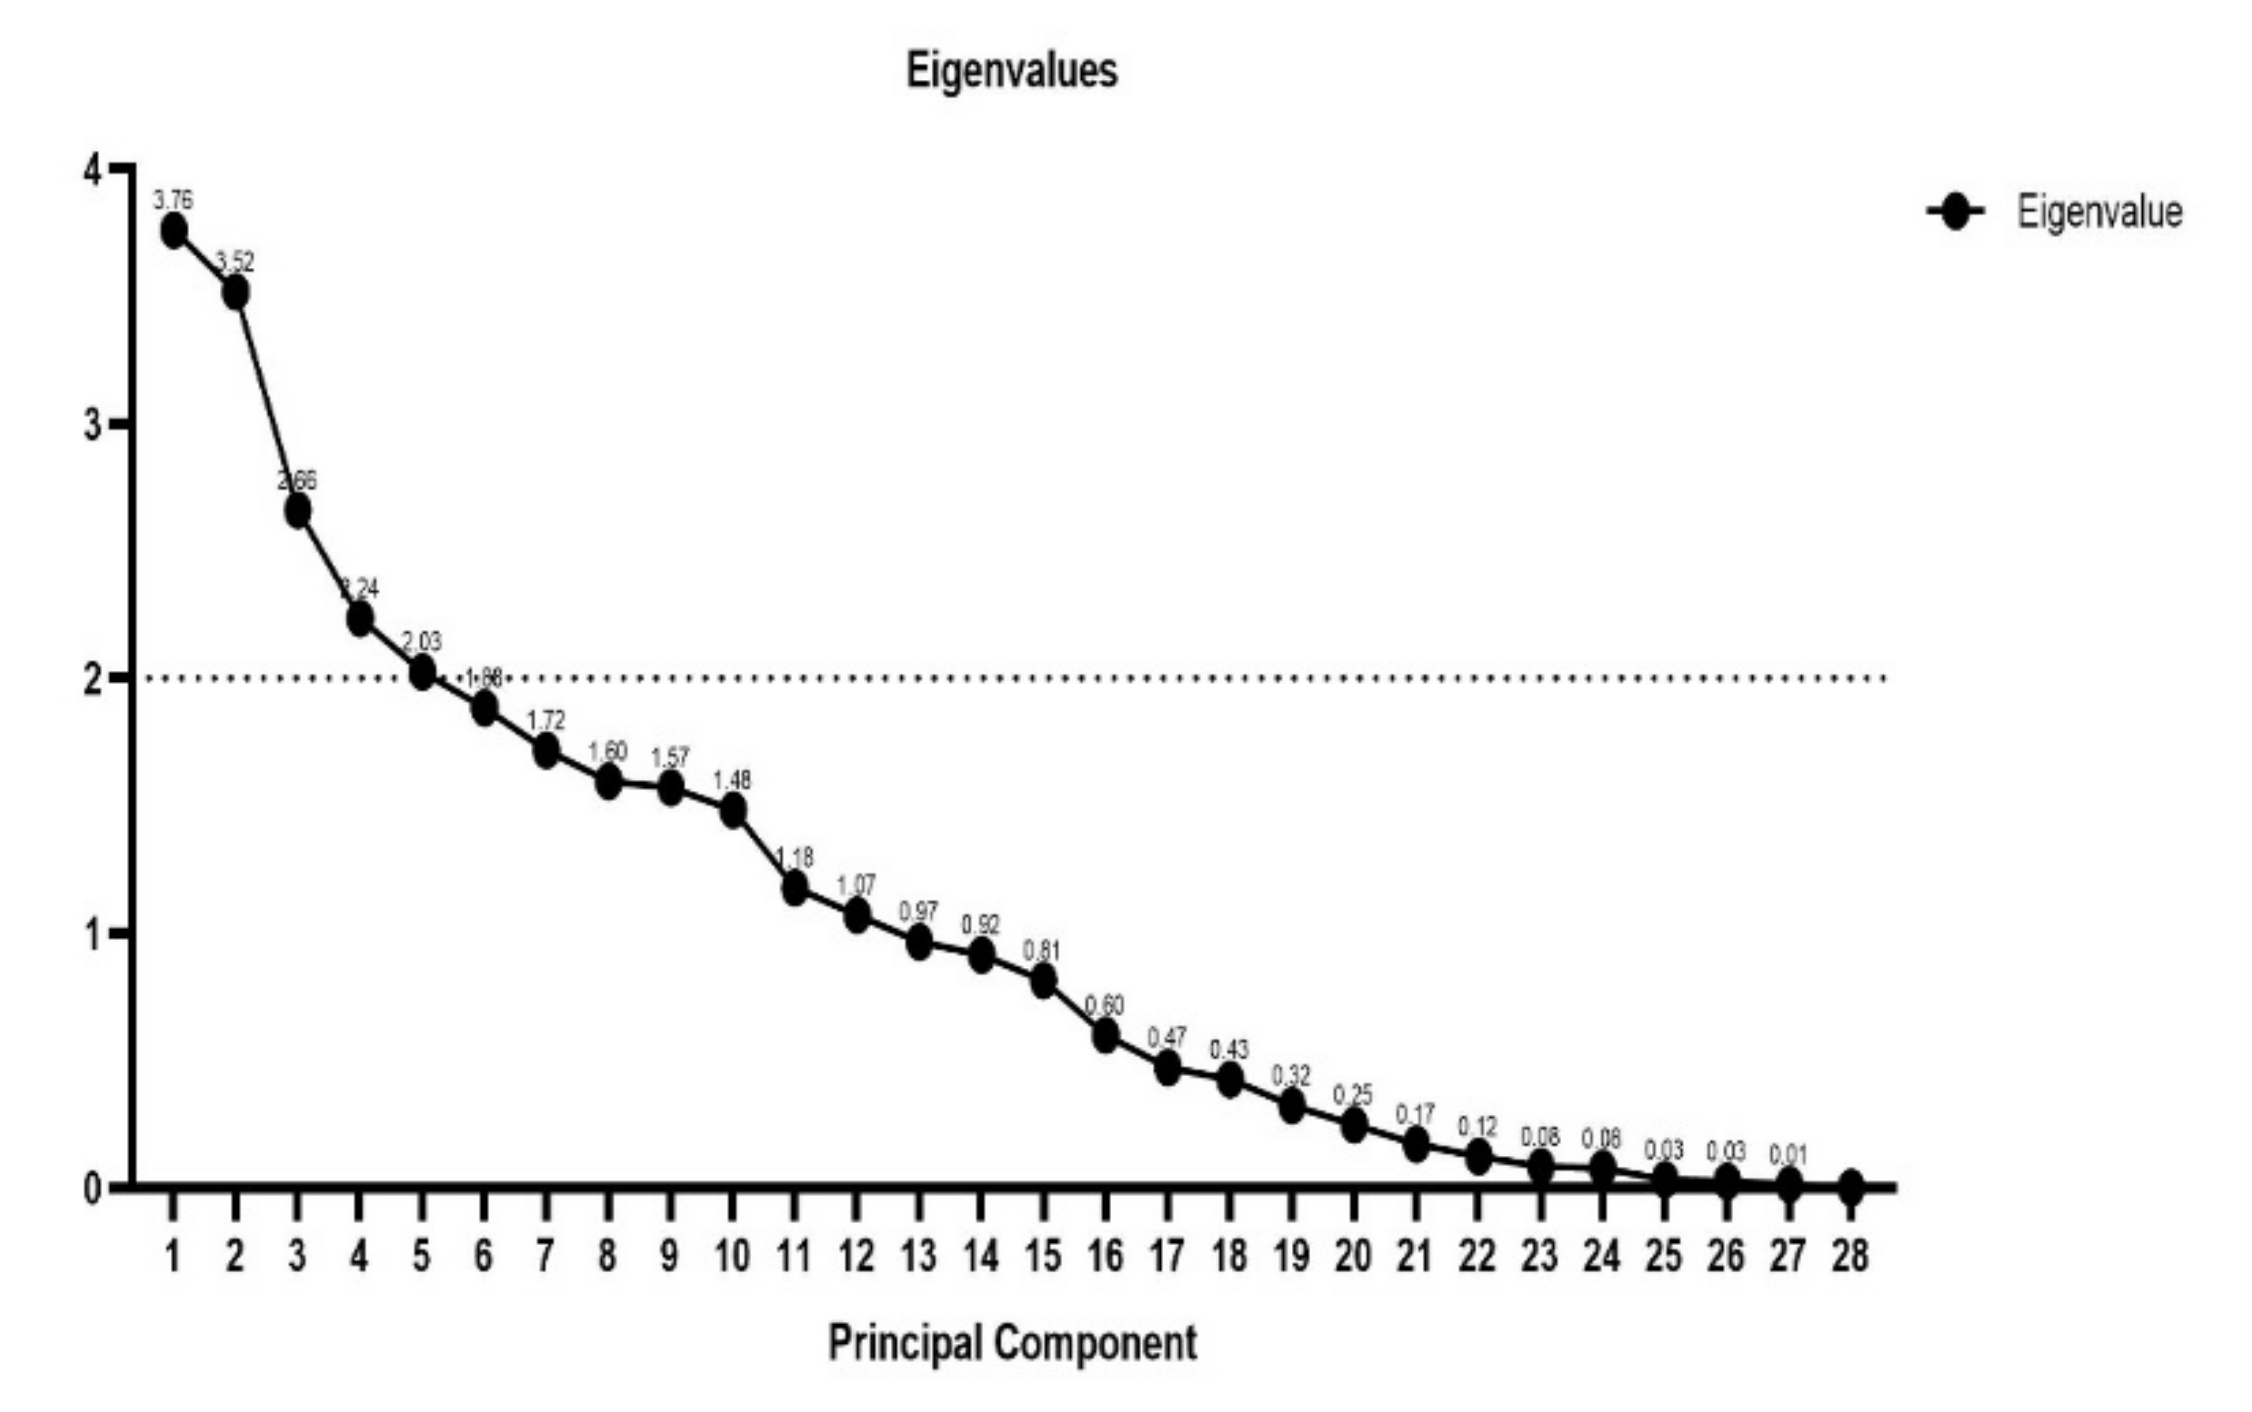
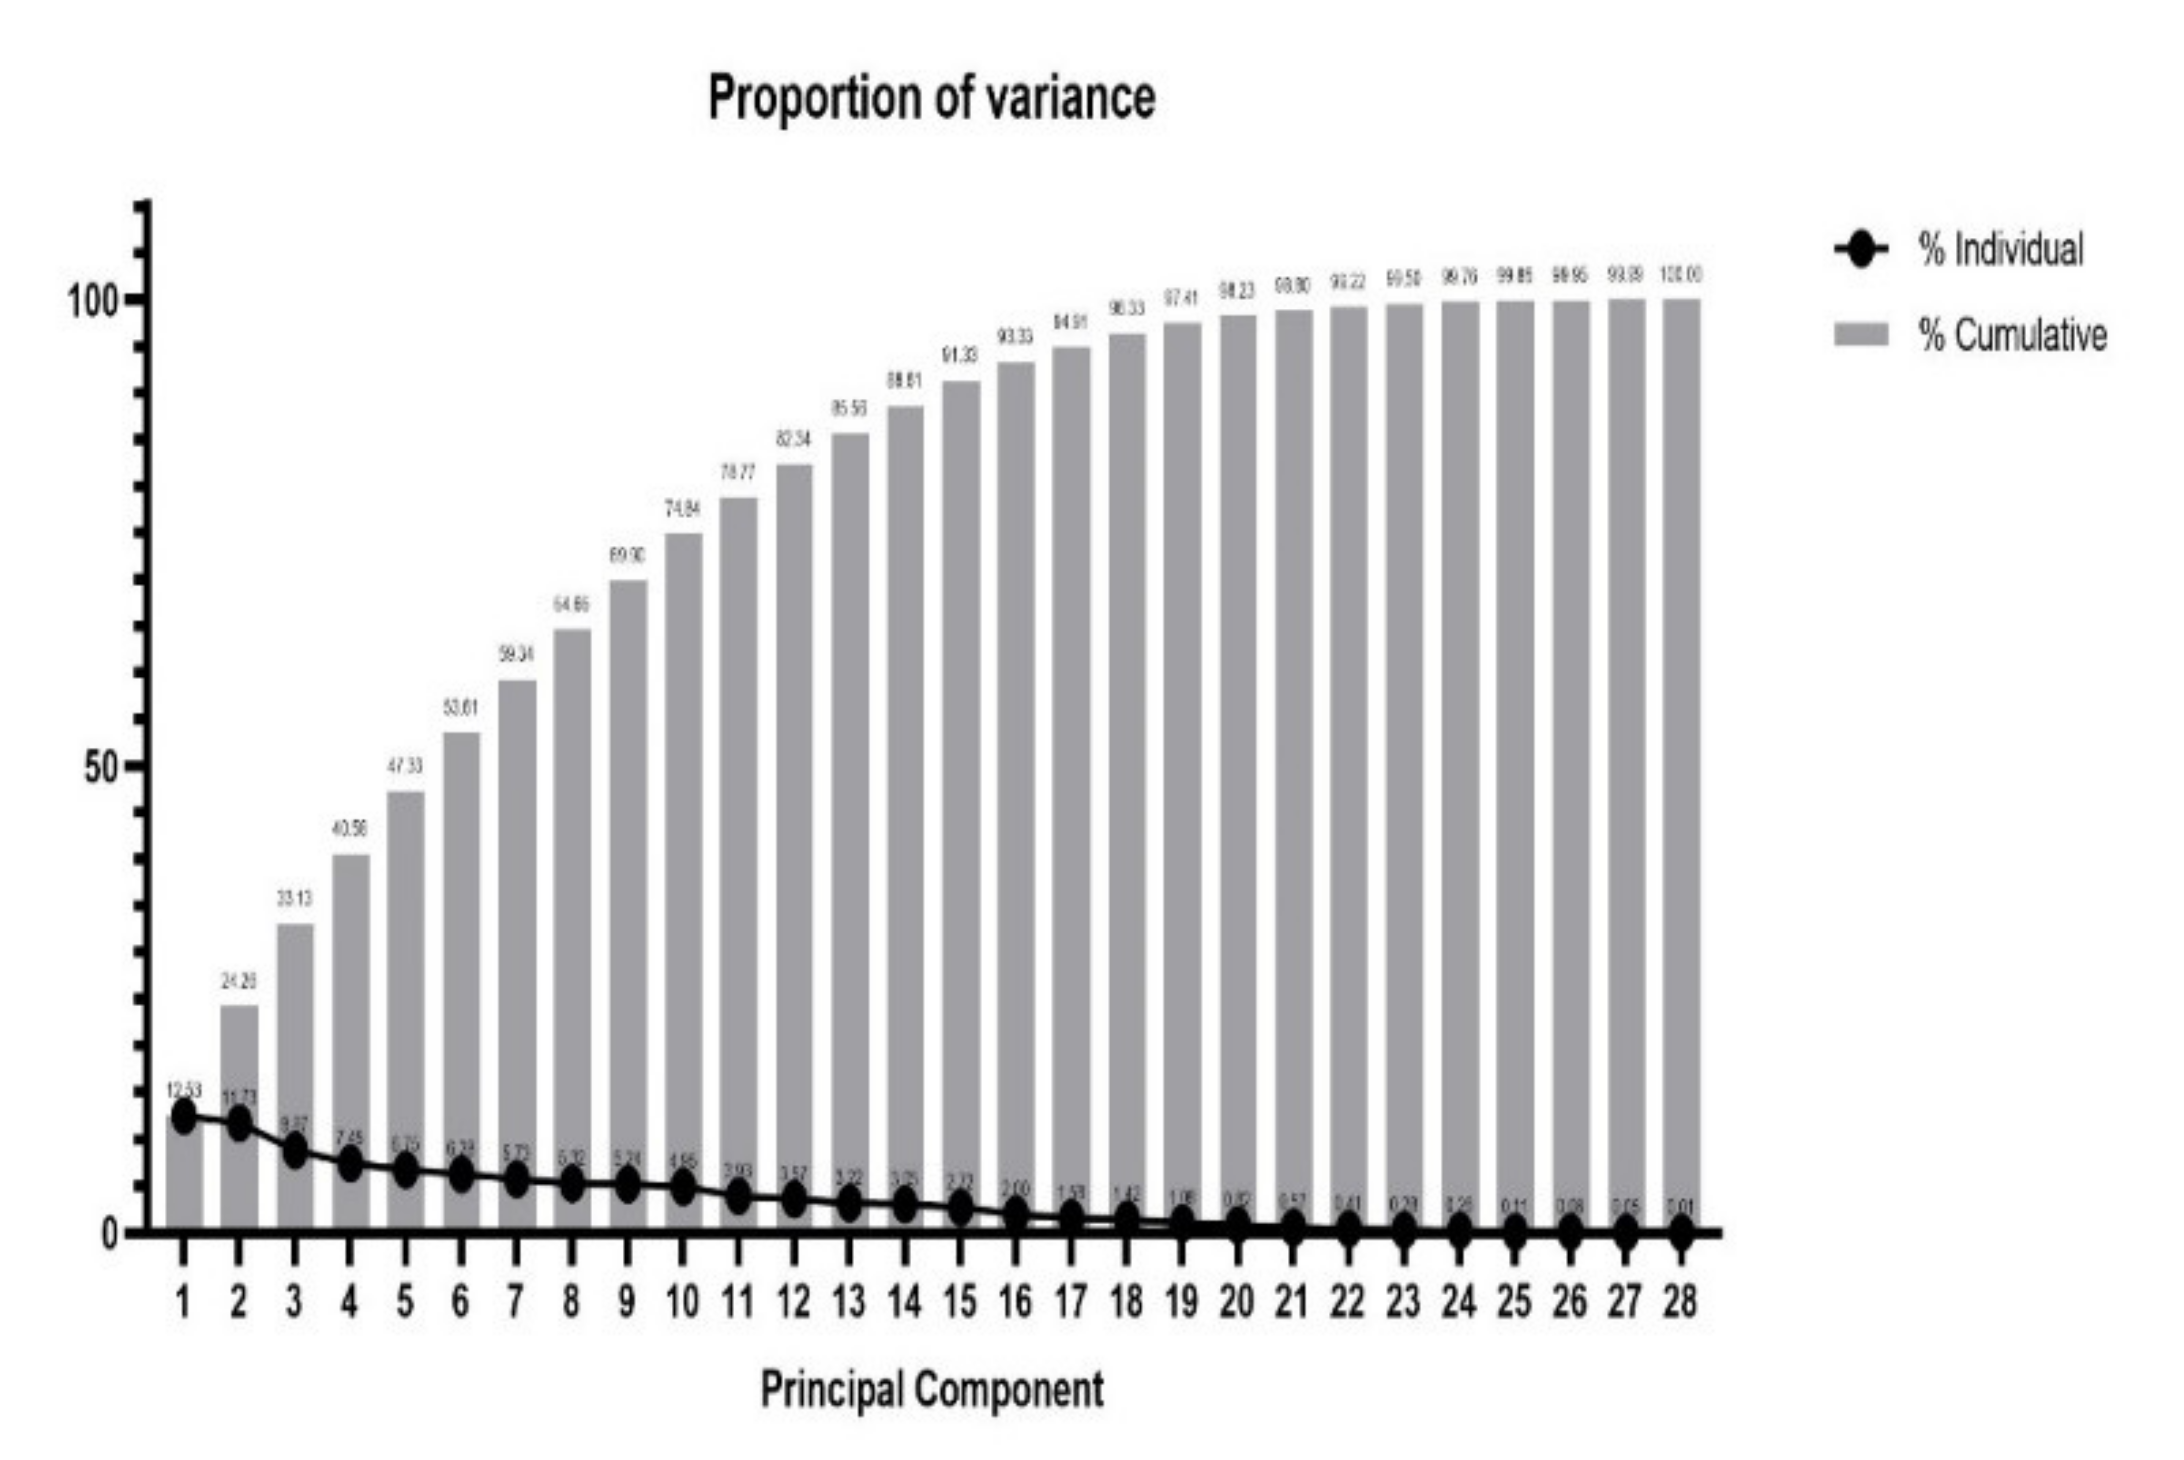
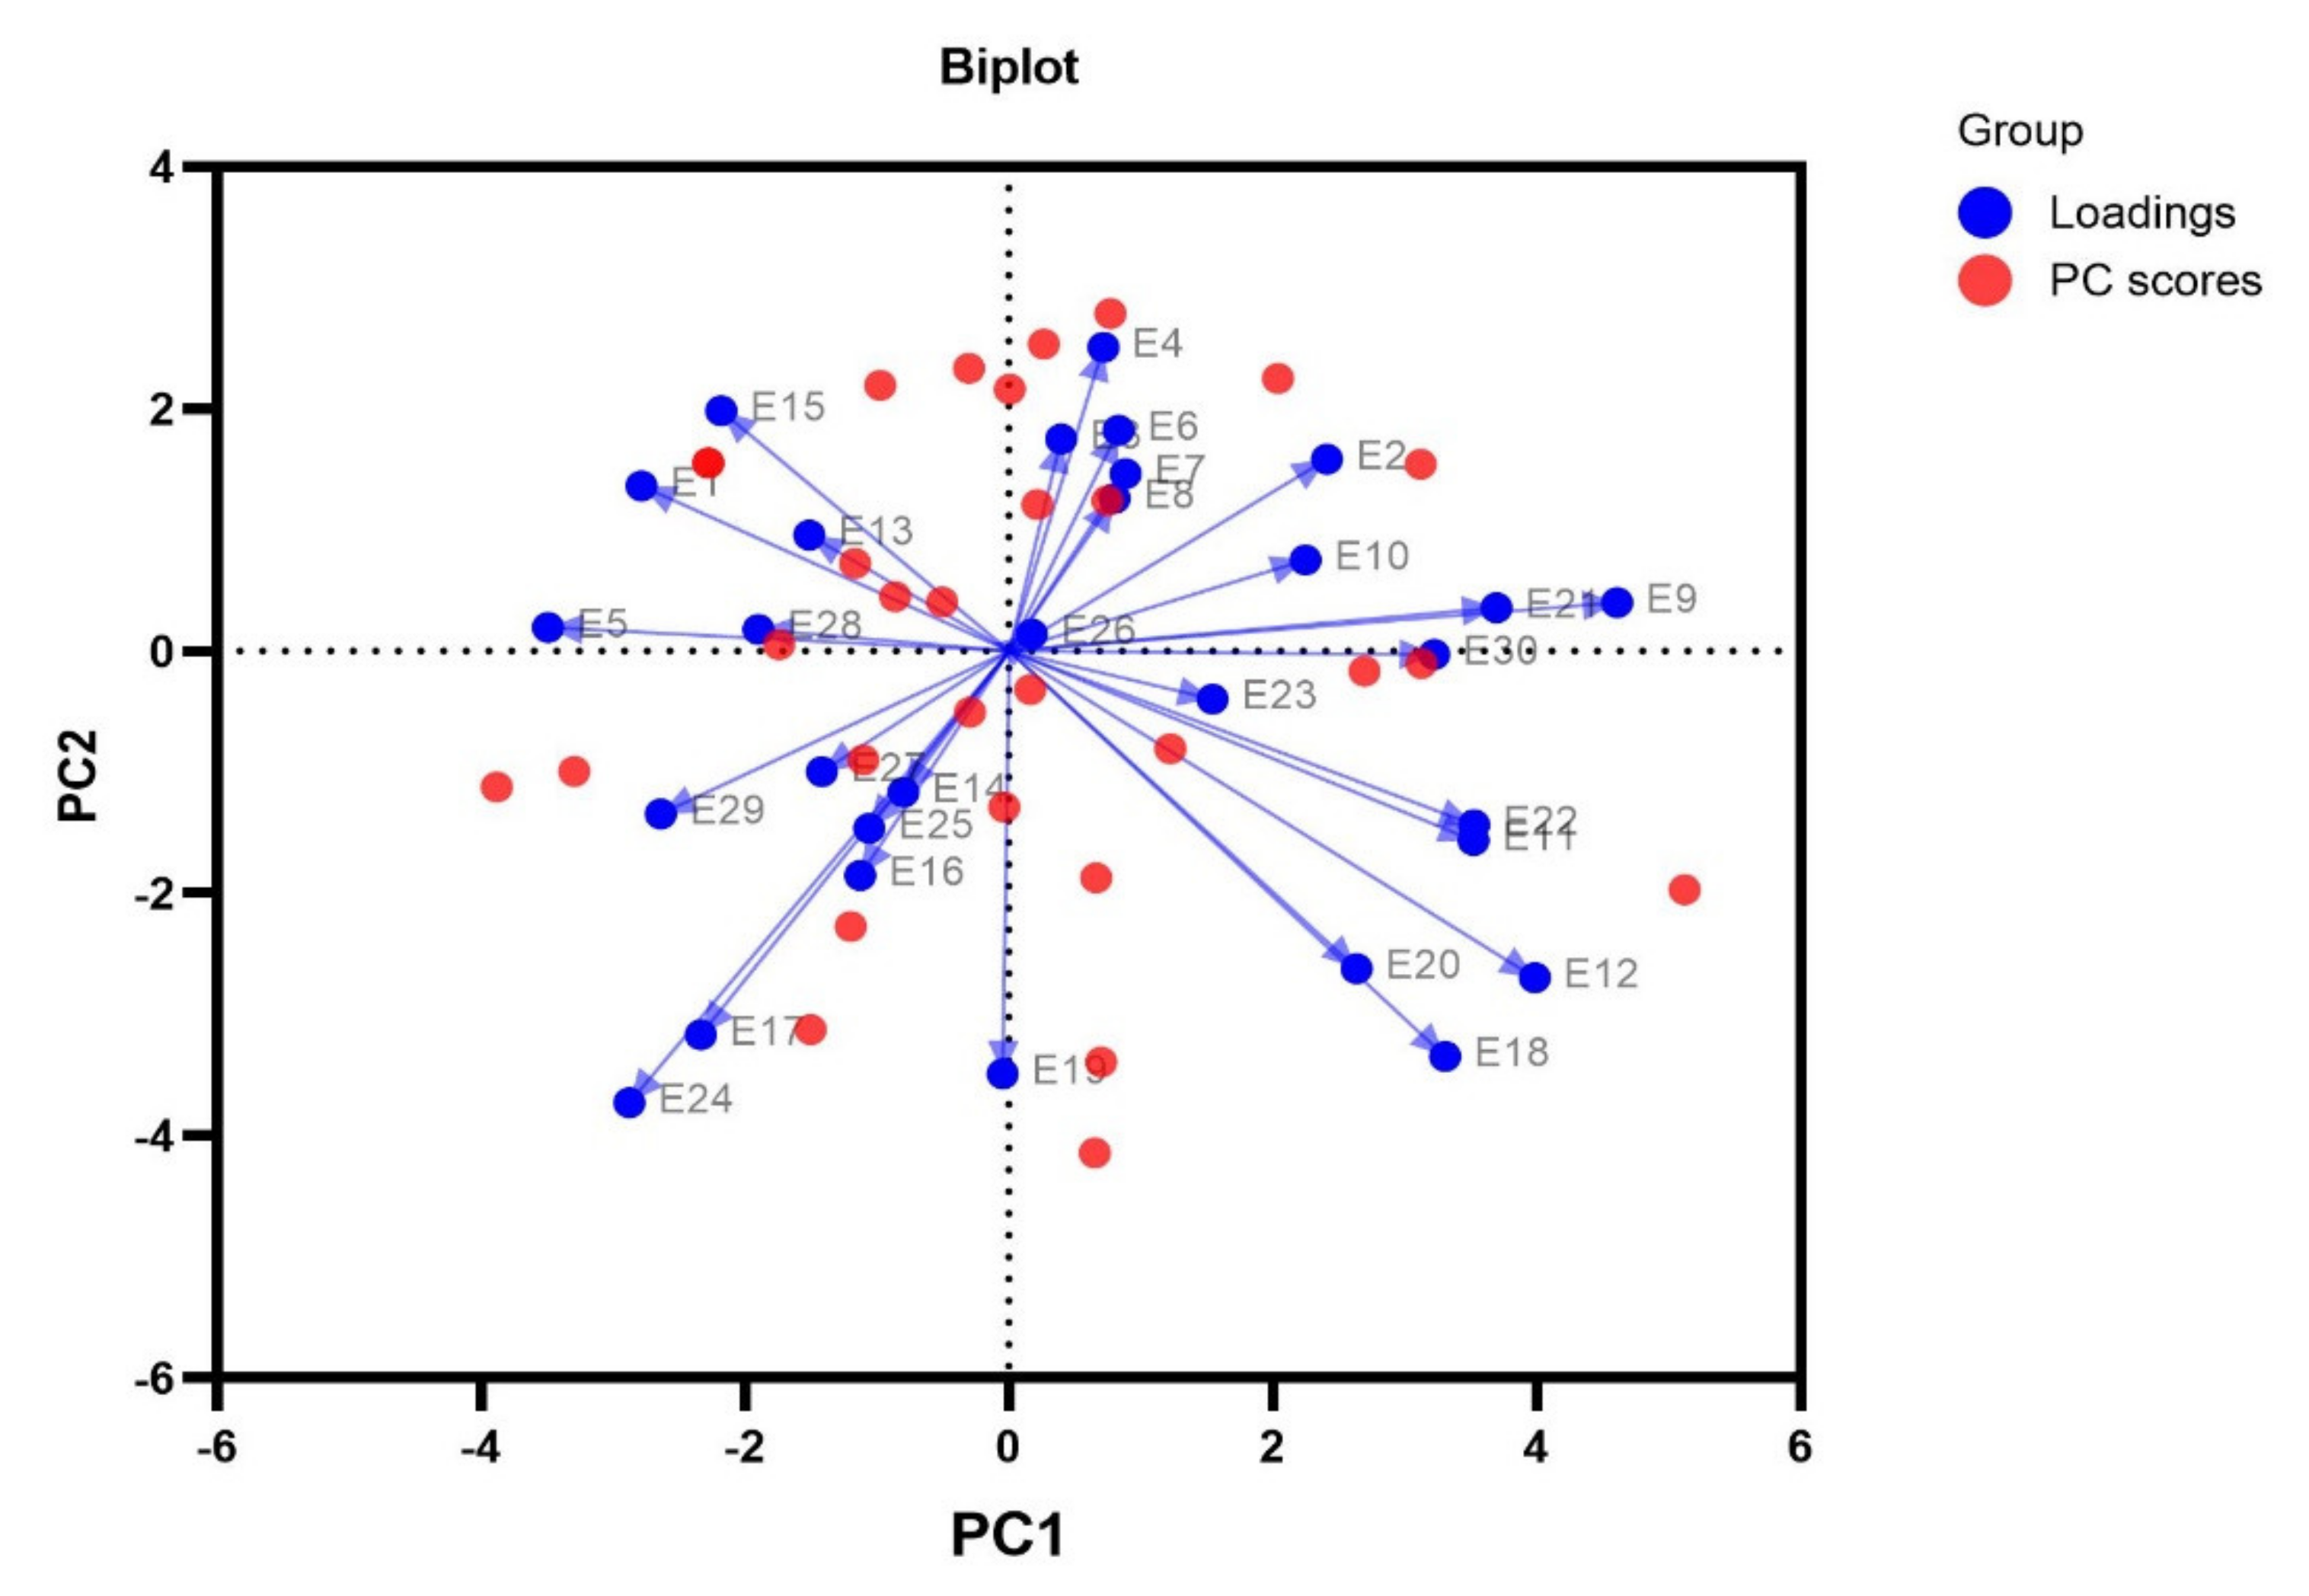
3.2. Results for R Factor Analysis (Principal Component Analysis and Cluster Analysis)
- PC1—traditional Romanian brands and behavior,
- PC2—real needs of households and power purchasing,
- PC3—sceptic versus optimistic subjectiveness and opinions,
- PC4—oldest versus newest opinions on durable goods, and
- PC5—negative subjectiveness of durable goods buying behavior.
- Cluster 1 has six members: one employee with higher education, one owner with secondary education, and four retired with secondary education.
- Cluster 2 has six members: one employee with higher education, one owner with higher education, one household member, and two employees with secondary education.
- Cluster 3 has 13 members: five employees with secondary education, one employee with higher education, one self-employed, one manager, one owner with secondary education, two retired with secondary education, and one unemployed with higher education.
- Cluster 4 has five members: one unemployed with higher education, one retired with gymnasium, one self-employed, one owner with secondary education, and one unqualified worker.
4. Discussion
- In the purchase of durable goods, the subjects consider aspects related to the energy consumption class and the technical performance of the good and not the price or discounts granted;
- the fact that the goods emit radiation harmful to health;
- The last generation of durable goods are expensive for the purchasing power of the subjects who were grouped on the four factors; and
- The reason for purchasing durable goods is that the old ones have been damaged.
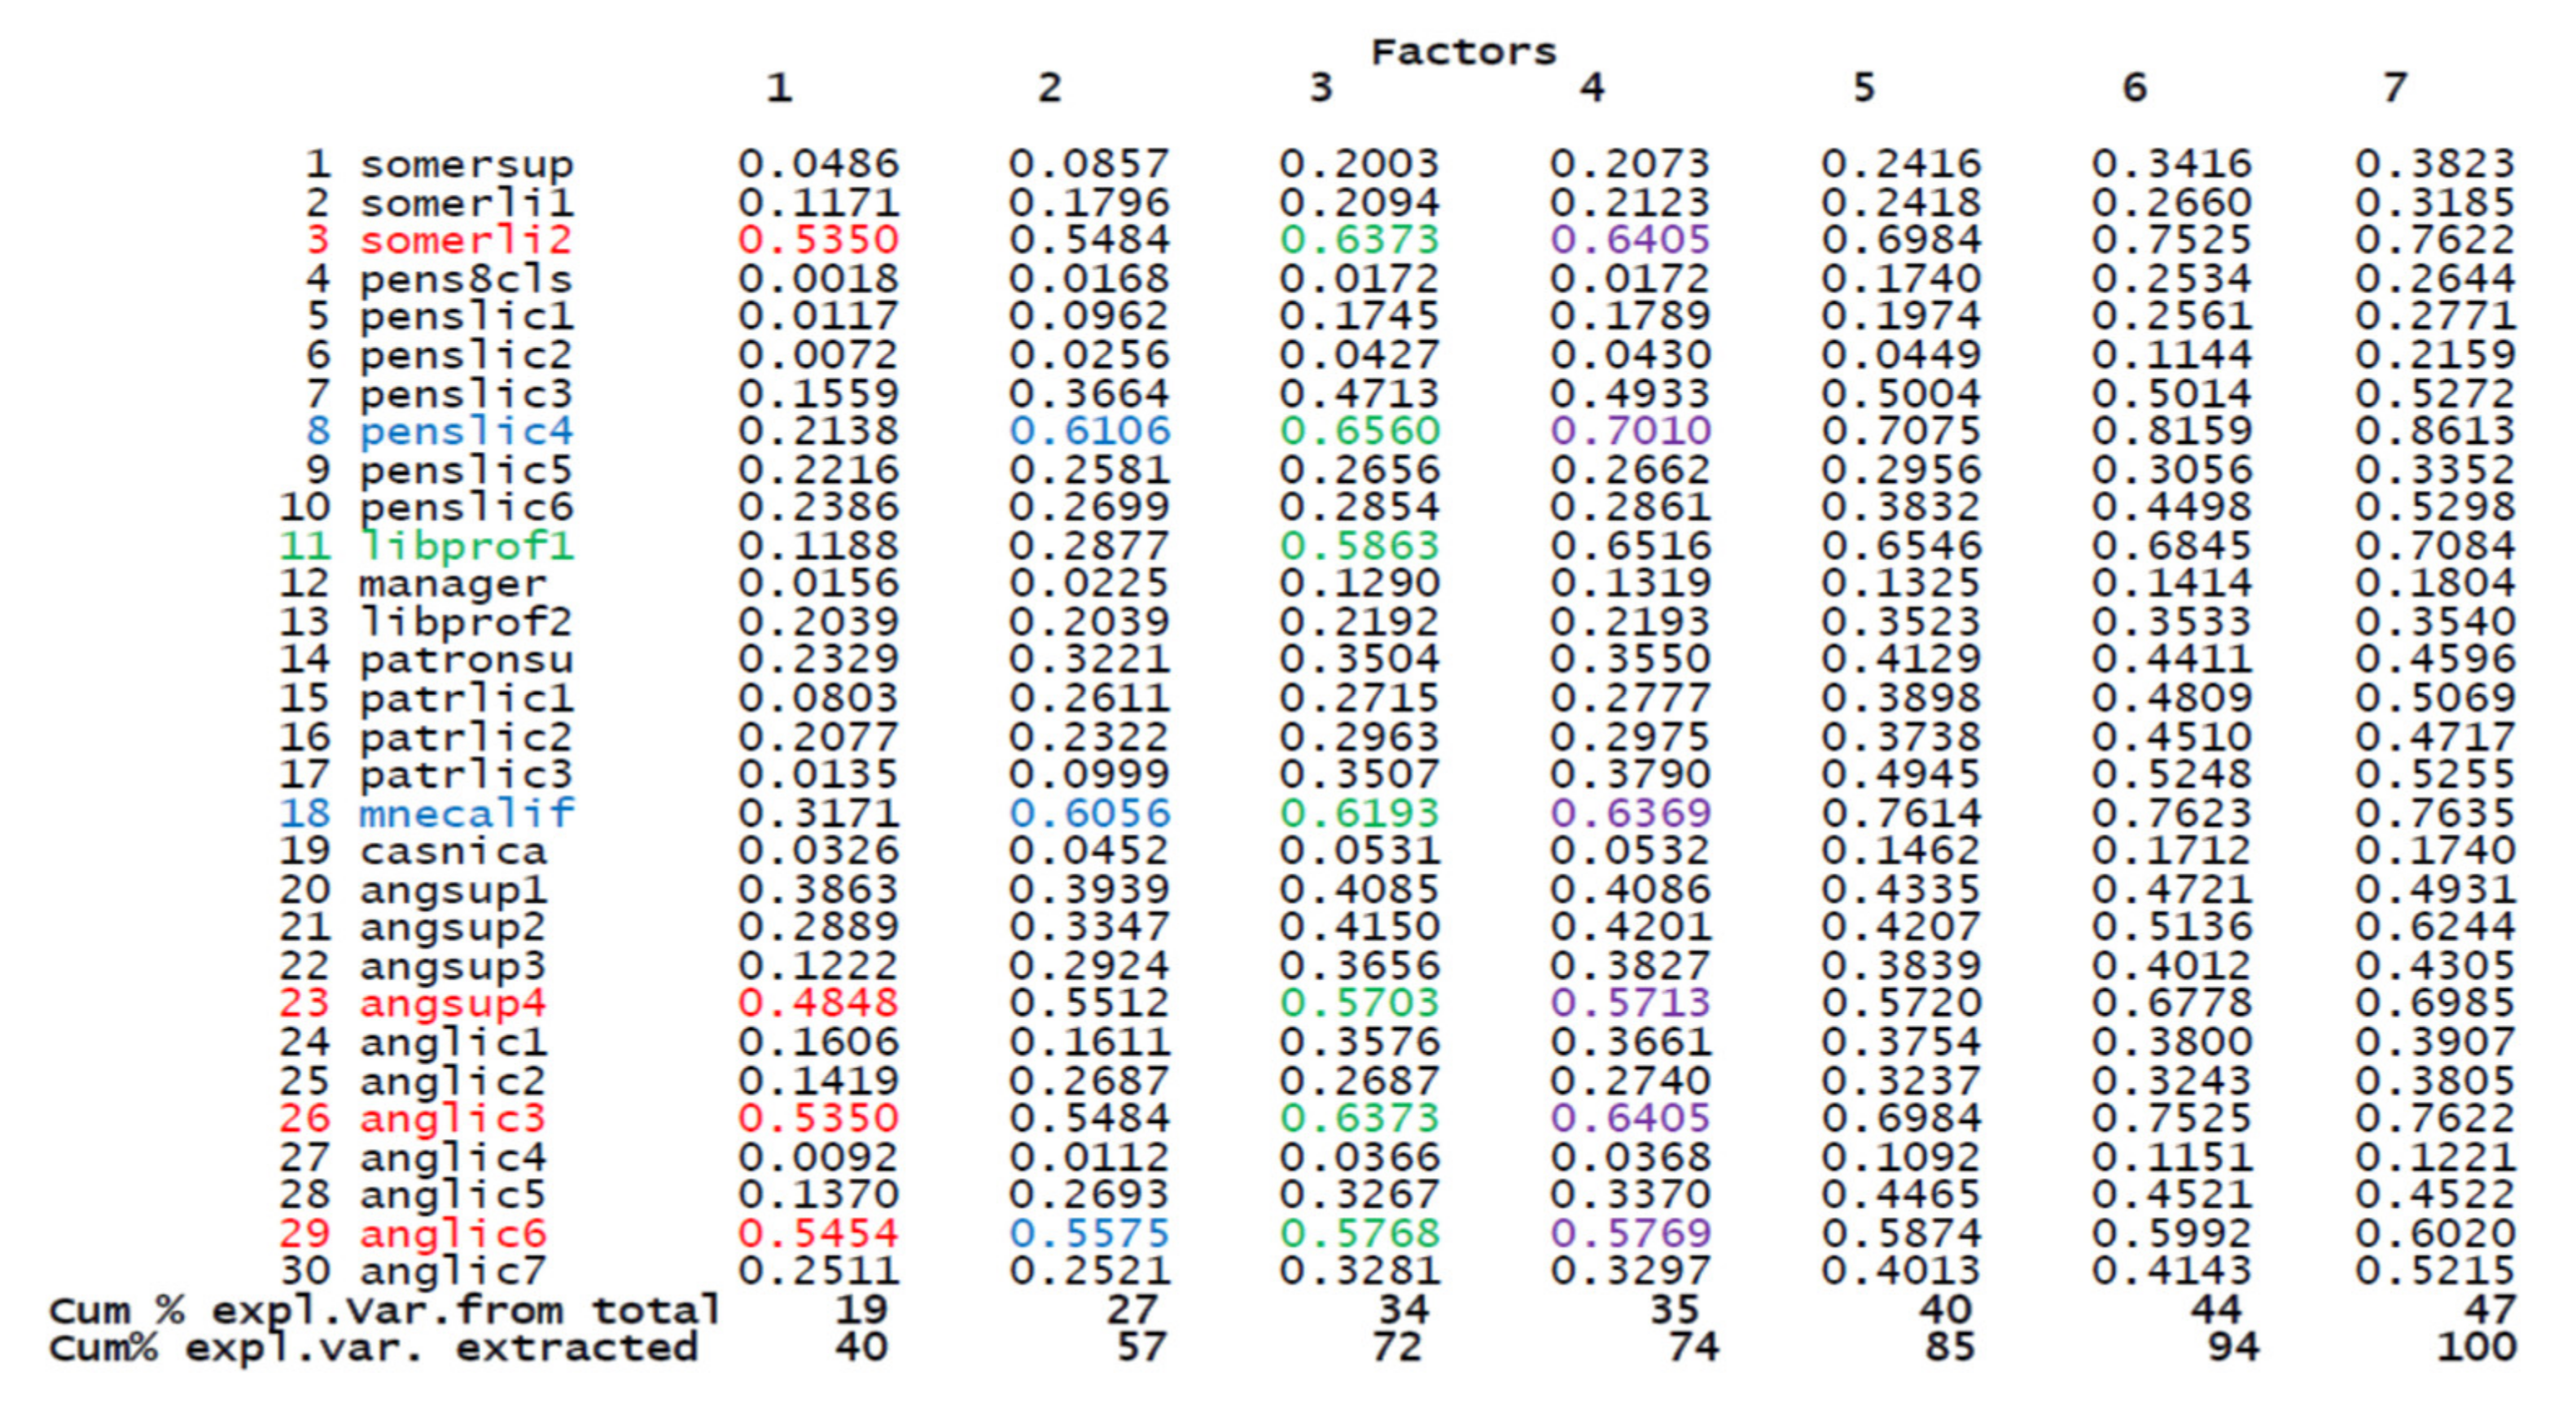
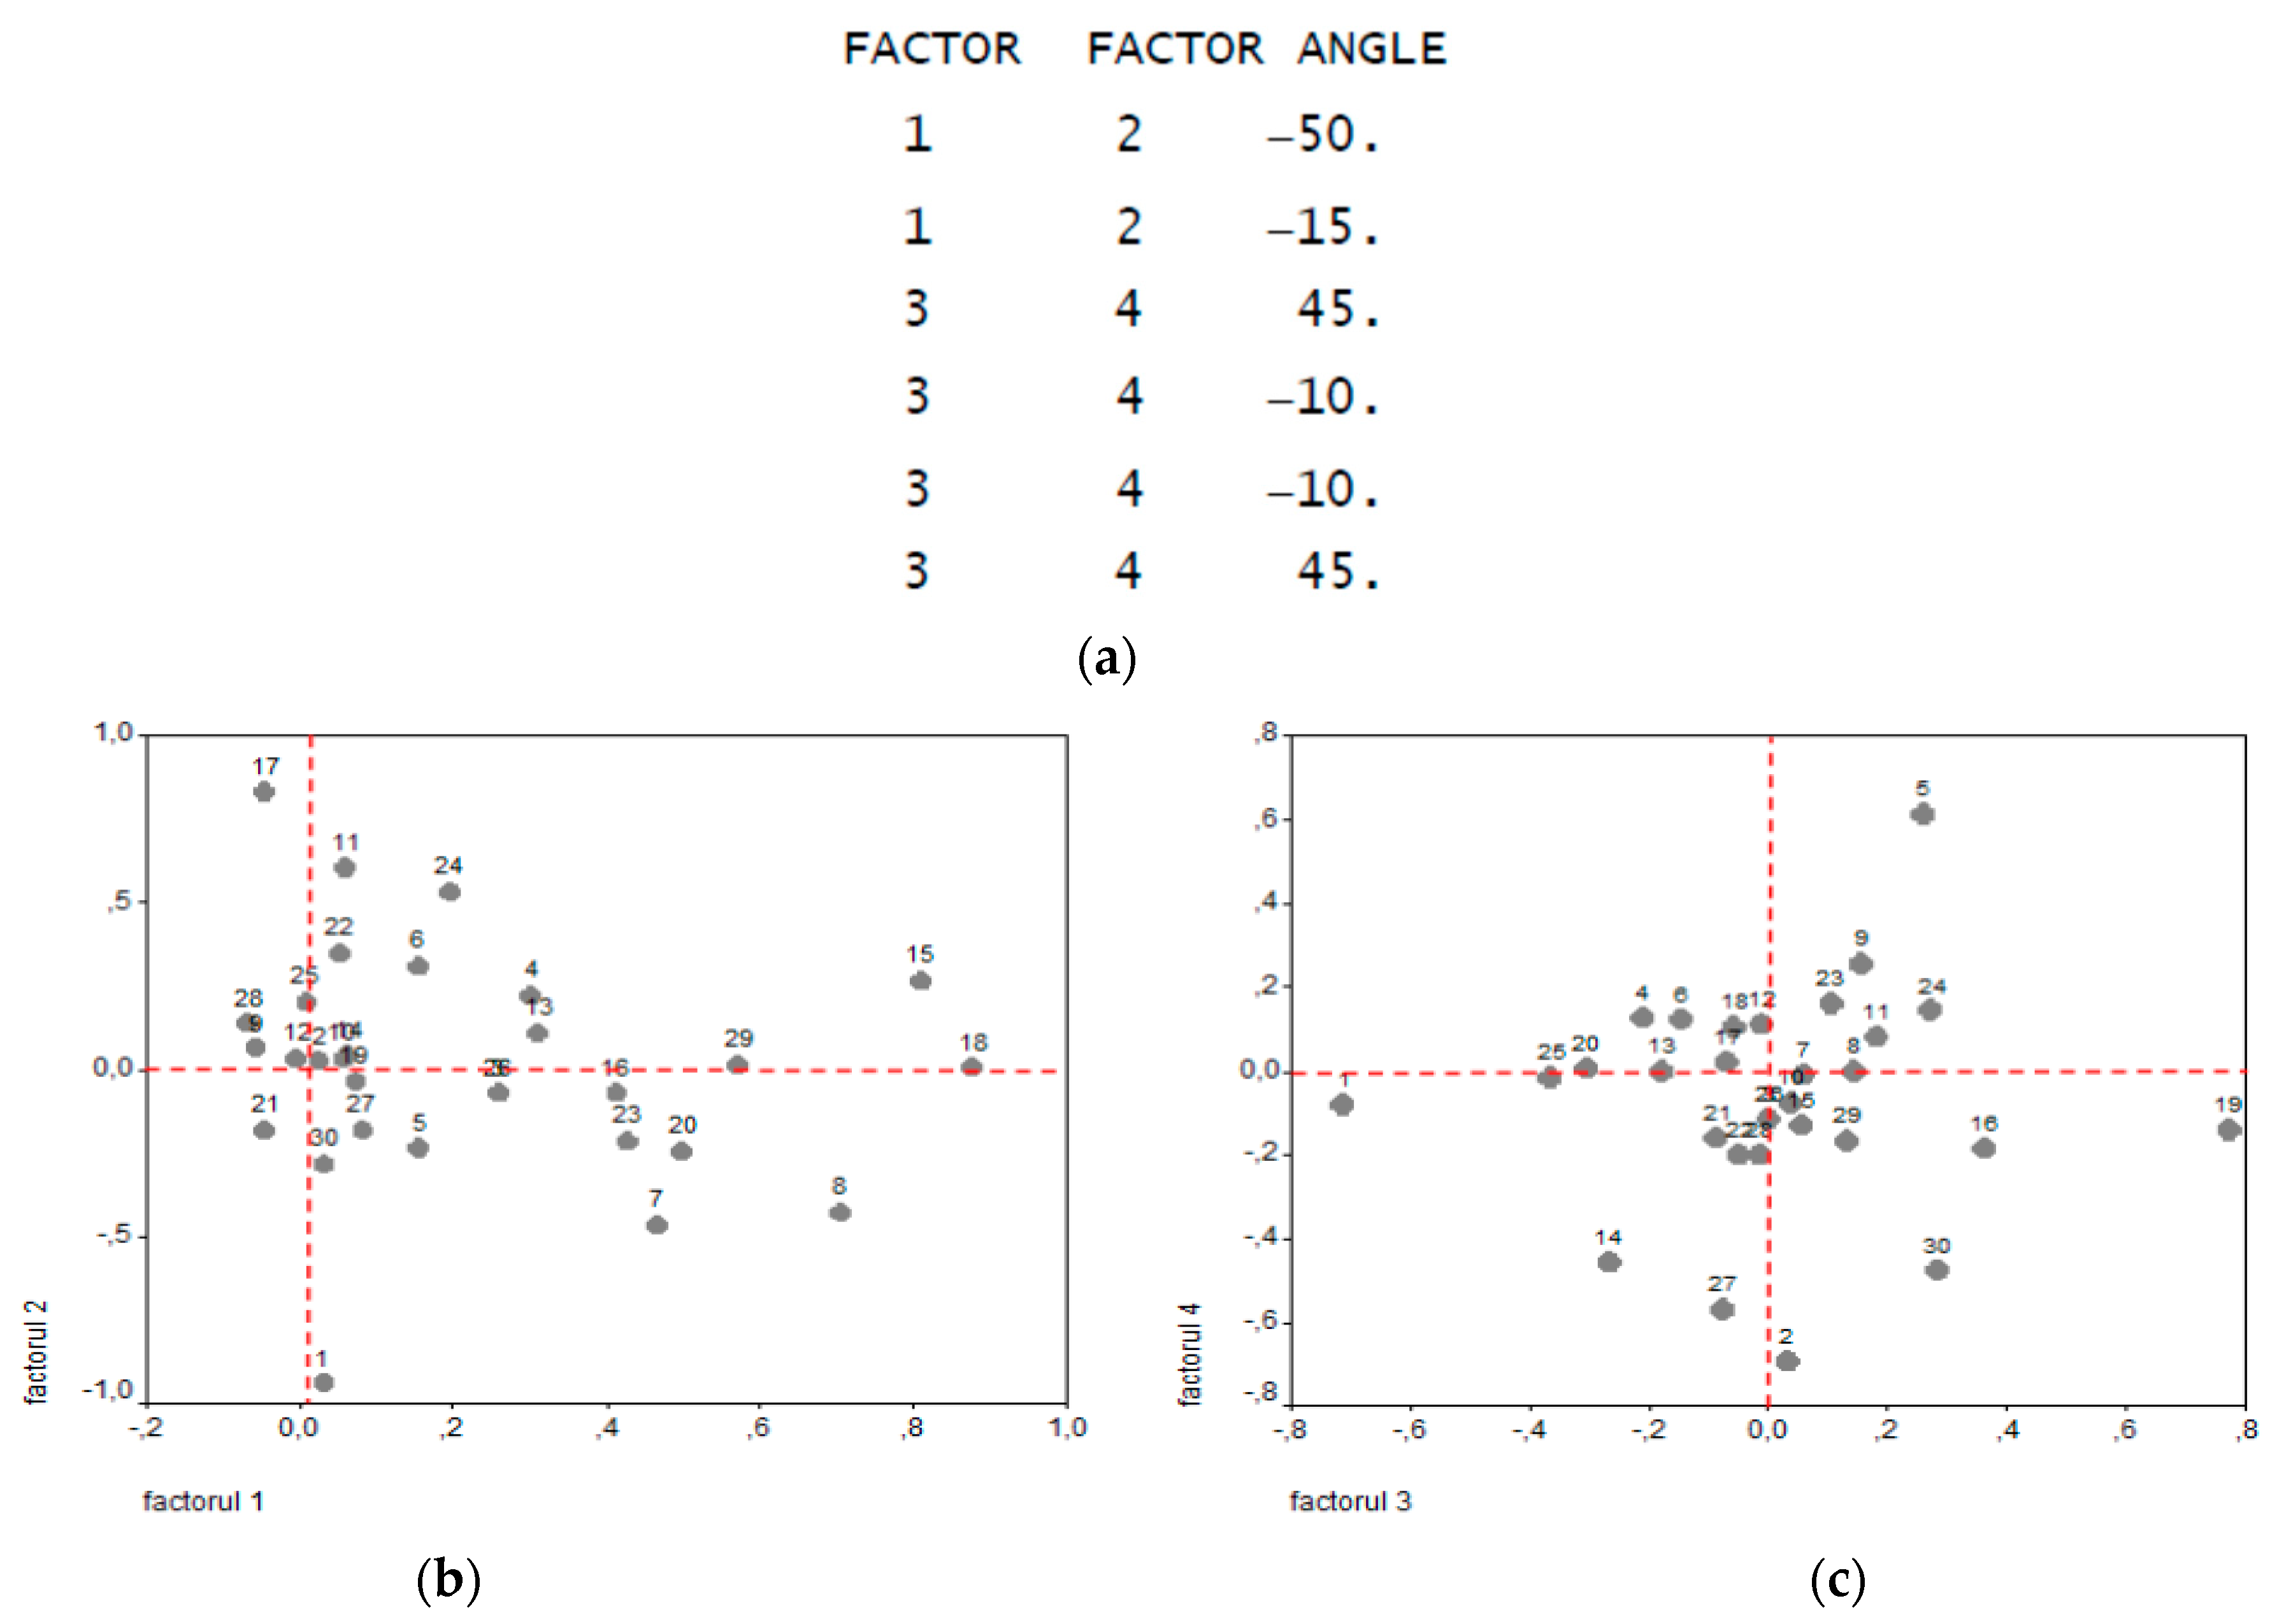
- For factor 1, the best characterization is given by subject 29 (employed with high school), and in descending order of importance, subject 26 and subject 24, also employed with high school, because on the first factor, all employees with secondary education were grouped in the P-sample.
- For factor 2, the opposition of the opinions of the subjects that form this factor is very well highlighted and the grouping of subjects 7 and 8 (high school retirees) tend toward that of subject 18 (unskilled worker).
- For factor 3, the best characterization is given by subject 27 (employed with high school) and an average characterization is given by subject 2 (unemployed with high school).
- For factor 4, the defining characterization belongs to subject 19 (domestic), supplemented by that of subject 1 (unemployed with higher education).
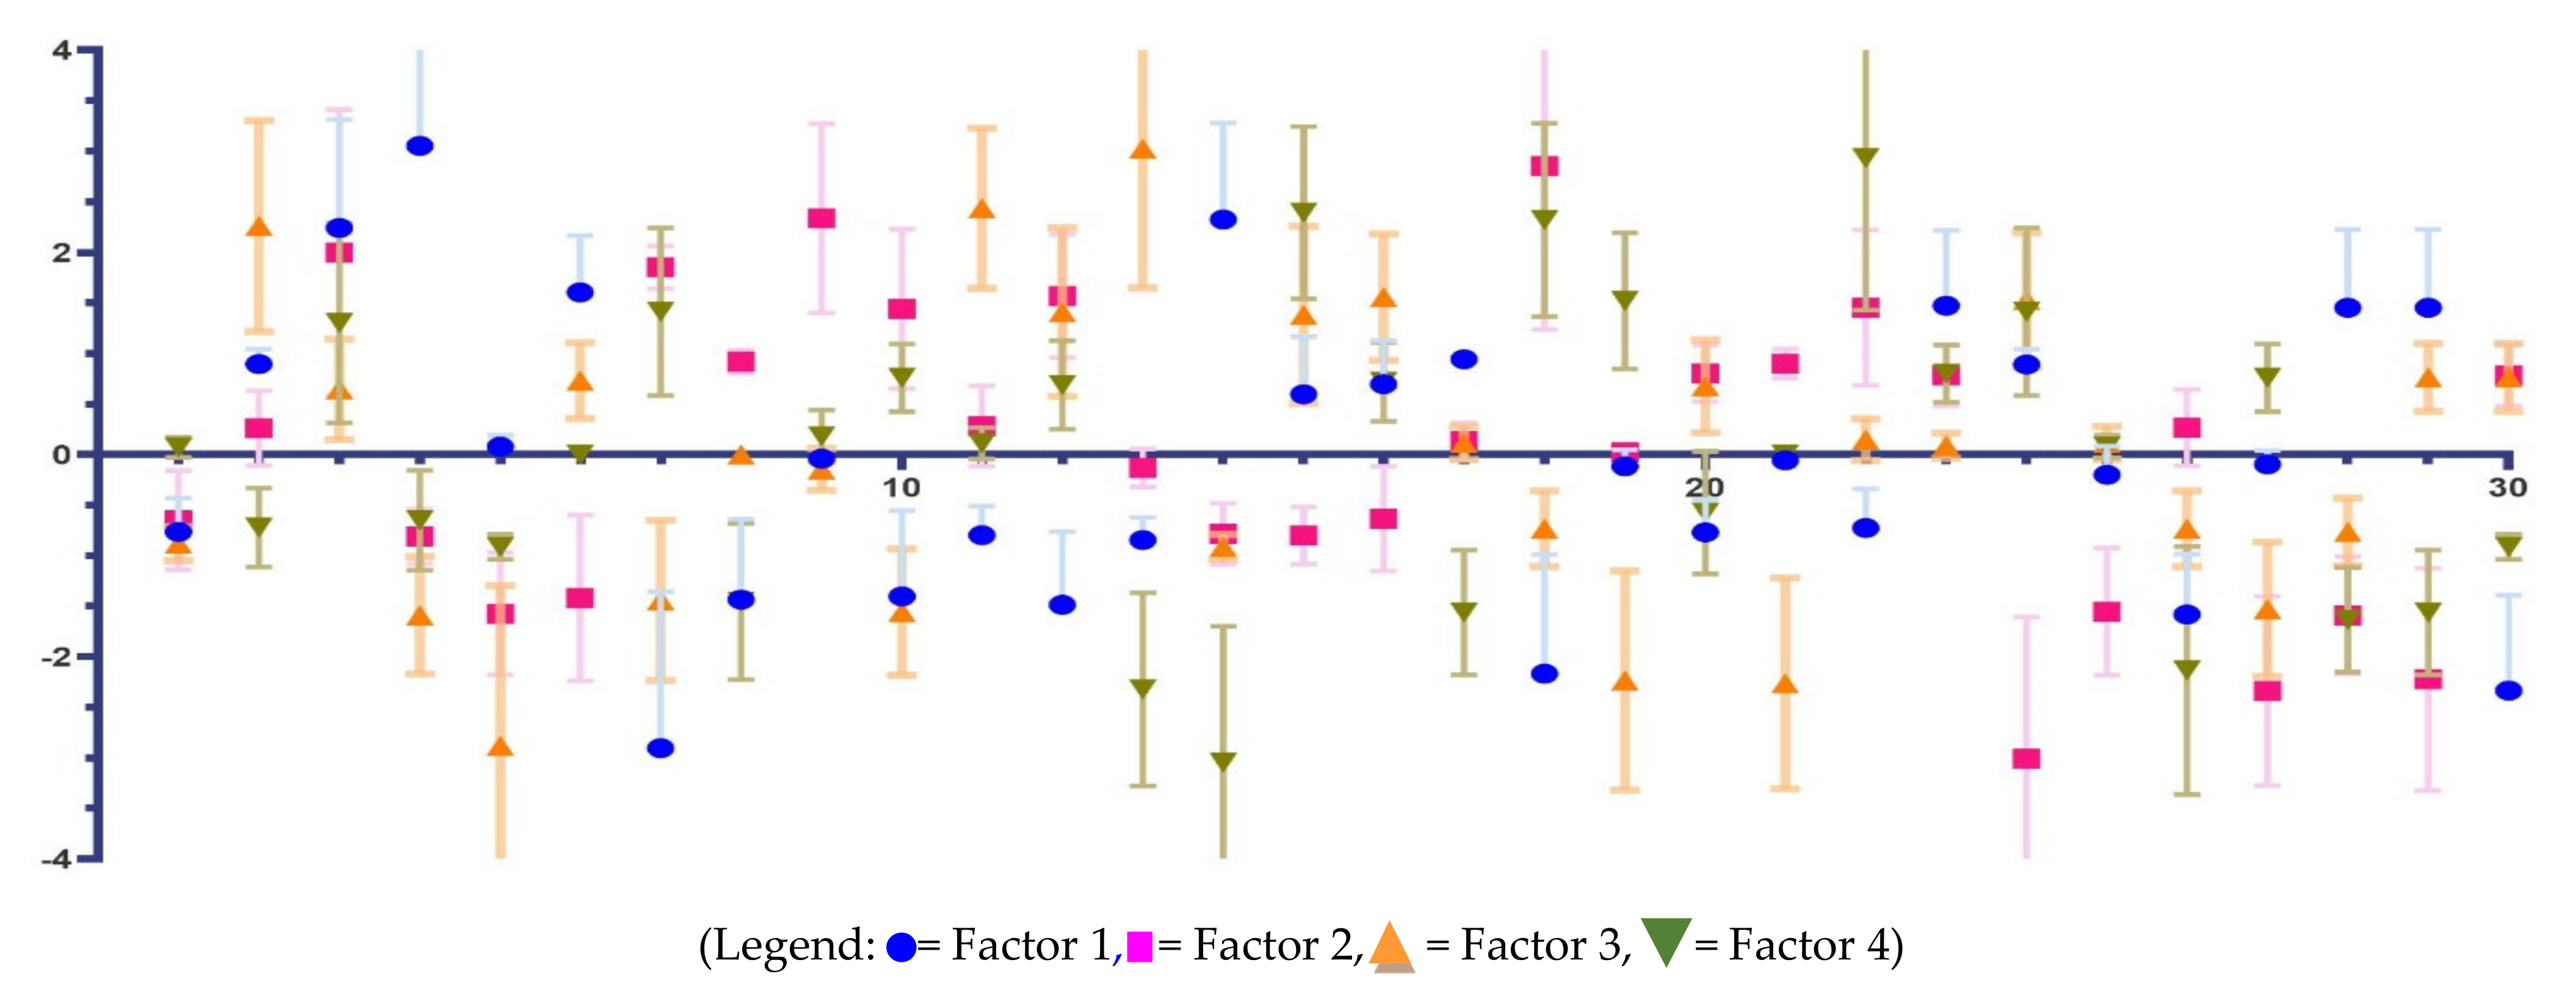
- For factor 1, the highest weight is held by statement 4. The subject that strongly defines this aspect is subject 1—unemployed with higher education. The next highest weights are help by statements 14 and 3, defined by subjects 2 and 3—also unemployed but with high school education. Different statements and, therefore, opposite contributions in the formation of the first factor, have—in descending order of importance—defining statements from subjects 7, 30, 18, 26, 12, and 8—all subjects with high school education. Therefore, this factor is formed by unemployed subjects and those employed with high school education. This cluster formed following the application of the Q methodology on the 30 statements regarding the opinions of the respondents from the marketing research undertaken in Tîrgu Mureş. Therefore, the subjects that form this factor think that “durable goods are a necessary good in any household”, that the reason for purchasing these goods is to increase the needs of the household, and that these goods emit radiation harmful to health, statements with which they agree, opposed to those who refer to the fact that new technologies would be better for health; who are sensitive to promotional periods; who believe that high prices do not imply better quality and brand; who do not agree with the fact that, in every room of the house, there should be a TV; and who are not influenced by the promotion of these goods.
- For factor 2, statements 18, 9, 3, and 7 have the highest positive weights, given by all three unemployed subjects and by subject 4—retired with eight classes. Holding opposite opinions, subjects 24, 27, 29, 28, 5, and 25 are defined as having secondary education in the P-sample; therefore, this second factor consists of the unemployed, employees with high school education, and those retired with high school education. Therefore, the subjects that form the second factor agree that the price is the guarantee of product quality, that they want to have state-of-the-art goods in the house, and that these are healthier than the old products. These opinions are “reinforced” by the opinions that the change in household goods is not always made only for the sake of replacing damaged goods, that the goods purchased for the most part are not purchased in installments, that world-famous brands guarantee product quality, and that Romanian brands do not present a strong competition on the world market.
- For factor 3, the subject characteristic of statement 13 is subject 1—unemployed with higher education and who agrees with the fact that the sales policy adopted by Romanian companies to sell on “credit only with the bulletin” was one that contributed significantly to the increase in living standards in households from Tîrgu Mureş. This opinion is followed by statements 11, 16, and 24 for subjects 2, 4, and 5, i.e., a high school-educated unemployed person, a high school-educated retired person, and a high school-educated retired person; the opposing opinions were formed by the defining statements 5, 21, 19, 4, 10, and 27 for the subjects employed with high school education. Thus, the subjects of the third factor buy brands already tested and do not intend to purchase durable goods in the future unless there is a possibility of financial recovery of the household. However, there are opinions regarding the fact that the short renewal time of households is dictated not by consumers but by producers, that the frequency of the introduction of the latest generation and innovative products on the Romanian market has been synchronized with that on foreign markets and not with some temporary gap, and that the recommendation of friends in purchasing durable goods do not need to be considered.
- For factor 4, the major opinion is held by defining statements 22, 18, and 19 for the unemployed with higher education and high school education and for the high school-educated retired persons whose opinions are in opposition to high school-educated employees who opt for statements 14, 13, 17, 26, 28, and 29. Thus, the subjects of the fourth factor have positive opinions related to the following aspects: the imported durable goods are much better than Romanian ones, the price is the guarantee of quality, and there are some temporary gaps in the introduction of the latest innovations in Romania compared to other world markets. Opposite opinions are in regard to the fact that goods do not emit radiation harmful to health, that producers of goods do not strictly innovate litate “housework”, and that state-of-the-art goods do not have “peppered” prices.
- The sale of durable goods on “credit only with identity card” was a good policy that increased in the standard of living of households.
- The last generations of durable goods are better for health.
- I buy those brands of durable goods for which I received the recommendation of my friends.
- I buy those brands of durable goods that I still have in the household and that are tested.
- the brand of the product means the quality of the product.
- A high price means a guaranteed quality.
- The sale of “second-hand” durable goods has transformed Romanian households into “Europe’s garbage dump”.
- Imported durable goods are better than Romanian brands.
- I do not consider the periods with discounts or holidays when I buy durable goods.
5. Conclusions
Author Contributions
Funding
Institutional Review Board Statement
Informed Consent Statement
Data Availability Statement
Acknowledgments
Conflicts of Interest
Appendix A


References
- Song, S.; Ko, E. Perceptions, attitudes, and behaviors toward sustainable fashion: Application of Q and Q-R methodologies. Int. J. Consum. Stud. 2017, 41, 264–273. [Google Scholar] [CrossRef]
- Van Eijk, C.; Steen, T.; Verschuere, B. Co-producing safety in the local community: A Q-methodology study on the incentives of Belgian and Dutch members of neighborhood watch schemes. Local Gov. Stud. 2017, 43, 323–343. [Google Scholar] [CrossRef]
- Zabala, A. Qmethod: A package to explore human perspectives using Q methodology. R J. 2014, 6, 163–173. [Google Scholar] [CrossRef]
- Gabor, M.R.; Ştefănescu, D.; Conţiu, L.C. Marketing research regarding the technological changes and the endowment with durable goods of Romanian households. In Proceedings of the 6th International Conference “Management of Technological Changes”, Alexandroupolis, Greece, 3–5 September 2009; Volume I, pp. 229–232. [Google Scholar]
- Gabor, M.R.; Ştefănescu, D.; Conţiu, L.C. Statistical methods—components of differentiation strategies of durable goods market in Romania. In Proceedings of the 18th International Economic Conference—IECS 2011, Crises after crises. Inquiries from a national, European and global perspective, Sibiu, Romania, 19–20 May 2011. [Google Scholar]
- Gabor, M.R.; Isaic-Maniu, A. Analysis of the discriminating—applications identifying the preference of endowment with goods. Revista Română de Statistică 2011, 10, 51–77. [Google Scholar]
- Gabor, M.R.; Isaic-Maniu, A. Identificarea principalelor surse de informaţii în achiziţionarea bunurilor de folosinţă îndelungată folosind analiza factorială a corespondenţelor (Identification of the main sources of information in the acquisition of durable goods using factorial correspondence analysis). Studii si Cercetări de Calcul Economic și Cibernetică Economică 2011, 1–2, 55–67. [Google Scholar]
- Gabor, M.R. Positioning of brand concerning durable goods and other variables used in the Romanian consumer’s acquisition process. Actual Probl. Econ. 2012, 8, 357–372. [Google Scholar]
- Gabor, M.R. Are the differences referring to the living standard in Romania according to the occupational status? Empirical research referring to the endowment with durable goods in Romanian households. Ann. Constantin Brancusi Univ. Targu Jiu Econ. Ser. 2012, 3, 117–124. [Google Scholar]
- Gabor, M.R. Endowment of households with durable goods—Indicator of welfare and life quality. Empirical study regarding post-communist behavior of Romanian consumers. Inz. Ekon. Eng. Econ. 2013, 24, 244–253. [Google Scholar] [CrossRef]
- Gabor, M.R. Retailer–consumer relationships for durable goods market in Romania. A multimethod analysis. Int. J. Econ. Behav. 2014, 4, 67–82. [Google Scholar]
- Gabor, M.R.; Conţiu, L.C. Endowment with durable goods—Welfare indicator of Romanian family. In Child and Family Welfare; ASA, Collection; Iovu, M.B., Rață, G., Runcan, P.L., Eds.; Cambridge Scholars Publishing: Newcastle, UK, 2014; pp. 163–173. [Google Scholar]
- Gabor, M.R.; Oltean, F.D. Is the old communist brand preferred by the young consumers? A country of origin study case with multimethod analysis. Risk Contemp. Econ. 2018, 355–366. [Google Scholar] [CrossRef]
- Phelan, C. Identifying entrepreneurial competencies using Q methodology: An innovative research approach. In Book Series, Proceedings of the European Conference on Research Methodology for Business and Management; Academic Conferences and Publishing International Limited: Valletta, Malta, 2015; pp. 322–330. [Google Scholar]
- Kim, K.Y.; Lee, B.G. Marketing insights for mobile advertising and consumer segmentation in the cloud era: A Q-R hybrid methodology and practices. Technol. Forecast. Soc. Chang. 2015, 91, 78–92. [Google Scholar] [CrossRef]
- Bredin, Y.K.; Lindhjem, H.; van Dijk, J.; Linnell, J.D. Mapping value plurality towards ecosystem services in the case of Norwegian wildlife management: A Q analysis. Ecol. Econ. 2015, 118, 198–206. [Google Scholar] [CrossRef]
- Jensen, A.K. A Structured approach to attribute selection in economic valuation studies: Using Q-methodology. Ecol. Econ. 2019, 166, 106400. [Google Scholar] [CrossRef]
- Chung, A.; Kinsey, D.F. An examination of consumers’ subjective views that affect the favorability of organizational logos: An exploratory study using Q methodology. Corp. Reput. Rev. 2019, 22, 89–100. [Google Scholar] [CrossRef]
- Sneegas, G.; Beckner, S.; Brannstrom, C.; Jepson, W.; Lee, K.; Seghezzo, L. Using Q-methodology in environmental sustainability research: A bibliometric analysis and systematic review. Ecol. Econ. 2021, 180, 106864. [Google Scholar] [CrossRef]
- Berghout, M.; Van Exel, J.; Leensvaart, L.; Cramm, J.M. Healthcare professionals’ views on patient-centered care in hospitals. BMC Health Serv. Res. 2015, 15, 1–13. [Google Scholar] [CrossRef] [PubMed]
- Grimshaw, P.; McGowan, L.; McNichol, E. An extra care community’s perceived priority for ‘whole system’ relationships: A Q-methodological study. Health Soc. Care Community 2017, 25, 1169–1180. [Google Scholar] [CrossRef] [PubMed]
- Thammasitboon, S.; Mariscalco, M.M.; Yudkowsky, R.; Hetland, M.D.; Noronha, P.A.; Mrtek, R.G. Exploring individual opinions of potential evaluators in a 360-degree assessment: Four distinct viewpoints of a competent resident. Teach. Learn. Med. 2008, 20, 314–322. [Google Scholar] [CrossRef] [PubMed]
- Palese, A.; Bottega, M.; Cescutti, A.; Caruzzo, D.; Danielis, M.; Fabris, S.; Mattiussi, E.; Grassetti, L. Depicting clinical nurses’ priority perspectives leading to unfinished nursing care: A pilot Q methodology study. J. Nurs. Manag. 2020, 28, 2146–2156. [Google Scholar] [CrossRef]
- Banna, S.; Hasan, H.; Dawson, P. Understanding the diversity of user requirements for interactive online health services. Int. J. Healthc. Technol. Manag. 2016, 15, 253–271. [Google Scholar] [CrossRef]
- Winkler, K.J.; Nicholas, K.A. More than wine: Cultural ecosystem services in vineyard landscapes in England and California. Ecol. Econ. 2016, 124, 86–98. [Google Scholar] [CrossRef]
- Lehong, S.M.; Dube, E.; Angelopoulos, G. An investigation into the perceptions of business stakeholders on the benefits of enterprise architecture: The case of Telkom SA. S. Afr. J. Bus. Manag. 2013, 44, 45–56. [Google Scholar] [CrossRef][Green Version]
- Brown, S.R. Political Subjectivity: Applications of Q Methodology in Political Science; Yale University Press: New Haven, CT, USA, 1980. [Google Scholar]
- Gabor, M.R. Analiza și Inferența Datelor de Marketing; Analysis and Inference of Marketing Data; C. H. Beck: Bucharest, Romania, 2016. [Google Scholar]
- Silvius, G.; Schipper, R. Exploring variety in factors that stimulate project managers to address sustainability issues. Int. J. Proj. Manag. 2020, 38, 353–367. [Google Scholar] [CrossRef]
- Krabbenborg, L.; Molin, E.; Annema, J.A.; van Wee, B. Public frames in the road pricing debate: A Q-methodology study. Transp. Policy 2020, 93, 46–53. [Google Scholar] [CrossRef]
- Liu, C.C.; Chen, J.C.H.; Poon, C.C. Perception types of home buyers by q methodology: A comparative study of Hong Kong, Taiwan, and the USA. Singap. Econ. Rev. 2019, 64, 235–257. [Google Scholar] [CrossRef]
- Pintilescu, C. Analiza datelor; Data analysis; Junimea: Bucharest, Romania, 2003. [Google Scholar]
- Iliescu, D. Metodologia Q; Q Methodology; Comunicare: Bucharest, Romania, 2005. [Google Scholar]
- McKeown, B.; Thomas, D. Q Methodology; (Series University Paper); SAGE Publications: London, UK, 1988. [Google Scholar] [CrossRef]
- Brown, S.R. Q methodology tutorial. Operant Subj. 1993, 16, 91–138. [Google Scholar]
- Hermelingmeier, V.; Nicholas, K.A. Identifying five different perspectives on the ecosystem services concept using Q methodology. Ecol. Econ. 2017, 136, 255–265. [Google Scholar] [CrossRef]
- Q Method. Available online: http://schmolck.org/qmethod/downpqwin.htm (accessed on 1 November 2019).
- Kraak, V.I.; Swinburn, B.; Lawrence, M.; Harrison, P. A Q methodology study of stakeholders’ views about accountability for promoting healthy food environments in England through the Responsibility Deal Food Network. Food Policy 2014, 49, 207–218. [Google Scholar] [CrossRef]
- Andrews, L.; Drennan, J.; Russell-Bennett, R. Linking perceived value of mobile marketing with the experiential consumption of mobile phones. Eur. J. Mark. 2012, 46, 357–386. [Google Scholar] [CrossRef]
- Phi, D.; Dredge, D.; Whitford, M. Understanding conflicting perspectives in event planning and management using Q method. Tour. Manag. 2014, 40, 406–415. [Google Scholar] [CrossRef]
- Griffiths, I.; Sharpley, R. Influences of nationalism on tourist-host relationships. Ann. Tour. Res. 2012, 39, 2051–2072. [Google Scholar] [CrossRef]
- Graph Pad prism 9.0 (free trial). Available online: https://www.graphpad.com/ (accessed on 19 February 2021).
- Visme. Available online: www.visme.co (accessed on 19 February 2021).
- Havlikova, M. Likert scale versus Q-table measures—a comparison of host community perceptions of a film festival. Scand. J. Hosp. Tour. 2016, 16, 196–207. [Google Scholar] [CrossRef]
- Carr, L.M.; Liu, D.Y. Measuring stakeholder perspectives on environmental and community stability in a tourism-dependent economy. Int. J. Tour. Res. 2016, 18, 620–632. [Google Scholar] [CrossRef]
- Cuppen, E.; Bosch-Rekveldt, M.G.; Pikaar, E.; Mehos, D.C. Stakeholder engagement in large-scale energy infrastructure projects: Revealing perspectives using Q methodology. Int. J. Proj. Manag. 2016, 34, 1347–1359. [Google Scholar] [CrossRef]
- Rajé, F. Using Q methodology develop more perceptive insights on transport and social inclusion. Transp. Policy 2007, 14, 467–477. [Google Scholar] [CrossRef]
- Babcock-Lumish, J.L. Venture capital decision-making and the culture of risk; an application of Q methodology to US an UK innovations clusters. Compet. Chang. 2005, 9, 329–356. [Google Scholar] [CrossRef]
- Thomas, D.M.; Watson, R.T. Q—sorting and mis research: A primer. Commun. Assoc. Inf. Syst. 2002, 8, 141156. Available online: http://www.terry.uga.edu/~dominict/Thomas%20and%20Watson%20CAIS%202001.pdf. (accessed on 19 February 2021). [CrossRef]
- Armatas, C.A.; Venn, T.J.; Watson, A.E. Applying Q-methodology to select and define attributes for non-market valuation: A case study from Northwest Wyoming, United States. Ecol. Econ. 2014, 107, 447–456. [Google Scholar] [CrossRef]
- Brewer, G.; Sheldan, S.C.; Facer, R.L., II. Individual conceptions of public service motivation. Public Adm. Rev. 2000, 60, 254–264. [Google Scholar] [CrossRef]
- Tractinsky, N.; Jarvenpaa, S.L. Information systems design decisions in a global versus domestic context. MIS Q. 1995, 19, 507–534. [Google Scholar] [CrossRef]
- Gabor, M.R. Practical examples concerning application of the Q factor analysis for marketing data. Analele Universităţii din Oradea. Seria Ştiinţe Economice 2008, XVII, 866–870. [Google Scholar]
- Gabor, M.R. Q—methodology (Q factor analysis)—particularities and theoretical considerations for marketing data. Int. J. Arts Commer. 2013, 2, 116–126. [Google Scholar]
- Sy, M.M.; Rey-Valette, H.; Simier, M.; Pasqualini, V.; Figuieres, C.; De Wit, R. Identyfying consensus on Coastal Lagoons Ecosystem services and conservation priorities for an effective decision making: A Q approach. Ecol. Econ. 2018, 154, 1–13. [Google Scholar] [CrossRef]
- Kornevs, M.; Hauge, J.B.; Meijer, S. Perceptions of stakeholders in project procurement for road construction. Cogent Bus. Manag. 2018, 5, 1520447. [Google Scholar] [CrossRef]


| Characteristics | Frequencies (%) | |
|---|---|---|
| Gender | Male | 17 (57%) |
| Female | 13 (43%) | |
| Number of persons in the household | 1 person 2 persons 3 persons 4 persons 5 persons | 3 (10%) 8 (27%) 8 (27%) 9 (29%) 2 (7%) |
| Number of children under 18 years old in the household | 1 child 2 children 3 children | 22 (73%) 6 (20%) 2 (7%) |
| Age group | Under 24 years 25–34 years 35–49 years 50–64 years More 65 years | 2 (7%) 4 (13%) 13 (43%) 9 (30%) 2 (7%) |
| Civil status | Unmarried Married Divorced/Widowed | 4 (13%) 24 (80%) 2 (7%) |
| Occupational status | Business owner Retired Self employed Employee with university degree Employee with secondary education Manager Unemployed Household Unqualified worker | 4 (13%) 7 (24%) 2 (7%) 4 (13%) 7 (24%) 1 (3%) 3 (10%) 1 (3%) 1 (3%) |
| Education | Gymnasium/Primary education Secondary education College/university | 1 (3%) 22 (74%) 7 (23%) |
| Net income/month | <1350 lei 1350–3500 lei <3500 lei | 5 (17%) 21 (70%) 4 (13%) |
| Defining Q-Sorts | S (Saturation in Factors) | Rounded (x 10) | |||
|---|---|---|---|---|---|
| Factor 1 | |||||
| 24 employee/sec educ | 0.1969 | 0.19 | 2.60 | 0.49 | 5 |
| 25 employee/sec educ | 0.0094 | 0.01 | 0.02 | 0 | |
| 26 employee/sec educ | 0.2610 | 0.24 | 0.63 | 6 | |
| 27 employee/sec educ | 0.0824 | 0.08 | 0.21 | 2 | |
| 28 employee/sec educ | −0.0670 | −0.07 | −0.17 | −2 | |
| 29 employee/sec educ | 0.5737 | 0.38 | 1 | 10 | |
| 30 employee/sec educ | 0.0320 | 0.03 | 0.08 | 1 | |
| Factor 2 | |||||
| 7 retired/sec educ | −0.4678 | −0.37 | 2.74 | −1 | −10 |
| 8 retired/sec educ | −0.4298 | −0.35 | −0.96 | −10 | |
| 18 unq worker/gymn | 0.0052 | 0.01 | 0.01 | 0 | |
| Factor 3 | |||||
| 2 unempl/sec educ | 0.0336 | 0.03 | 13.34 | 0.45 | 4 |
| 27 empl/sec educ | −0.0754 | −0.07 | −1.00 | −10 | |
| Factor 4 | |||||
| 1 unempl/higher educ | −0.0823 | −0.08 | 7.24 | −0.59 | −6 |
| 19 household | −0.1410 | −0.14 | −1 | −10 | |
| No | Statements of the Q-sorts * | No | The Share of Statements (Q-Sorts) Included in Each of the Four Factors | Normalized and Rounded Scores for Q-Sorts | ||||||||||
|---|---|---|---|---|---|---|---|---|---|---|---|---|---|---|
| Factors and Correspondent Number of Respondent (P) | Factor Arrays | |||||||||||||
| F1 | P | F2 | P | F3 | P | F4 | P | F1 | F2 | F3 | F4 | |||
| 1 | The sale of durable goods on “credit only with the identity card” was a good policy that led to an increase in the standard of living of households | 1 | −0.53 | 20 | −0.57 | 20 | −0.76 | 22 | 0.14 | 16 | −1 | −1 | −1 | 0 |
| 2 | What I always aim when buying durable goods are the technical performance and the energy consumption class, not the price or discounts granted. | 2 | 0.79 | 9 | 0.26 | 15 | 1.52 | 3 | −0.44 | 21 | 1 | 0 | 3 | −1 |
| 3 | The reason why I buy durable goods is to increase the needs of the family, the household | 3 | 1.49 | 3 | 1.22 | 3 | 0.29 | 13 | 0.60 | 8 | 3 | 3 | 0 | 1 |
| 4 | Durable goods are a must in any household | 4 | 2.11 | 1 | −0.84 | 24 | −1.17 | 27 | −0.30 | 20 | 4 | −2 | −2 | −1 |
| 5 | Romanian brands are competitive on the market | 5 | 0.16 | 13 | −1.14 | 26 | −1.76 | 30 | −0.82 | 23 | 0 | −2 | −4 | −1 |
| 6 | Durable goods make household chores easier | 6 | 1.21 | 4 | −0.84 | 24 | 0.47 | 10 | 0 | 18 | 2 | −2 | 1 | 0 |
| 7 | The new technologies for goods are better for health | 7 | −1.81 | 30 | 1.13 | 4 | −0.88 | 24 | 0.82 | 6 | −4 | 2 | −2 | 2 |
| 8 | I am influenced, in the buying decision of durable goods, by TV/ radio/press advertisements | 8 | −0.87 | 25 | 0.80 | 8 | 0.00 | 17 | −0.90 | 24 | −2 | 1 | 0 | −2 |
| 9 | I like to have the last generations of durable goods | 9 | −0.08 | 14 | 1.68 | 2 | −0.29 | 18 | 0.36 | 13 | 0 | 3 | 0 | 0 |
| 10 | I buy those brands of durable goods recommended by the friends | 10 | −0.80 | 24 | 0.84 | 7 | −1.11 | 26 | 0.52 | 10 | −2 | 2 | −2 | 1 |
| 11 | I buy those brands of durable goods that I already have in my household and tested | 11 | −0.59 | 22 | 0.53 | 13 | 1.88 | 2 | 0.22 | 14 | −1 | 0 | 3 | 0 |
| 12 | The brand of the product always means the quality of the product | 12 | −0.97 | 26 | 0.91 | 5 | 0.82 | 6 | 0.38 | 12 | −2 | 2 | 2 | 1 |
| 13 | Manufacturers of durable goods are constantly innovating to make household chores easier and to increase comfort | 13 | −0.69 | 23 | −0.27 | 18 | 2.05 | 1 | −1.65 | 29 | −1 | 0 | 4 | −3 |
| 14 | Durable goods made radiation harmful to health (microwave oven, tube monitors, mobile phones, TVs, etc.) | 14 | 1.65 | 2 | −0.60 | 21 | −0.82 | 23 | −2.09 | 30 | 3 | −1 | −1 | −4 |
| 15 | Romanian durable goods a more qualitative than imported one | 15 | 0.19 | 12 | −0.62 | 22 | 0.76 | 7 | 1.79 | 2 | 1 | −1 | 2 | 3 |
| 16 | Future purchase of durable goods depends on the financial recovery of the household | 16 | 0.39 | 11 | −0.30 | 19 | 1.11 | 4 | 0.44 | 11 | 1 | −1 | 2 | 1 |
| 17 | The late-generations of goods are far too expensive for my purchasing power | 17 | 0.89 | 8 | 0.05 | 16 | 0.23 | 15 | −1.12 | 26 | 1 | 0 | 0 | −2 |
| 18 | A high price means a guaranteed quality | 18 | −1.33 | 28 | 1.71 | 1 | −0.47 | 20 | 1.65 | 3 | −3 | 4 | −1 | 3 |
| 19 | World-renowned brands, producers of durable goods, have introduced late-generation products late in Romania compared to other EU countries | 19 | −0.23 | 17 | −0.26 | 17 | −1.46 | 28 | 1.05 | 4 | 0 | 0 | −3 | 2 |
| 20 | The sale of “second-hand” durable goods has turned Romanian households into “Europe’s garbage dump”. | 20 | −0.54 | 21 | 0.57 | 11 | 0.35 | 11 | −0.14 | 19 | −1 | 1 | 1 | −1 |
| 21 | Reducing the renewal time of the household with durable goods is encouraged by consumers | 21 | −0.11 | 15 | 0.61 | 9 | −1.52 | 29 | 0.00 | 18 | 0 | 1 | −3 | 0 |
| 22 | Imported durable goods are better than Romanian one | 22 | −0.45 | 19 | 0.88 | 6 | 0.29 | 13 | 1.87 | 1 | −1 | 2 | 0 | 4 |
| 23 | Romanian producers of durable goods do not know how to competitively promote their products on foreign markets | 23 | 0.95 | 5 | 0.57 | 11 | 0.18 | 16 | 0.60 | 8 | 2 | 1 | 0 | 1 |
| 24 | I change the durable goods when they break down only | 24 | 0.79 | 10 | −2.02 | 30 | 1.06 | 5 | 0.82 | 6 | 1 | −4 | 2 | 2 |
| 25 | I still have old durable goods in my household (black and white TV, washing machine, sewing machine, Dacia car, refrigerator, stove, etc.) and I still use its | 25 | −0.39 | 18 | −1.11 | 25 | 0.23 | 15 | 0.16 | 15 | 0 | −2 | 0 | 0 |
| 26 | There must be a TV in each room and each family member so that there are no misunderstandings in the family | 26 | −1.16 | 27 | 0.53 | 14 | −0.47 | 20 | −1.27 | 28 | −2 | 0 | −1 | −3 |
| 27 | I bought most of the durable goods by installments (at bank/retailer). | 27 | −0.19 | 16 | −1.67 | 29 | −1.06 | 25 | 0.52 | 10 | 0 | −3 | −2 | 1 |
| 28 | The only reason I buy durable goods is that the old ones are broken | 28 | 0.91 | 6 | −1.18 | 27 | −0.53 | 21 | −1.27 | 28 | 2 | −2 | −1 | −3 |
| 29 | A well-known brand of a durable good is not always a guarantee of product quality | 29 | 0.91 | 7 | −1.45 | 28 | 0.53 | 9 | −1.12 | 26 | 2 | −3 | 1 | −2 |
| 30 | I don’t consider discounted or feast periods (Christmas, Easter, etc.) when I buy durable goods | 30 | −1.67 | 29 | 0.57 | 12 | 0.53 | 9 | −0.82 | 23 | −3 | 1 | 1 | −1 |
| Factors | ||||
|---|---|---|---|---|
| 1 | 2 | 3 | 4 | |
| The number of defining variables | 7 subjects | 3 subjects | 2 subjects | 2 subjects |
| Composite fidelity (>0.800) | 0.800 | 0.800 | 0.889 | 0.889 |
| Standard error of factor scores | 0.186 | 0.277 | 0.333 | 0.333 |
| Standard error of differences in normalized factor scores: | ||||
| 1 | 0.263 | 0.334 | 0.382 | 0.382 |
| 2 | 0.334 | 0.392 | 0.434 | 0.434 |
| 3 | 0.382 | 0.434 | 0.471 | 0.471 |
| 4 | 0.382 | 0.434 | 0.471 | 0.471 |
| Component | |||||
|---|---|---|---|---|---|
| PC1 | PC2 | PC3 | PC4 | PC5 | |
| 1. The sale of durable goods on “credit only with the identity card” was a good policy that led to an increase in the standard of living of households | 0.797 | 0.178 | 0 | 0.142 | 0.339 |
| 5. Romanian brands are competitive on the market | 0.715 | −0.076 | 0.123 | −0.083 | −0.047 |
| 22. Imported durable goods are better than Romanian one | −0.590 | −0.111 | −0.104 | −0.125 | 0.437 |
| 15. Romanian durable goods a more qualitative than imported one | 0.519 | 0.276 | 0.286 | 0.204 | 0.319 |
| 21. Reducing the renewal time of the household with durable goods is encouraged by consumers | −0.485 | −0.026 | 0.042 | 0.280 | 0.234 |
| 9. I like to have the last generations of durable goods | −0.442 | 0.173 | −0.245 | 0.204 | 0.303 |
| 30. I do not consider discounted or feast periods (i.e., Christmas, Easter, etc.) when I buy durable goods | −0.432 | 0.098 | −0.060 | 0.058 | −0.078 |
| 27. I bought most of the durable goods by installments (at bank/retailer). | 0.362 | −0.205 | −0.093 | 0.003 | −0.023 |
| 6. Durable goods make household chores easier | −0.023 | 0.773 | −0.008 | −0.135 | 0.053 |
| 3. The reason why I buy durable goods is to increase the needs of the family, the household | −0.050 | 0.705 | 0.113 | −0.140 | −0.021 |
| 4. Durable goods are a must in any household | 0.111 | 0.609 | 0.123 | 0.324 | 0.158 |
| 2. What I always aim when buying durable goods are the technical performance and the energy consumption class, not the price or discounts granted. | −0.237 | 0.553 | 0.083 | 0.161 | −0.232 |
| 18. A high price means a guaranteed quality | −0.348 | −0.552 | −0.299 | 0.229 | 0.075 |
| 17. The late- generations of goods are far too expensive for my purchasing power re | 0.100 | −0.532 | 0.241 | −0.382 | 0.156 |
| 29. A well-known brand of a durable good is not always a guarantee of product quality | 0.268 | −0.413 | 0.349 | −0.114 | −0.044 |
| 20. The sale of “second-hand” durable goods has turned Romanian households into “Europe’s garbage dump”. | 0.054 | −0.015 | −0.766 | −0.017 | −0.206 |
| 19. World-renowned brands, producers of durable goods, have introduced late-generation products late in Romania compared to other EU countries | 0.285 | −0.204 | −0.698 | −0.258 | 0.201 |
| 11. I buy those brands of durable goods that I already have in my household and tested | −0.155 | 0.046 | −0.630 | −0.006 | 0.194 |
| 12. The brand of the product always means the quality of the product | −0.271 | −0.066 | −0.559 | 0.063 | −0.466 |
| 13. Manufacturers of durable goods are constantly innovating to make household chores easier and to increase comfort | 0.187 | 0.095 | 0.329 | 0.012 | 0.164 |
| 28. The only reason I buy durable goods is that the old ones are broken | 0.147 | 0.056 | 0.325 | −0.231 | −0.203 |
| 10. I buy those brands of durable goods recommended by the friends | −0.088 | −0.244 | 0.088 | 0.751 | 0.045 |
| 24. I change the durable goods when they break down only | 0.117 | −0.383 | 0.228 | −0.683 | −0.073 |
| 16. Future purchase of durable goods depends on the financial recovery of the household | −0.239 | −0.100 | 0.240 | −0.662 | 0.422 |
| 7. The new technologies for goods technologies are better for health | −0.020 | 0.039 | 0.290 | 0.586 | −0.091 |
| 8. I am influenced, in the buying decision of durable goods, by TV/ radio/press advertisements | −0.198 | −0.086 | 0.402 | 0.399 | 0.511 |
| 25. I still have old durable goods in my household (for example: black and white TV, washing machine, sewing machine, Dacia car, refrigerator, stove, etc.) and I still use its | 0.085 | 0.017 | 0.024 | −0.307 | −0.501 |
| 14. Durable goods made radiation harmful to health (microwave oven, tube monitors, mobile phones, TVs, etc.) | 0.000 | −0.268 | 0.248 | 0.054 | −0.501 |
| 23. Romanian producers of durable goods do not know how to competitively promote their products on foreign markets | −0.159 | −0.005 | −0.055 | 0.115 | −0.335 |
| 26. There must be a TV in each room and each family member so that there are no misunderstandings in the family | 0.020 | 0.083 | −0.010 | 0.048 | −0.248 |
| Factor Grouping | Consensual Statements | Differentiating Statements |
|---|---|---|
| Factor 1 and Factor 2 | 3, 1, 19, 13, 21, 20, 11, 22, 10, 8, 26, 9, 12, 30, 7, 18 | 4, 24, 29, 14, 28, 6, 27, 5, 17, 15, 25, 16, 2, 23 |
| Factor 1 and Factor 3 | 29, 10, 1, 9, 24, 15, 25, 26, 16, 2, 22, 18, 8, 20, 7, 12, 30, 11, 13 | 4, 14, 5, 28, 21, 19, 3, 27, 23, 6, 17 |
| Factor 1 and Factor 4 | 23, 26, 8, 24, 16, 21, 20, 9, 25, 1, 27, 11, 30, 19, 10, 12, 15, 22, 7, 18 | 14, 4, 28, 29, 17, 2, 6, 5, 13, 3 |
| Factor 2 and Factor 3 | 23, 4, 14, 20, 1, 12, 30, 17, 27, 28, 2, 6, 11, 25, 15, 16, 29, 13, 24 | 18, 21, 7, 9, 10, 19, 26, 3, 8, 5, 22 |
| Factor 2 and Factor 4 | 10, 11, 7, 28, 18, 23, 5, 29, 4, 1, 16, 6, 22, 25, 19, 27, 15, 24 | 26, 8, 14, 30, 13, 9, 17, 20, 2, 3, 21, 12 |
| Factor 3 and Factor 4 | 6, 12, 24, 25, 3, 23, 9, 4, 1, 5, 15, 21, 22, 27, 10, 7, 18, 19 | 13, 2, 11, 29, 17, 30, 14, 8, 26, 28, 16, 20 |
| Advantages | Limits |
|---|---|
| The process is short. It is a systematic approach in which preferences are categorized. Implementation is easy.It provides a means of studying small samples of population [47]. It can be used together with explanatory research [33]. It captures operant subjectiveness by using auto-references [48]. The participant is not selected randomly.Standard error of factor scores.It can be managed via the Internet (http://qmethod.org) [37]. It protects auto-references issued by individuals by researcher’s influence [49,50]. A Likert scale is not used individually for every item but starts from the relation between items [51]. | The number of choices required from respondents within a relatively short time is high. The number of cards/items/statements introduced in the process is concerning.The perspectives of individuals is temporary and can change with time or under different circumstances [33]. The researcher’s presence adds pressure [48]. Statistical inference of the results is impossible [52]. |
Publisher’s Note: MDPI stays neutral with regard to jurisdictional claims in published maps and institutional affiliations. |
© 2021 by the authors. Licensee MDPI, Basel, Switzerland. This article is an open access article distributed under the terms and conditions of the Creative Commons Attribution (CC BY) license (https://creativecommons.org/licenses/by/4.0/).
Share and Cite
Gabor, M.R.; Cristache, N. Q or R Factor Analysis for Subjectiveness Measurement in Consumer Behavior? A Study Case on Durable Goods Buying Behavior in Romania. Mathematics 2021, 9, 1136. https://doi.org/10.3390/math9101136
Gabor MR, Cristache N. Q or R Factor Analysis for Subjectiveness Measurement in Consumer Behavior? A Study Case on Durable Goods Buying Behavior in Romania. Mathematics. 2021; 9(10):1136. https://doi.org/10.3390/math9101136
Chicago/Turabian StyleGabor, Manuela Rozalia, and Nicoleta Cristache. 2021. "Q or R Factor Analysis for Subjectiveness Measurement in Consumer Behavior? A Study Case on Durable Goods Buying Behavior in Romania" Mathematics 9, no. 10: 1136. https://doi.org/10.3390/math9101136
APA StyleGabor, M. R., & Cristache, N. (2021). Q or R Factor Analysis for Subjectiveness Measurement in Consumer Behavior? A Study Case on Durable Goods Buying Behavior in Romania. Mathematics, 9(10), 1136. https://doi.org/10.3390/math9101136