
Optimization Method to Address Psychosocial Risks through Adaptation of the Multidimensional Knapsack Problem

 ,
,  ,
,  ,
,  and
and
Abstract
1. Introduction
2. Materials and Methods
2.1. Materials and Background
2.1.1. Psychosocial Risk Factors
- Psychosocial stressors: These imply stressful worker demands such as the workload, autonomy offered by the position, support, or harassment from the boss.
- Coping strategies: These are related to the internal processes of the individual, such as their perception and the way they react to events, among others.
- Family work relationships: These are the extra-work aspects that affect the work environment. This relationship is a dimension little considered in the workplace.
- Improve the ability to respond to regulatory compliance issues.
- Avoid incidents and thus reduce costs to companies.
- Reduce downtime and downtime costs.
- Reduce the cost of insurance premiums.
- Reduce absences and employee turnover rates.
- Recognition for having achieved an international goal (which in turn can influence clients who are concerned about their social responsibilities).
2.1.2. Multidimensional Knapsack Problem
2.1.3. The Simulated Annealing Algorithm
2.2. Propoused Methodology
- Construct the cost matrices of the areas or departments that address the PSR factors (a minimum of four is suggested: training, communication, industrial safety with non-conformity mechanisms, and human resources with social support actions). Assign the maximum budget for each department.
- Map the PSR optimization problem as an MKP using the previously obtained data.
- Tune and apply the SA algorithm to solve the PSR factors optimization problem.
- Generate reports to comply with regulations and provide the maximum benefit to the company’s labor wellbeing.
2.2.1. Identification of PSR Factors and Generation of Cost Matrices
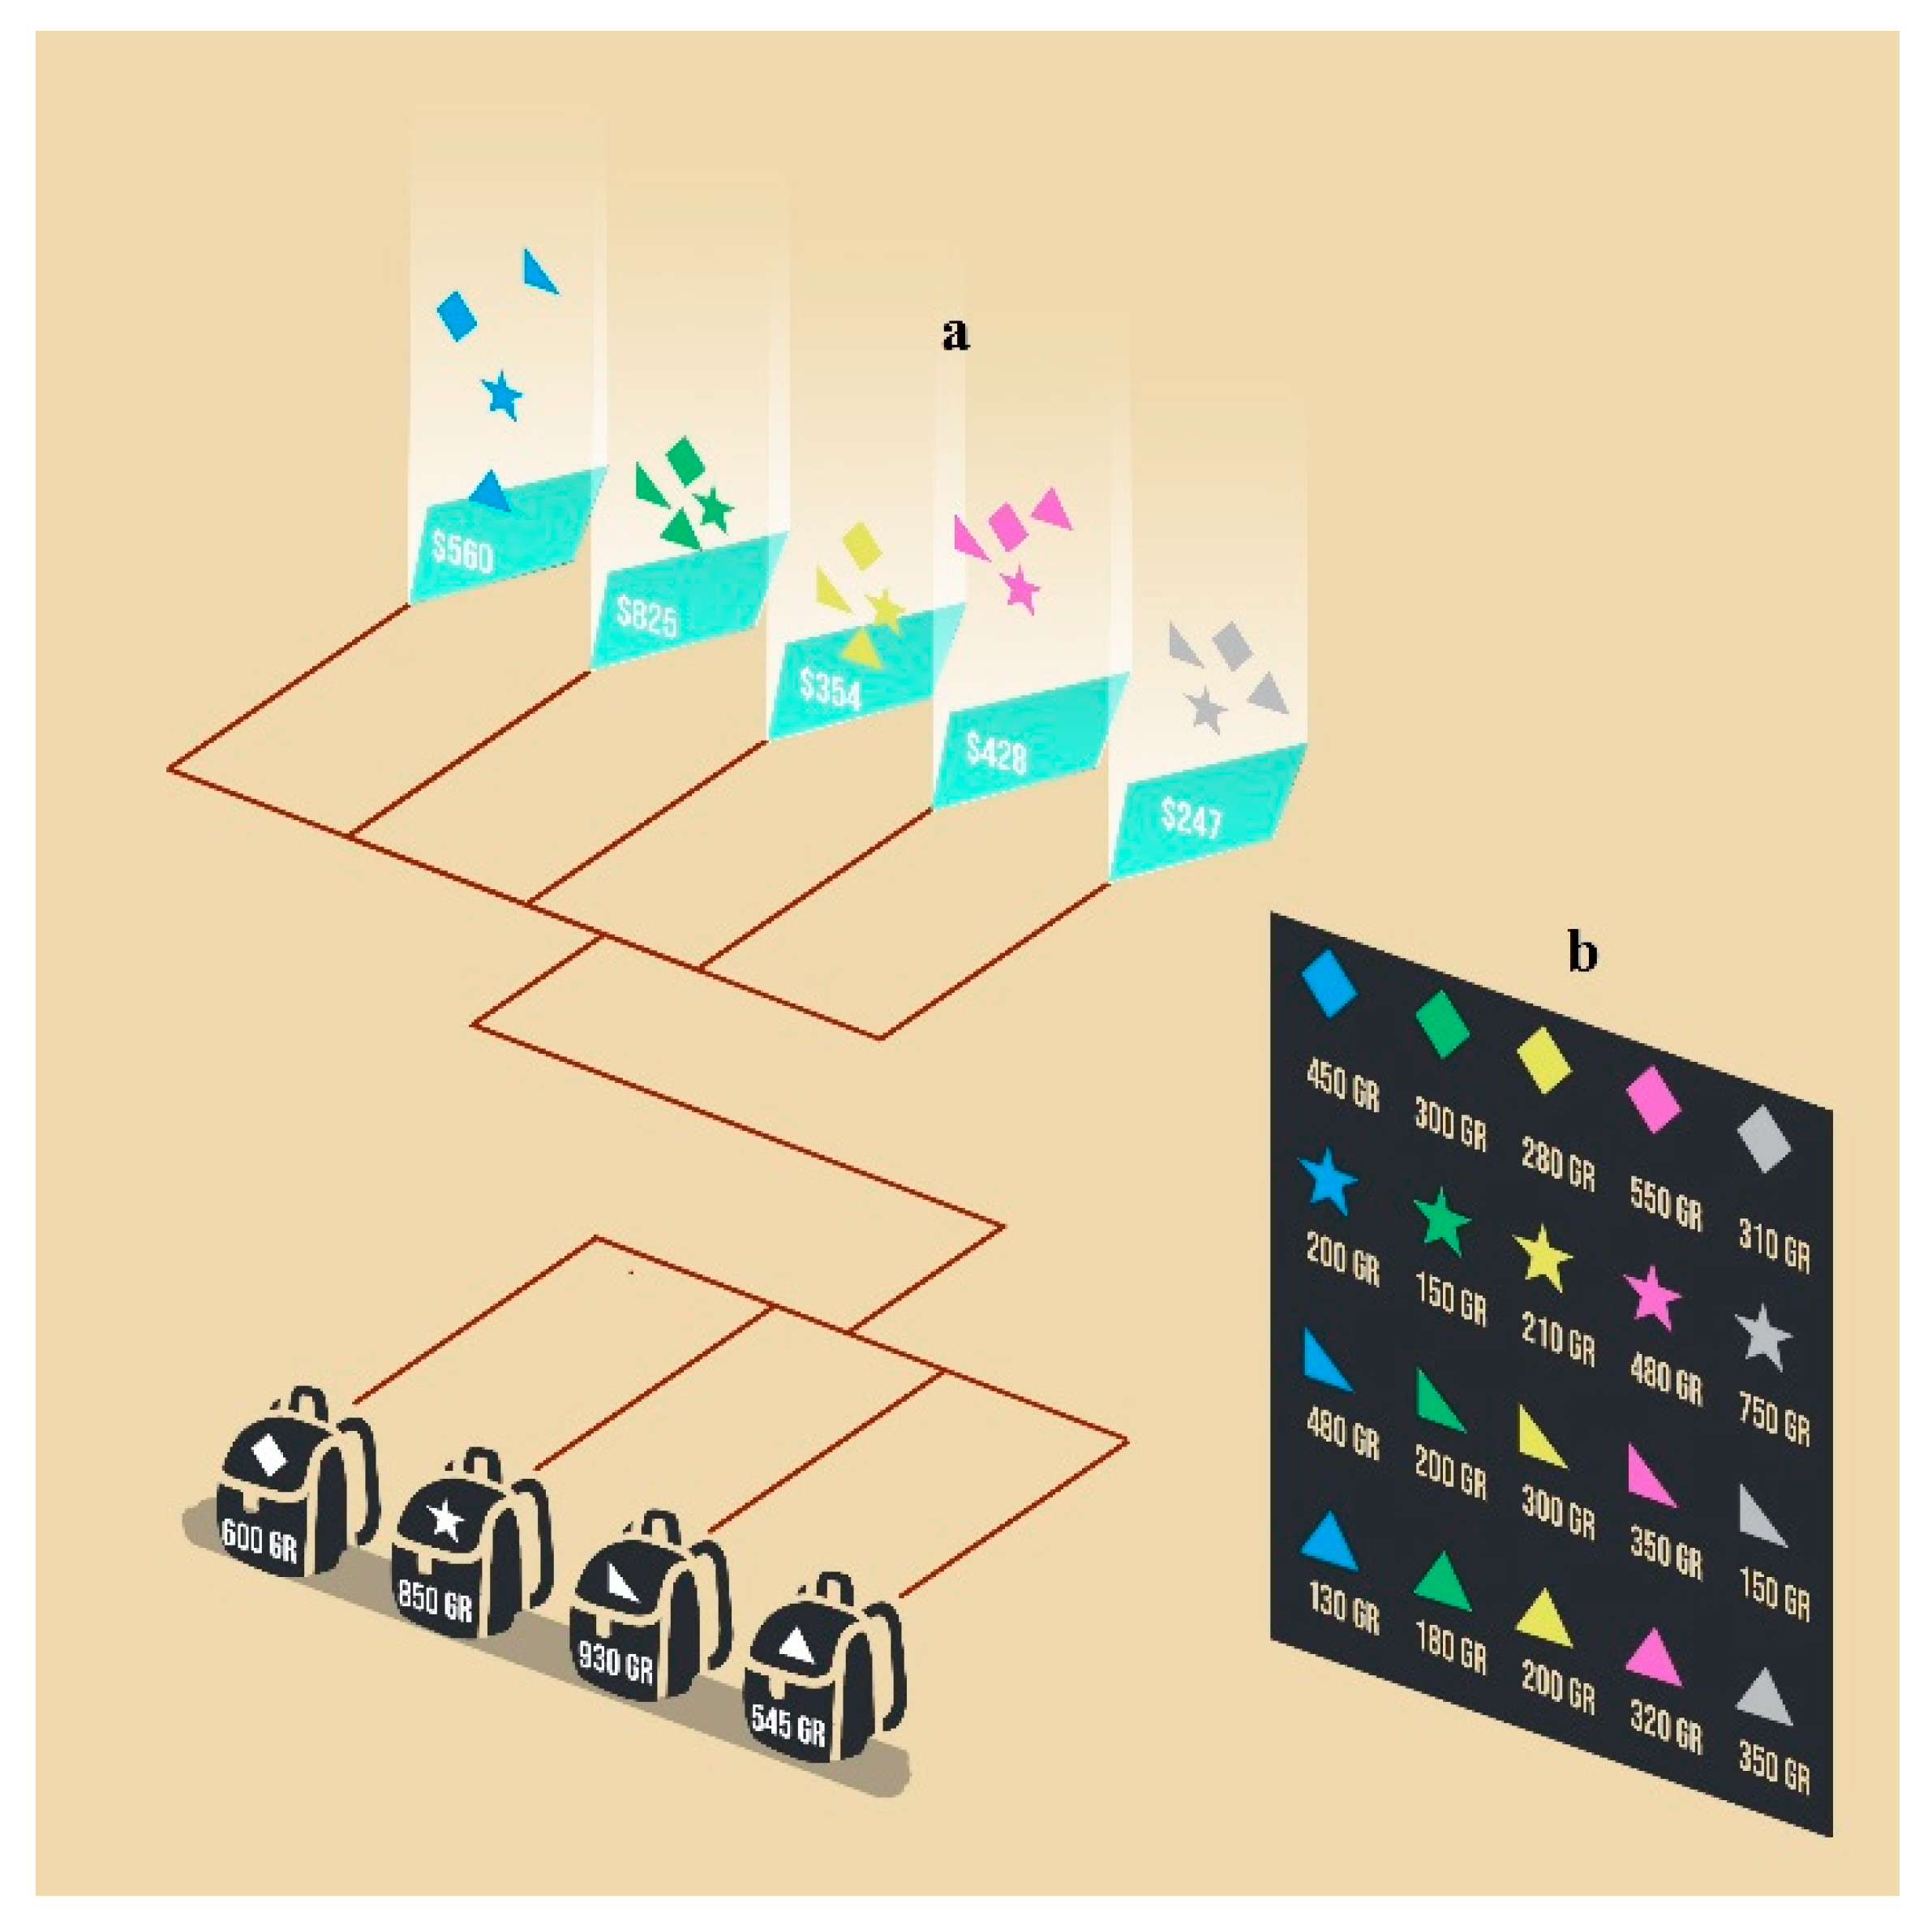
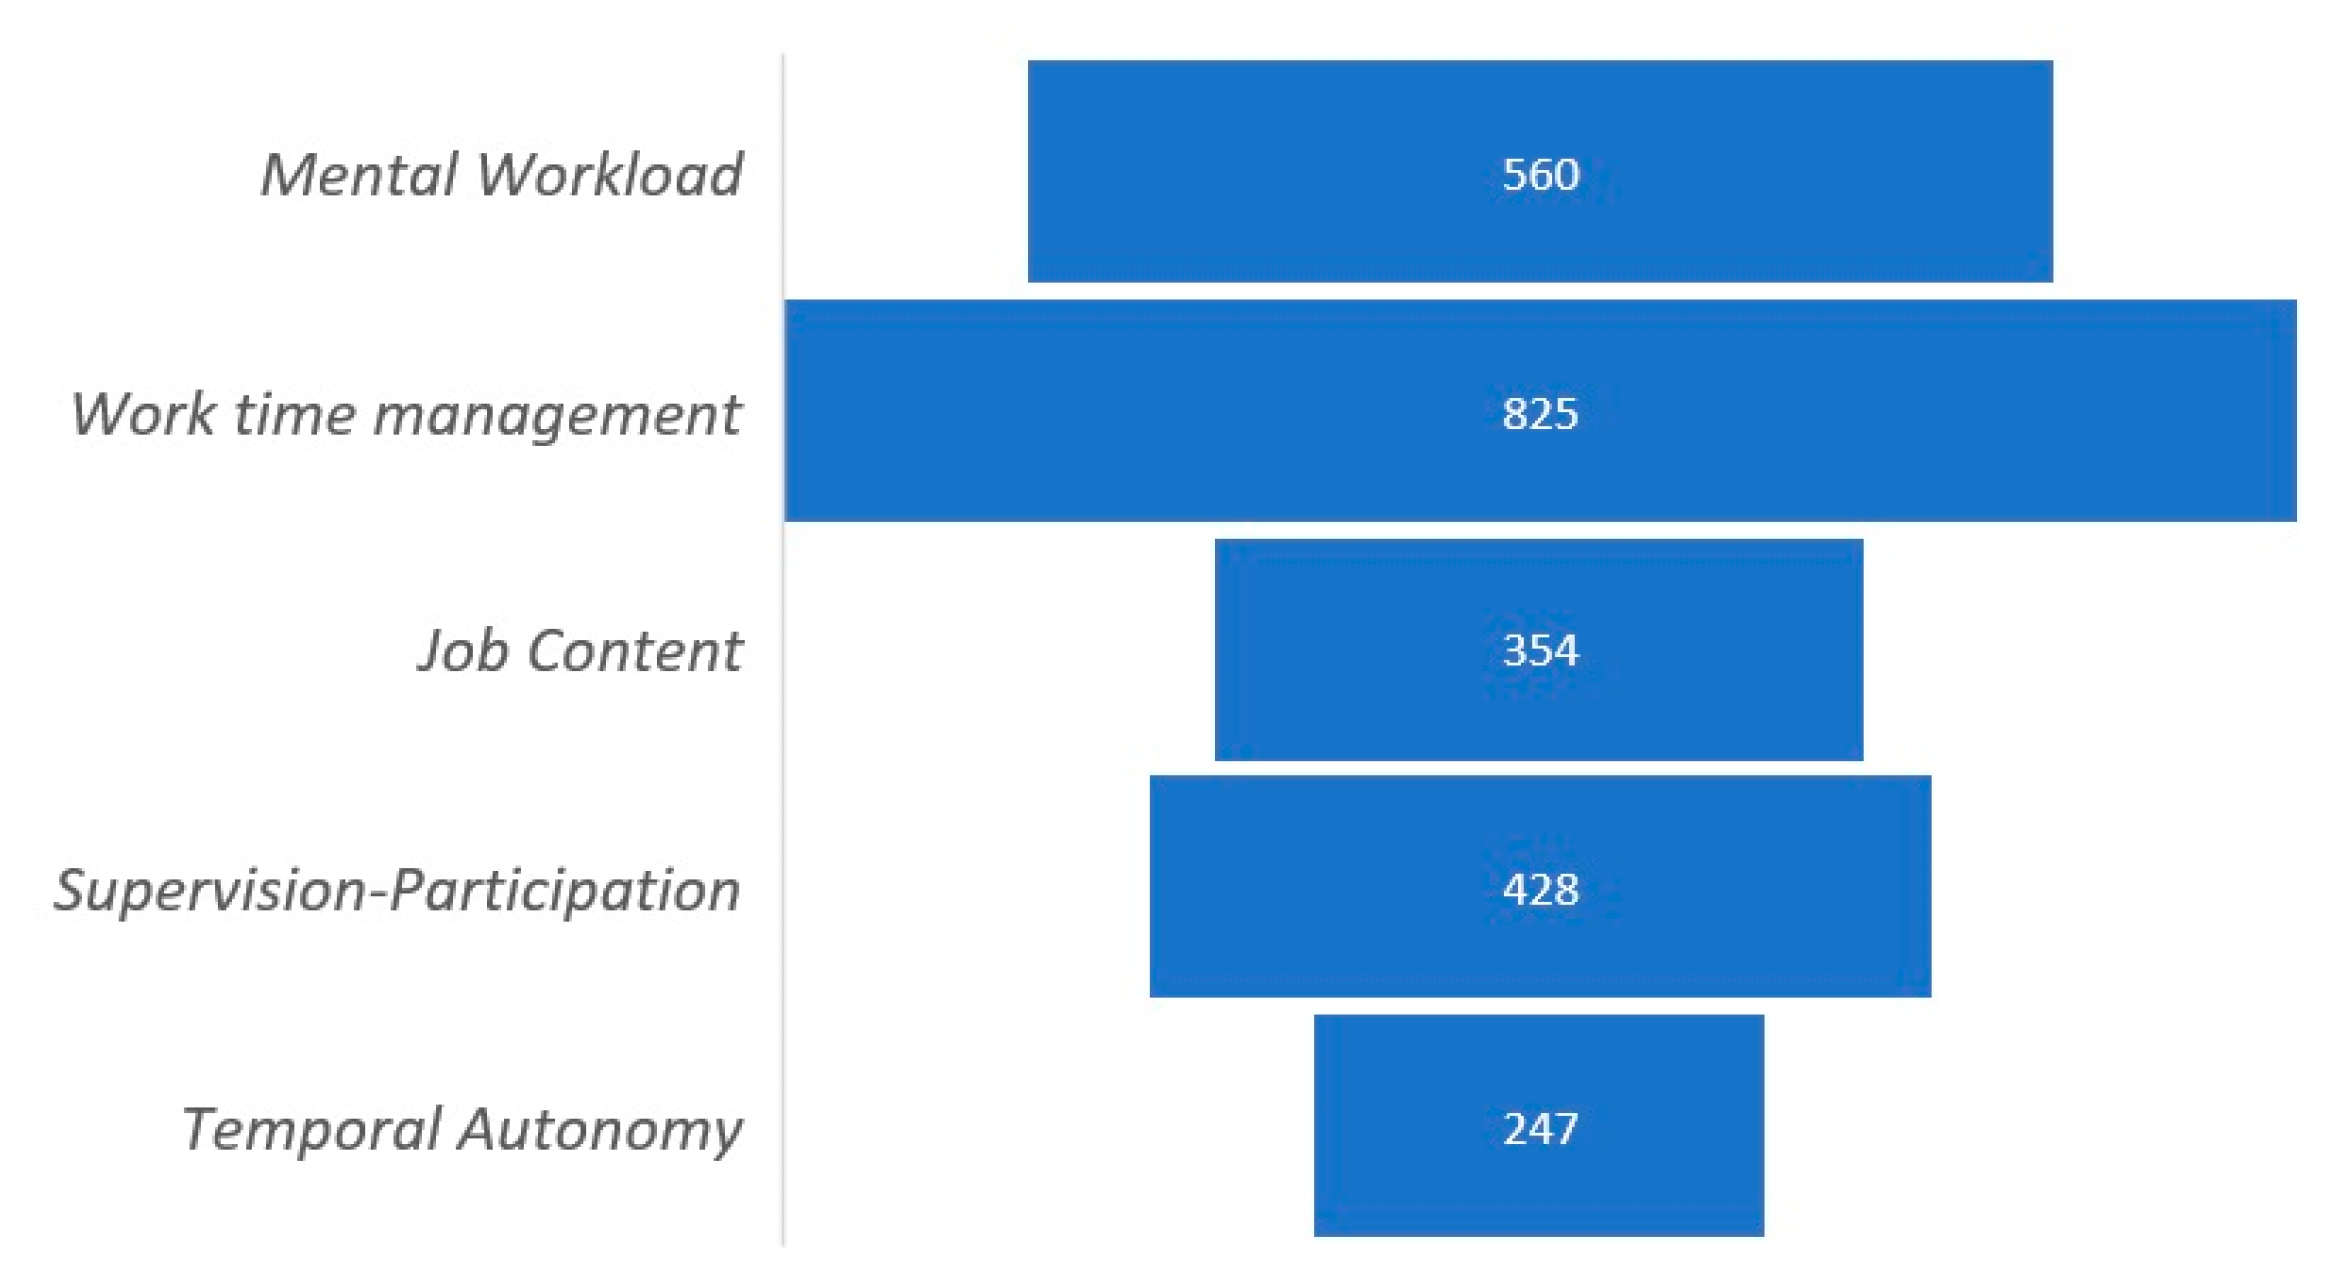
2.2.2. Mapping the PSR Optimization Problem as an MKP
2.2.3. The SA Algorithm Structure
| Algorithm 1. Simulated annealing. |
| 1 Introduce fSD and Vm; Assign T0 = fSD |
| 2 Calculate a feasible initial solution w0 |
| 3 Assign w = w0; wopt = w0, T = T0; M = Vm * (n × m) |
| 4 repeat |
| 5 Initialize counter m = 0 |
| 6 for m = 0 to M do |
| 7 Generate new solution w’ = Ω(w) |
| 8 Calculate Δ = f(w’) − f(w) |
| 9 if Δ > 0 then |
| 10 w = w’ |
| 11 else |
| 12 Generate random ρ(0,1) |
| 13 if ρ ≤ eΔ/T then |
| 14 w = w’ |
| 15 end if |
| 16 end else |
| 17 if wopt < w then |
| 18 wopt = w |
| 19 end if |
| 20 end for |
| 21 T = α × T |
| 22 until T ≤ β × T0 |
3. Results
3.1. Test Scenario for the HP1 MKP Benchmark Problem
3.1.1. Test Scenario for Thirty MKP Benchmark Problems
- CF-LAS (Choice Function-Late acceptance strategy) [33] is a hyper-heuristic with crossover operator performed on an Intel Core 2 Duo 3GHz CPU machine with 2 GB RAM.
- RSH (Reduce and Solve Heuristic) [34] coded in C ++ and tested on a PC Intel i5 2.6 GHz CPU, 6 GB RAM.
- ICA (Imperialist Competitive Algorithm) [35] also coded in C ++ and run on an AMD Threadripper 2990WX, 3.0 GHz CPU, 64 GB RAM, Windows 10 Pro.
- ACO DI (Ant colony optimization with Dynamic Impact) [36] coded in C ++.
- 3R-SACRO-PSO (Three-ratio Self-Adaptive Check and Repair Operator-inspired Particle Swarm Optimization) [37] implemented in C and tested using an Intel Core i7 3.4 GHz CPU, 16 GB RAM.
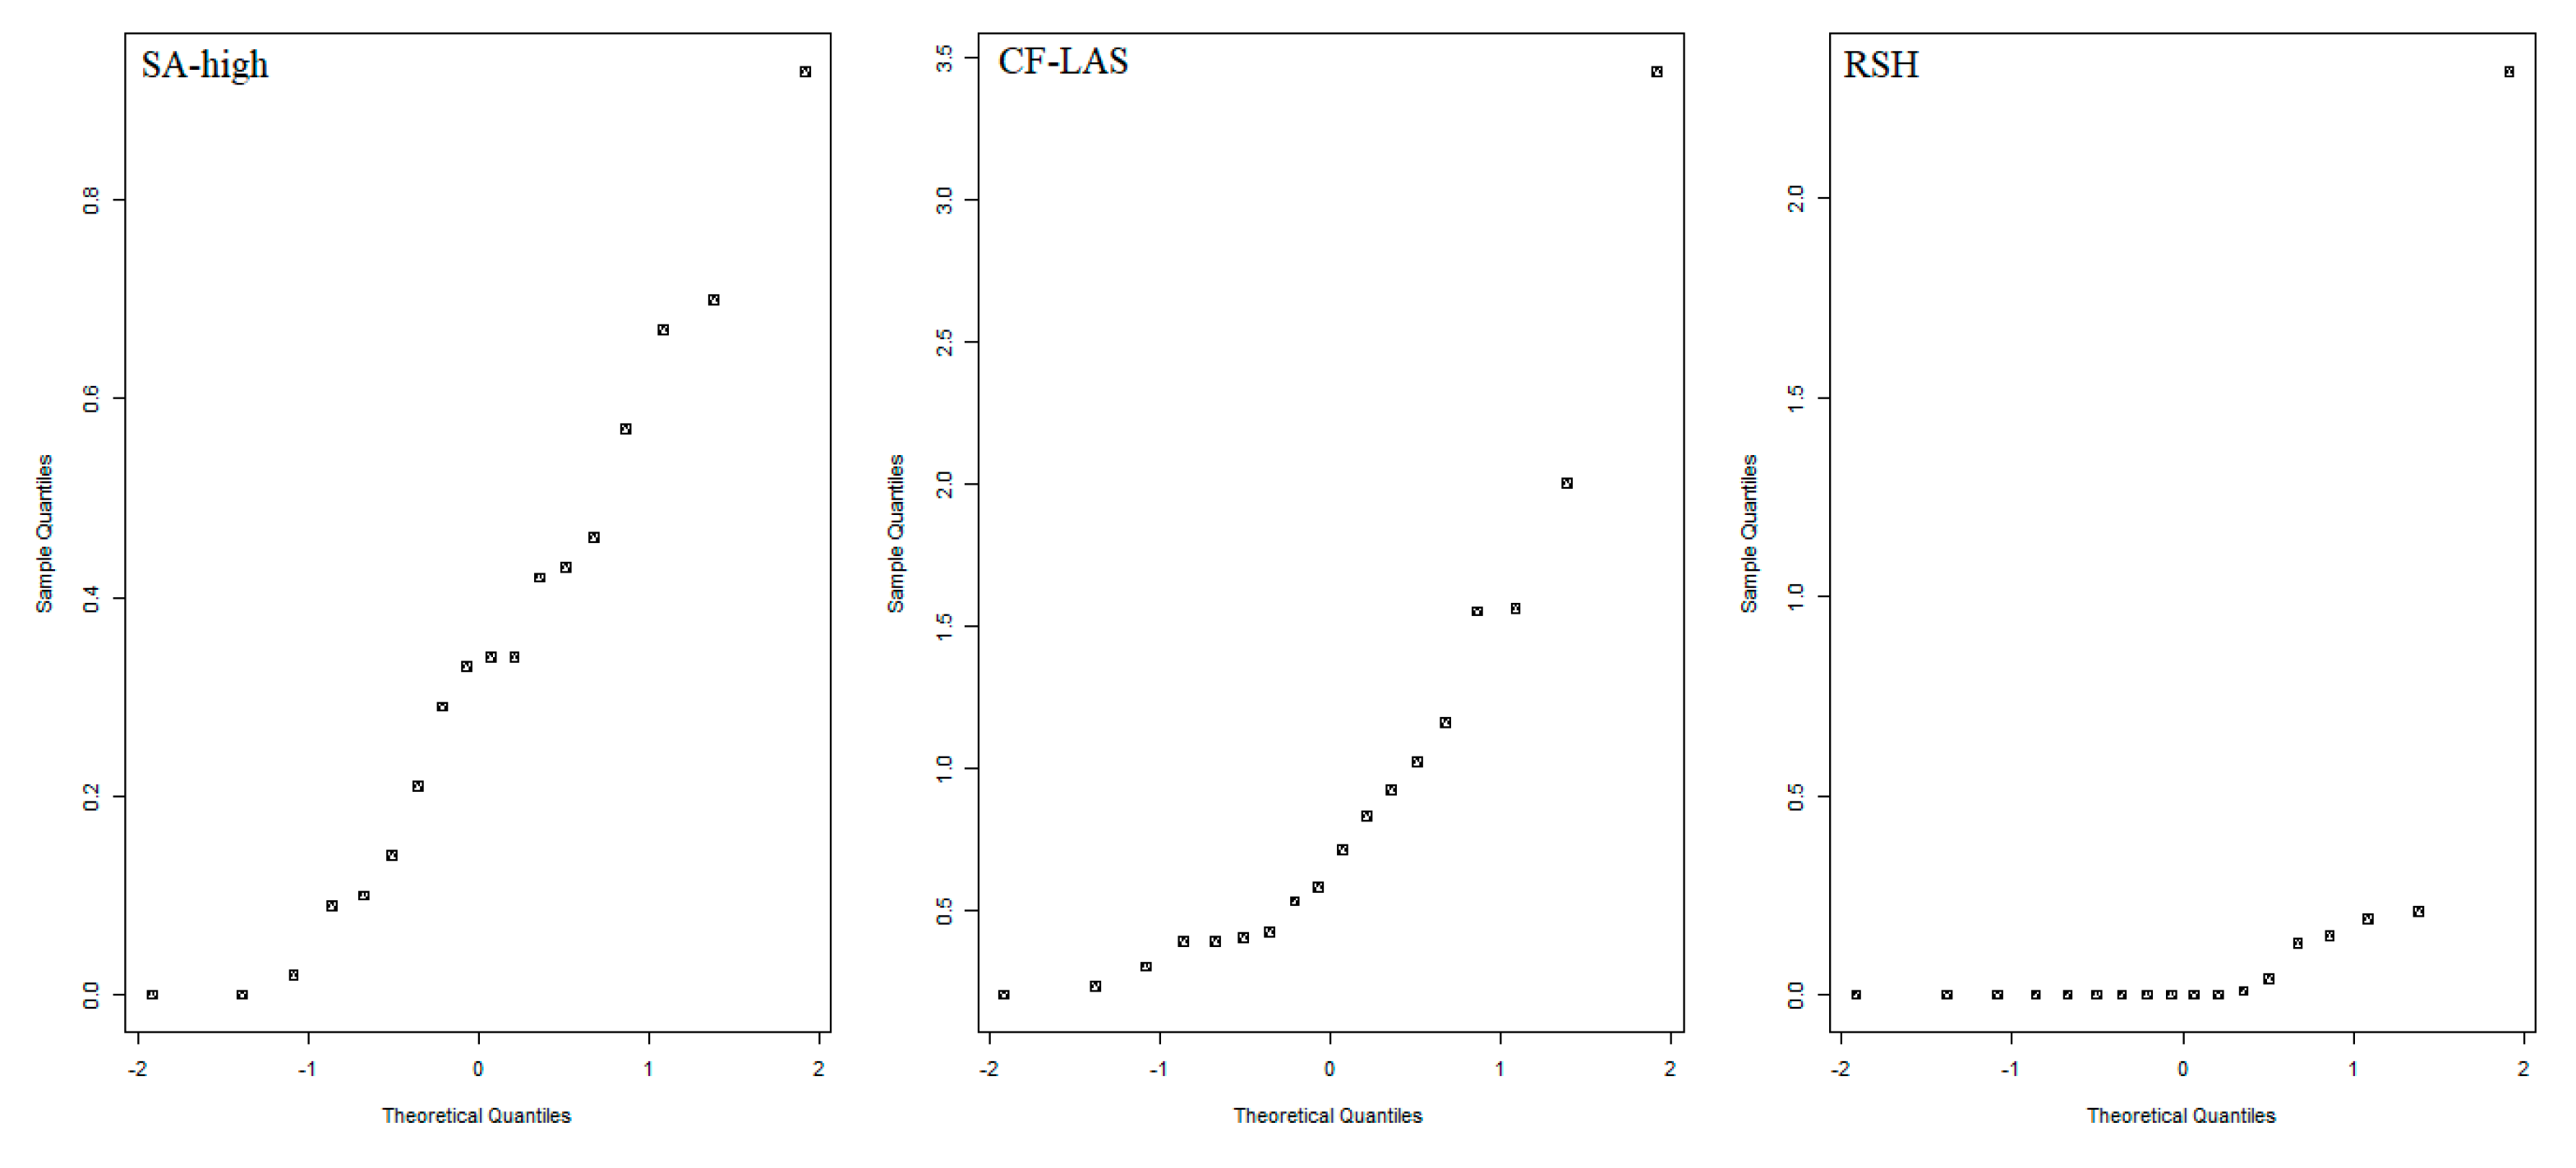
3.1.2. Statistical Analysis
4. Discussion
5. Conclusions
Author Contributions
Funding
Institutional Review Board Statement
Informed Consent Statement
Data Availability Statement
Conflicts of Interest
References
- Wadsworth, E.; Walters, D. Safety Health at the Heart of the Future of Work: Building on 100 Years of Experience; International Labour Office: Geneva, Switzerland, 2019; Available online: https://www.ilo.org/safework/events/safeday/WCMS_687610/lang--en/index.htm (accessed on 28 February 2021).
- Jarrahi, M.H.; Sutherl, W. Algorithmic Management Algorithmic Competencies: Understanding Appropriating Algorithms in Gig Work. In Proceedings of the International Conference on Information, Munich, Germany, 15–18 December 2019; Springer: Berlin/Heidelberg, Germany, 2019; pp. 578–589. [Google Scholar]
- Vives, A. Employment entrepreneurship as corporate social responsibility. GCG Mag. Glob. Compet. Gov. 2013, 7, 16–33. (In Spanish) [Google Scholar]
- Juárez-García, A. Psychosocial factors, stress health in different occupations: An exploratory study. Health Res. 2007, 9, 57–64. (In Spanish) [Google Scholar]
- Fuentes, S. Job Satisfaction Its Influence on Productivity (Study Carried out in the Delegation of Human Resources of the Judicial Body in the City of Quetzaltenango). 2012. Available online: http://biblio3.url.edu.gt/Tesis/2012/05/43/Fuentes-Silvia.pdf (accessed on 28 February 2021). (In Spanish).
- Pérez-Fuentes, M.D.C.; Jurado, M.D.M.M.; Rubio, I.M.; Sánchez, J.G.S.; Linares, J.J.G. Mindfulness for Preventing Psychosocial Risks in the Workplace: A Systematic Review and Meta-Analysis. Appl. Sci. 2020, 10, 1851. [Google Scholar] [CrossRef]
- Branca, T.A.; Fornai, B.; Colla, V.; Murri, M.M.; Streppa, E.; Schroder, A.J. The challenge of digitalization in the steel sector. Metals 2020, 10, 288. [Google Scholar] [CrossRef]
- Ejsmont, K. The Impact of Industry 4.0 on Employees—Insights from Australia. Sustainability 2021, 13, 3095. [Google Scholar] [CrossRef]
- Gorgenyi-Hegyes, E.; Nathan, R.; Fekete-Farkas, M. Workplace Health Promotion, Employee Wellbeing and Loyalty during Covid-19 Pandemic—Large Scale Empirical Evidence from Hungary. Economies 2021, 9, 55. [Google Scholar] [CrossRef]
- Reference Guide, Official Mexican Standard NOM-035-STPS-2018, Psychosocial Risk Factors at Work-Identification, Analysis Prevention. 2018. Available online: https://www.dof.gob.mx/nota_detalle.php?codigo=5541828&fecha=23/10/2018 (accessed on 28 February 2021). (In Spanish).
- Sánchez, C. The inclusion of the emotional salary in Mexico official Mexican Standard NOM-035-STPS-2018. Psychosocial risk factors at work-identification, analysis prevention. Mag. Chang. Perm. 2020, 11, 602–624. (In Spanish) [Google Scholar]
- Institute of Safety Hygiene at Work (INSHT). (In Spanish). Available online: https://www.insst.es/documentacion/publicaciones-periodicas/seguridad-y-salud-en-el-trabajo (accessed on 28 February 2021).
- Cox, T.; Griffiths, A.; Rial-González, E. Research on Work-Related Stress. Office for Official Publications of the European Communities; European Agency for Safety & Health at Work: Luxembourg, 2000; Available online: https://www.coursehero.com/file/p6s7aue/Cox-T-Griffiths-A-Rial-Gonzalez-E-2000-Research-on-work-related-stress/ (accessed on 28 February 2021).
- Kompier, M.; Levi, L. Stress at Work: Causes, Effects Prevention: A Guide for Small Medium-Sized Businesses; European Foundation for the Improvement of Living and Working Conditions: Dublin, Ireland, 1994. [Google Scholar]
- Peiró, J.M.; Yeves, J.; Lorente, L. The Analysis of Psychosocial Risks at Work: Research Professional Practice in Spain, International Yearbook. 2012, p. 19. Available online: http://portal.ugt.org/saludlaboral/observatorio/catalogo2014/publicaciones/revistas/021in/descargas/Anuario2013ING.pdf#page=20 (accessed on 28 February 2021). (In Spanish).
- Sebastián, M.L.; Idoate, V.M.; Llano, M. SOFI-SM: Questionnaire for the Analysis of Physical, Mental Psychological Work Fatigue. Digit. Mag. Saf. Health Work 2008, Nº. 2, 1–22. (In Spanish) [Google Scholar]
- Magnano, P.; Santisi, G.; Platania, S.; Zammitti, A.; Tous-Pallares, J. The Italian version of the Work Psychosocial Climate Scale. Work 2020, 66, 789–798. [Google Scholar] [CrossRef] [PubMed]
- Cerda-Silva, G.; Porras-Tapia, F. Review of the psychometric properties of the psychosocial risk assessment scale at work event / ISTAS 21 in the Chilean context. Sci. Work 2018, 20, 121–125. (In Spanish) [Google Scholar]
- Eurofound. Changes Overtime–First Findings from the Fifth European Working Conditions Survey; Publications Office of the European Union: Doublin, Ireland, 2014. [Google Scholar]
- Leka, S.; Jain, A.; Zwetsloot, G.; Cox, T. Policy-level interventions and work-related psychosocial risk management in the European Union. Work. Stress 2010, 24, 298–307. [Google Scholar] [CrossRef]
- Sureda, E.; Mancho, J.; Sesé, A. Psychosocial risk factors, organizational conflict job satisfaction in health professionals: A sem model. Ann. Psychol. 2019, 35, 106–115. [Google Scholar] [CrossRef]
- Metzler, Y.A.; Von Groeling-Müller, G.; Bellingrath, S. Better safe than sorry: Methods for risk assessment of psychosocial hazards. Saf. Sci. 2019, 114, 122–139. [Google Scholar] [CrossRef]
- Bergh, L.I.V.; Leka, S.; Zwetsloot, G.I. Tailoring Psychosocial Risk Assessment in the Oil and Gas Industry by Exploring Specific and Common Psychosocial Risks. Saf. Health Work. 2018, 9, 63–70. [Google Scholar] [CrossRef]
- Khakzad, N. System safety assessment under epistemic uncertainty: Using imprecise probabilities in Bayesian network. Saf. Sci. 2019, 116, 149–160. [Google Scholar] [CrossRef]
- Han, L.; Zhang, Q.; Chen, X.; Zhan, Q.; Yang, T.; Zhao, Z. Detecting work-related stress with a wearable device. Comput. Ind. 2017, 90, 42–49. [Google Scholar] [CrossRef]
- Asensio-Cuesta, S.; Diego-Mas, J.A.; Canós-Darós, L.; Andrés-Romano, C. A genetic algorithm for the design of job rotation schedules considering ergonomic and competence criteria. Int. J. Adv. Manuf. Technol. 2012, 60, 1161–1174. [Google Scholar] [CrossRef]
- Song, J.; Lee, C.; Lee, W.; Bahn, S.; Jung, C.; Yun, M.H. Development of a job rotation scheduling algorithm for minimizing accumulated workload per body parts. Work 2016, 53, 511–521. [Google Scholar] [CrossRef]
- Yan, X.; Li, H.; Li, A.R.; Zhang, H. Wearable imubased real-time motion warning system for construction workers. Musculoskeletal disorders prevention. Autom. Construct. 2017, 74, 2–11. [Google Scholar] [CrossRef]
- Lahyani, R.; Chebil, K.; Khemakhem, M.; Coelho, L.C. Metaheuristics for solving the multiple knapsack problem with setup. Comput. Ind. Eng. 2019, 129, 76–89. [Google Scholar] [CrossRef]
- Chebil, K.; Khemakhem, M. A dynamic programming algorithm for the Knapsack Problem with Setup. Comput. Oper. Res. 2015, 64, 40–50. [Google Scholar] [CrossRef]
- Khemakhem, M.; Chebil, K. A tree search based combination heuristic for the knapsack problem with setup. Comput. Ind. Eng. 2016, 99, 280–286. [Google Scholar] [CrossRef]
- Laabadi, S.; Naimi, M.; El Amri, H.; Achchab, B. The 0/1 Multidimensional Knapsack Problem and Its Variants: A Survey of Practical Models and Heuristic Approaches. Am. J. Oper. Res. 2018, 8, 395–439. [Google Scholar] [CrossRef]
- Drake, J.H.; Özcan, E.; Burke, E.K. A case study of controlling crossover in a selection hyper-heuristic frame-work using the multidimensional knapsack problem. Evol. Comput. 2016, 24, 113–141. [Google Scholar] [CrossRef]
- Belaid, M.B.; Lazeb, A.; Zennaki, M.; Sadouni, K.A. Reduce and Solve Algorithm for the Multidimensional Knapsack Problem. 2017. Available online: https://www.researchgate.net/publication/315541822 (accessed on 25 April 2021).
- Dzalbs, I.; Kalganova, T.; Dear, I. Imperialist Competitive Algorithm with Independence and Constrained Assimilation for Solving 0-1 Multidimensional Knapsack Problem. arXiv 2020, arXiv:2003.06617. [Google Scholar]
- Skackauskas, J.; Kalganova, T.; Dear, I.; Janakram, M. Dynamic Impact for Ant Colony Optimization algorithm. arXiv 2020, arXiv:2002.04099. [Google Scholar]
- Chih, M. Three pseudo-utility ratio-inspired particle swarm optimization with local search for multidimensional knapsack problem. Swarm Evol. Comput. 2018, 39, 279–296. [Google Scholar] [CrossRef]
- ILO/WHO Committee on Occupational Health. Psychosocial Factors at Work: Recognition Control, Report of the Joint ILO/WHO Committee on Occupational Health, Ninth Session; ILO/WHO: Geneva, Switzerland, 1984; pp. 18–24. [Google Scholar]
- Publications Office of the European Union. Available online: https://osha.europa.eu/en/publications/psychosocial-risks-europe-prevalence-and-strategies-prevention/view (accessed on 28 February 2021).
- Martín-Aragón-Gelabert, M.; Terol-Cantero, M.C. Post-covid-19 psychosocial intervention in healthcare professionals (intervención psicosocial postcovid-19 en personal sanitario). Int. J. Soc. Psychol. 2020, 35, 664–669. [Google Scholar] [CrossRef]
- Potter, R.; O’Keeffe, V.; Leka, S.; Webber, M.; Dollard, M. nalytical review of the Australian policy context for work-related psychological health and psychosocial risks. Saf. Sci. 2019, 111, 37–48. [Google Scholar] [CrossRef]
- Varnamkhasti, M.J. Overview of the algorithms for solving the multidimensional knapsack problems. Adv. Stud. Biol. 2012, 4, 37–47. [Google Scholar]
- Gurski, F.; Rehs, C.; Rethmann, J. Knapsack problems: A parameterized point of view. Theor. Comput. Sci. 2019, 775, 93–108. [Google Scholar] [CrossRef]
- Kellerer, H.; Pferschy, U.; Pisinger, D. Knapsack Problems; Springer: Berlin/Heidelberg, Germany, 2004; pp. 299–428. Available online: https://www.springer.com/gp/book/9783540402862 (accessed on 25 April 2021). [CrossRef]
- Connolly, D.; Martello, S.; Toth, P. Knapsack Problems: Algorithms and Computer Implementations. J. Oper. Res. Soc. 1991, 42, 513. [Google Scholar] [CrossRef]
- Kellerer, H.; Pferschy, U.; Pisinger, D. Multidimensional Knapsack Problems. In Knapsack Problems; Springer: Berlin/Heidelberg, Germany, 2004; pp. 235–283. [Google Scholar]
- Rere, L.R.; Fanany, M.I.; Arymurthy, A.M. Simulated Annealing Algorithm for Deep Learning. Procedia Comput. Sci. 2015, 72, 137–144. [Google Scholar] [CrossRef]
- Li, Z.; Kucukkoc, I.; Nilakantan, J.M. Comprehensive review and evaluation of heuristics and meta-heuristics for two-sided assembly line balancing problem. Comput. Oper. Res. 2017, 84, 146–161. [Google Scholar] [CrossRef]
- Asghari, S.; Navimipour, N.J. Review comparison of meta-heuristic algorithms for service composition in cloud computing. Majlesi J. Multimed. Process. 2015, 4, 1–7. [Google Scholar]
- Aarts, E.; Korst, J.; Michiels, W. Simulated Annealing. In Search Methodologies; Springer: Berlin/Heidelberg, Germany, 2006; pp. 187–210. [Google Scholar]
- Martínez-Rangel, M.G.; Cruz-Chávez, M.A.; Zavala-Díaz, J.C.; Juárez-Romero, D.; Díaz-Parra, O. Analysis of the simulated annealing convergence in function of the standard deviation the Boltzmann quotient for scheduling problems. Res. Comput. Sci. 2007, 4069, 282–293. [Google Scholar]
- Jerrum, M.; Sinclair, A. The markov chain montecarlo method: An approach to approximate counting integration. In Approximation Algorithms for NP-Hard Problems; PWS Publishing Company: Boston, MA, USA, 1996. [Google Scholar]
- Cruz-Chávez, M.A.; Martínez-Rangel, M.G.; Cruz-Rosales, M.H. “Accelerated simulated annealing algorithm applied to the flexible job shop scheduling problem. Int. Trans. Oper. Res. 2017, 24, 1119–1137. [Google Scholar] [CrossRef]
- Fréville, A.; Plateau, G. An efficient preprocessing procedure for the multidimensional 0–1 knapsack problem. Discret. Appl. Math. 1994, 49, 189–212. [Google Scholar] [CrossRef]
- Fréville, A. The multidimensional 0–1 knapsack problem: An overview. Eur. J. Oper. Res. 2004, 155, 1–21. [Google Scholar] [CrossRef]
- Chu, P.C.; Beasley, J.E. A genetic algorithm for the multidimensional knapsack problem. J. Heuristics 1998, 4, 63–86. [Google Scholar] [CrossRef]
- Glover, F.W.; Kochenberger, G.A. Handbook of Metaheuristics; Springer Science & Business Media: Berlin/Heidelberg, Germany, 2006; Volume 57. [Google Scholar]
- Wilcox, R. Introduction to Robust Estimation and Hypothesis Testing, 3rd ed.; Academic Press: Cambridge, MA, USA, 2013; ISBN 9780123869838. [Google Scholar] [CrossRef]
- R Version 4.0.5. The Foundation for Statistical Computing. (2021-03-31). Available online: https://www.r-project.org/ (accessed on 7 May 2021).
- Eraña-Díaz, M.L.; Cruz-Chávez, M.A.; Rivera-López, R.; Martínez-Bahena, B.; Avila-Melgar, Y.; Cruz-Rosales, M.H. Optimization for risk decision-making through simulated annealing. IEEE Access 2020, 8, 117063–117079. [Google Scholar] [CrossRef]
- Eraña-Díaz, M.L. Simulated Annealing Machine Learning Applied to Business Risk Factor Optimization. Ph.D. Thesis, Universidad Autónoma del Estado de Morelos, Chamilpa, Mexico, 2020. (In Spanish). Available online: http://riaa.uaem.mx/handle/20.500.12055/1243 (accessed on 28 February 2021).
- Williams, S.P.; Schubert, P. Designs for the digital workplace. Procedia Comput. Sci. 2018, 138, 478–485. [Google Scholar] [CrossRef]
- Ghezzi, V.; Probst, T.M.; Petitta, L.; Ciampa, V.; Ronchetti, M.; Di Tecco, C.; Iavicoli, S.; Barbaranelli, C. The interplay among age employment status on the perceptions of psychosocial risk factors at work. Int. J. Environ. Res. Public Health 2020, 17, 3611. [Google Scholar] [CrossRef] [PubMed]
- Möhlmann, M.; Zalmanson, L. Hands on the wheel: Navigating algorithmic management uber drivers. In Proceedings of the International Conference on Information Systems (ICIS), Seoul, Korea, 10–13 December 2017; pp. 10–13. [Google Scholar]
- Lee, M.K. Understanding perception of algorithmic decisions: Fairness, trust, emotion in response to algorithmic management. Big Data Soc. 2018, 5, 20539517/18756684. [Google Scholar] [CrossRef]
- Cheng, M.; Foley, C. Algorithmic management: The case of Airbnb. Int. J. Hosp. Manag. 2019, 83, 33–36. [Google Scholar] [CrossRef]


| Parameter | Description |
|---|---|
| w0 | Initial candidate solution |
| T | External cycle control parameter |
| T0 | Initial value of the control parameter |
| α | Control coefficient (0 < α < 1) |
| L | Markov chain size |
| f | Cost function |
| Ω | Neighborhood |
| β | Stop criterion coefficient |
| Tf | Final value of the control parameter |
| Training | Communication | Industrial Safety | Human Resources |
|---|---|---|---|
| Schedule and develop time management courses | Design brochures or posters that graphically remind workers to organize their time so as not to be overloaded by work | Implement a nonconformity mechanism. Through a module on the company’s website where the worker can comment or suggest alternatives for workload issues associated with their position or organizational climate | Program actions that promote social support-publicize strategies or support schemes both by the company and among colleagues, an example would be to facilitate a mechanism to share excess work or cover in special events |
| Departments | Budget | Psychosocial Risk Factors | |||||
|---|---|---|---|---|---|---|---|
| Risk Level | |||||||
| 560 | 825 | 354 | 428 | 247 | |||
| Mental Workload | Work Time Management | Job Content | Supervision-Participation | Temporal Autonomy | |||
| j = 1, …, n | |||||||
| Training (T) | $600 | i = 1, …, m | 450 | 300 | 280 | 550 | 310 |
| Communication (C) | $850 | 200 | 150 | 210 | 480 | 750 | |
| Industrial safety (I) | $930 | 480 | 200 | 300 | 350 | 150 | |
| Human resources (H) | $545 | 130 | 180 | 200 | 320 | 350 | |
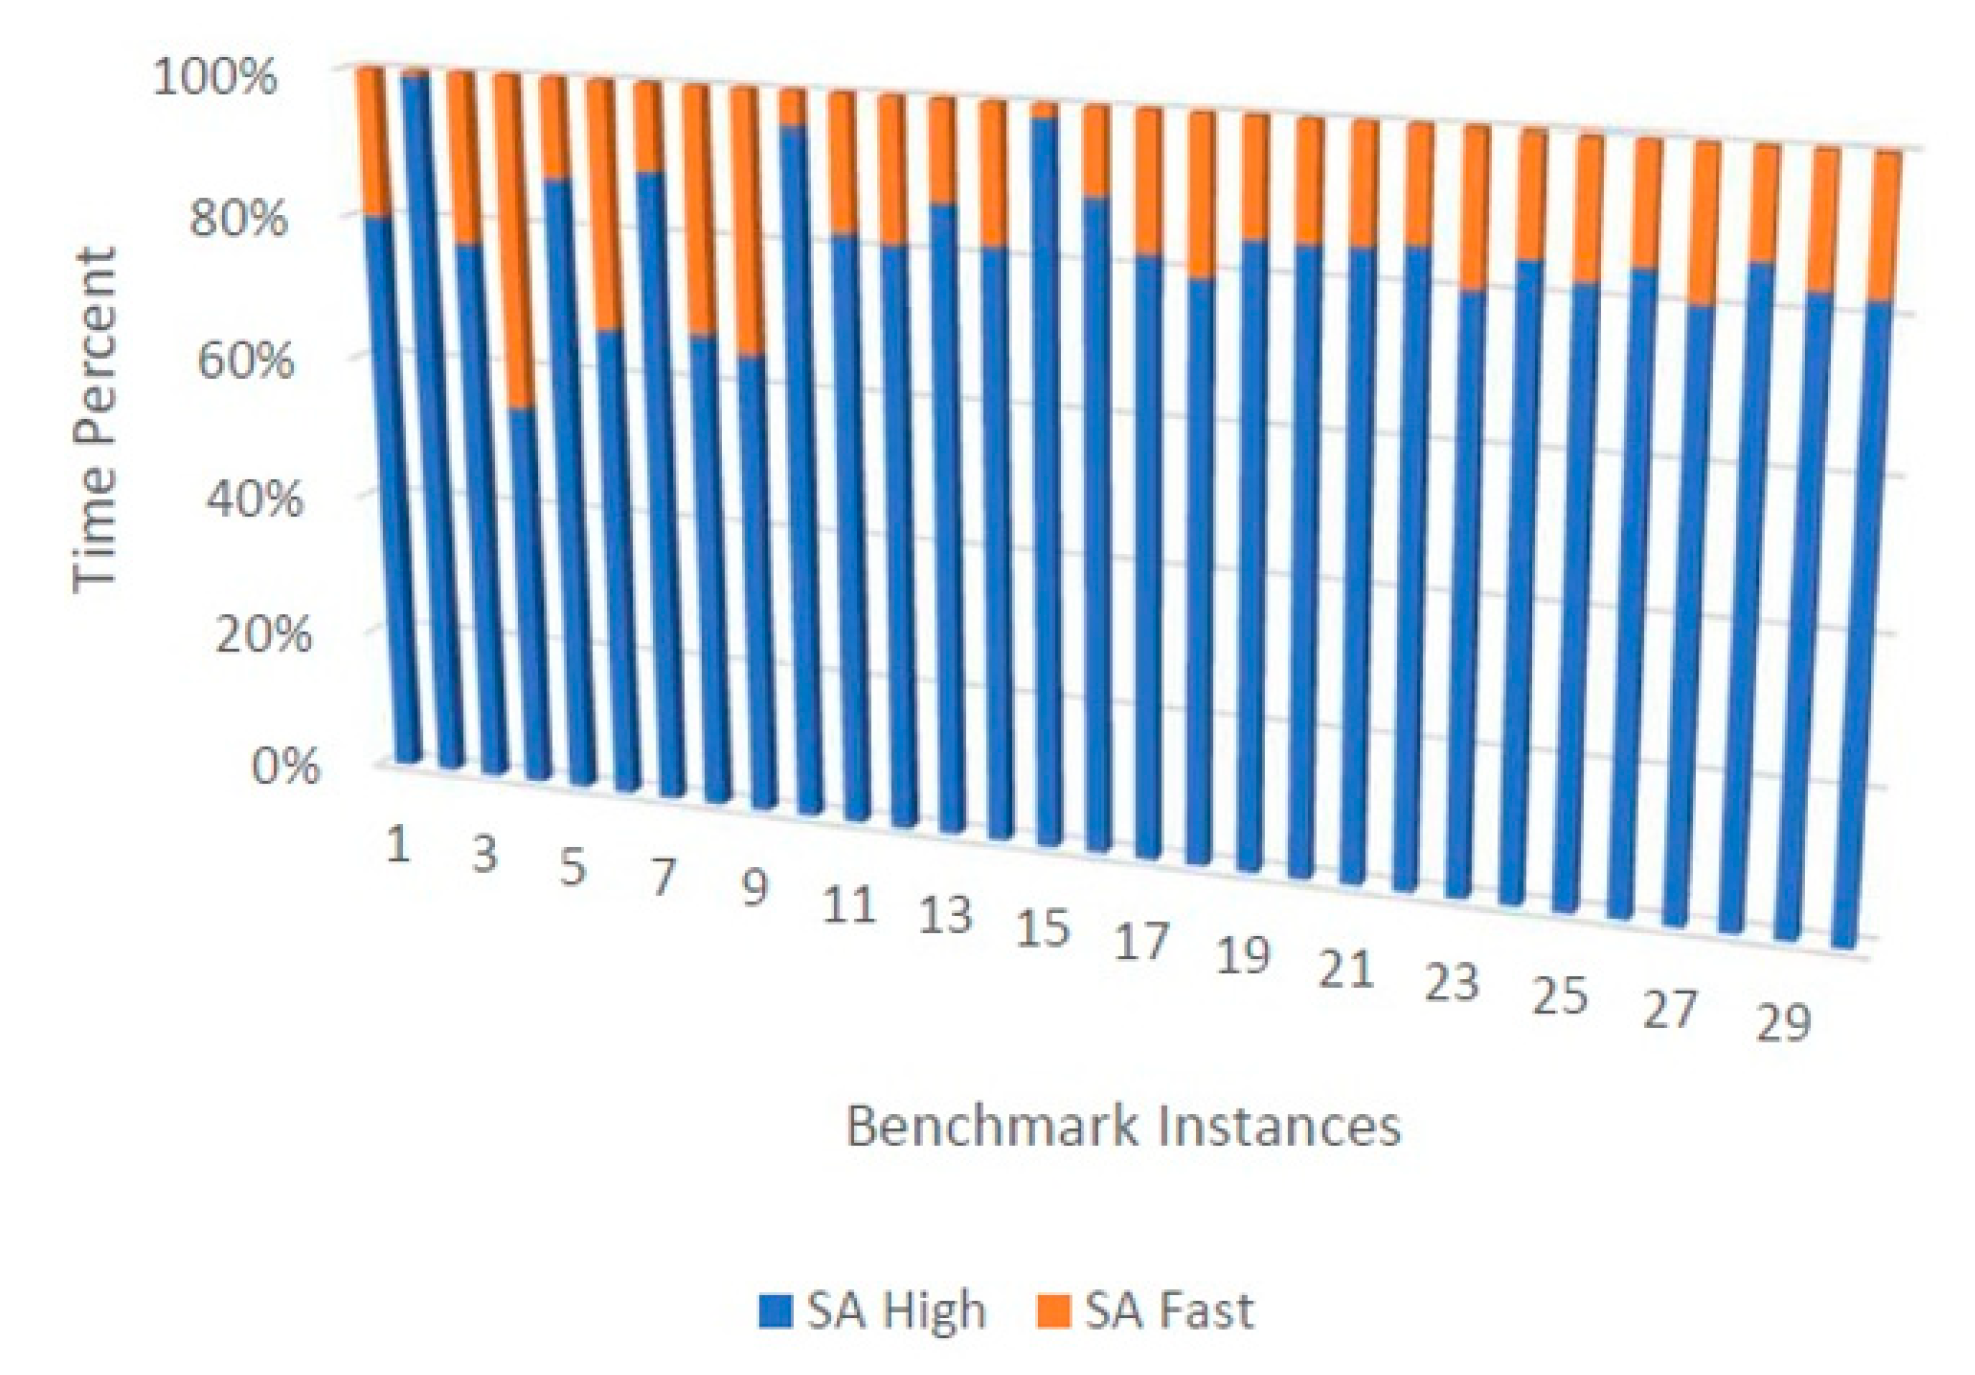
| Algorithm | T0 = fSD | Vm | α | β |
|---|---|---|---|---|
| SA-high | 1 SD | 3 | 0.98 | 0.001 |
| SA-fast | 0.5 SD | 0.5 | 0.98 | 0.001 |
| Item | Description | Item | Description |
|---|---|---|---|
| V1 | Dangerous and unsafe conditions | V15 | Influence of work outside the workplace |
| V2 | Poor and unsanitary conditions | V16 | Influence of family responsibilities |
| V3 | Dangerous works | V17 | Poor clarity of functions |
| V4 | Quantitative loads | V18 | Leadership characteristics |
| V5 | Accelerated work rates | V19 | Social relationships at work |
| V6 | Work time management | V20 | Poor relationship with collaborators |
| V7 | Emotional psychological loads | V21 | Workplace violence |
| V8 | High responsibility work | V22 | Little or no performance feedback |
| V9 | Contradictory or inconsistent uploads | V23 | Little or no recognition and compensation |
| V10 | Lack of control and autonomy over work | V24 | Limited sense of belonging |
| V11 | Limited or no possibility of development | V25 | Job instability |
| V12 | Insufficient participation in management | V26 | Job satisfaction |
| V13 | Limited or no training | V27 | Motivation |
| V14 | Extensive working hours | V28 | Attitude |
| Department | Budget cj | aij | PSR Factors, Vj | |||||||||||||||||||||||||||
|---|---|---|---|---|---|---|---|---|---|---|---|---|---|---|---|---|---|---|---|---|---|---|---|---|---|---|---|---|---|---|
| Risk Level, Pj | ||||||||||||||||||||||||||||||
| 560 | 1125 | 68 | 328 | 47 | 122 | 196 | 41 | 25 | 115 | 82 | 22 | 631 | 132 | 420 | 86 | 42 | 103 | 81 | 26 | 49 | 316 | 72 | 71 | 49 | 108 | 116 | 90 | |||
| V1 | V2 | V3 | V4 | V5 | V6 | V7 | V8 | V9 | V10 | V11 | V12 | V13 | V14 | V15 | V16 | V17 | V18 | V19 | V20 | V21 | V22 | V23 | V24 | V25 | V26 | V27 | V28 | |||
| j = 1, …, n | ||||||||||||||||||||||||||||||
| T | 219 | i = 1, …, m | 40 | 91 | 3 | 12 | 3 | 18 | 25 | 1 | 1 | 8 | 1 | 1 | 49 | 8 | 21 | 6 | 1 | 5 | 8 | 1 | 0 | 42 | 6 | 4 | 8 | 0 | 10 | 1 |
| C | 203 | 16 | 92 | 4 | 18 | 6 | 0 | 8 | 2 | 1 | 6 | 2 | 1 | 70 | 9 | 22 | 4 | 1 | 5 | 6 | 0 | 4 | 8 | 4 | 3 | 0 | 10 | 0 | 6 | |
| I | 208 | 38 | 39 | 5 | 40 | 8 | 12 | 15 | 0 | 1 | 20 | 3 | 0 | 40 | 6 | 8 | 0 | 6 | 4 | 4 | 1 | 5 | 8 | 2 | 8 | 0 | 20 | 0 | 0 | |
| H | 180 | 38 | 52 | 7 | 20 | 0 | 3 | 4 | 1 | 2 | 4 | 6 | 1 | 18 | 15 | 38 | 10 | 4 | 8 | 0 | 3 | 0 | 6 | 1 | 3 | 0 | 3 | 5 | 4 | |
| Total Profit | Budget Consumed by Each Department | Binary Value 1 Indicates That Vj Is Selected | ||||||||||||||||||||||||||||||
|---|---|---|---|---|---|---|---|---|---|---|---|---|---|---|---|---|---|---|---|---|---|---|---|---|---|---|---|---|---|---|---|---|
| T | C | I | H | X1 | X2 | X3 | X4 | X5 | X6 | X7 | X8 | X9 | X10 | X11 | X12 | X13 | X14 | X15 | X16 | X17 | X18 | X19 | X20 | X21 | X22 | X23 | X24 | X25 | X26 | X27 | X28 | |
| 3404 | 217 | 198 | 206 | 180 | 1 | 0 | 1 | 1 | 1 | 0 | 0 | 1 | 1 | 0 | 1 | 1 | 1 | 1 | 1 | 0 | 1 | 1 | 1 | 0 | 1 | 1 | 1 | 1 | 0 | 1 | 1 | 1 |
| 3405 | 216 | 198 | 197 | 180 | 1 | 1 | 0 | 1 | 1 | 0 | 0 | 1 | 1 | 1 | 1 | 0 | 0 | 0 | 1 | 0 | 0 | 0 | 1 | 1 | 1 | 0 | 1 | 1 | 1 | 1 | 1 | 1 |
| 3418 | 216 | 199 | 201 | 180 | 1 | 1 | 0 | 1 | 1 | 0 | 0 | 1 | 0 | 1 | 1 | 1 | 0 | 0 | 1 | 0 | 1 | 0 | 1 | 0 | 1 | 0 | 1 | 1 | 1 | 1 | 1 | 1 |
| Elements | Depts. | MKP Benchmark | Problems |
|---|---|---|---|
| 28 | 4 | SAC-94 | hp1 |
| 35 | 4 | SAC-94 | hp2 |
| 40 | 30 | SAC-94 | pb6 |
| 37 | 30 | SAC-94 | pb7 |
| 50 | 5 | SAC-94 | pet 7 |
| 60 | 30 | SAC-94 | sento 2 |
| 40 | 2 | SAC-94 | weish08 |
| 60 | 5 | SAC-94 | weish16 |
| 90 | 5 | SAC-94 | weish30 |
| 105 | 2 | SAC-94 | weing 8 |
| 100 | 15 | GK | gk01 |
| 200 | 50 | GK | gk6 |
| 100 | 5 | ORLib | OR5X100_0.25_6 OR5X100_0.5_4 OR5X100_0.75_ |
| 100 | 10 | ORLib | OR10X100_0.25_5 OR10X100_0.5_4 OR10X100_0.75_4 |
| 100 | 30 | ORLib | OR30X100_0.25_5, OR30X100_0.5_1, OR30X100_0 |
| 250 | 5 | ORLib | OR5X250_0.25_9, OR5X250_0.5_4, OR5X250_0.75_ |
| 250 | 10 | ORLib | OR10X250_0.25_7, OR10X250_0.5_2, OR10X250_0 |
| 250 | 30 | ORLib | OR30X250_0.25_3, OR30X250_0.5_3, OR30X250_0 |
| Instance | Optimum/UB* | SA-High | SA-Fast | ||||||
|---|---|---|---|---|---|---|---|---|---|
| Max | Min | Avg | Mode | Max. | Min. | Avg | Mode | ||
| hp1 | 3418 | 3418 | 3404 | 3412.6 | 3418 | 3418 | 3404 | 3412.4 | 3418 |
| hp2 | 3186 | 3186 | 3148 | 3178.4 | 3186 | 3186 | 3087 | 3129 | 3167 |
| pb6 | 776 | 776 | 776 | 776 | 776 | 776 | 776 | 776 | 776 |
| pb7 | 1035 | 1035 | 1035 | 1035 | 1035 | 1035 | 1028 | 1033.4 | 1035 |
| pet 7 | 16,537 | 16,537 | 16,448 | 16,487.8 | 16,448 | 16,537 | 16,347 | 16,409 | 16,448 |
| sento 2 | 8722 | 8722 | 8722 | 8722 | 8722 | 8722 | 8714 | 8720.4 | 8722 |
| weish08 | 5605 | 5605 | 5605 | 5605 | 5605 | 5605 | 5603 | 5604.6 | 5605 |
| weish16 | 7289 | 7289 | 7287 | 7288.6 | 7289 | 7289 | 7214 | 7269.29 | 7289 |
| weish30 | 11,191 | 11,191 | 11,157 | 11,183.74 | 11,191 | 11,191 | 11,084 | 11,170.45 | 11,191 |
| weing 8 | 624,319 | 624,319 | 605,714 | 618,194.8 | 620,060 | 621,086 | 578,923 | 595,697.9 | 621,086 |
| gk01 | 3766 | 3745 | 3713 | 3727.26 | 3727 | 3744 | 3696 | 3725.17 | 3721 |
| gk6 | 7680 * | 7620 | 7589 | 7601.4 | 7609 | 7611 | 7573 | 7596.11 | 7599 |
| OR5X100_0.25_6 | 24,613 | 24,613 | 23,998 | 24,346.41 | 24,321 | 24,487 | 23,737 | 24,221.75 | 24,386 |
| OR5X100_0.5_4 | 45,090 | 45,090 | 44,641 | 44,849.66 | 44,911 | 45,033 | 44,265 | 44,674.13 | 44,398 |
| OR5X100_0.75_5 | 61,091 | 61,079 | 60,503 | 60,766.61 | 60,845 | 60,975 | 60,090 | 60,516.07 | 60,757 |
| OR10X100_0.25_5 | 22,751 | 22,654 | 22,157 | 22,411.1125 | 22,395 | 22,581 | 21,705 | 22,211.21 | 22,147 |
| OR10X100_0.5_4 | 45,624 | 45,475 | 44,660 | 45,102.77 | 45,103 | 45,365 | 44,533 | 44,994.75 | 44,885 |
| OR10X100_0.75_4 | 61,966 | 61,833 | 61,364 | 61,603.17 | 61,570 | 61,810 | 61,206 | 61,520.3 | 61,474 |
| OR30X100_0.25_5 | 21,844 | 21,814 | 21,460 | 21,586.55 | 21,534 | 21,720 | 21,160 | 21,494.64 | 21,500 |
| OR30X100_0.5_1 | 40,767 | 40,630 | 40,288 | 40,415.63 | 40,630 | 40,630 | 40,019 | 40,313.99 | 40,302 |
| OR30X100_0.75_3 | 58,052 | 57,992 | 57,687 | 57,786.75 | 57,721 | 57,963 | 57,330 | 57,712.06 | 57,721 |
| OR5X250_0.25_9 | 61,885 | 61,470 | 60,674 | 61,139.98 | 61,075 | 61,232 | 59,998 | 60,752 | 60,545 |
| OR5X250_0.5_4 | 109,383 | 108,643 | 108,048 | 108,381.5 | 108,190 | 108,595 | 107,658 | 108,160.53 | 108,187 |
| OR5X250_0.75_4 | 152,130 | 151,497 | 150,375 | 150,964.31 | 150,767 | 151,115 | 150,755 | 150,944.4 | 150,767 |
| OR10X250_0.25_7 | 58,704 | 58,158 | 57,122 | 57,643.21 | 57,763 | 58,085 | 56,935 | 57,470.91 | 57,416 |
| OR10X250_0.5_2 | 108,717 | 108,622 | 108,048 | 108,384 | 108,190 | 108,595 | 107,658 | 108,160.53 | 108,187 |
| OR10X250_0.75_4 | 151,324 | 150,808 | 149,618 | 150,244.78 | 150,127 | 150,479 | 149,884 | 150,204.4 | 150,767 |
| OR30X250_0.25_3 | 56,614 | 56,215 | 55,461 | 55,797.85 | 55,658 | 55,982 | 55,589 | 55,753.8 | 55,741 |
| OR30X250_0.5_3 | 106,442 | 105,957 | 105,357 | 105,577.653 | 105,711 | 105,775 | 105,480 | 105,631.8 | 105,774 |
| OR30X250_0.75_3 | 153,158 * | 152,711 | 152,054 | 152,283.94 | 152,223 | 152,370 | 152,151 | 152,294.2 | 152,283 |
| No | Instance | Optimum/UB | SA-High | SA-Fast | CF-LAS [33] | RSH [34] | ICA [35] | ACO DI [36] | 3R-SACRO -PSO [37] | |||||||
|---|---|---|---|---|---|---|---|---|---|---|---|---|---|---|---|---|
| Time | RE | Time | RE | Time | RE | Time | RE | Time | RE | Time | RE | Time | RE | |||
| s | s | s | s | s | s | s | ||||||||||
| 1 | hp1 | 3418 | 2.54 | 0.00 | 0.64 | 0.00 | - | 0.00 | - | - | - | - | 0.75 | 0.00 | 0.00 | |
| 2 | hp2 | 3186 | 8.00 | 0.00 | 0.06 | 0.00 | - | 0.00 | - | - | - | - | 36.65 | 0.00 | 0.00 | |
| 3 | pb6 | 776 | 18.00 | 0.00 | 5.37 | 0.00 | - | 0.00 | - | - | - | - | 0.14 | 0.00 | 0.00 | |
| 4 | pb7 | 1035 | 20.00 | 0.00 | 16.74 | 0.00 | - | 0.00 | - | - | - | - | 4.6 | 0.00 | 0.00 | |
| 5 | pet 7 | 16,537 | 1.24 | 0.00 | 0.19 | 0.00 | - | 0.00 | - | - | - | - | 67.62 | 0.00 | - | |
| 6 | sento 2 | 8722 | 94.00 | 0.00 | 47.61 | 0.00 | - | 0.00 | - | - | - | - | 1.94 | 0.00 | - | 0.00 |
| 7 | weish08 | 5605 | 8.81 | 0.00 | 1.13 | 0.00 | - | 0.00 | - | - | - | - | 0.7 | 0.00 | - | - |
| 8 | weish16 | 7289 | 6.00 | 0.00 | 2.98 | 0.00 | - | 0.00 | - | - | - | - | 0 | 0.00 | - | 0.00 |
| 9 | weish30 | 11,191 | 10.00 | 0.00 | 5.48 | 0.00 | - | 0.00 | - | - | - | - | 0.01 | 0.00 | - | 0.00 |
| 10 | weing 8 | 624,319 | 77.53 | 0.00 | 3.55 | 0.52 | - | 0.63 | - | - | - | - | 0.01 | 0.00 | - | 0.00 |
| 11 | gk01 | 3766 | 31.70 | 0.56 | 7.00 | 0.58 | - | 0.57 | - | - | - | 0.61 | - | 0.14 | - | - |
| 12 | gk6 | 7680 * | 787.70 | 0.74 | 186.00 | 0.90 | - | 1.15 | - | - | - | 0.52 | - | 0.26 | - | - |
| 13 | OR5X100_0.25_6 | 24,613 | 8.47 | 0.00 | 1.27 | 0.51 | - | 1.16 | 14.41 | 0.00 | - | 0.00 | - | - | - | - |
| 14 | OR5X100_0.5_4 | 45,090 | 34.49 | 0.00 | 7.79 | 0.13 | - | 0.53 | 50.07 | 0.00 | - | 1.52 | - | - | - | - |
| 15 | OR5X100_0.75_5 | 61,091 | 41.56 | 0.02 | 0.68 | 0.19 | - | 0.40 | 21.18 | 0.00 | - | 0.00 | - | - | - | - |
| 16 | OR10X100_0.25_5 | 22,751 | 58.80 | 0.43 | 7.39 | 0.75 | - | 2.00 | 104.09 | 0.00 | - | 0.00 | - | - | - | - |
| 17 | OR10X100_0.5_4 | 45,624 | 55.71 | 0.33 | 12.20 | 0.57 | - | 1.02 | 77.79 | 0.00 | - | 0.17 | - | - | - | - |
| 18 | OR10X100_0.75_4 | 61,966 | 27.61 | 0.21 | 7.20 | 0.25 | - | 0.58 | 46.96 | 0.00 | - | 0.00 | - | - | - | - |
| 19 | OR30X100_0.25_5 | 21,844 | 353.25 | 0.14 | 30.00 | 0.57 | - | 3.45 | 90.25 | 0.19 | - | - | - | - | - | - |
| 20 | OR30X100_0.5_1 | 40,767 | 271.39 | 0.34 | 67.80 | 0.34 | - | 1.56 | 116.82 | 0.00 | - | - | - | - | - | - |
| 21 | OR30X100_0.75_3 | 58,052 | 307.72 | 0.10 | 66.30 | 0.15 | - | 0.92 | 109.4 | 0.00 | - | - | - | - | - | - |
| 22 | OR5X250_0.25_9 | 61,885 | 144.58 | 0.67 | 16.20 | 0.96 | - | 0.42 | 170.52 | 0.00 | - | - | - | - | - | - |
| 23 | OR5X250_0.5_4 | 109,383 | 143.10 | 0.57 | 35.00 | 0.68 | - | 0.20 | 194.52 | 0.00 | - | - | - | - | - | - |
| 24 | OR5X250_0.75_4 | 152130 | 85.15 | 0.42 | 22.80 | 0.67 | - | 0.13 | 162.2 | 2.32 | - | - | - | - | - | - |
| 25 | OR10X250_0.25_7 | 58,704 | 326.00 | 0.93 | 71.00 | 1.05 | - | 0.83 | 201.31 | 0.00 | - | - | - | - | - | - |
| 26 | OR10X250_0.5_2 | 108,717 | 490.00 | 0.09 | 90.00 | 0.11 | - | 0.39 | 248.56 | 0.01 | - | - | - | - | - | - |
| 27 | OR10X250_0.75_4 | 151,324 | 535.00 | 0.34 | 130.10 | 0.56 | - | 0.23 | 222.21 | 0.04 | - | - | - | - | - | - |
| 28 | OR30X250_0.25_3 | 56,614 | 2405.00 | 0.70 | 390.00 | 1.12 | - | 1.55 | 287.24 | 0.21 | - | - | - | - | - | - |
| 29 | OR30X250_0.5_3 | 106,442 | 2260.25 | 0.46 | 450.00 | 0.63 | - | 0.71 | 324.08 | 0.15 | - | - | - | - | - | - |
| 30 | OR30X250_0.75_3 | 153,158* | 3933.40 | 0.29 | 840.00 | 0.51 | - | 0.39 | 262.54 | 0.13 | - | - | - | - | - | - |
| Algorithm | Instance Number | |||||||||||||||||
|---|---|---|---|---|---|---|---|---|---|---|---|---|---|---|---|---|---|---|
| 13 | 14 | 15 | 16 | 17 | 18 | 19 | 20 | 21 | 22 | 23 | 24 | 25 | 26 | 27 | 28 | 29 | 30 | |
| SA-high | 0 | 0 | 0.02 | 0.43 | 0.33 | 0.21 | 0.14 | 0.34 | 0.1 | 0.67 | 0.57 | 0.42 | 0.93 | 0.09 | 0.34 | 0.7 | 0.46 | 0.29 |
| CF-LAS | 1.16 | 0.53 | 0.4 | 2 | 1.02 | 0.58 | 3.45 | 1.56 | 0.92 | 0.42 | 0.2 | 0.13 | 0.83 | 0.39 | 0.23 | 1.55 | 0.71 | 0.39 |
| RSH | 0 | 0 | 0 | 0 | 0 | 0 | 0.19 | 0 | 0 | 0 | 0 | 2.32 | 0 | 0.01 | 0.04 | 0.21 | 0.15 | 0.13 |
Publisher’s Note: MDPI stays neutral with regard to jurisdictional claims in published maps and institutional affiliations. |
© 2021 by the authors. Licensee MDPI, Basel, Switzerland. This article is an open access article distributed under the terms and conditions of the Creative Commons Attribution (CC BY) license (https://creativecommons.org/licenses/by/4.0/).
Share and Cite
Eraña-Díaz, M.L.; Cruz-Chávez, M.A.; Juárez-Pérez, F.; Enriquez-Urbano, J.; Rivera-López, R.; Acosta-Flores, M. Optimization Method to Address Psychosocial Risks through Adaptation of the Multidimensional Knapsack Problem. Mathematics 2021, 9, 1126. https://doi.org/10.3390/math9101126
Eraña-Díaz ML, Cruz-Chávez MA, Juárez-Pérez F, Enriquez-Urbano J, Rivera-López R, Acosta-Flores M. Optimization Method to Address Psychosocial Risks through Adaptation of the Multidimensional Knapsack Problem. Mathematics. 2021; 9(10):1126. https://doi.org/10.3390/math9101126
Chicago/Turabian StyleEraña-Díaz, Marta Lilia, Marco Antonio Cruz-Chávez, Fredy Juárez-Pérez, Juana Enriquez-Urbano, Rafael Rivera-López, and Mario Acosta-Flores. 2021. "Optimization Method to Address Psychosocial Risks through Adaptation of the Multidimensional Knapsack Problem" Mathematics 9, no. 10: 1126. https://doi.org/10.3390/math9101126
APA StyleEraña-Díaz, M. L., Cruz-Chávez, M. A., Juárez-Pérez, F., Enriquez-Urbano, J., Rivera-López, R., & Acosta-Flores, M. (2021). Optimization Method to Address Psychosocial Risks through Adaptation of the Multidimensional Knapsack Problem. Mathematics, 9(10), 1126. https://doi.org/10.3390/math9101126