Article

Defocused Image Deep Learning Designed for Wavefront Reconstruction in Tomographic Pupil Image Sensors

by
Sergio Luis Suárez Gómez
1,2,*,
Francisco García Riesgo
2,3,
Carlos González Gutiérrez
3,4,
Luis Fernando Rodríguez Ramos
5 and
Jesús Daniel Santos
2,3
1
Department of Mathematics, University of Oviedo, 33007 Oviedo, Spain
2
Instituto Universitario de Ciencias y Tecnologías Espaciales de Asturias (ICTEA), 33004 Oviedo, Spain
3
Department of Physics, University of Oviedo, 33007 Oviedo, Spain
4
Computer Sciences Department, University of Oviedo, 33024 Gijón, Spain
5
Instituto de Astrofísica de Canarias, 38205 San Cristóbal de La Laguna, Spain
*
Author to whom correspondence should be addressed.
Mathematics 2021, 9(1), 15; https://doi.org/10.3390/math9010015
Submission received: 24 November 2020 / Revised: 18 December 2020 / Accepted: 19 December 2020 / Published: 23 December 2020

Abstract

:
Mathematical modelling methods have several limitations when addressing complex physics whose calculations require considerable amount of time. This is the case of adaptive optics, a series of techniques used to process and improve the resolution of astronomical images acquired from ground-based telescopes due to the aberrations introduced by the atmosphere. Usually, with adaptive optics the wavefront is measured with sensors and then reconstructed and corrected by means of a deformable mirror. An improvement in the reconstruction of the wavefront is presented in this work, using convolutional neural networks (CNN) for data obtained from the Tomographic Pupil Image Wavefront Sensor (TPI-WFS). The TPI-WFS is a modified curvature sensor, designed for measuring atmospheric turbulences with defocused wavefront images. CNNs are well-known techniques for its capacity to model and predict complex systems. The results obtained from the presented reconstructor, named Convolutional Neural Networks in Defocused Pupil Images (CRONOS), are compared with the results of Wave-Front Reconstruction (WFR) software, initially developed for the TPI-WFS measurements, based on the least-squares fit. The performance of both reconstruction techniques is tested for 153 Zernike modes and with simulated noise. In general, CRONOS showed better performance than the reconstruction from WFR in most of the turbulent profiles, with significant improvements found for the most turbulent profiles; overall, obtaining around 7% of improvements in wavefront restoration, and 18% of improvements in Strehl.

1. Introduction

Adaptive optics (AO) is one fundamental technique used for improving the quality of images taken from grounded telescopes, and one of the key mechanisms for actual large telescopes. The atmosphere distorts the wavefront of the light that passes through it, and consequently the images taken with ground telescopes. The implementation of AO allows one to achieve corrections for the optical bands at which AO systems are operating today, usually with the use of wavefront sensors such as that of Shack–Hartmann (SH) for measurements, as well as reconstruction algorithms and deformable mirrors (DM) for implementing the correction [1].
As an alternative to classical SH sensors, the Tomographic Pupil Image Wavefront Sensor (TPI-WFS) was developed, as a modified curvature sensor [2]. This new sensor has proven successful at measuring the turbulence of the atmosphere, presenting some advantages such as, for example, better quality than a SH sensor when considering low light illumination regime; it is also more stable when changes in the optical parameters are introduced [3,4].
Nowadays, the amounts of data generated in the majority of the science branches lead to a series of techniques based on processing these amounts of data to extract features or adjust models automatically to the information contained within the data [5,6,7]. One of the techniques used to deal with this huge amount of information is artificial neural networks (ANN), used in several science branches for modeling complex systems. In particular, during recent years, convolutional neural networks (CNNs) have shown great success in image recognition, language processing, etc. [8,9,10], leading to the development of a new branch in artificial intelligence known as deep learning [11]. In addition, several artificial intelligence approaches to AO have been developed recently, as in [12], or those reviewed in [13].
Among them, deep learning techniques have been useful in the field of AO along with SH sensors, such as the Complex Atmospheric Reconstructor based on Machine Learning (CARMEN) [14]. This reconstruction algorithm uses data taken from the SH sensor, and provides a tomographic reconstruction of the atmospheric profile, allowing one to compensate for the aberrated wavefront by means of a deformable mirror [15]. The improvement of this deep learning approach has been tested for the adaptive optics reconstruction during night observations in real telescopes or even alternative validation procedures of the techniques previously to its on-sky implementation [16,17].
The present paper includes the results from a comparison performed between the restoration proposed initially for the TPI-WFS and a CNN reconstruction, trained with computational simulations implemented on a Graphics Processing Unit (GPU). This research is based on the early models presented with its previous results from [18], where a preliminary model of the CNN reconstructor is trained to reconstruct phases of up to 25 Zernike modes satisfactorily [19]. Based in the topology from the preliminary model, the reconstruction technique presented in this work, which is named Convolutional Neural Networks In Defocused Pupil Images (CRONOS), allows us to compensate turbulences in complex situations, for example with higher resolutions, using phase wavefronts of 153 Zernike modes. Different scenarios of turbulence strength are considered; also, three different situations with simulated noises of different signal-noise intensity are included. Data are simulated to supply all the necessary information about the wavefront and turbulent profiles, providing reference values that allow valid comparations between the techniques.
The paper is structured as follows: Section 2 shows an explanation about the techniques, as well as a detailed description about AO, the sensor TPI-WFS and its reconstruction technique, the CNNs and details about the performed simulations. These techniques explain the base for the sensing and turbulent wavefront reconstruction required for the work. Moreover, the setup for CRONOS and its training is detailed in this section. The performance of both methods is shown in Section 3, considering optical and absolute error measurements. The obtained results are analyzed in Section 4, along with the discussion of behavior and computational times. Section 5 includes the conclusions of the work, along with some insight on some possible future research lines that are a consequence of this study.

2. Materials and Methods

2.1. Adaptive Optics Systems

AO systems are fundamental for the astronomical observations performed with grounded telescopes at visible wavelengths. The purpose of AO is to correct images by measuring the wavefront distortions in the incoming light and compute, with an estimation of the turbulences, the corrections that are needed for the image. Moreover, these measurements give information to determine the shape that the deformable mirrors have to adopt in order to compensate for the aberrations of the wavefront, adjusting to the extremely fast changing atmosphere [20].
In real telescopes, the speed at which these changes can be measured depends on the real-time control system, but the sampling frequencies of these systems vary from 250 to 1000 Hz [21], even for the next generation of extremely large telescopes, such as the ELT [22].
The measurements of the turbulences are determined with sensors, such as the SH or the TPI-WFS, over the scientific objects. The obtained measurements allow the estimation of the turbulent profiles, which are performed with computer tomography techniques, used for the compensation of the astronomical image with deformable mirrors [15,23].
One key element of AO is the possibility of using the same image for science and atmospheric correction. When light comes into the telescope, it passes through a beam splitter which reflects most of the light to the science camera and a small part of its energy to the wavefront sensors, which obtain information about the turbulence that is affecting the science object and pass it to the tomographic reconstructor that compensates for the introduced aberration [24].
Several algorithms are currently in use to solve this problem, such as least-squares (LS) type matrix vector multiplication [25], the Learn and Apply (L&A) method [26], and CARMEN [14]. The latter is a reconstructor based on deep learning techniques for multi-object adaptive optics [26], which showed promising results in the AO field [14], both in simulation [27] and on-sky [16].
The development of reconstruction techniques, due to the improvements that can be achieved thanks to new instruments, such as TPI-WFS or sensors in large telescopes, implies some inconveniences, such as the necessity of having enough computational capability to manage enormous amounts of retrieved data [28]. The use of GPUs offers a solution to this issue based on its capacity for parallelization and consequently speeding up the processing times. There are some approximations to adapt existing reconstructors to the use of GPUs, such as Learn and Apply [29] and other improvements found in the execution and training of neural networks in this field [30,31,32].

2.2. TPI-WFS

TPI-WFS sensor was developed with the aim of improving the measures of the turbulence that can be obtained by a SH wavefront sensor, where the turbulence is determined by the centroids obtained from all the sub-apertures of the sensor [6]. This becomes a disadvantage since it sets a limitation for the value of the reference stars magnitude and the correspondent wavefront reconstructions. The main goal of using a TPI-WFS based instrument is to introduce improvements in the sky coverage.
As shown in Figure 1, the TPI-WFS obtains two defocused images near the pupil plane that are processed by the Wave-Front Reconstruction (WFR) software developed for this sensor, based on the algorithm from van Dam et al. [33]. The sensor measures two defocused pupil images taken at two different planes in order to obtain values for other calculations, as the intensity of light at these planes. Both images formed in the image space before and after the focal plane allow us to have equidistant measurements before and after the pupil in the object space.
The TPI-WFS recovers the wavefront aberrations from the intensity measurements (I1 and I2) of the defocused images, using the first derivative. The reconstruction of WFR is based on these measures; the slope of the wavefront through linear relationships is obtained from geometric optics [34].
The experimental device is similar to the curvature sensor, where two measurements at distances ± z from the focal plane of the telescope are taken. The TPI-WFS sensor obtains the slopes of the wavefront without using any spatial or temporal modulation, as the SH does.
Measurements are obtained from the Probability Density Function (PDF) that represents the probability that a photon of the beam will be received in the telescope. As the photons are scattered due to atmospheric turbulence, the value of the PDF function will vary. An important aspect of this measurement method is that the value of the intensity of the propagated wave is represented by the PDF function.
In particular, as the telescope has a circular aperture, the function of the wavefront is usually expressed at the base of the Zernike polynomials [35]:
W ( x , y ) = k = 1 d k Z k
where d k is the coefficient of the correspondent Zernike polynomial Z k . The method requires projections of the PDF in each of the directions. When modeling the PDF function as a discontinuous function f X ( x ) , it can be projected on the axis 0Y, as follows:
P D F X ( x ) = f X ( x ) = f X Y ( x , y ) d y
The Cumulative Distribution Function (CDF) is obtained with the integration of the marginal PDF.
C ( x ) = x f X ( x ) d x
The same would be done for ( y ) . From the intersections of the CDF lines, the slopes for each axis can be obtained with the ordinates u 1 ( i ) and u 2 ( i ) . The following relationship is used to obtain slope estimates, where z is the distance in the direction of the wave propagation:
W x [ u 1 ( i ) + u 2 ( i ) 2 ] = u 1 ( i ) u 2 ( i ) 2 z
When projected in the orthogonal directions of (x, y), the Zernike polynomials correspond to a reduced set of modes. For obtaining more modes, projections must be made in a larger range of angles. The Radon Transform [36] is used to rotate a function along a range of angles and obtaining linear integrals; for the case of the function f X Y ( x , y ) , it would be denoted as [ f X Y ( x , y ) ] or P ( u , α ) and expressed as:
P ( u , α ) = L f X Y ( x , y ) d l
With the path
L = [ ( x , y ) :   x c o s α + y s i n α = u ]
For each angle α , the slope of the Zernike polynomial is obtained for the orthogonal direction of each projection as:
H α ( u , Z i ) = 1 L ( u ) [ δ Z i ( x , y ) δ x c o s α + δ Z i ( x , y ) δ y s i n α , α ]
For a circle of radius R ,
L ( u ) = 2 R 2 u 2
Therefore, the Zernike coefficients that are obtained from a least square fit the data p α ( u ) with the fitted model H α ( u , Z i ) ,
d i = [ H α ( u , Z i ) T   H α ( u , Z t ) ] 1 H α ( u , Z i ) T p α ( u )
Reliable results in the implementation of computer simulations were obtained by this method up to now, when wavefronts were measured [33,34].

2.3. Deep Learning

The mathematical model of ANNs was originally developed to imitate the structure of biological neural networks and the relation of its components [37,38]. Based on the archetype of biological neurons, these models were developed with the support of the advances in computational capability and with the aim of achieving two main goals. First, the interconnection of series of processing elements called neurons or nodes that generate a response once an input is provided. Second, the ability of correcting these outputs or responses with a process, also known as learning, or adjusting the interconnections to better fit the reality that it is aimed to be modelled.
The architecture of the ANNs consists of organized layers. The connections between neurons are settled from the ones belonging to a layer to those belonging to the adjacent layers, where the value that characterizes each connection, called weight, is set for each possible pair of neurons, representing the influence that the neuron has in its neighbouring ones. The neuron sends the result ( y l j , the output value of neuron j ) to the neurons of the next layer. The calculation performed by each neuron is expressed as follows:
y l j = f ( i = 0 n w l j i y l 1 i ) , i = 0 ,   ,   n ;   j = 1 ,   ,   m
where w l j i is the weight of neuron i of layer l 1 to neuron j of layer l (note that layer l 1 has, consequently, up to n neurons, as layer l has up to m neurons). Once the signal has advanced through all the layers of the network, the signal given by the last one, the output layer constitutes the response of the network to the given input.
Usually, an activation threshold or bias is included in the calculation of the responses of each neuron for each input pattern x in the neuron, of the form f ( j w j i x j ( t ) b i ( t ) ) . In each layer, an activation function is used to transform the input of the neurons, processing the correspondent inputs and weights. These activation functions introduce non-linearity that improves the training process [39].
This structure or topology, shown in Figure 2, along with the training process for the correction of the weights, conforms with one of the most well-known models of ANN, the Multi-Layer Perceptron (MLP).
Since the training process allows these techniques to learn directly from data measurements [17], ANNs are particularly useful for modeling, forecasting and prediction [15], being widely known for their capacity of representing both linear and non-linear models, and for extrapolating that knowledge to unknown data.
As a further step in the evolution of ANNs, other models were developed, as the CNNs [40]. Many different systems can be studied by this type of model, and in comparison, a better performance is obtained in scenarios such as document recognition [41], image classification [10,42] or speech recognition [43].
CNNs are characterized by the use of convolutional layers, which allow the use of more formats of data, such as images. The most relevant features of the data to be modelled can be extracted using several filters introduced in these new layers. Each of them is convoluted along the full image, generating a new set of processed images.
An activation function is applied after the convolution. In the case of the convolutional layers, the most common one is the rectified linear unit (ReLU) [44]. Usually, a pooling layer is employed in order to post-process the output of the layer [9]. The size of images is then reduced when the maximum or mean value of a region of pixels is extracted. This set of layers (convolutional with activation function and pooling layer, if used) could be nested several times, reducing the size of the input image, while increasing the number of total images for each set of layers included in the topology. At the end of this process, the feature maps reach the final layers which are set as an MLP, where the features selected with the convolutional layers are reshaped as a vector, if needed, to be used as inputs of the MLP, and provides the desired output [45]. The topology of a CNN is illustrated in Figure 3.
In order to train the CNN, the weights connecting consecutive layers of the MLP and the weights of the filters in the convolutional layers have to be properly calculated. This can be done by using the backpropagation algorithm [46], which allows us to compute the values of all the connections, by minimizing the error of the outputs in an iterative process.
The error is measured with the loss or objective function, which is commonly a quadratic cost function M S E = 1 n n | | y ^ y | | 2 . In addition, other loss functions such as mean absolute error, cross entropy, or the logarithm of the hyperbolic cosine might be used as well, depending on the considered problem.
The Stochastic Gradient Descent is usually implemented, which is based on the minimization of an objective function and the updating of the parameters of the network in the opposite direction of the calculated gradient of the loss function C with respect to each weight, in order to move the solution of the multidimensional optimization problem towards a local minimum, with a fixed size for each step, also known as learning rate, Δ v = η C , where η defines the learning rate.
However, there are abundant variations; for this work, the approach used was Nesterov accelerated gradient with a quadratic loss as objective function. This algorithm is based on a particular inclusion of momentum, the parameter used for tuning the size of the steps over iterations, with the aim of avoiding the local minimum [47].

2.4. Simulations and Network Training

The initial simulations for TPI-WFS were designed for the use of a telescope with a deformable mirror that was able to correct up to the first 25 Zernike modes [18]. Phases of the 25 Zernike modes were employed for the training of this network. The turbulence at the atmospheric layers was simulated varying the values of the Fried coherence length (r0) [48], the atmospheric strength parameter. Values of r0 for these simulations ranged from 5 to 20 cm, and with wavelength of 590 nm for all cases.
For comparison of the phases obtained by both the original WFR and the new CNN reconstructor, the original simulated phase, or reference phase, was used. In this case, the comparison considered the recovered phases using only 25 Zernike modes, due to the limitation of the resolution of the deformable mirror, although the reference phase contained 153 Zernike modes.
For the CRONOS reconstructor presented in this work, the simulations were prepared for a deformable mirror with a higher resolution, being able to correct wavefronts with Zernike representation with 153 coefficients. Consequently, values of r0 ranging from 5 to 20 cm for wavefronts with 153 Zernike modes were included in the simulations. In addition, the further comparison was performed with the WFR reconstruction with the 153 Zernike modes simulated data.
Specifically, CRONOS was trained with 1,500,000 square images with 56 pixels of side. The images included 2 channels; intra and extra images (Figure 4) that correspond with the I1 and I2 presented in Figure 1.
Before setting a topology for CRONOS, several network topologies were checked, changing the numbers and sizes of layers and kernels. Among all the topologies that performed similarly, CRONOS was chosen as the one with the best balance between computational performance and quality of the results. The topology of CRONOS consisted of 6 convolutional layers with 5 × 5 kernels, and afterwards ReLU was applied. A Max-Pooling of 2 × 2 was computed for each 2 convolutional layers, leading to 128 images with a side of 7 pixels. These were used as the inputs of the fully connected layers, with 6272 neurons in the first layer with a hidden layer of 3136 neurons and 153 output values.
For testing, a new set including 5000 images for each value of r0 was generated. These images were used as reference phases to compare with the correspondent reconstructions of 153 Zernike modes.
In addition, as the presented reconstructor aimed to perform satisfactorily even with external noise, three additional sets of simulations were computed to check the performance of the network with noise; for example, the noise produced by the electronics of the sensor. The simulations are prepared as the 153 Zernike test set, but including a Gaussian distribution for the noise. The simulated cases included signal-to-noise ratios of 30, 20 and 10 dB. The signal-to-noise ratio refers to the proportion of the intensity of the signal and the intensity of the noise that distorts the signal, consequently the case of 30dB is the less noisy and 10 dB has the stronger noise.

3. Results

The results from the reconstruction with CRONOS are compared with the WFR reconstruction using, as optical measurements, mean structural similarity (MSSIM) and Strehl ratio [49]. The recovered phases are compared with the reference phase providing the difference between pixel values.
The quality of the image of the reconstruction using both methods can be given by MSSIM, which takes values from 0 (completely dissimilar) to 1 (completely similar). The quality of the peak intensity of the images is measured by the well-known Strehl, which varies between 0 and 1 for the non-aberrated image.

3.1. Results for Reconstruction with 153 Zernike Modes

In the particular case of 153 Zernike modes without noise, the comparison of the quality of both reconstructors was performed with the MSSIM and Strehl error measurements. In Figure 5, it is possible to observe how CRONOS has a higher MSSIM in lower r0, which shows that, for strong turbulence profiles, it is a better solution than WFR. However, when the atmospheric turbulence is weaker, WFR is able to match and even provide a slightly improvement over CRONOS.
In Figure 6, the Strehl ratio provides a different view of the quality of both reconstructors. CRONOS is better for all the different r0, although in this case, the difference is higher in the less dense turbulence profiles. It is interesting to notice how for lower r0, the value of the Strehl ratio is considerably low, although in Figure 6, the similarity of both images was quite high.

3.2. Results for Reconstruction with 153 Zernike Modes Including Noise

In this subsection, the performance of both reconstructors is compared when noise is included in the simulations. The used test for this comparison was defined in Section 2.4; the simulations included a signal-noise relation of 10, 20 and 30 dB of added noise.
As it happens in the simulations without noise, CRONOS has much better performance than WFR in terms of the MSSIM. In the less noisy situations, the performance of CRONOS is almost equal to the cases without noise, which means that the reconstructor is quite robust against low noise intensities, at least in terms of similarity, as can be seen in Figure 7. Furthermore, both techniques of reconstruction reach low values of similarity with the reference phases in strong turbulence profiles, regardless of the intensity of the noise.
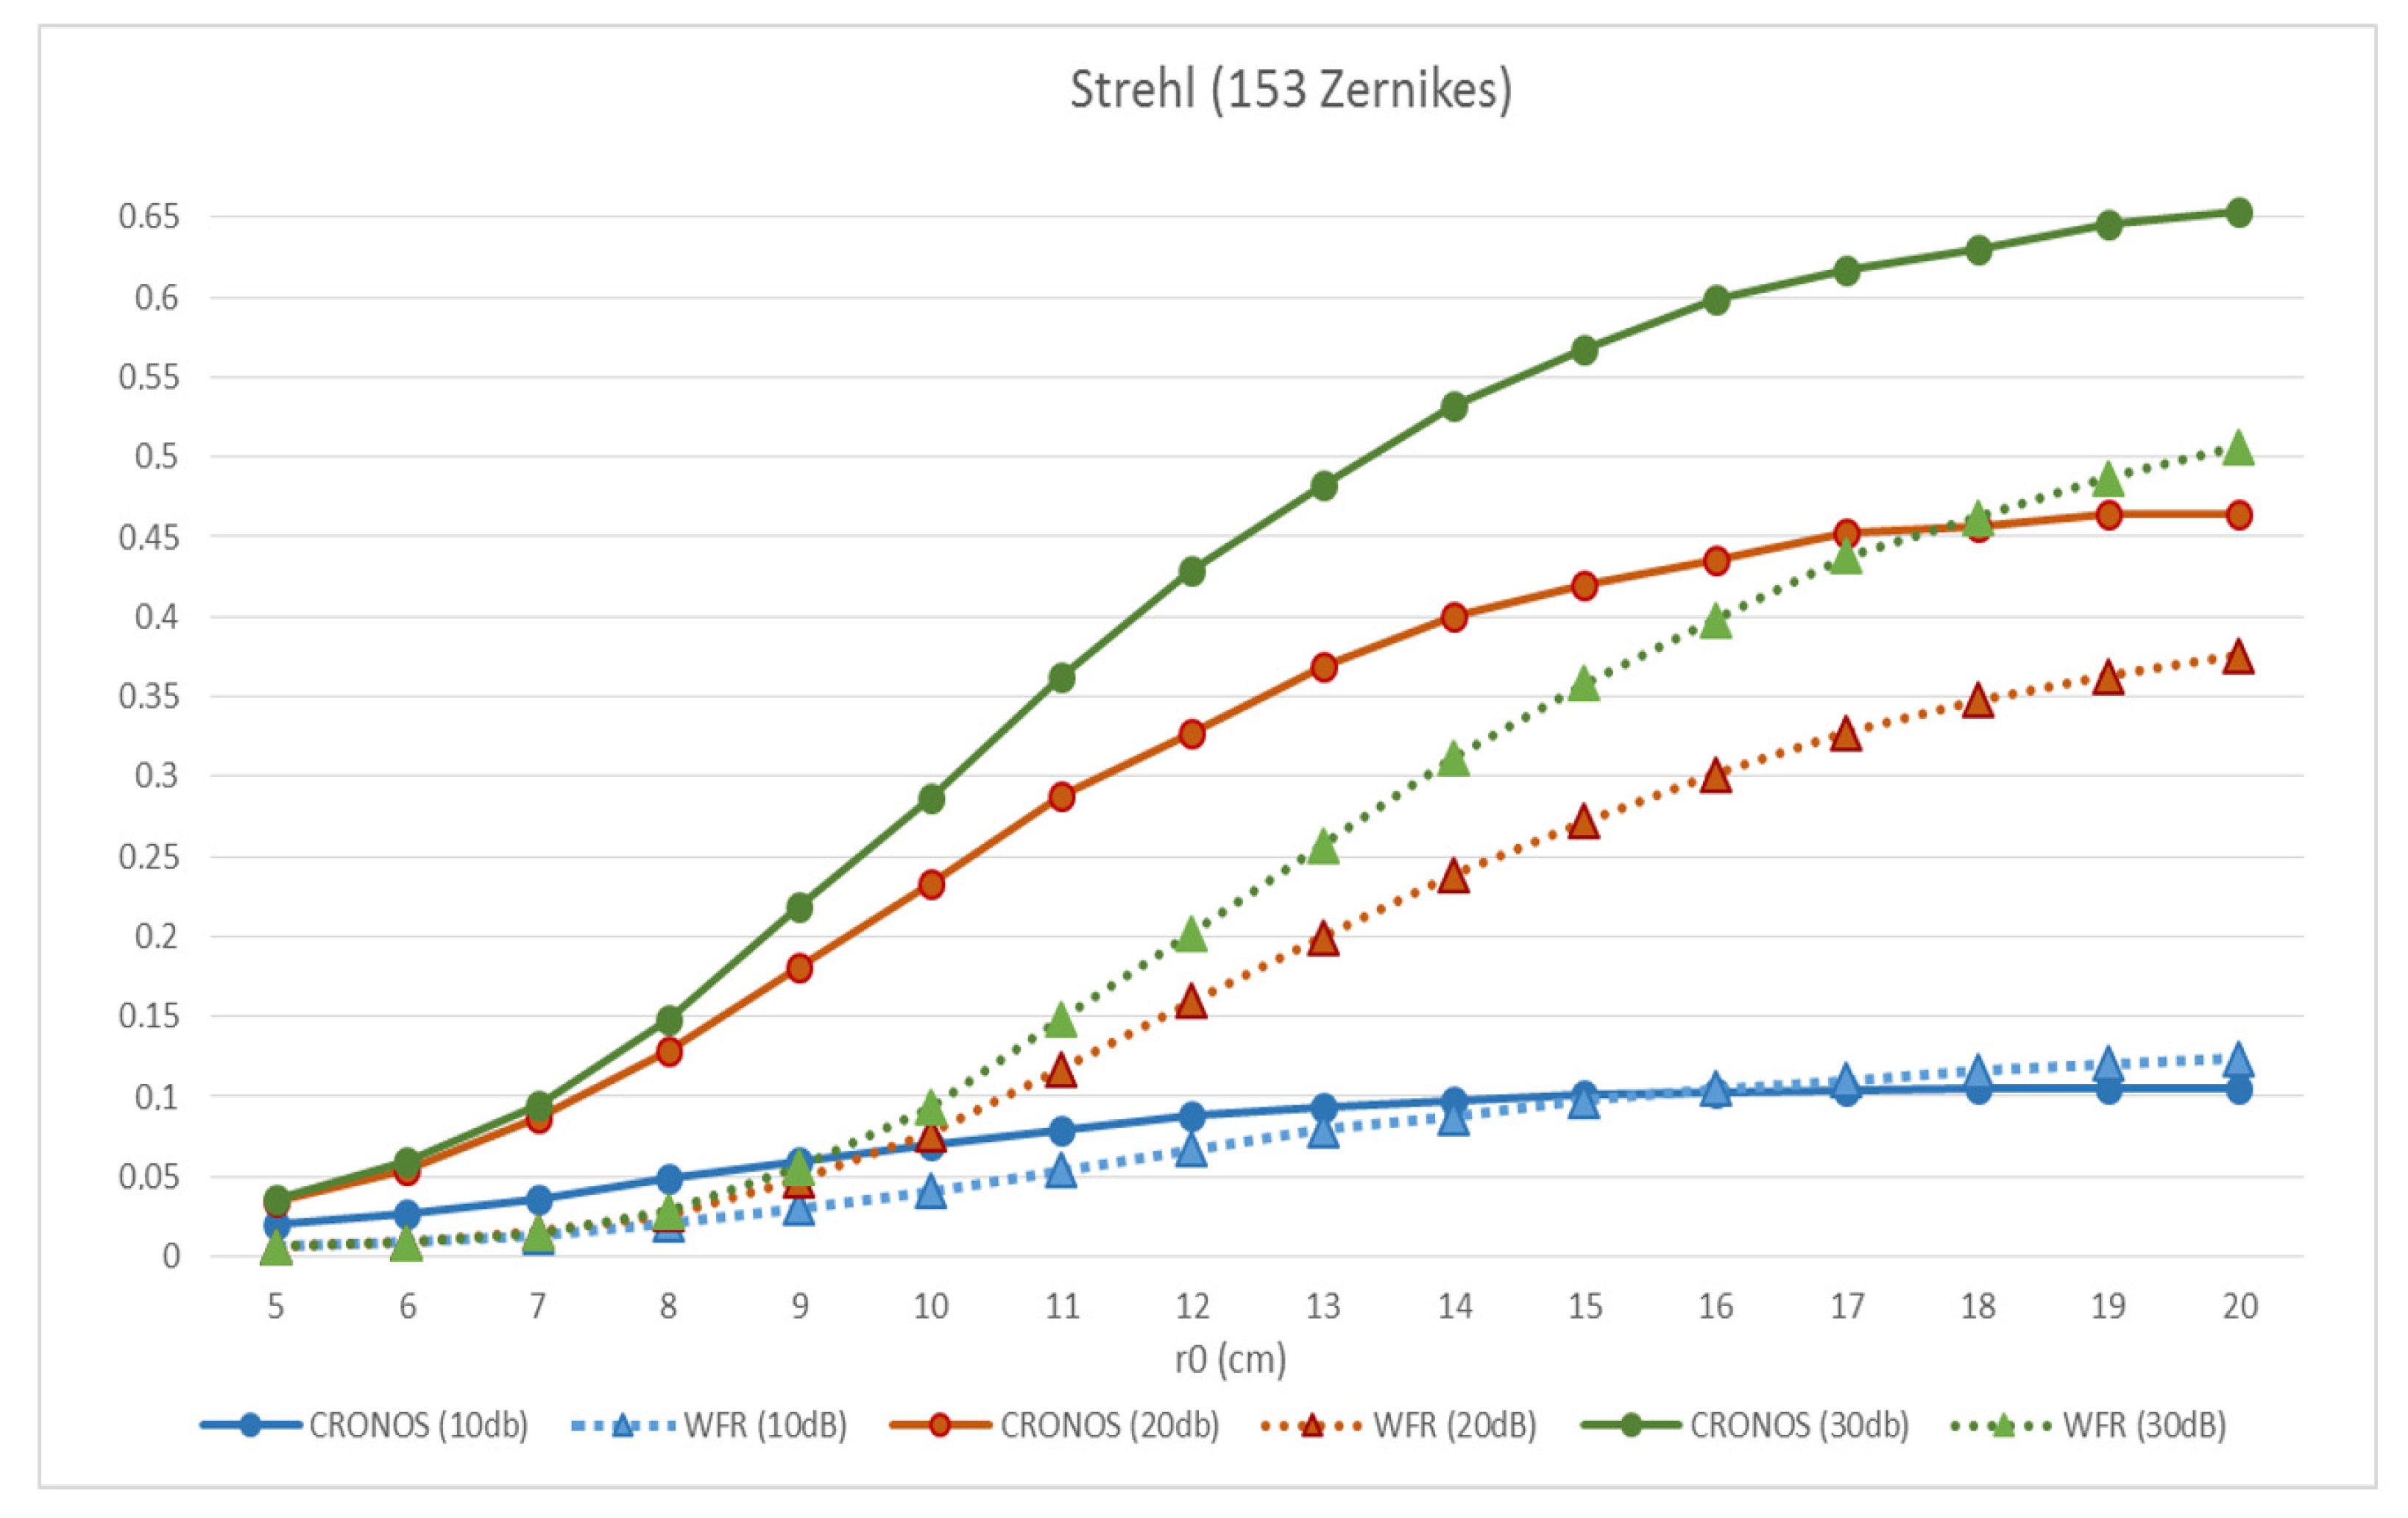
In terms of Strehl ratio in Figure 8, CRONOS provides better results than WFR. In the cases of low noise, the difference between both reconstructors is quite high, in particular for higher r0. However, with a 10dB signal-to-noise ratio, the reconstruction of both systems is limited, and even WFR is able to outperform CRONOS in less dense turbulence profiles.

4. Discussion

The main reason for the improvements that CRONOS achieves over WFR software relies on the training process. Computational simulations have made it possible to generate data with high variability of turbulent profiles adequately. Essentially, the scenarios with the largest atmospheric turbulence, where r0 reaches the lowest values, have the same relevance for training the ANN as the rest of profiles.
Regarding the 153 Zernike modes scenario, the best results according to MSSIM are attained by CRONOS, as can be inferred from Figure 5. In the most turbulent profiles, both reconstructors performed worse reconstructions than in less turbulent profiles. For higher values of r0, results from both techniques were very similar, up to 95% of precision in the reconstruction. The results provided by the CNN applied in the most turbulent cases improve the obtained with the WFR reconstructor. These results match the expectations of the work, considering the capability of the CNNs to extract the most relevant feature of each case presented.
With the same reasoning, the Strehl ratio shown in Figure 6 is able to reach high values. Despite both methods showing improvements for high r0 values (i.e., less turbulent profiles), the most turbulent cases seem not to provide enough information to recover the adequate values of intensities, as can be seen in Strehl. As MSSIM also shows, CRONOS has better performance than WFR reconstruction in all the considered r0 values reaching values up to 0.7 of Strehl.
Noise cases, which are presented in Figure 7 and Figure 8, prove the good performance of CRONOS. In the case with higher signal-noise intensity, with 10dB of noise, achieved an MSSIM of up to 84% of similarity, with the same performance of both reconstructors in values of r0 of 15 cm and higher. For lower values of r0 than 15 cm, CRONOS performs better reconstruction. The consequences of having this level of noise are more noticeable in the Strehl, whose values are quite low for both techniques, not achieving values higher than 0.12, and revealing the difficulties of resolving the intensity of the signals. However, the Strehl values are slightly better for the WFR reconstruction in the less turbulent scenarios.
For the case of 20 dB, both techniques perform more reasonable reconstructions, and the tendency of CRONOS performing better in all the turbulent profiles is shown again. The similarity index MSSIM reaches up to 93% for CRONOS and up to 91% for the WFR reconstruction. The Strehl values improve the previous case, reaching values of 0.46 for CRONOS.
In the scenario with lower noise, the values obtained are closer to those obtained in the case without noise, reaching up to 95% of MSSIM performance and 0.65 of Strehl value for CRONOS, performing better than WFR reconstruction in all the turbulent profiles.
The differences can be explained, for example, considering that the model of the sensor is an approximation, preventing the WFR reconstruction to achieve better results. Moreover, in the presence of noise, the WFR reconstruction, which follows a minimization process, has a conditioning and an eigenvalue clustering that is less suited to the problem than in the CNN case, leading to more noise propagation than the latter. In addition, the WFS is non-linear, implying that artificial intelligence techniques such as CNNs are a good proposal, since they are particularly good in such cases.
Regarding the computational cost; recall times for the WFR software were 1.950 ± 0.175 milliseconds in GPU (Nvidia Titan Z). The CRONOS model was also trained and applied in the same GPU, achieving recall times of 1.575 ± 0.85 milliseconds.

5. Conclusions and Future Lines of Research

In this work, an alternative to the reconstruction from the WFR using the measurements obtained by the defocused image sensors TPI-WFS is proposed. The neural network approach to the problem of the AO reconstruction was adequate, leading to the presentation of the reconstuctor CRONOS. The CNNs used images as inputs and successfully acquired their significant characteristics. In addition, the use of GPUs has provided significant improvements regarding the computational cost; it is possible to train a model in a few hours and to get a single output in less than two milliseconds.
The two reconstruction methods of neural networks and CNNs were compared with data from simulations, using high resolution in wavefronts in the scenario of 153 Zernike modes. In addition, scenarios with different signal-to-noise ratios were included. The two methods showed remarkable results in most of the turbulent profiles; however, CRONOS improved the WFR reconstructions, giving better results for the stronger turbulence cases. In general, CRONOS obtained around 7% of improvements in wavefront restoration, and 18% of improvements in Strehl, when compared to WFR reconstruction. Consequently, the presented reconstructor CRONOS represents a valuable alternative for AO reconstruction with this kind of sensors, even in situations with external noise.
The employment of different artificial intelligence techniques, such as recurrent real-time learning, might increase the performance of the reconstruction. One of the clearer paths for evaluating this idea is the inclusion of recurrence in the neural networks models here developed, or even checking the results that non-supervised learning techniques could achieve.
Previously, good results were achieved with online training for reconstruction techniques based on neural networks with other sensor measurements, being a possible way to improve the performance of CRONOS. This also could help in reaching one of the most relevant open lines, the implementation of the reconstruction technique CRONOS on telescopes, for testing its performance not only in simulations, but in a real environment.

Author Contributions

L.F.R.R. and F.G.R. conceived and designed the study. L.F.R.R. presented the sensor, performed simulations for the sensor data. S.L.S.G. and C.G.G. contributed to the production of the models and analysis of the results. S.L.S.G. performed the comparisons and the preparation of the manuscript. J.D.S. contributed with interpretation of the results and with the preparation of the final version of the manuscript. All authors have read and agreed to the published version of the manuscript.

Funding

This research was funded by the Spanish Economy and Competitiveness Ministry with grant number AYA2017-89121- P.

Institutional Review Board Statement

Not applicable.

Informed Consent Statement

Not applicable.

Data Availability Statement

The data presented in this study are available on request from the corresponding author. The data are not publicly available due to its large size.

Conflicts of Interest

The authors declare no conflict of interest.

References

  1. Roddier, C.; Roddier, F. Wave-front reconstruction from defocused images and the testing of ground-based optical telescopes. JOSA A 1993, 10, 2277–2287. [Google Scholar] [CrossRef]
  2. Fernández-Valdivia, J.J.; Trujillo-Sevilla, J.M.; Casanova-González, O.; López, R.L.; Velasco, S.; Colodro-Conde, C.; Puga, M.; Oscoz, A.; Rebolo, R.; Mackay, C.; et al. Real time phase compensation using a tomographical pupil image wavefront sensor (TPI-WFS). In Proceedings of the Information Optics (WIO), 2016 15th Workshop, Barcelona, Spain, 11–15 July 2016; pp. 1–2. [Google Scholar]
  3. Fernández-Valdivia, J.J.; Sedano, A.L.; Chueca, S.; Gil, J.S.; Ridriguez-Ramos, J.M. Tip-tilt restoration of a segmented optical mirror using a geometric sensor. Opt. Eng. 2013, 52, 56601. [Google Scholar] [CrossRef] [Green Version]
  4. Colodro-Conde, C.; Velasco, S.; Fernández-Valdivia, J.J.; López, R.; Oscoz, A.; Rebolo, R.; Femenía, B.; King, D.L.; Labadie, L.; Mackay, C.; et al. Laboratory and telescope demonstration of the TP3-WFS for the adaptive optics segment of AOLI. Mon. Not. R. Astron. Soc. 2017, 467, 2855–2868. [Google Scholar] [CrossRef]
  5. Lasheras, J.E.S.; Donquiles, C.G.; Nieto, P.J.G.; Moleon, J.J.J.; Salas, D.; Gómez, S.L.S.; de la Torre, A.J.M.; González-Nuevo, J.; Bonavera, L.; Landeira, J.C.; et al. A methodology for detecting relevant single nucleotide polymorphism in prostate cancer with multivariate adaptive regression splines and backpropagation artificial neural networks. Neural Comput. Appl. 2018, 32, 1231–1238. [Google Scholar] [CrossRef]
  6. De Andrés, J.; Sánchez-Lasheras, F.; Lorca, P.; De Cos Juez, F.J. A hybrid device of Self Organizing Maps (SOM) and Multivariate Adaptive Regression Splines (MARS) for the forecasting of firms’ bankruptcy. Account. Manag. Inf. Syst. 2011, 10, 351. [Google Scholar]
  7. Artime Ríos, E.M.; del Mar Seguí Crespo, M.; Suárez Sánchez, A.; Suárez Gómez, S.L.; Sánchez Lasheras, F. Genetic algorithm based on support vector machines for computer vision syndrome classification. In Proceedings of the International Joint Conference SOCO’17-CISIS’17-ICEUTE’17, León, Spain, 6–8 September 2017; pp. 381–390. [Google Scholar]
  8. Mirowski, P.W.; LeCun, Y.; Madhavan, D.; Kuzniecky, R. Comparing SVM and convolutional networks for epileptic seizure prediction from intracranial EEG. In Proceedings of the Machine Learning for Signal Processing, 2008. MLSP 2008. IEEE Workshop, Cancun, Mexico, 16–19 October 2008; pp. 244–249. [Google Scholar]
  9. Nagi, J.; Ducatelle, F.; Di Caro, G.A.; Cireçsan, D.; Meier, U.; Giusti, A.; Nagi, F.; Schmidhuber, J.; Gambardella, L.M. Max-pooling convolutional neural networks for vision-based hand gesture recognition. In Proceedings of the Signal and Image Processing Applications (ICSIPA), 2011 IEEE International Conference, Kuala Lumpur, Malaysia, 16–18 November 2011; pp. 342–347. [Google Scholar]
  10. Krizhevsky, A.; Sutskever, I.; Hinton, G.E. Imagenet classification with deep convolutional neural networks. In Proceedings of the Advances in Neural Information Processing Systems, Lake Tahoe, NV, USA, 3–6 December 2012; pp. 1097–1105. [Google Scholar]
  11. LeCun, Y.; Bengio, Y.; Hinton, G. Deep learning. Nature 2015, 521, 436–444. [Google Scholar] [CrossRef] [PubMed]
  12. Guo, H.; Korablinova, N.; Ren, Q.; Bille, J. Wavefront reconstruction with artificial neural networks. Opt. Express 2006, 14, 6456–6462. [Google Scholar] [CrossRef]
  13. Suárez Gómez, S.L.; González-Gutiérrez, C.; Díez Alonso, E.; Santos Rodríguez, J.D.; Sánchez Rodríguez, M.L.; Morris, T.; Osborn, J.; Basden, A.; Bonavera, L.; González-Nuevo González, J.; et al. Experience with Artificial Neural Networks applied in Multi-Object Adaptive Optics. Publ. Astron. Soc. Pacific 2019, 131, 108012. [Google Scholar] [CrossRef]
  14. Osborn, J.; De Cos Juez, F.J.; Guzman, D.; Butterley, T.; Myers, R.; Guesalaga, A.; Laine, J. Using artificial neural networks for open-loop tomography. Opt. Express 2012, 20, 2420. [Google Scholar] [CrossRef] [Green Version]
  15. de Cos Juez, F.J.; Lasheras, F.S.; Roqueñí, N.; Osborn, J. An ANN-based smart tomographic reconstructor in a dynamic environment. Sensors 2012, 12, 8895–8911. [Google Scholar] [CrossRef]
  16. Osborn, J.; Guzman, D.; de Cos Juez, F.J.; Basden, A.G.; Morris, T.J.; Gendron, E.; Butterley, T.; Myers, R.M.; Guesalaga, A.; Sánchez Lasheras, F.; et al. Open-loop tomography with artificial neural networks on CANARY: On-sky results. Mon. Not. R. Astron. Soc. 2014, 441, 2508–2514. [Google Scholar] [CrossRef] [Green Version]
  17. Suárez Gómez, S.L.; Santos Rodríguez, J.D.; Iglesias Rodríguez, F.J.; de Cos Juez, F.J. Analysis of the Temporal Structure Evolution of Physical Systems with the Self-Organising Tree Algorithm (SOTA): Application for Validating Neural Network Systems on Adaptive Optics Data before On-Sky Implementation. Entropy 2017, 19, 103. [Google Scholar] [CrossRef] [Green Version]
  18. Rodríguez Ramos, L.F.; González-Gutiérrez, C.; Suárez Gómez, S.L.; Férnández Valdivia, J.J.; Rodríguez Ramos, J.M.; De Cos Juez, F.J. New adaptive optics Tomographic Pupil Image reconstructor based on convolutional neural networks. In Proceedings of the Adaptive Optics for Extremely Large Telescopes 5; Instituto de Astrofísica de Canarias (IAC): San Cristobal de La Laguna, Spain, June 2017. [Google Scholar]
  19. Noll, R.J. Zernike polynomials and atmospheric turbulence. JOsA 1976, 66, 207–211. [Google Scholar] [CrossRef]
  20. Guzmán, D.; de Cos Juez, F.J.; Myers, R.; Guesalaga, A.; Lasheras, F.S. Modeling a MEMS deformable mirror using non-parametric estimation techniques. Opt. Express 2010, 18, 21356–21369. [Google Scholar] [CrossRef]
  21. Basden, A.G.; Atkinson, D.; Bharmal, N.A.; Bitenc, U.; Brangier, M.; Buey, T.; Butterley, T.; Cano, D.; Chemla, F.; Clark, P.; et al. Experience with wavefront sensor and deformable mirror interfaces for wide-field adaptive optics systems. Mon. Not. R. Astron. Soc. 2016, 459, 1350–1359. [Google Scholar] [CrossRef] [Green Version]
  22. Hippler, S.; Feldt, M.; Bertram, T.; Brandner, W.; Cantalloube, F.; Carlomagno, B.; Absil, O.; Obereder, A.; Shatokhina, I.; Stuik, R. Single conjugate adaptive optics for the ELT instrument METIS. Exp. Astron. 2018. [Google Scholar] [CrossRef] [Green Version]
  23. Guzmán, D.; de Cos Juez, F.J.; Lasheras, F.S.; Myers, R.; Young, L. Deformable mirror model for open-loop adaptive optics using multivariate adaptive regression splines. Opt. Express 2010, 18, 6492–6505. [Google Scholar] [CrossRef] [Green Version]
  24. Davies, R.; Kasper, M. Adaptive optics for astronomy. Annu. Rev. Astron. Astrophys. 2012, 50, 305–351. [Google Scholar] [CrossRef] [Green Version]
  25. Ellerbroek, B.L. First-order performance evaluation of adaptive-optics systems for atmospheric-turbulence compensation in extended-field-of-view astronomical telescopes. JOSA A 1994, 11, 783–805. [Google Scholar] [CrossRef]
  26. Vidal, F.; Gendron, E.; Rousset, G. Tomography approach for multi-object adaptive optics. JOSA A 2010, 27, A253–A264. [Google Scholar] [CrossRef]
  27. Suárez Gómez, S.L.; Gutiérrez, C.G.; Rodríguez, J.D.S.; Rodríguez, M.L.S.; Lasheras, F.S.; de Cos Juez, F.J. Analysing the Performance of a Tomographic Reconstructor with Different Neural Networks Frameworks. In Proceedings of the International Conference on Intelligent Systems Design and Applications, Jinan, China, 16–18 October 2016; pp. 1051–1060. [Google Scholar]
  28. Ramsay, S.K.; Casali, M.M.; González, J.C.; Hubin, N. The E-ELT instrument roadmap: A status report. In Proceedings of the Ground-based and Airborne Instrumentation for Astronomy V, Montreal, QC, Canada, 22–26 June 2014; Volume 9147, p. 91471Z. [Google Scholar]
  29. Osborn, J.; Juez, F.J.D.C.; Guzman, D.; Butterley, T.; Myers, R.; Guesalaga, A.; Laine, J. Open-Loop Tomography Using Artificial Nueral Networks. 2011. Available online: http://ao4elt2.lesia.obspm.fr/sites/ao4elt2/IMG/pdf/089osborn.pdf (accessed on 23 December 2020).
  30. González-Gutiérrez, C.; Santos-Rodríguez, J.D.; Díaz, R.Á.F.; Rolle, J.L.C.; Gutiérrez, N.R.; de Cos Juez, F.J. Using GPUs to Speed up a Tomographic Reconstructor Based on Machine Learning. In Proceedings of the International Conference on EUropean Transnational Education, León, Spain, 6–8 September 2016; pp. 279–289. [Google Scholar]
  31. González-Gutiérrez, C.; Santos Rodríguez, J.D.; Martínez-Zarzuela, M.; Basden, A.G.; Osborn, J.; Díaz-Pernas, F.J.; De Cos Juez, F.J. Comparative Study of Neural Network Frameworks for the Next Generation of Adaptive Optics Systems. Sensors 2017, 17, 1263. [Google Scholar] [CrossRef] [PubMed] [Green Version]
  32. González-Gutiérrez, C.; Sánchez-Rodríguez, M.L.; Calvo-Rolle, J.L.; de Cos Juez, F.J. Multi-GPU Development of a Neural Networks Based Reconstructor for Adaptive Optics. Complexity 2018, 2018, 1–9. [Google Scholar] [CrossRef]
  33. Van Dam, M.A.; Lane, R.G. Wave-front sensing from defocused images by use of wave-front slopes. Appl. Opt. 2002, 41, 5497–5502. [Google Scholar] [CrossRef] [PubMed]
  34. Van Dam, M.A.; Lane, R.G. Extended analysis of curvature sensing. JOSA A 2002, 19, 1390–1397. [Google Scholar] [CrossRef]
  35. Zernike, F. Diffraction theory of the knife-edge test and its improved form, the phase-contrast method. Mon. Not. R. Astron. Soc. 1934, 94, 377–384. [Google Scholar] [CrossRef] [Green Version]
  36. Helgason, S. The Radon transform on Rn. In Integral Geometry and Radon Transforms; Springer: Berlin/Heidelberg, Germany, 2011; pp. 1–62. [Google Scholar]
  37. Abraham, T.H. (Physio) logical circuits: The intellectual origins of the McCulloch--Pitts neural networks. J. Hist. Behav. Sci. 2002, 38, 3–25. [Google Scholar] [CrossRef]
  38. Zhang, L.; Zhang, B. A geometrical representation of McCulloch-Pitts neural model and its applications. IEEE Trans. Neural Netw. 1999, 10, 925–929. [Google Scholar] [CrossRef]
  39. Leshno, M.; Lin, V.Y.; Pinkus, A.; Schocken, S. Multilayer feedforward networks with a nonpolynomial activation function can approximate any function. Neural Netw. 1993, 6, 861–867. [Google Scholar] [CrossRef] [Green Version]
  40. LeCun, Y.; Bengio, Y. Convolutional networks for images, speech, and time series. Handb. Brain Theory Neural Netw. 1995, 3361, 1995. [Google Scholar]
  41. Lecun, Y.; Bottou, L.; Bengio, Y.; Haffner, P. Gradient-based learning applied to document recognition. Proc. IEEE 1998, 86, 2278–2323. [Google Scholar] [CrossRef] [Green Version]
  42. Giusti, A.; Ciresan, D.C.; Masci, J.; Gambardella, L.M.; Schmidhuber, J. Fast image scanning with deep max-pooling convolutional neural networks. In Proceedings of the Image Processing (ICIP), 2013 20th IEEE International Conference, Melbourne, Australia, 15–18 September 2013; pp. 4034–4038. [Google Scholar]
  43. Graves, A.; Mohamed, A.; Hinton, G. Speech Recognition With Deep Recurrent Neural Networks. Icassp 2013, 6645–6649. [Google Scholar] [CrossRef] [Green Version]
  44. Nair, V.; Hinton, G.E. Rectified linear units improve restricted boltzmann machines. In Proceedings of the 27th international conference on machine learning (ICML-10), Haifa, Israel, 21–24 June 2010; pp. 807–814. [Google Scholar]
  45. Hornik, K.; Stinchcombe, M.; White, H. Multilayer feedforward networks are universal approximators. Neural Netw. 1989, 2, 359–366. [Google Scholar] [CrossRef]
  46. Chauvin, Y.; Rumelhart, D.E. Backpropagation: Theory, Architectures, and Applications; Psychology Press: East Sussex, UK, 2013. [Google Scholar]
  47. Ruder, S. An overview of gradient descent optimization algorithms. arXiv 2016, arXiv:1609.04747. [Google Scholar]
  48. Zhan, H.; Wijerathna, E.; Voelz, D. Is the formulation of the Fried parameter accurate in the strong turbulent scattering regime? OSA Contin. 2020, 3, 2653–2659. [Google Scholar] [CrossRef]
  49. Perrin, M.D.; Sivaramakrishnan, A.; Makidon, R.B.; Oppenheimer, B.R.; Graham, J.R. The structure of high Strehl ratio point-spread functions. Astrophys. J. 2003, 596, 702. [Google Scholar] [CrossRef]
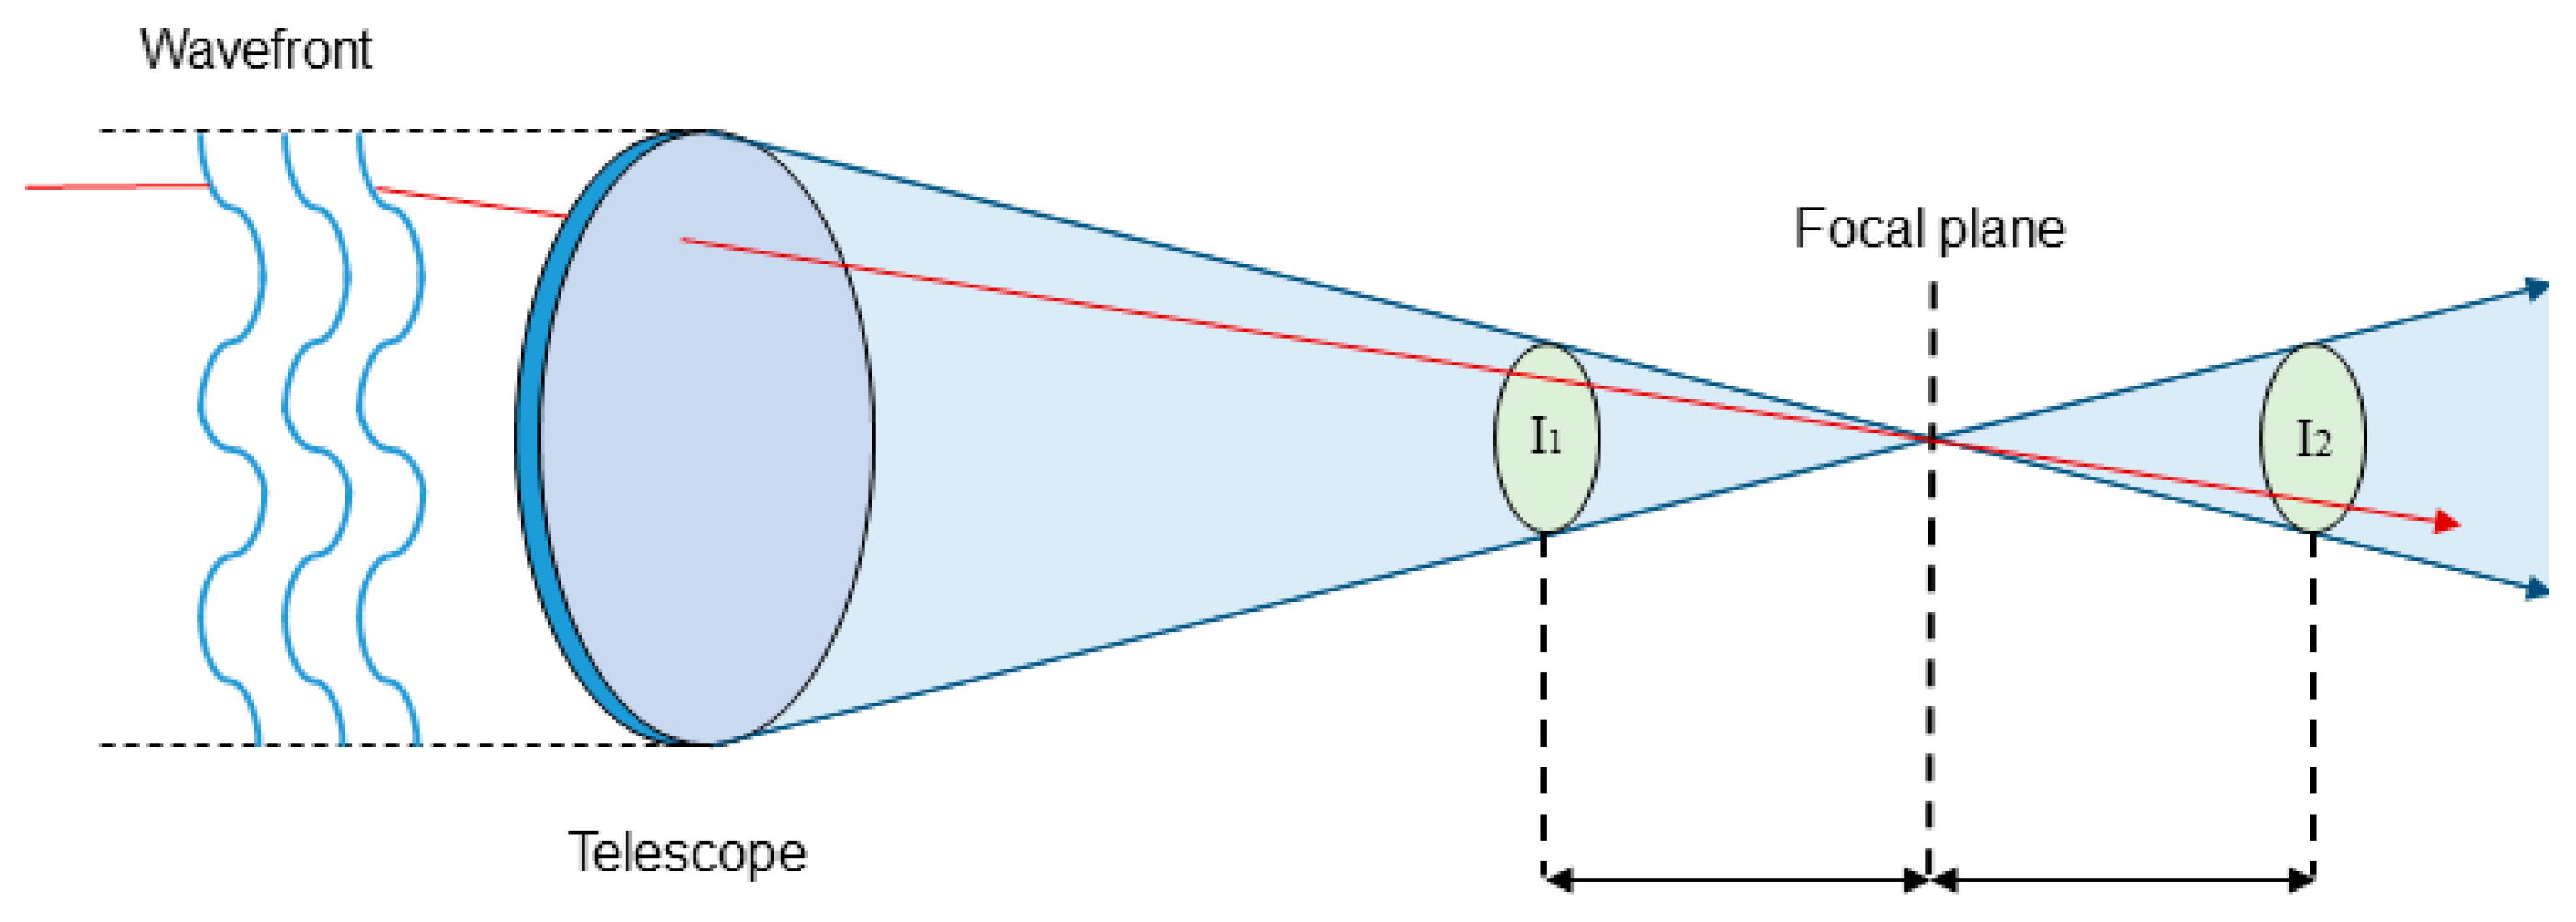
Figure 1. Diagram of a curvature sensor. Two defocused pupil images are formed before and after the focal plane of the telescope.
Mathematics 09 00015 g001
Figure 2. Multi-Layer Perceptron topology; neurons of consecutive layers are connected by weights. The output of each layer is produced by the application of an activation function. The output is obtained after the sequences of hidden layers.
Mathematics 09 00015 g002
Figure 3. Topology and implementation of CRONOS. The optimal architecture consists in 3 sets of 2 convolutional layers followed by ReLU and Max-Pooling. After the process, output feature maps are reshaped to a vector and connected to an MLP.
Mathematics 09 00015 g003
Figure 4. Examples of simulated intra and extra images obtainable from the sensor. (a) Intra image of a Tomographic Pupil Image Wavefront Sensor (TPI-WFS); (b) extra image of a TPI-WFS.
Mathematics 09 00015 g004
Figure 5. Mean structural similarity index for image quality measurement comparing a recovered phase image (obtained from CRONOS and WFR reconstruction) and the reference one.
Mathematics 09 00015 g005
Figure 6. Strehl ratio between a recovered phase image (obtained from CRONOS and WFR reconstruction) and the reference one, with wavelength of 590 nm.
Mathematics 09 00015 g006
Figure 7. Mean structural similarity index for measuring image quality between the recovered phase and the reference image with the CRONOS reconstruction and the WFR reconstruction and the reference image. Three scenarios with different signal-to-noise ratios, from stronger to weaker signal-noise intensity (10, 20, and 30 dB, respectively), are included.
Mathematics 09 00015 g007
Figure 8. Strehl ratio of the difference between the recovered phase obtained from CRONOS and WFR and the reference image, with a wavelength of 590 nm. Three scenarios with different signal-to-noise ratios, from stronger to weaker signal-noise intensity (10, 20, and 30 dB, respectively), are included.
Mathematics 09 00015 g008
Publisher’s Note: MDPI stays neutral with regard to jurisdictional claims in published maps and institutional affiliations.