Estimating the COVID-19 Death Toll by Considering the Time-Dependent Effects of Various Pandemic Restrictions
Abstract
1. Introduction
2. Model Development
3. Modeling Results
3.1. Modeling Analysis for the United States
3.2. Worldwide Modeling Analysis
4. Conclusions
Funding
Conflicts of Interest
Abbreviations
| SSE | Sum of squared error |
| MSE | Mean squared error |
| AIC | Akaike’s information criterion |
| BIC | Bayesian information criterion |
| PC | Pham’s criterion |
| PIC | Pham’s information criterion |
| PP | Predictive power |
| PRR | Predictive ratio-risk |
Appendix A
| Date | Cumulative Number of Deaths | Date | Cumulative Number of Deaths | Date | Cumulative Number of Deaths |
|---|---|---|---|---|---|
| 2/29 | 1 | 4/26 | 55,412 | 6/22 | 125,155 |
| 3/1 | 1 | 4/27 | 56,795 | 6/23 | 126,026 |
| 3/2 | 6 | 4/28 | 59,265 | 6/24 | 126,845 |
| 3/3 | 9 | 4/29 | 61,655 | 6/25 | 127,498 |
| 3/4 | 11 | 4/30 | 63,856 | 6/26 | 128,161 |
| 3/5 | 12 | 5/1 | 65,753 | 6/27 | 128,673 |
| 3/6 | 15 | 5/2 | 67,444 | 6/28 | 128,958 |
| 3/7 | 19 | 5/3 | 68,597 | 6/29 | 129,324 |
| 3/8 | 22 | 5/4 | 69,921 | 6/30 | 130,050 |
| 3/9 | 26 | 5/5 | 72,271 | 7/1 | 130,726 |
| 3/10 | 30 | 5/6 | 74,799 | 7/2 | 131,413 |
| 3/11 | 38 | 5/7 | 76,928 | 7/3 | 132,039 |
| 3/12 | 41 | 5/8 | 78,615 | 7/4 | 132,305 |
| 3/13 | 48 | 5/9 | 80,037 | 7/5 | 132,568 |
| 3/14 | 58 | 5/10 | 80,787 | 7/6 | 132,946 |
| 3/15 | 73 | 5/11 | 81,847 | 7/7 | 133,939 |
| 3/16 | 95 | 5/12 | 83,718 | 7/8 | 135,140 |
| 3/17 | 121 | 5/13 | 85,540 | 7/9 | 136,114 |
| 3/18 | 171 | 5/14 | 87,293 | 7/10 | 136,975 |
| 3/19 | 239 | 5/15 | 89,104 | 7/11 | 137,717 |
| 3/20 | 309 | 5/16 | 90,324 | 7/12 | 138,102 |
| 3/21 | 374 | 5/17 | 91,189 | 7/13 | 138,577 |
| 3/22 | 509 | 5/18 | 92,193 | 7/14 | 139,529 |
| 3/23 | 689 | 5/19 | 93,750 | 7/15 | 140,550 |
| 3/24 | 957 | 5/20 | 95,155 | 7/16 | 141,529 |
| 3/25 | 1260 | 5/21 | 96,569 | 7/17 | 142,495 |
| 3/26 | 1614 | 5/22 | 97,868 | 7/18 | 143,317 |
| 3/27 | 2110 | 5/23 | 98,904 | 7/19 | 143,736 |
| 3/28 | 2754 | 5/24 | 99,519 | 7/20 | 144,274 |
| 3/29 | 3251 | 5/25 | 100,025 | 7/21 | 145,459 |
| 3/30 | 4066 | 5/26 | 100,800 | 7/22 | 146,689 |
| 3/31 | 5151 | 5/27 | 104,635 | 7/23 | 147,881 |
| 4/1 | 6394 | 5/28 | 105,873 | 7/24 | 149,043 |
| 4/2 | 7576 | 5/29 | 107,106 | 7/25 | 149,968 |
| 4/3 | 8839 | 5/30 | 108,139 | 7/26 | 150,509 |
| 4/4 | 10,384 | 5/31 | 108,790 | 7/27 | 151,106 |
| 4/5 | 11,793 | 6/1 | 109,485 | 7/28 | 152,436 |
| 4/6 | 13,298 | 6/2 | 110,632 | 7/29 | 153,901 |
| 4/7 | 15,526 | 6/3 | 111,736 | 7/30 | 155,366 |
| 4/8 | 17,691 | 6/4 | 112,786 | 7/31 | 156,826 |
| 4/9 | 19,802 | 6/5 | 113,773 | 8/1 | 157,949 |
| 4/10 | 22,038 | 6/6 | 114,490 | 8/2 | 158,416 |
| 4/11 | 24,062 | 6/7 | 114,874 | 8/3 | 158,978 |
| 4/12 | 25,789 | 6/8 | 115,472 | 8/4 | 160,338 |
| 4/13 | 27,515 | 6/9 | 116,576 | 8/5 | 161,657 |
| 4/14 | 30,081 | 6/10 | 117,574 | 8/6 | 162,860 |
| 4/15 | 32,712 | 6/11 | 118,490 | 8/7 | 164,152 |
| 4/16 | 34,905 | 6/12 | 119,290 | 8/8 | 165,138 |
| 4/17 | 37,448 | 6/13 | 120,004 | 8/9 | 165,672 |
| 4/18 | 39,331 | 6/14 | 120,340 | 8/10 | 166,241 |
| 4/19 | 40,901 | 6/15 | 120,772 | 8/11 | 167,745 |
| 4/20 | 42,853 | 6/16 | 121,630 | 8/12 | 169,131 |
| 4/21 | 45,536 | 6/17 | 122,449 | 8/13 | 170,415 |
| 4/22 | 47,894 | 6/18 | 123,205 | 8/14 | 171,535 |
| 4/23 | 50,234 | 6/19 | 123,934 | 8/15 | 172,606 |
| 4/24 | 52,191 | 6/20 | 124,516 | 8/16 | 173,128 |
| 4/25 | 54,256 | 6/21 | 124,786 |
Appendix B
| No. | Criteria | Formula | Brief Description |
|---|---|---|---|
| 1 | Sum of square error (SSE) | Measures the total deviations between the estimated values and the actual data. | |
| 2 | MSE [21] | Measures the difference between the estimated values and the actual data. | |
| 3 | AIC [24] | AIC = −2log(L) + 2k | Measures the goodness of the fit after considering the penalty of adding more parameters. |
| 4 | BIC [25] | BIC = −2log(L) + klog(n) | Same as the AIC but the penalty term also depends on the sample size. |
| 5 | PIC [22] | Takes into account a larger penalty when there is too small of a sample but too many parameters in the model. | |
| 6 | PRR [21] | Measures the distance of the model estimates from the actual data against the model estimate. | |
| 7 | PP [21] | Measures the distance of the model estimates from the actual data against the actual data. | |
| 8 | PC [1] | Slightly increases the penalty each time parameters are added to the model when there is too small of a sample. |
References
- Pham, H. On Estimating the Number of Deaths Related to Covid-19. Mathematics 2020, 8, 655. [Google Scholar] [CrossRef]
- Patch.com. Available online: https://patch.com/new-jersey/oceancity/nj-coronavirus-update-gov-murphy-considers-curfew-31-new-cases (accessed on 15 August 2020).
- Rothan, H.A.; Byrareddy, S.N. The epidemiology and pathogenesis of coronavirus disease (COVID-19) outbreak. J. Autoimmun. 2020, 109, 102433. [Google Scholar] [CrossRef] [PubMed]
- CNN. 2020. Available online: https://www.cnn.com/2020/08/02/health/us-coronavirus-sunday/index.html (accessed on 15 August 2020).
- Worldometers. 2020. Available online: https://www.worldometers.info/coronavirus/?utm_campaign=homeAdvegas1?#countries (accessed on 17 August 2020).
- CDC. Centers for Disease Control and Prevention. 2020. Available online: https://www.cdc.gov/countries (accessed on 15 August 2020).
- Chin, A.W.H.; Chu, J.T.S.; Perera, M.R.A.; Hui, K.P.Y.; Yen, H.-L.; Chan, M.C.W.; Peiris, M.; Poon, L.L.M. Stability of SARS-CoV-2 in different environmental conditions. Lancet Microbe 2020, 1. [Google Scholar] [CrossRef]
- Pham, H.; Pham, D.H. A novel generalized logistic dependent model to predict the presence of breast cancer based on biomarkers. Concurr. Comput. Pract. Exp. 2020, 32, e5467. [Google Scholar] [CrossRef]
- Dong, E.; Du, H.; Gardner, L. An interactive web-based dashboard to track COVID-19 in real time. Lancet Infect. Dis. 2020, 20, 533–534. [Google Scholar] [CrossRef]
- Prem, K.; Liu, Y.; Russell, T.W.; Kucharski, A.J.; Eggo, R.M.; Davies, N.; Jit, M.; Klepac, P.; Flasche, S.; Clifford, S.; et al. The effect of control strategies to reduce social mixing on outcomes of the COVID-19 epidemic in Wuhan, China: A modelling study. Lancet Public Health 2020, 5, e261–e270. [Google Scholar] [CrossRef]
- De Brouwer, E.; Raimondi, D.; Moreau, Y. Modeling the COVID-19 outbreaks and the effectiveness of the containment measures adopted across countries. medRxiv 2020. [Google Scholar] [CrossRef]
- Sebastiani, G.; Massa, M.; Riboli, E. Covid-19 epidemic in Italy: Evolution, projections and impact of government measures. Eur. J. Epidemiol. 2020, 35, 341–345. [Google Scholar] [CrossRef] [PubMed]
- Onder, G.; Rezza, G.; Brusaferro, S. Case-Fatality Rate and Characteristics of Patients Dying in Relation to COVID-19 in Italy. JAMA 2020, 323, 1775–1776. [Google Scholar] [CrossRef] [PubMed]
- Rajgor, D.D.; Lee, M.H.; Archuleta, S.; Bagdasarian, N.; Quek, S.C. The many estimates of the COVID-19 case fatality rate. Lancet Infect. Dis. 2020, 20, 776–777. [Google Scholar] [CrossRef]
- Battegay, M.; Kuehl, R.; Tschudin-Sutter, S.; Hirsch, H.H.; Widmer, A.F.; Neher, R.A. 2019-novel Coronavirus (2019-nCoV): Estimating the case fatality rate—A word of caution. Swiss Med. Wkly. 2020, 150, w20203. [Google Scholar] [CrossRef] [PubMed]
- Kucharski, A.J.; Russell, T.W.; Diamond, C.; Liu, Y.; Edmunds, J.; Funk, S.; Eggo, R.M.; Sun, F.; Jit, M.; Munday, J.D.; et al. Early dynamics of transmission and control of COVID-19: A mathematical modelling study. Lancet Infect. Dis. 2020, 20, 553–558. [Google Scholar] [CrossRef]
- Law, G.R.; Feltbower, R.G.; Taylor, J.C.; Parslow, R.C.; Gilthorpe, M.S.; Boyle, P.; McKinney, P.A. What do epidemiologists mean by ‘population mixing’? Pediatric Blood Cancer 2008, 51, 155–160. [Google Scholar] [CrossRef] [PubMed]
- Pham, H. Predictive Modeling on the Number of Covid-19 Death Toll in the United States Considering the Effects of Coronavirus-Related Changes and Covid-19 Recovered Cases. Int. J. Math. Eng. Manag. Sci. 2020, 5. [Google Scholar] [CrossRef]
- Verhulst, P. Recherches mathe matiques sur la loi d’accroissement de la population. Nouv. Mem. L’academie R. Sci. Belles-Lett. Brux. 1845, 18, 1–41. [Google Scholar]
- Pham, H.; Pham, D.H.; Pham, H. A New Mathematical Logistic Model and Its Applications. Int. J. Inf. Manag. Sci 2014, 25, 79–99. [Google Scholar]
- Pham, H. System Software Reliability; Springer: London, UK, 2006. [Google Scholar]
- Pham, H. A New Criterion for Model Selection. Mathematics 2019, 7, 1215. [Google Scholar] [CrossRef]
- Pham, H. Predictive Modeling on the Number of Covid-19 Death Toll in the United States Considering the Effects of Coronavirus-Related Changes and Covid-19 Recovered Cases. medRxiv 2020. [Google Scholar] [CrossRef]
- Akaike, H. Information Theory and an Extension of the Maximum Likelihood Principle. In Second International Symposium on Information Theory; Petrov, B.N., Caski, F.L., Eds.; Akademiai Kiado: Budapest, Hungary, 1973; pp. 267–281. [Google Scholar]
- Schwarz, G. Estimating the dimension of a model. Ann. Stat. 1978, 6, 461–464. [Google Scholar] [CrossRef]
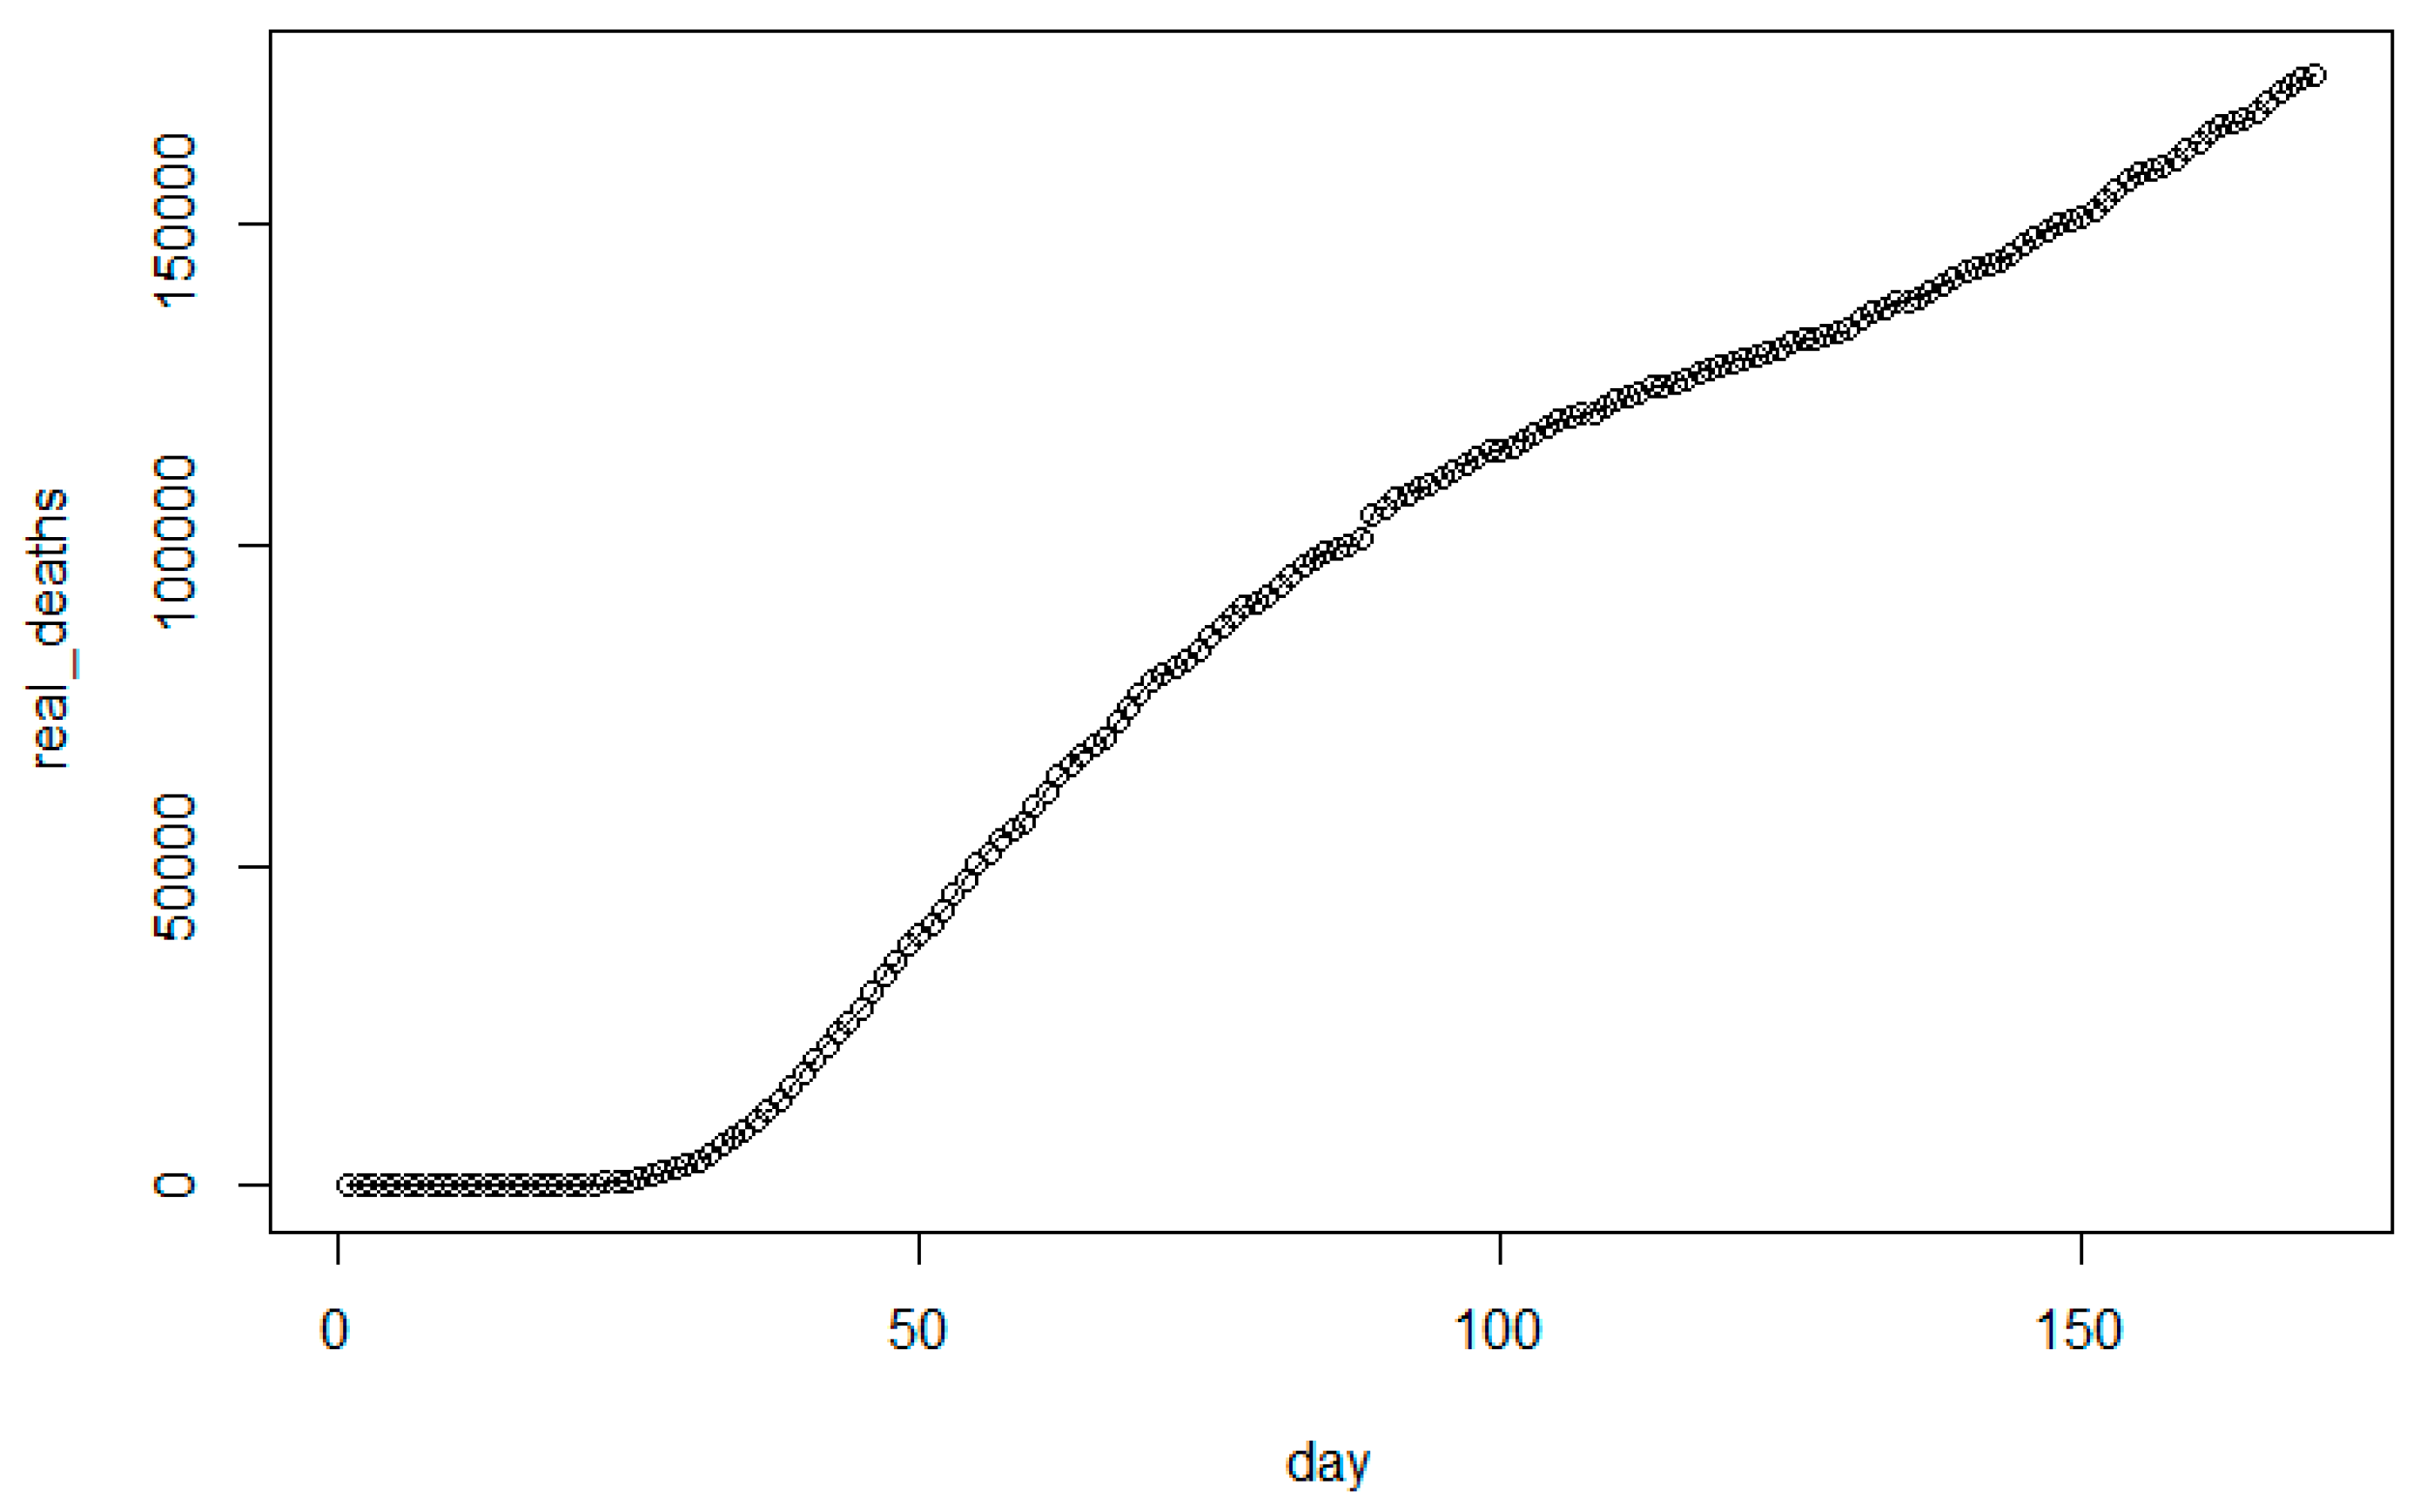
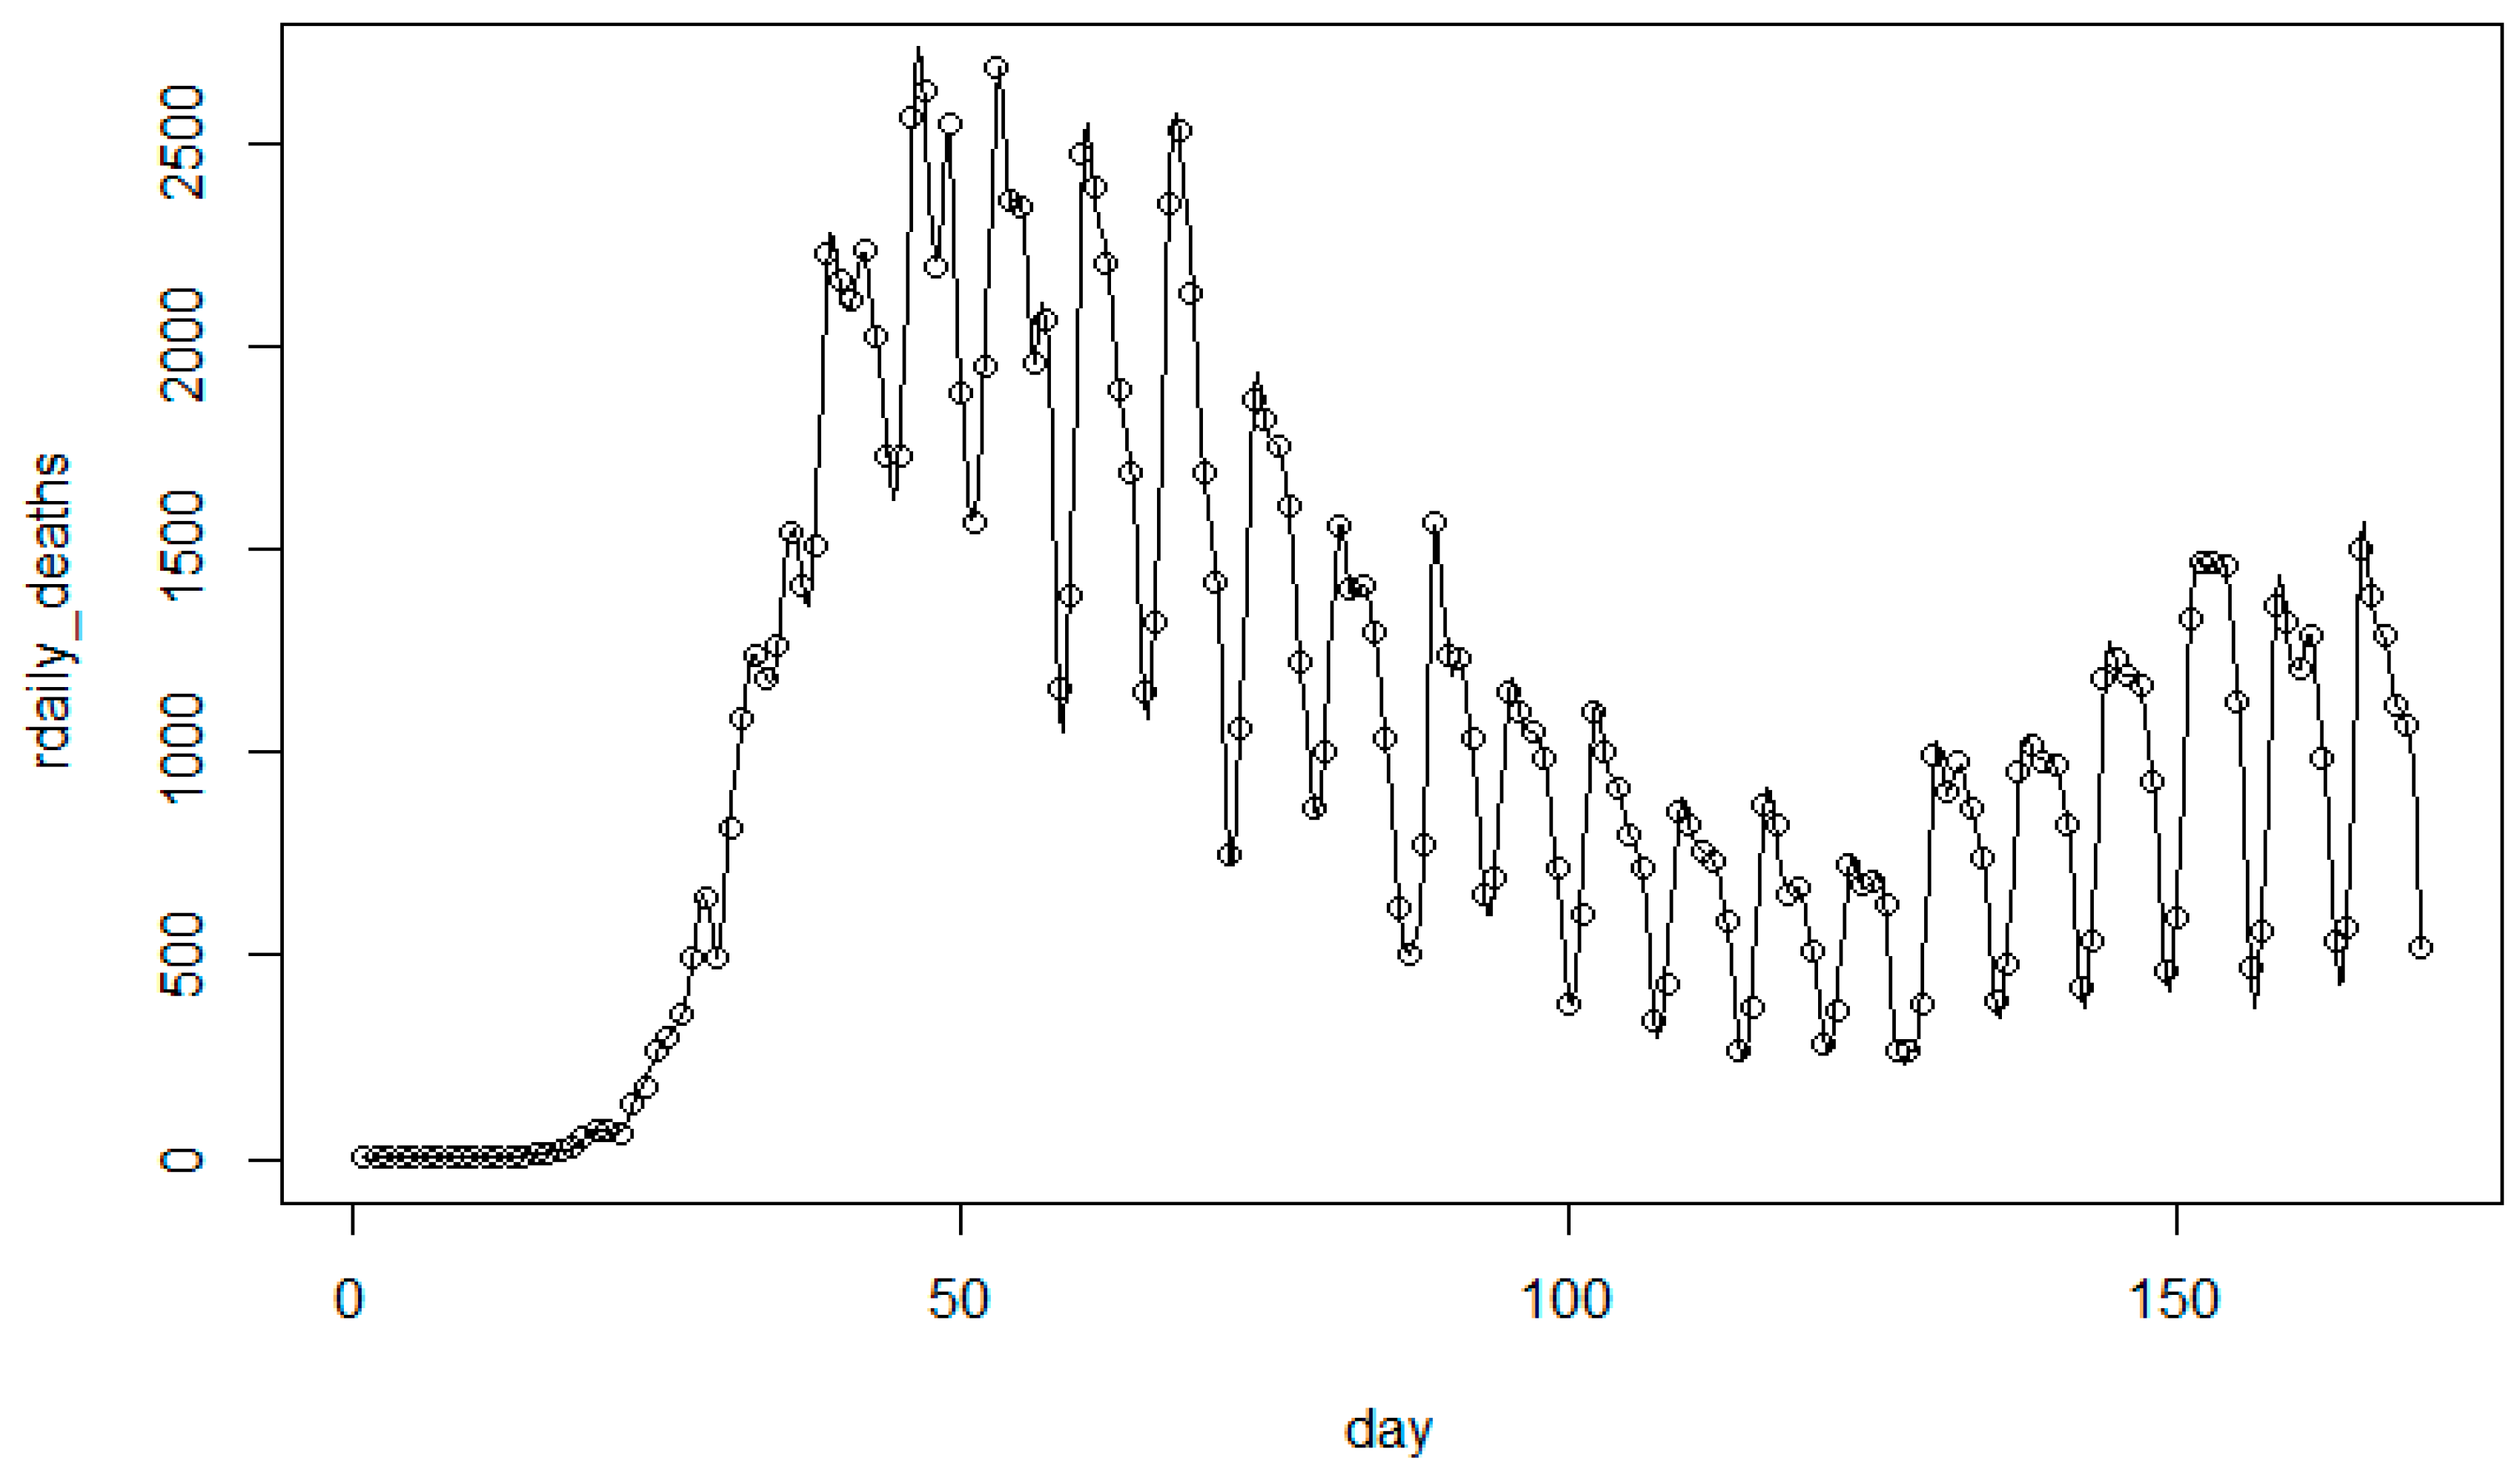
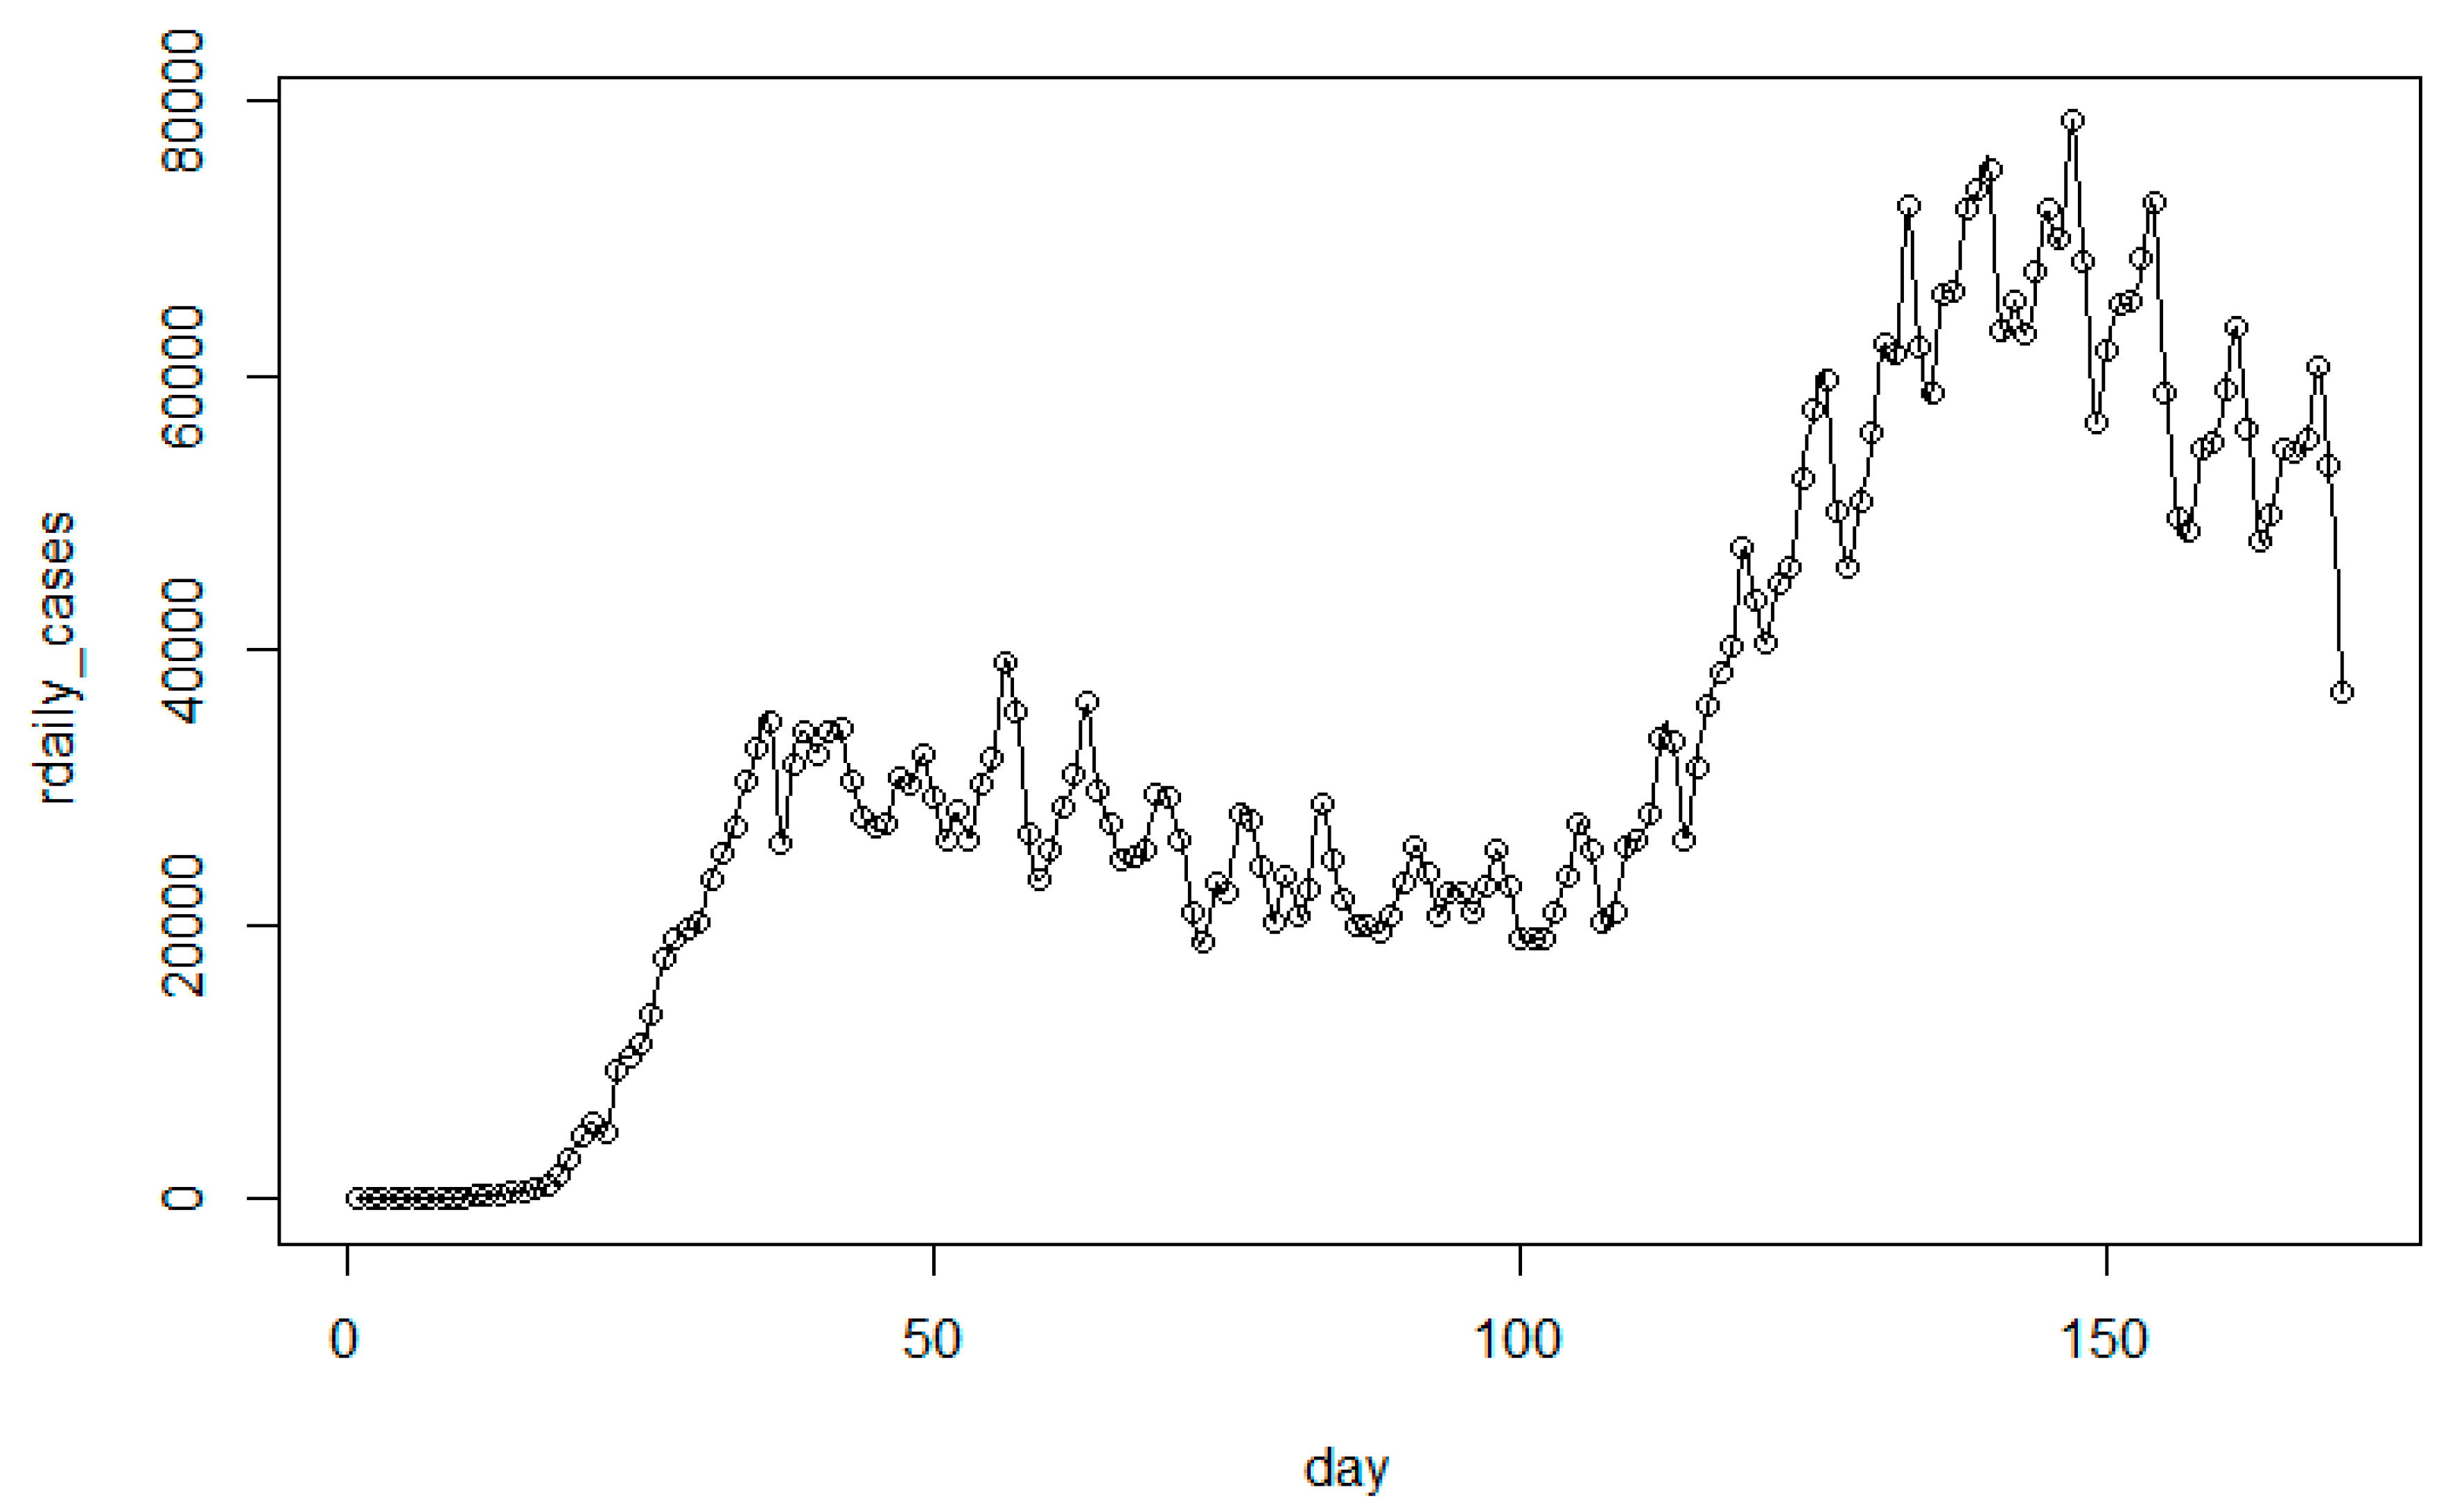
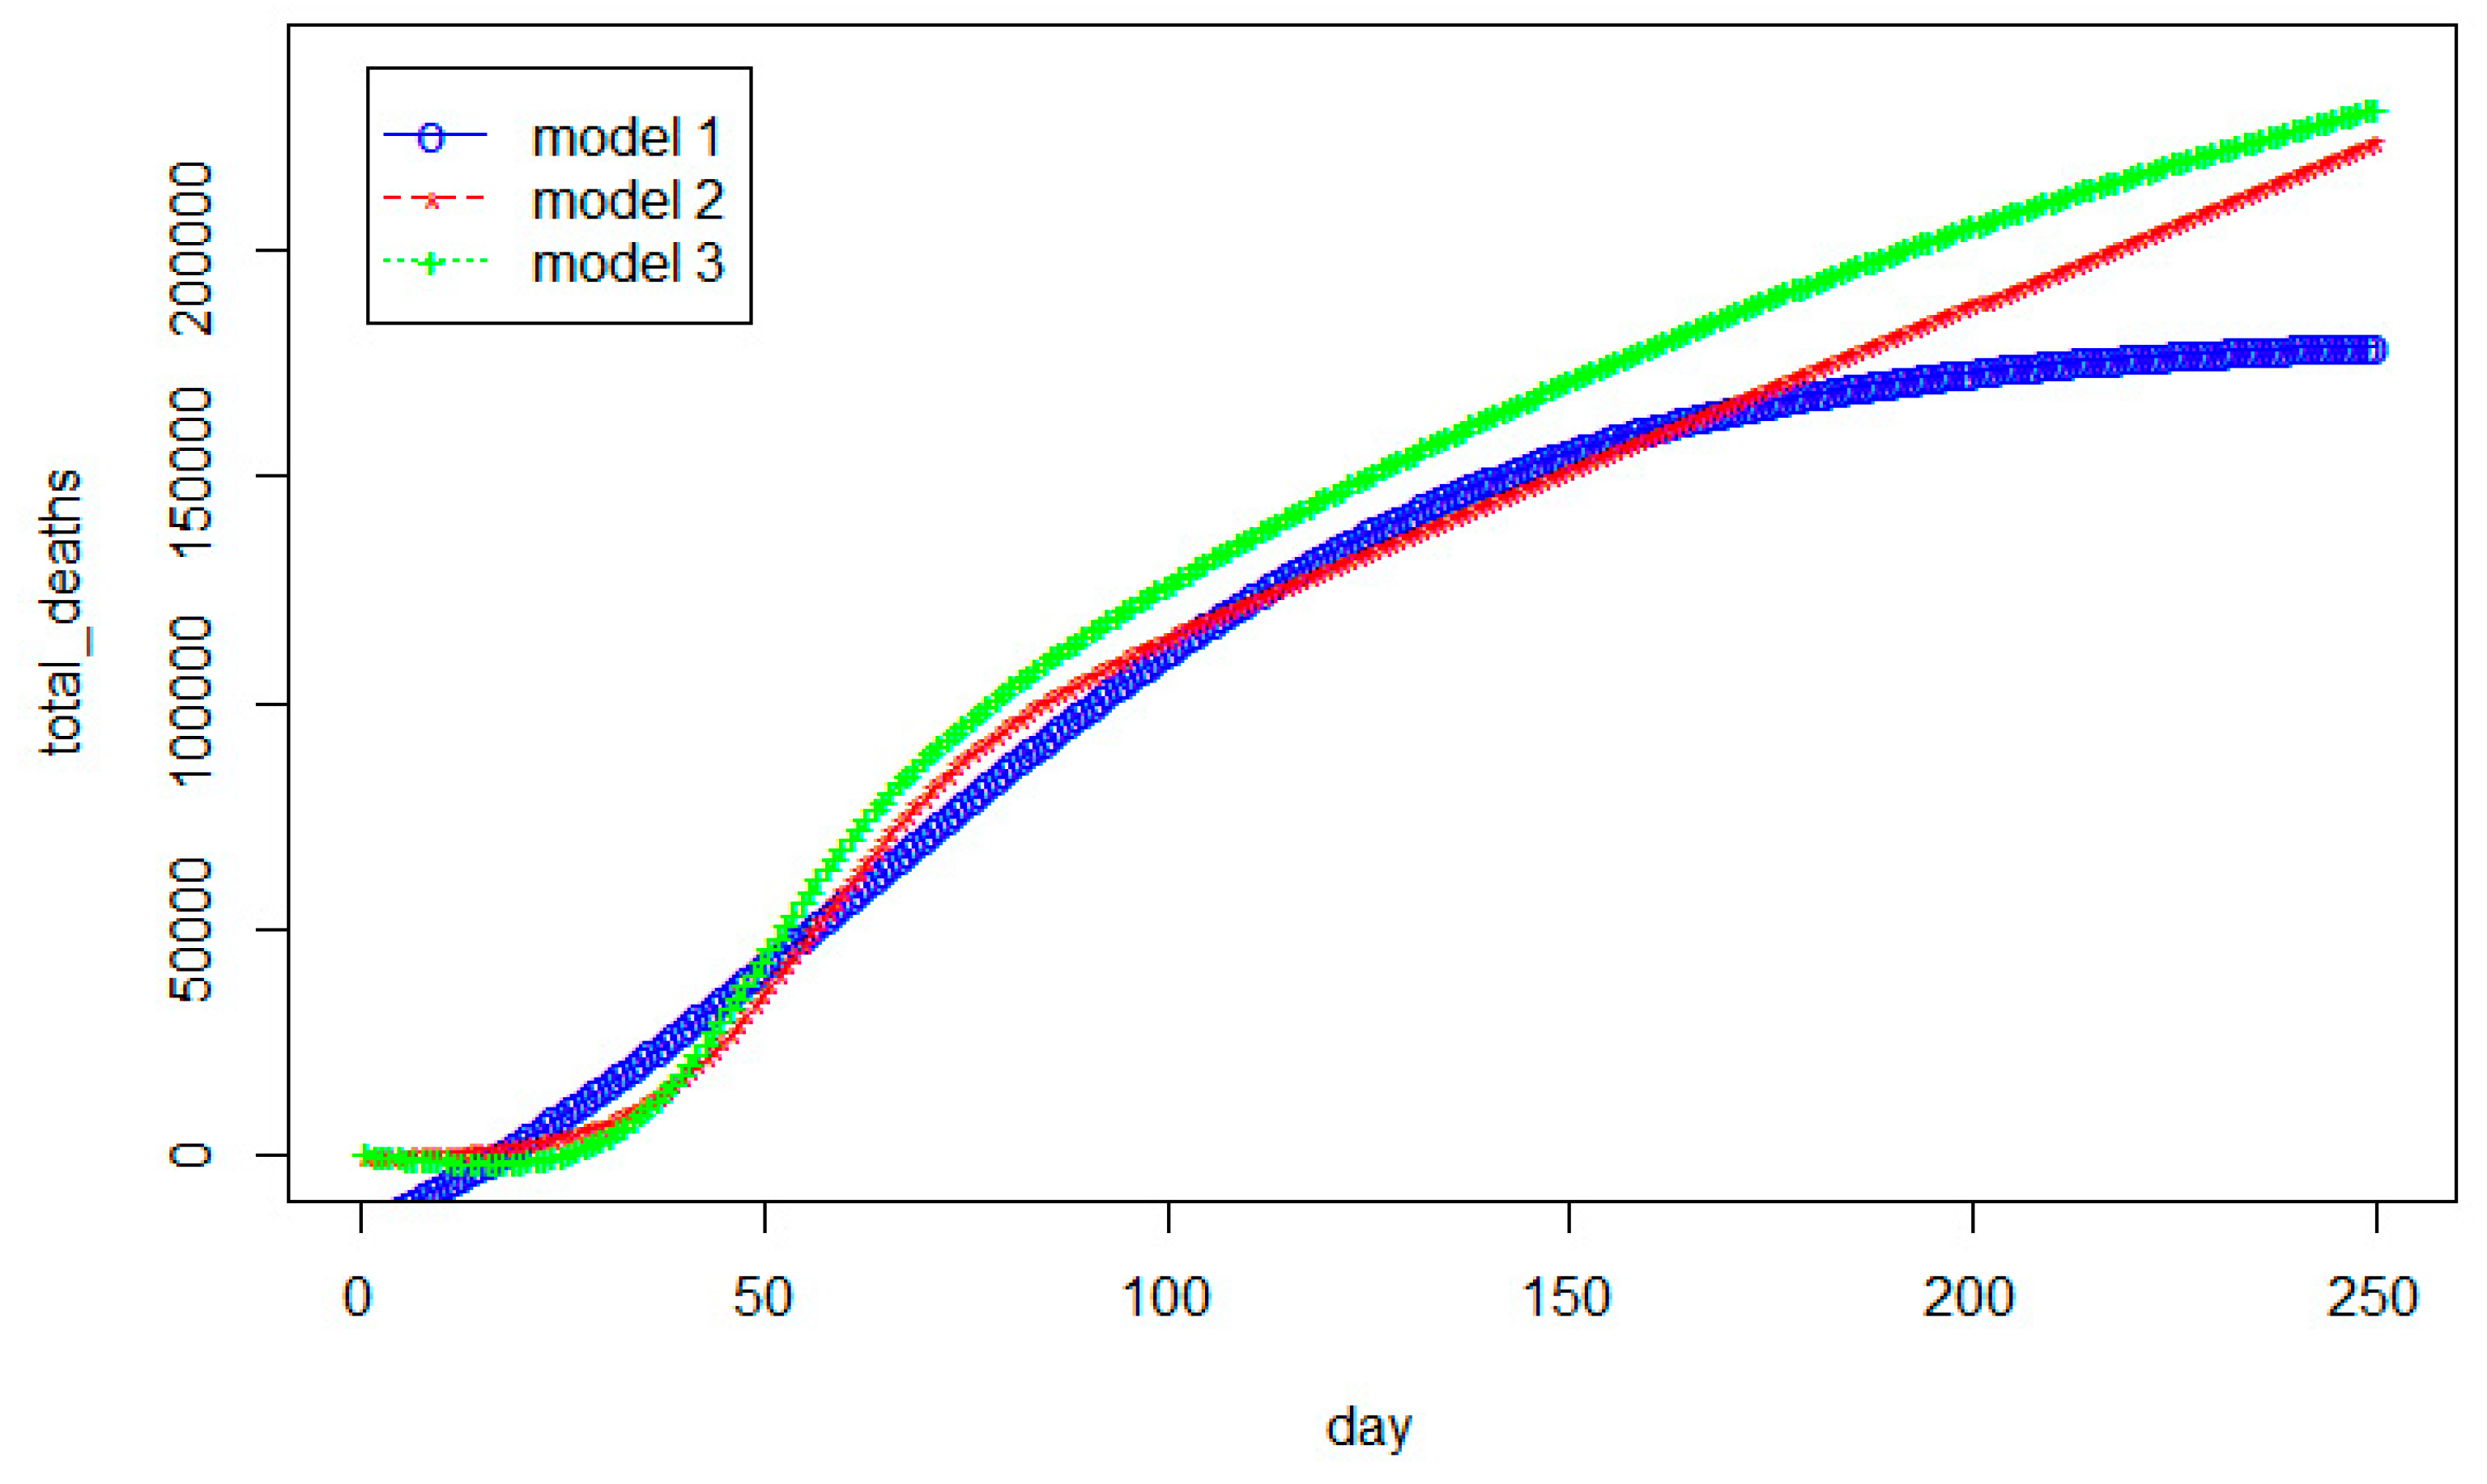

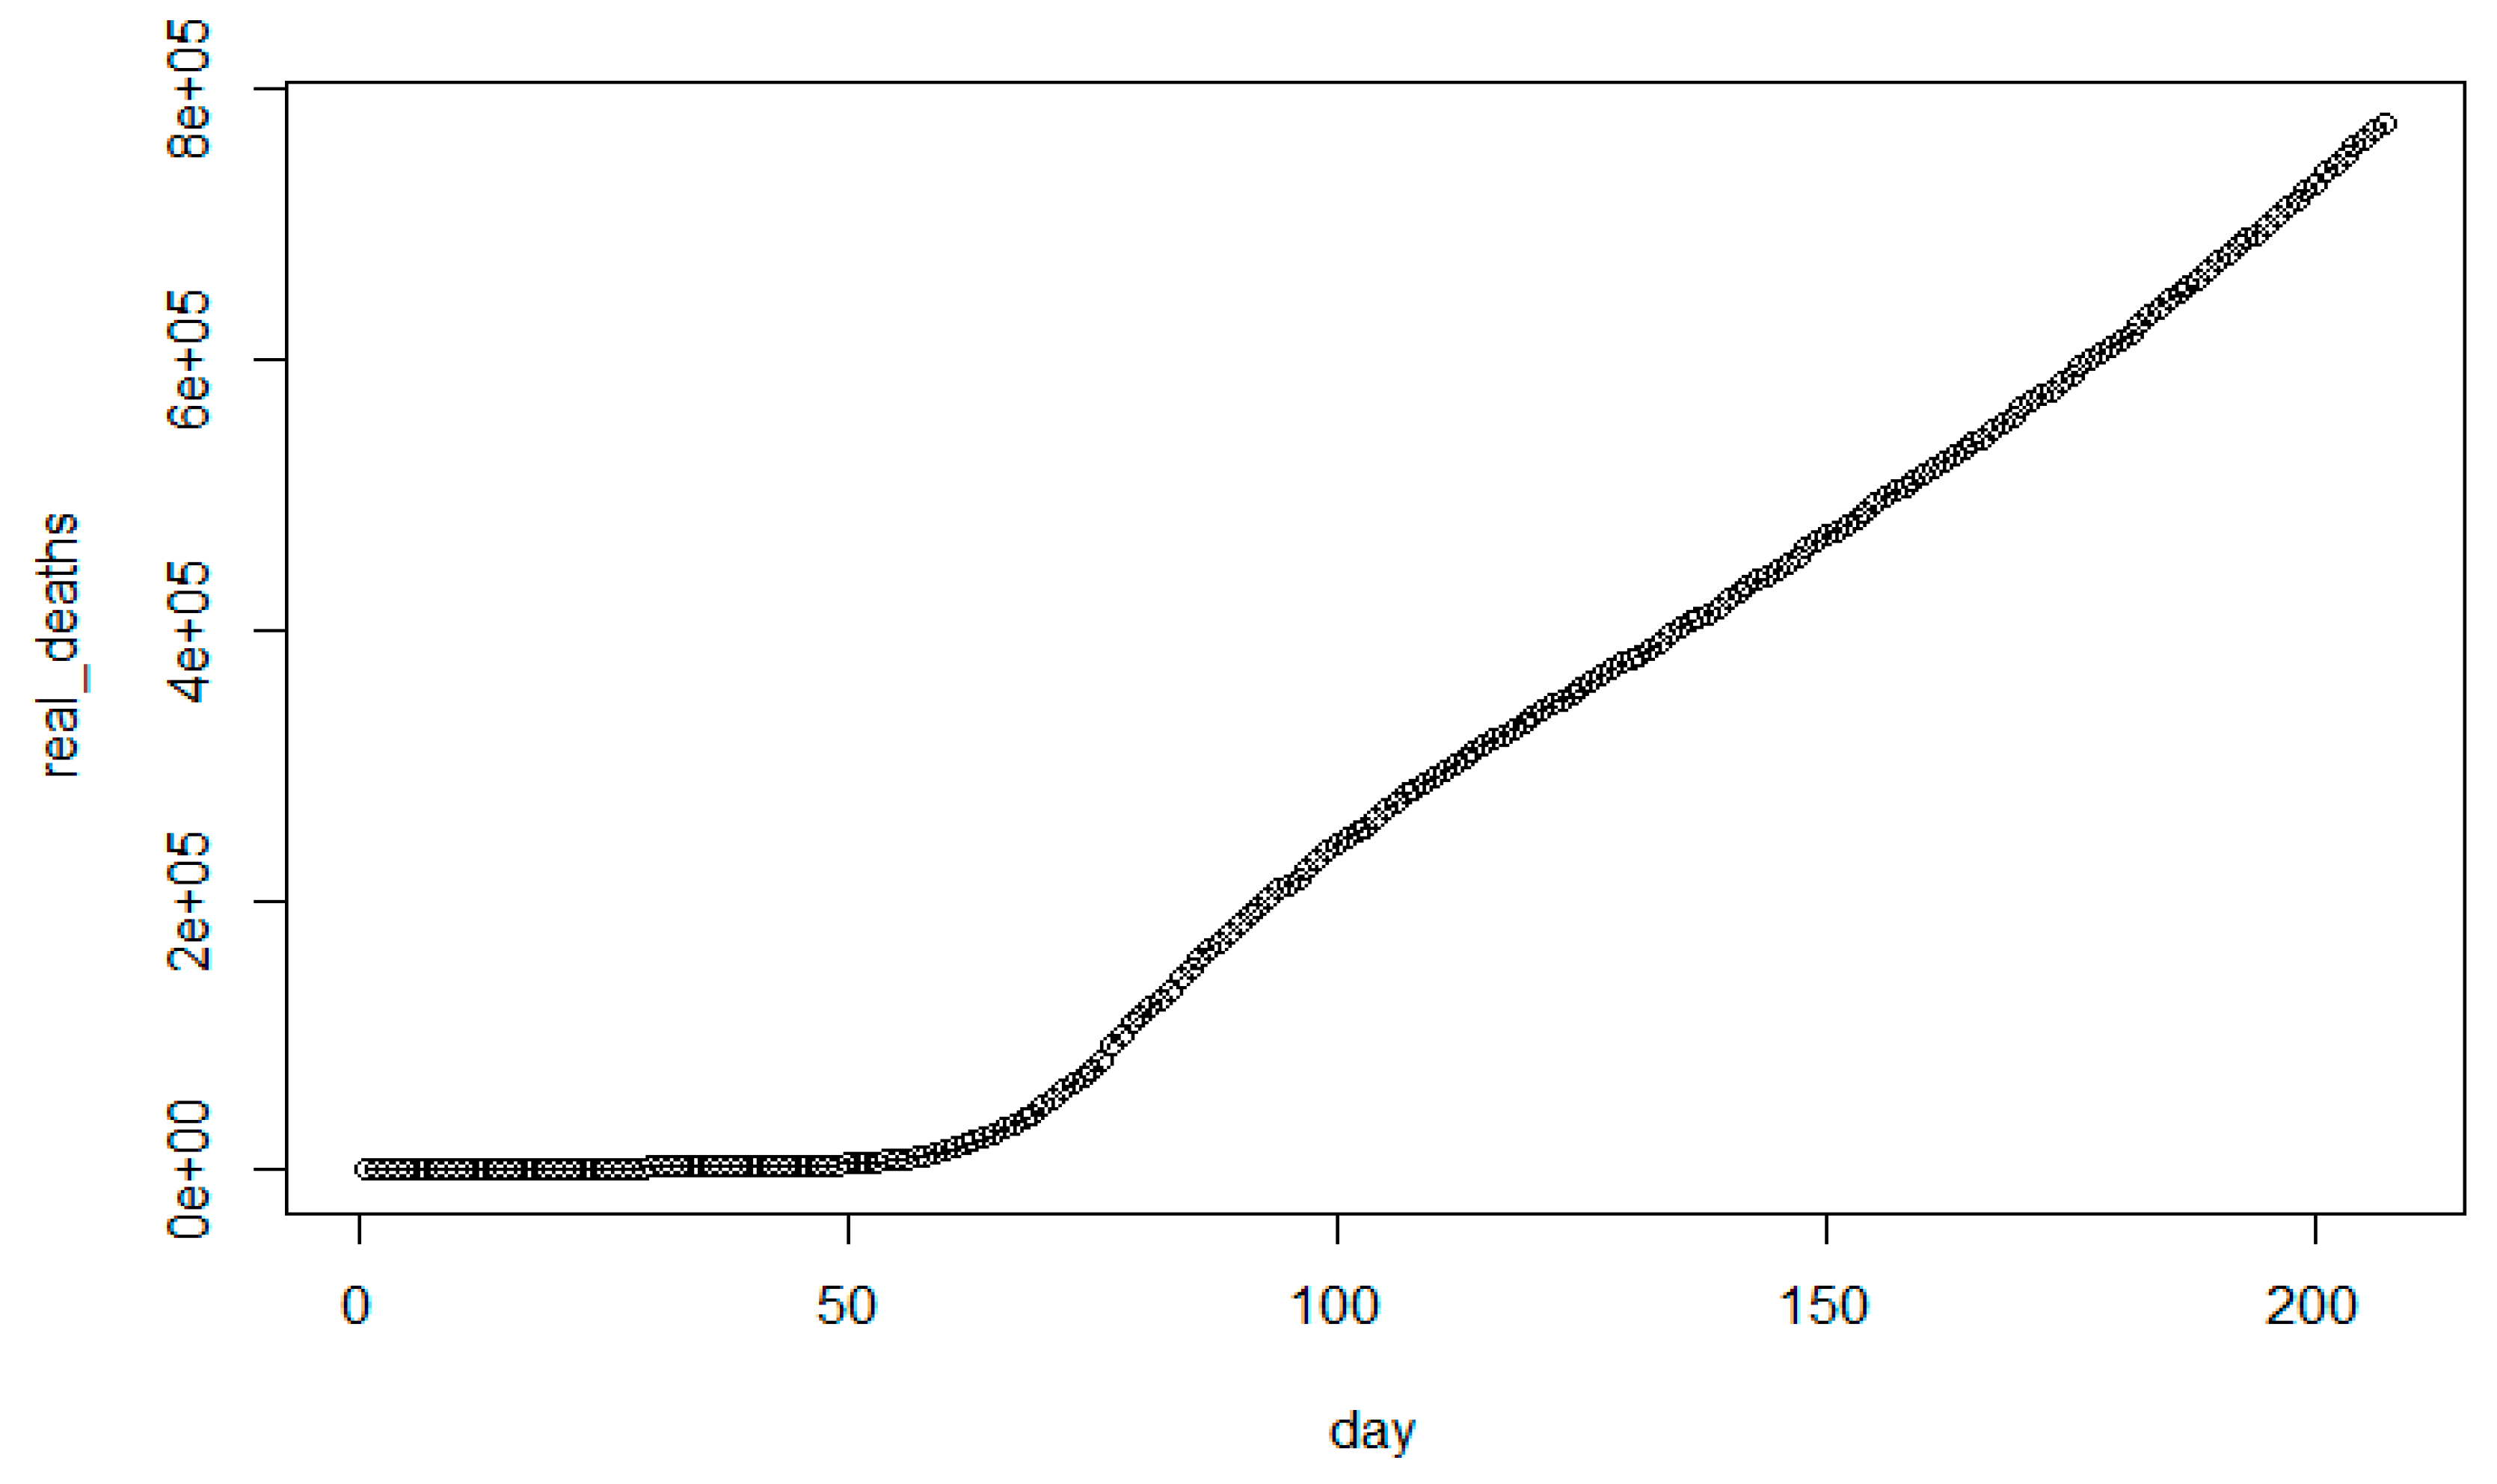
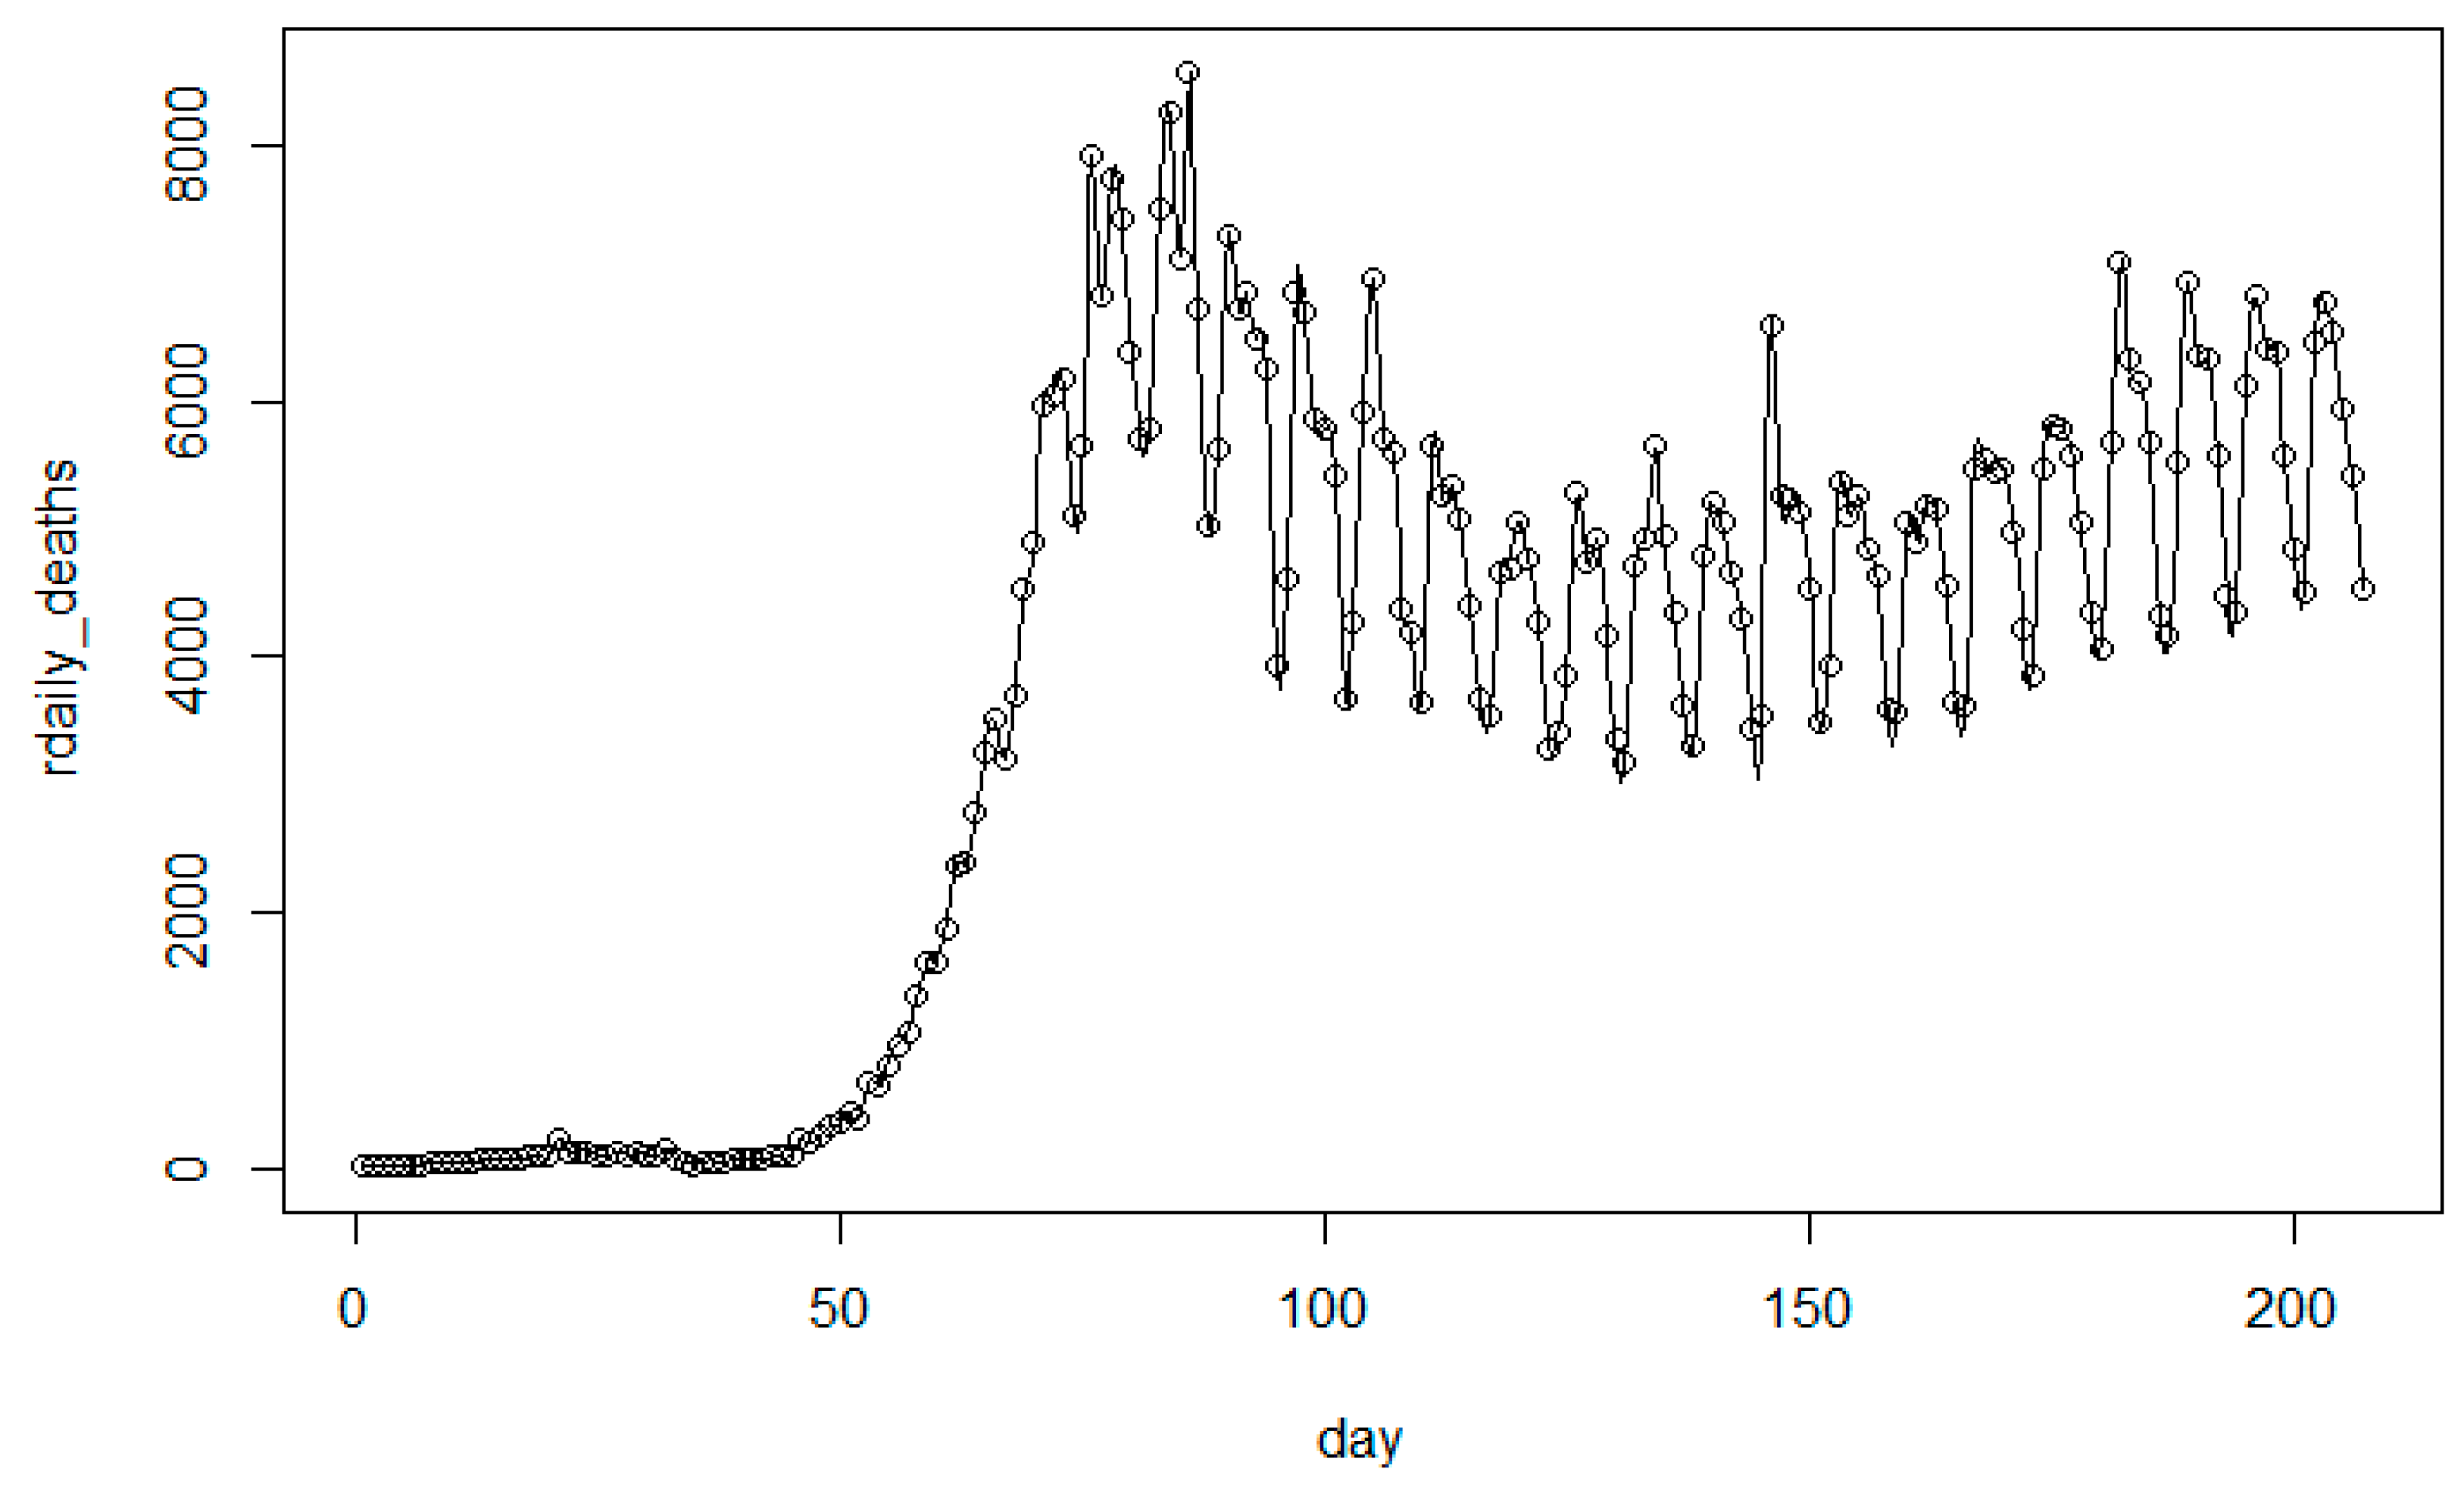
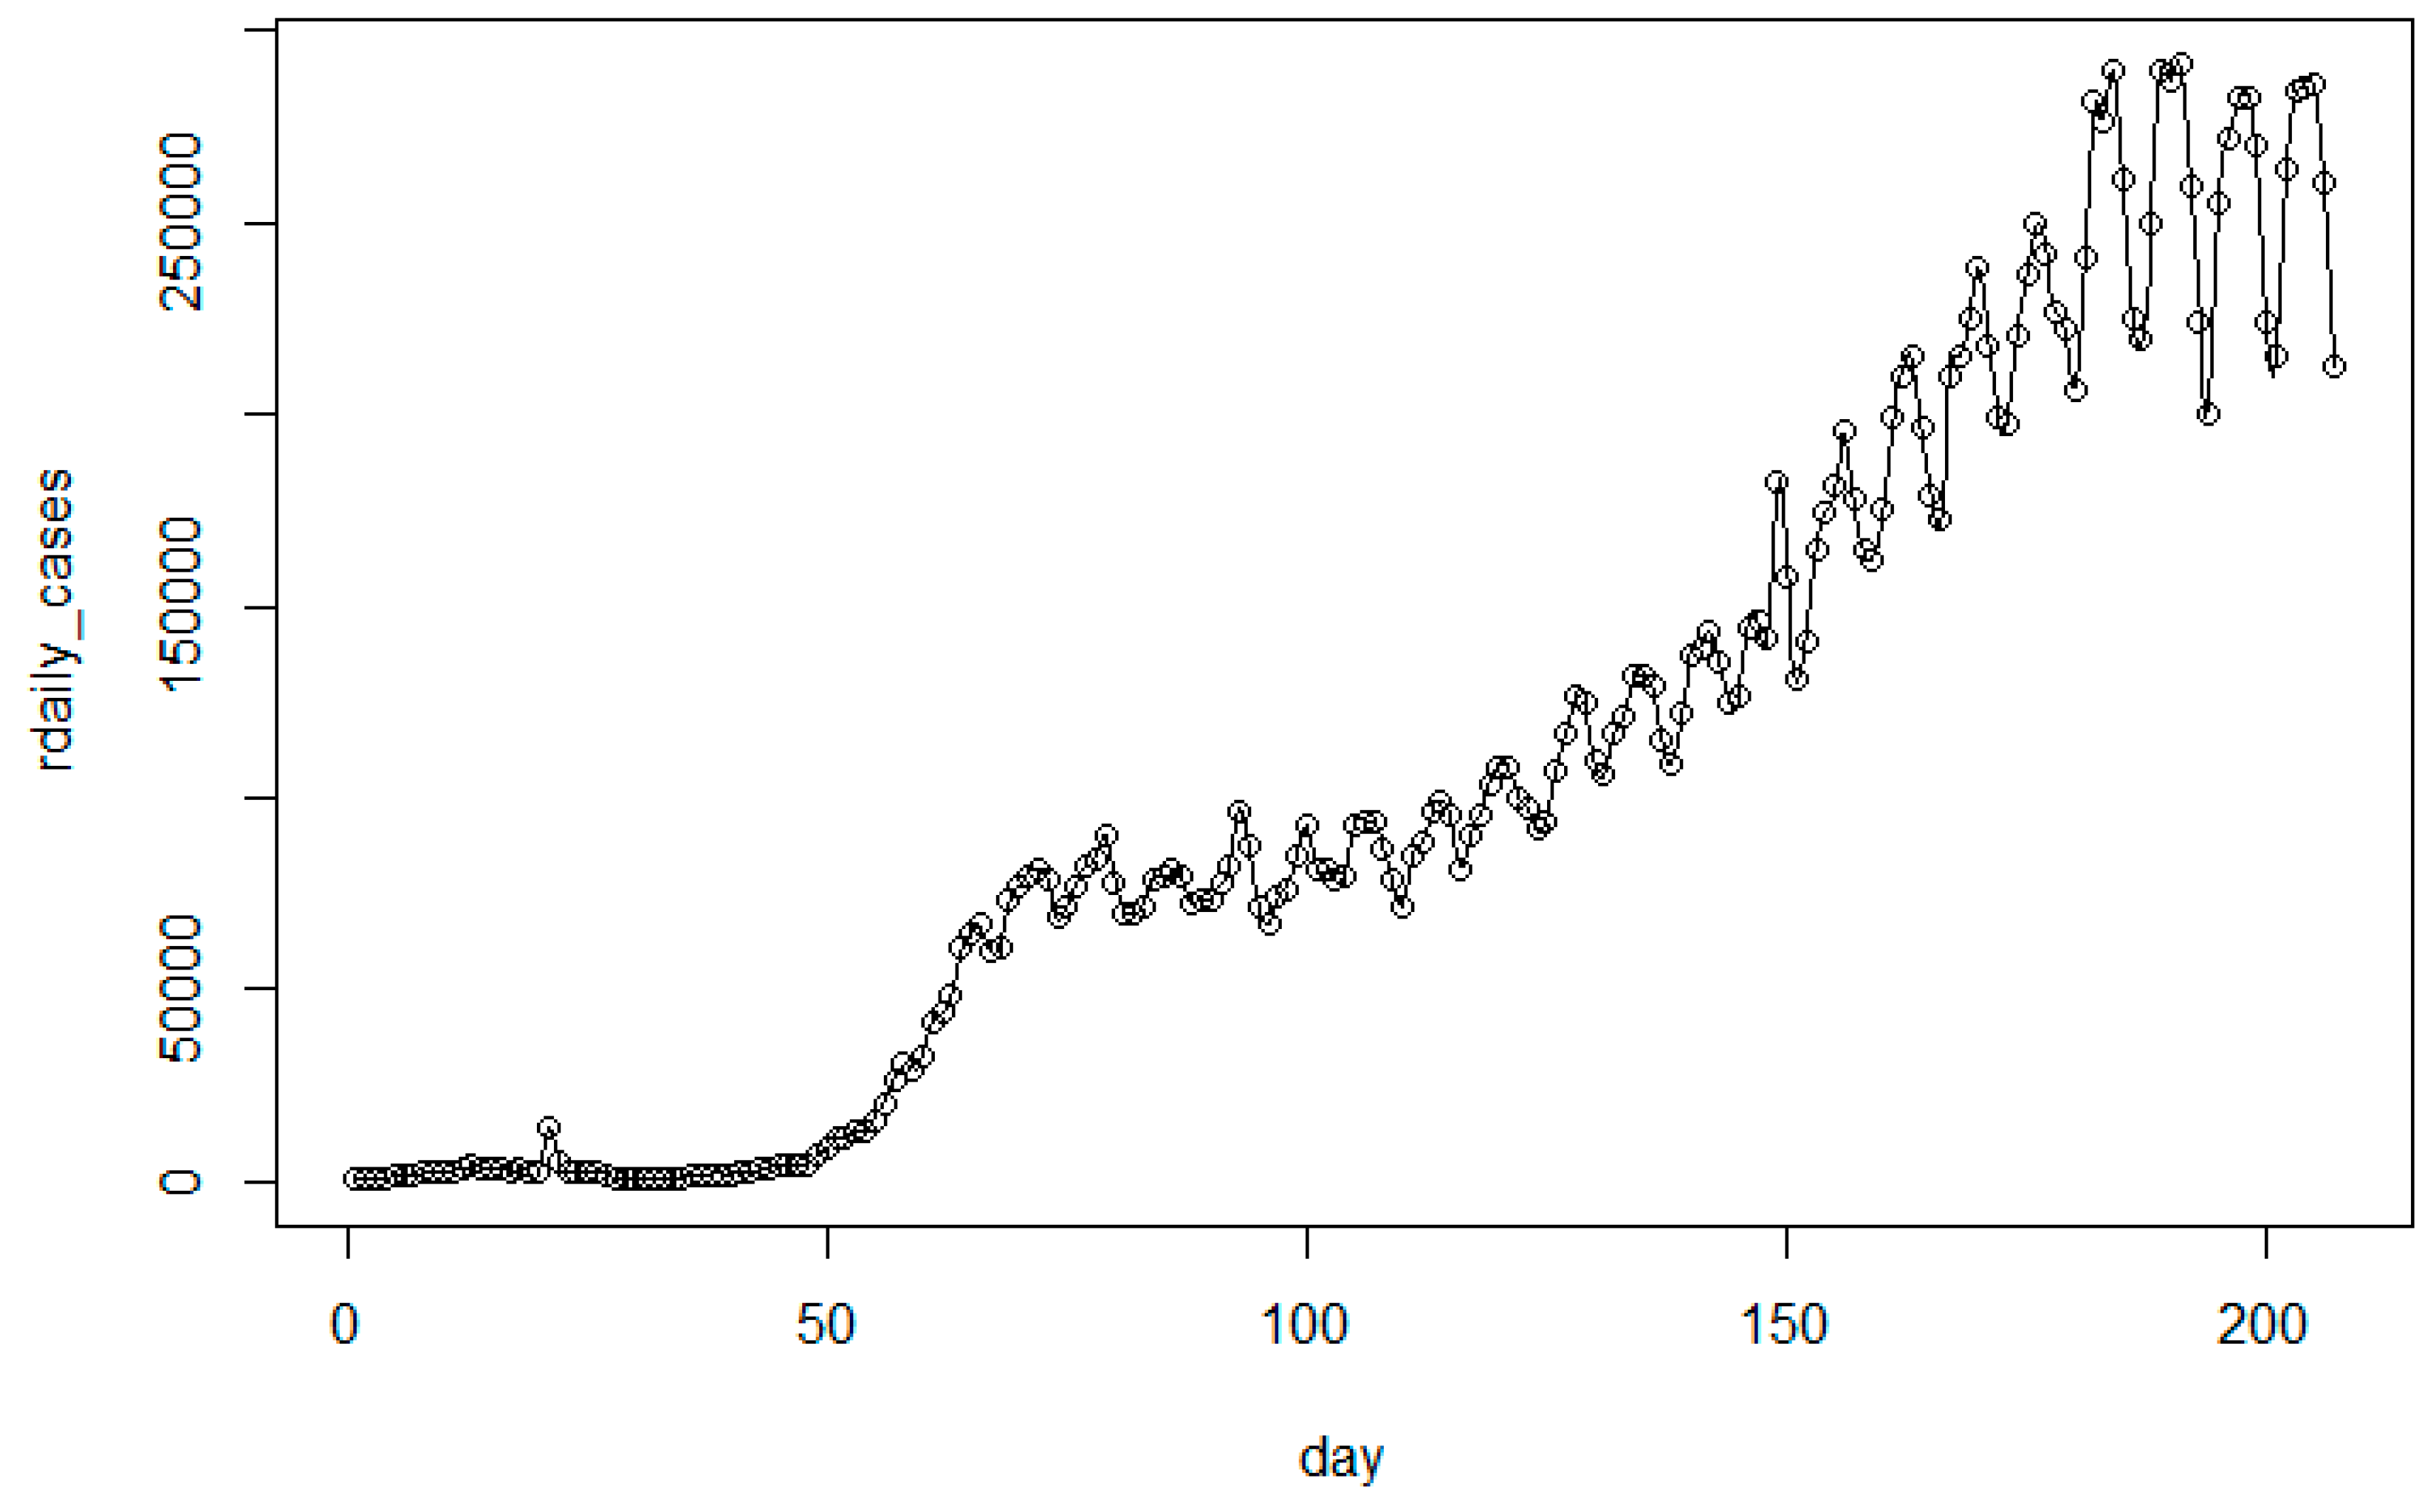
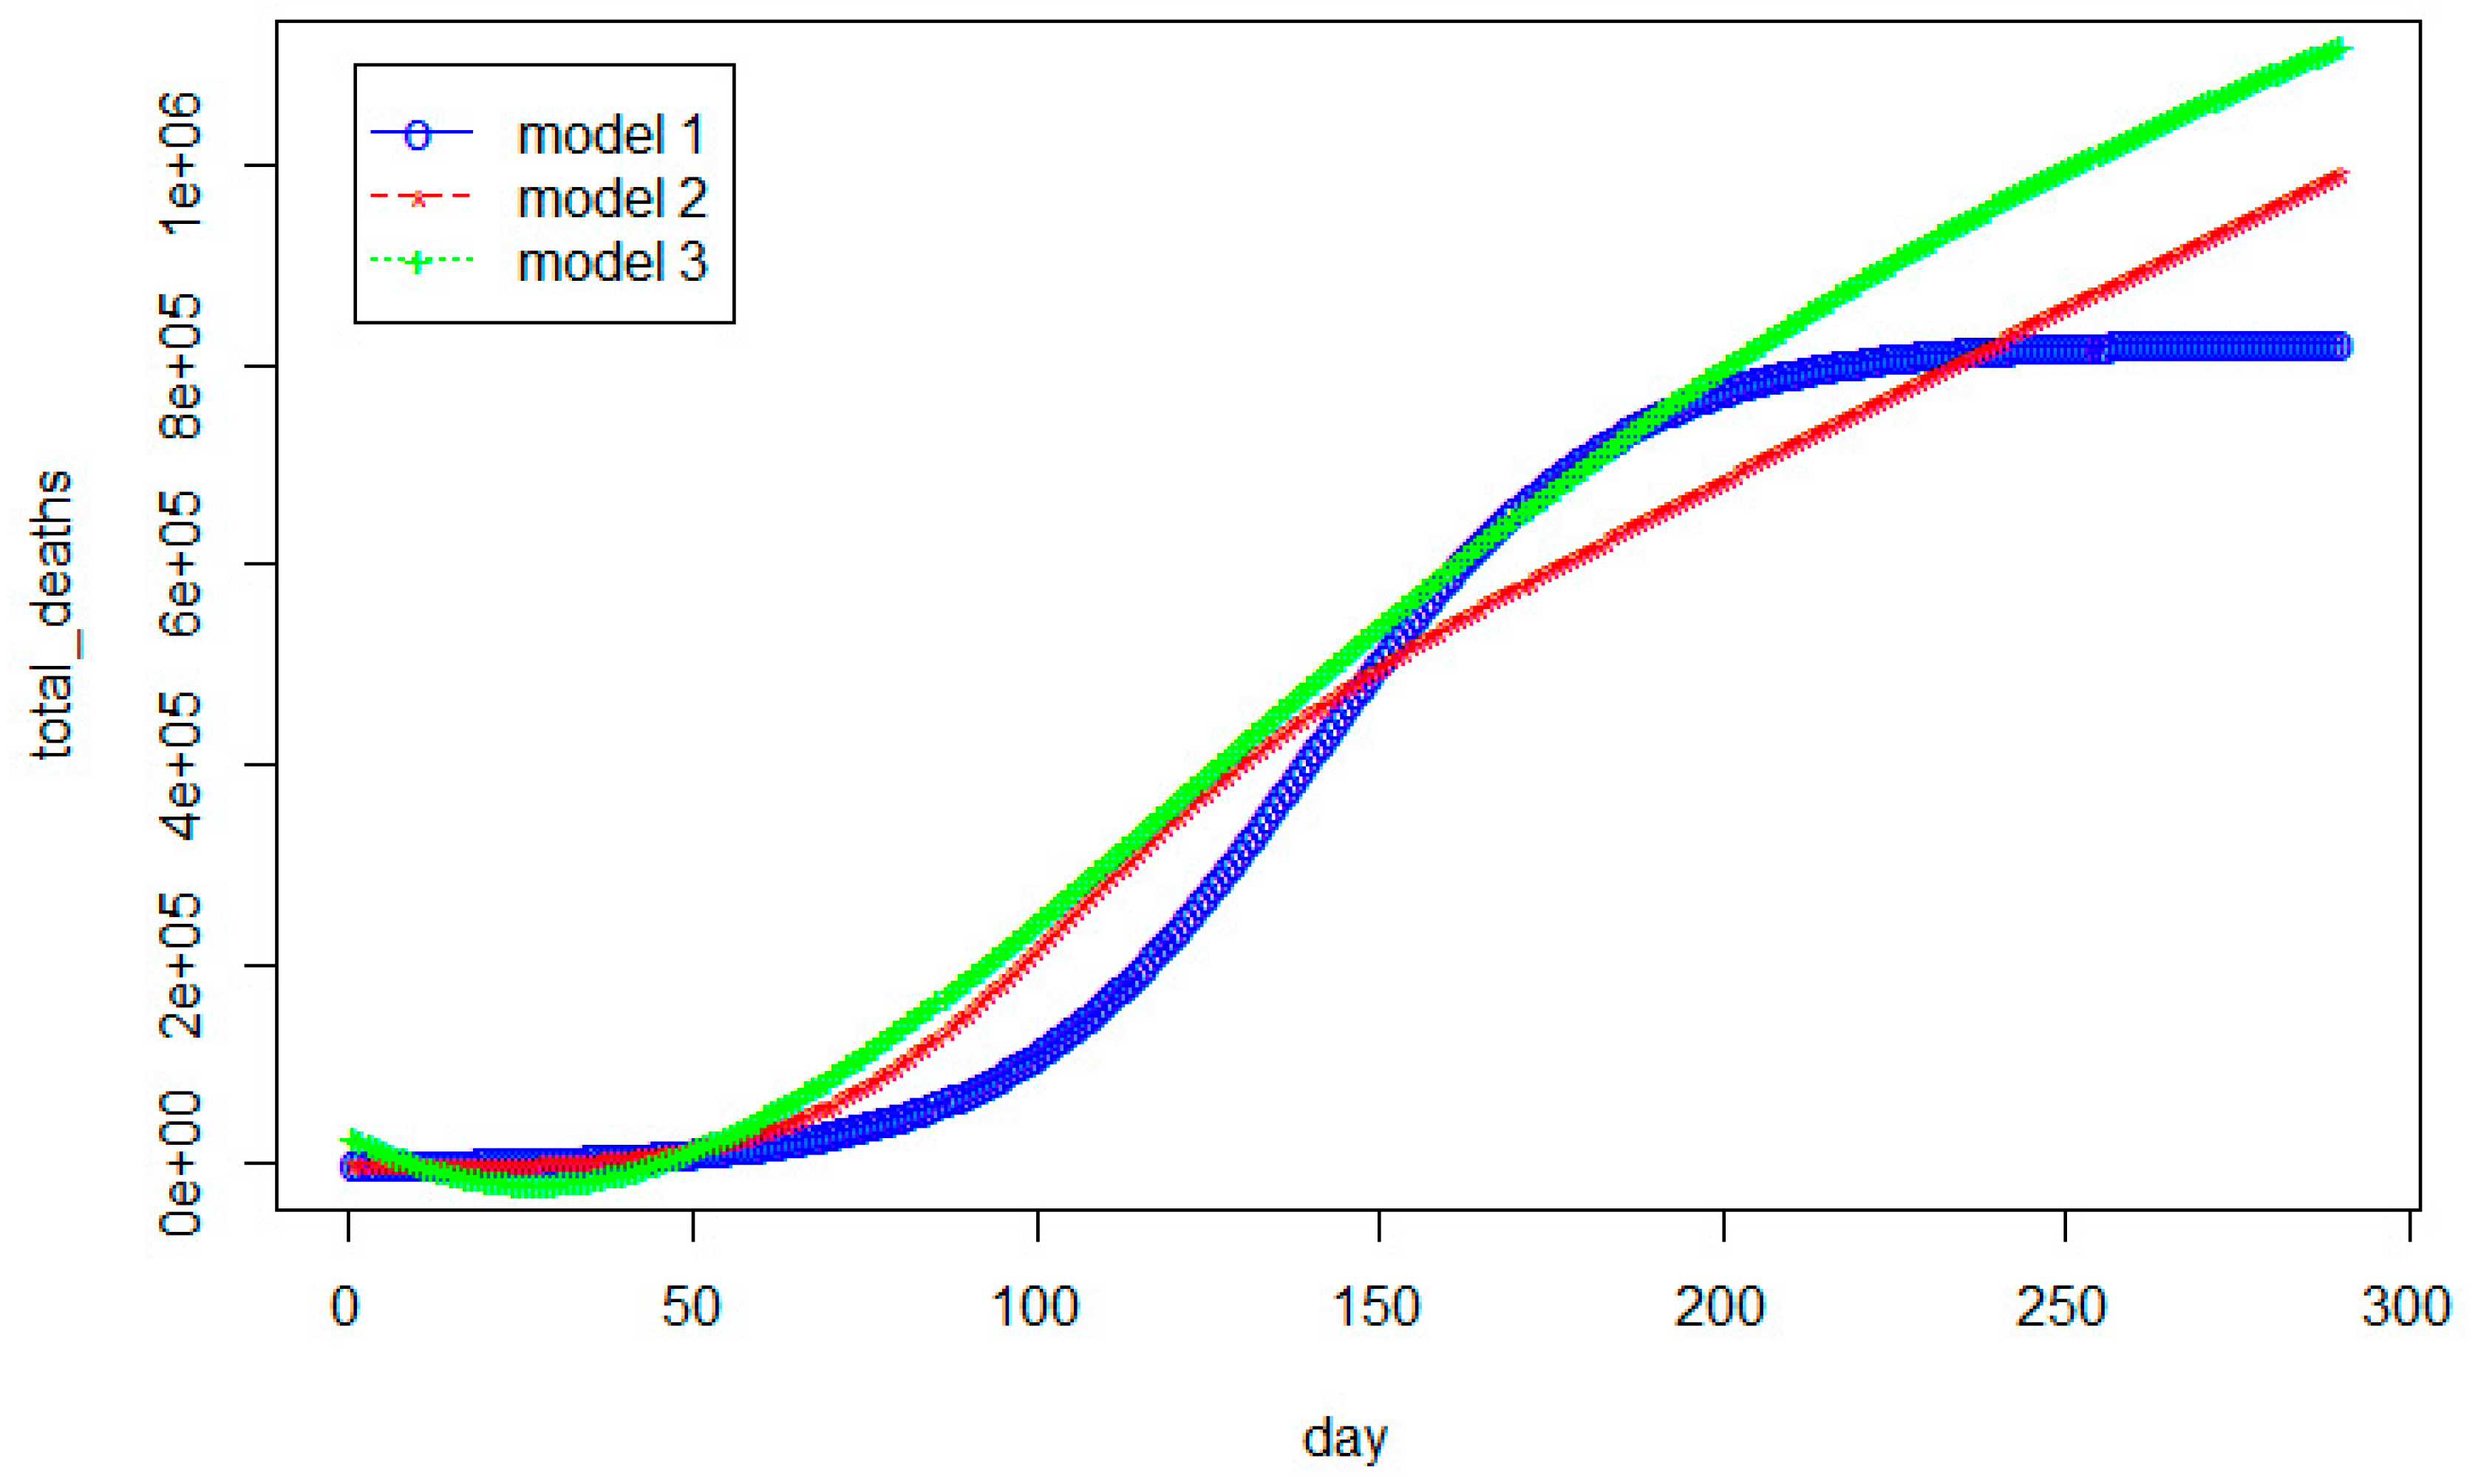
| Model | Total Death Toll p(t) | Daily Death Toll r(t) |
|---|---|---|
| Model 1 [1] | ||
| Model 2 [18] | ||
| Model 3 (new model) |
| Selection Criteria | Model 1 | Model 2 | New Model (Model 3) |
|---|---|---|---|
| MSE (ranking) | 45602771 (3) | 6014847 (2) | 5185574 (1) |
| AIC (ranking) | 3002.0 (3) | 2658.6 (2) | 2634.3 (1) |
| BIC (ranking) | 3014.5 (3) | 2674.3 (2) | 2653.1 (1) |
| PC (ranking) | 1465.8 (3) | 1290.5 (2) | 1271.1 (1) |
| PIC (ranking) | 7570059990 (3) | 992449703 (2) | 850434102 (1) |
| PRR (ranking) | 31.2 (2) | 25.4 (1) | 72.0 (3) |
| PP (ranking) | 433739555 (3) | 415378.8 (1) | 935026.6 (2) |
| Selection Criteria | Model 1 | Model 2 | New Model (Model 3) |
|---|---|---|---|
| MSE (ranking) | 4806104858 (3) | 455263766 (2) | 278915137 (1) |
| AIC (ranking) | 4618.6 (3) | 4131.8 (2) | 4031.3 (1) |
| BIC (ranking) | 4632.0 (3) | 4148.4 (2) | 4051.3 (1) |
| PC (ranking) | 2264.8 (3) | 2016.2 (2) | 1957.6 (1) |
| PIC (ranking) | 975639286196 (3) | 91963280768 (2) | 56061942563 (1) |
| PRR (ranking) | 94.9 (2) | 21.4 (1) | 158.9 (3) |
| PP (ranking) | 7682.6 (2) | 162.6 (1) | 1572213 (3) |
© 2020 by the author. Licensee MDPI, Basel, Switzerland. This article is an open access article distributed under the terms and conditions of the Creative Commons Attribution (CC BY) license (http://creativecommons.org/licenses/by/4.0/).
Share and Cite
Pham, H. Estimating the COVID-19 Death Toll by Considering the Time-Dependent Effects of Various Pandemic Restrictions. Mathematics 2020, 8, 1628. https://doi.org/10.3390/math8091628
Pham H. Estimating the COVID-19 Death Toll by Considering the Time-Dependent Effects of Various Pandemic Restrictions. Mathematics. 2020; 8(9):1628. https://doi.org/10.3390/math8091628
Chicago/Turabian StylePham, Hoang. 2020. "Estimating the COVID-19 Death Toll by Considering the Time-Dependent Effects of Various Pandemic Restrictions" Mathematics 8, no. 9: 1628. https://doi.org/10.3390/math8091628
APA StylePham, H. (2020). Estimating the COVID-19 Death Toll by Considering the Time-Dependent Effects of Various Pandemic Restrictions. Mathematics, 8(9), 1628. https://doi.org/10.3390/math8091628


