Abstract
Decisions concerning crucial and complicated problems are seldom made by a single person. Instead, they require the cooperation of a group of experts in which each participant has their own individual opinions, motivations, background, and interests regarding the existing alternatives. In the last 30 years, much research has been undertaken to provide automated assistance to reach a consensual solution supported by most of the group members. Artificial intelligence techniques are commonly applied to tackle critical group decision-making difficulties. For instance, experts’ preferences are often vague and imprecise; hence, their opinions are combined using fuzzy linguistic approaches. This paper reports a bibliometric analysis of the ample literature published in this regard. In particular, our analysis: (i) shows the impact and upswing publication trend on this topic; (ii) identifies the most productive authors, institutions, and countries; (iii) discusses authors’ and journals’ productivity patterns; and (iv) recognizes the most relevant research topics and how the interest on them has evolved over the years.
1. Introduction
Making decisions under complex and uncertain situations frequently requires the cooperation of a team of experts, each one with their own background, opinions, motivations, etc. As Huber [1] already noticed in 1984, in these circumstances, experts usually need to spend considerable time in meetings to reach a collective agreement. For more than 30 years, research on Group Decision-Making (GDM) systems have pursued saving much of this time by providing automated support to accomplish consensual decisions [2,3].
Figure 1 sketches the general GDM framework, where a group of experts desire to make a collective decision among a set of alternatives. First, they express their individual preferences on the alternatives. Then, those preferences are combined using an aggregation function. As typically the resulting collective preference does not achieve experts’ consensus, a feedback mechanism assists experts in changing their preferences for augmenting the consensus level.
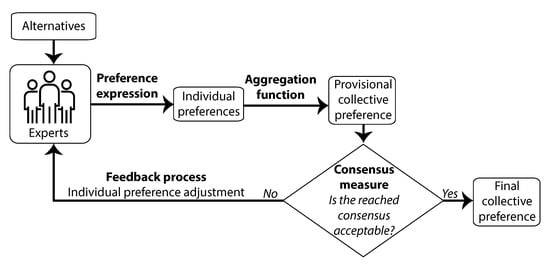
Figure 1.
GDM general schema.
Experts’ preferences are often vague and imprecise [4,5]. In these situations, Artificial Intelligence (AI) techniques are applied. For example, experts’ opinions are sometimes expressed as fuzzy preference relations that for each pair of alternatives and , indicate the expert’s preference degree of over . In these cases, individual preferences are aggregated using Ordered Weighted Averaging (OWA) operators [6], and fuzzy consensus models look for a solution supported by all or, at least, the majority of the experts [7]. Other times, experts’ preferences are conveyed linguistically, combined with Linguistic Ordered Weighted Average (LOWA) operators [8], and linguistic consensus models are used [9]. There are many other real-world GDM problems that use AI techniques as well, such as dealing with heterogeneous preference representation structures [10], detecting and managing non-cooperative experts’ behaviors [11], etc.
For instance, Ertugrul [12] reports the AI-GDM application for achieving a consensual decision concerning the facility location of a Turkish textile company, which has experienced a demand growth and thus needs to decide among three new alternative locations. The decision committee is composed of three experts that evaluate the locations according to five criteria: (i) favorable labor climate, (ii) proximity to markets, (iii) community considerations, (iv) quality of life, and (v) proximity to suppliers and resources. Experts express their preferences and criterion importance using linguistic variables (e.g., “I consider that the importance of proximity to markets is Very High, and that the second location Poorly satisfies this criterion”). Then, experts’ agreement is accomplished using Technique for Order Preference by Similarity to Ideal Solution (TOPSIS) [13].
Given the great applicability of AI-GDM to a variety of domains (e.g., energy policies [14], green economy [15], web 2.0 communities [16], construction industry [17], animal behavior [18], water allocation management [19], supply chain coordination [20], library quality evaluation [21], construction project management [22], offshore wind farm siting [23], airport ground access [24], etc.), much research has been published on this topic.
This paper main contribution is to provide a systematic analysis of the vast literature published for the last 30 years on AI-GDM. To do so, a sample of 2862 articles gathered from Clarivate’s Web of Science (WoS) is examined. Analyzing manually such a large sample would be difficult and error-prone, and thus automated procedures are preferable [25,26,27,28]. The science of science provides a collection of techniques to analyze scientific documents to identify patterns and trends [29,30,31,32]. In particular, this paper adopts two approaches: performance analysis [33] and science mapping [34]. Performance analysis estimates the productivity and impact of the scientific actors (researchers, organizations, etc.) measuring how frequently articles are cited. This paper uses the h-index [35], which is one of the most widespread indicators for citation analysis. Science mapping uncovers the structural and dynamic aspects of scientific research, quantifying and visualizing its thematic subfields. This paper uses the co-word analysis method [36], which accounts for the association strengths of the papers’ keywords.
Using both science mapping and performance analysis, this paper answers the following Research Questions (RQs):
- RQ1: How is the number of publications on AI-GDM evolving over the years?
- RQ2: What is the impact of the research literature on AI-GDM?
- RQ3: Who are the most productive authors?
- RQ4: Is there any authors’ productivity pattern?
- RQ5: How do the most productive authors collaborate?
- RQ6: What countries and institutions are leading research?
- RQ7: What journals are publishing most articles?
- RQ8: Is there any journal productivity pattern?
- RQ9: What are the most relevant themes of research?
- RQ10: How has the interest in those themes evolved over time?
- RQ11: What are the main application domains?
The remaining of this paper is arranged as follows: Section 2 introduces the materials and methods used to undertake our bibliometric analysis; Section 3 reports the analysis results and provides some discussion regarding the research questions above; finally, Section 4 summarizes the conclusions of our work.
2. Materials and Methods
This section describes the systematic procedure we have followed to analyze the literature on AI-GDM.
2.1. Bibliometric Workflow
The workflow suggested by Cobo et al. [29] has been adopted to undertake our analysis systematically, which is similar to others proposed in the literature, such as PRISMA [37] or Börner et al. [38].
Figure 2 shows the followed workflow, which is organized in three stages:

Figure 2.
Followed bibliometric workflow.
- Data retrieval. As many experts have stated [39,40,41], obtaining all the articles relevant for a literature review is unrealistic. The objective is then to achieve an unbiased publication sample that represents the population satisfactorily.A sample of 2862 bibliometric records was gathered from the Clarivate WoS database using the following query:
 The first line sets the topic of the analysis; the NEAR/0 operator forces that (Making OR Support) follows immediately Group Decision, but tolerates spaces and the ‘-’ character (e.g., the query catches articles with Group Decision-Making and Group Decision-Making). As this paper focuses on the application of AI techniques to GDM, Line 2 limits the scope to the WoS category Computer Science Artificial Intelligence. Line 3 sets the time period of the records: every article published until 2019. Finally, Line 4 specifies the WoS indexes against the query is thrown.As a final remark, the criterion to select WoS instead of other databases, such as Google Scholar or Dimensions, is its outstanding data quality prestige [42].
 - Data normalization. Bibliographic data are sometimes not normalized enough [29,30]: an author may appear differently in several records, the same concept may correspond to distinct keywords, etc. These problems can bias the subsequent analysis. For this reason, we preprocessed the data to guaranty its normalization.
- Data analysis. The normalized data were examined using two widespread bibliometric procedures [43]: performance analysis and science mapping. Both techniques have been successfully applied in recent studies (e.g., [25,26,28]) because they complement each other very well: performance analysis determines the importance of the bibliometric elements, and science mapping models how those elements are interrelated.
2.2. Performance Analysis
The primary method to assess research performance is citation analysis [44]. The Hirsch index [35], typically known as h-index, is probably the most commonly accepted citation analysis indicator [45]. If the index is used to quantify the author’s productivity, then it is defined as follows:
An author has index h whenever h of her n papers have at least h citations each, and the remaining papers have less than or equal to h citations each.
Furthermore, the h-index concept can be adapted to account for the performance of any bibliographic element: articles [46], journals [45], research organizations, etc.
2.3. Science Mapping
Three complementary techniques [47] were applied to identify the key research topics, the significance and role that those topics play, and how the interest in the topics has evolved over time. The following sections introduce these techniques.
2.3.1. Thematic Network Identification
A method called co-word analysis [36] was used to recognize the most relevant topics in AI-GDM research. Co-word analysis works by measuring the co-occurrence frequency of pairs of article’s keywords. Co-occurrences are first normalized [48], using the equivalence index [34] typically. Then, a clustering algorithm groups the keywords in function of the computed equivalence indexes [49], corresponding each group to a thematic network, i.e., to a key topic. In particular, the clustering algorithm we applied was simple centers [34].
2.3.2. Strategic Diagrams
The role that each thematic network plays in AI-GDM research was modeled using the density and centrality measures. Density [34] accounts for the thematic network internal coherence by examining the links between keywords inside the network. Centrality [50] estimates the interaction degree of the network with others by analyzing the links between keywords inside and outside the network.
Strategic diagrams are then used to provide a global representation of all topics’ role. In these diagrams, the x-axis and y-axis denote the network’s centrality and density, respectively. Thus networks are classified according to the quadrants where they are placed [51,52]; see Figure 3.
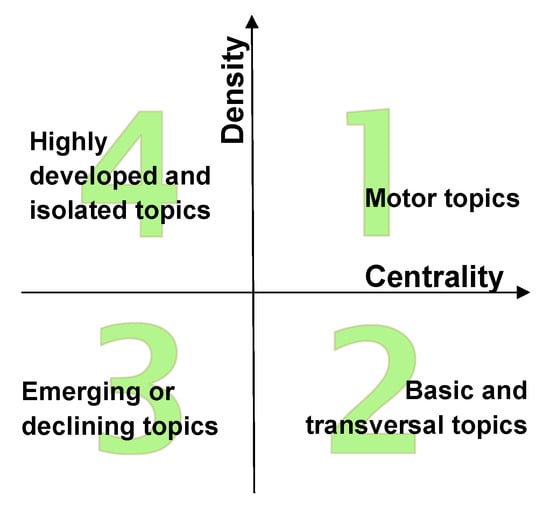
Figure 3.
Strategic diagram’s quadrants.
2.3.3. Maps of Conceptual Evolution
As the years go passing by, the vocabulary authors employ evolves: whereas some new words appear, others fall into disuse. Hence, the keyword set used in each period provides information concerning if the number of researched topics increases (new terms are included in the set), decreases (old words are erased from the set), or remains stable. Following the indications given in [47], we used the Inclusion index to track the vocabulary evolution in AI-GDM.
3. Results and Discussion
The following sections summarize the results of our analysis and answer the research questions this paper targets.
3.1. How Has the Number of Publications on AI-GDM Evolved over the Years? (RQ1)
Figure 4 shows the number of published papers per year. Colors blue and yellow denote periods of stability and growth, respectively. In particular, four stages can be distinguished:

Figure 4.
Number of published papers per year.
- During the first ten years (from 1991 to 2000), the fundamental ideas were proposed and developed in 82 articles.
- The subsequent nine years (from 2001 to 2009) correspond to a growth period, where 540 articles where published.
- A short period of three years (from 2010 to 2012) with a stable publication rate (121.33 articles per year on average, accumulating a total of 364 papers).
- A rapid growth period that lasts up to present days (from 2013 to 2019), where 1856 articles have been published.
3.2. RQ2: What Is the Impact of the Research Literature on AI-GDM? (RQ2)
Citations to the published literature on AI-GDM have also followed an upswing trend. Figure 5 represents the evolution over time of the total number of citations to all the articles in the sample. The articles’ h-index is 113.

Figure 5.
Sum of times cited per Year.
3.3. Who Are the Most Productive Authors? (RQ3)
Table 1 summarizes the authors who have published the highest number of papers, including also the total number of citations that those papers have received, and the authors’ h-index (limited to the sample).

Table 1.
Most prolific authors.
3.4. Is There Any Authors’ Productivity Pattern? (RQ4)
Figure 6 represents the number of authors per year. As the number of articles increases over time, the number of authors rises as well. There is a total of 3514 authors. Although most of them have published a pretty reduced number of papers (67.92% of the authors have written only one paper in 29 years), a small group of authors have contributed with a much bigger number of articles (8.22% of the authors have published at least five articles). This fact is not surprising, as it is consistent with one of the fundamental laws in bibliometrics: Lotka’s law [53] (also known as the inverse square law).

Figure 6.
Number of authors per year.
In 1926, after analyzing authors’ productivity in different domains, Lotka found that the number of authors with n papers is usually inversely proportional to . In our case, 2387 authors have written one article; hence, Lotka’s law predicts that the number of authors that have published n papers should be . Figure 7 compares the empirical distribution found in the sample with the distribution predicted by Lotka’s law, showing that both distributions fit much.
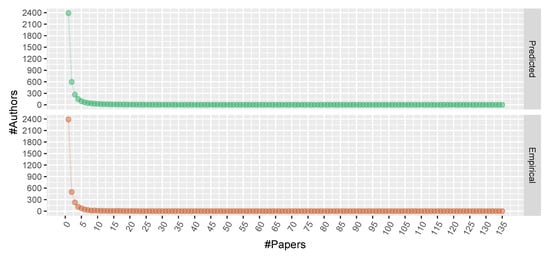
Figure 7.
Comparison of the number of authors that have published n papers with the theoretical values predicted by Lotka’s law.
3.5. How Do the Most Productive Authors Collaborate? (RQ5)
Pretty much as industrial production relies on teamwork, academic literature is increasingly the result of the collective work of several researchers [54]. Figure 8 shows that research on AI-GDM follows this trend too.

Figure 8.
Evolution of the number of co-authors per paper on average.
Accordingly, studying the collaboration between authors has a remarkable interest [45]. The graph in Figure 9 represents how the most productive authors collaborate. Each node accounts for one of the top 1% most prolific authors. The size of each node is proportional to its Eigenvector centrality in the collaboration network. This centrality models the importance of a node considering not only the number and weights of its connections to other nodes but also the influence of those nodes in the network [55]. There is an edge between two nodes whenever the corresponding authors have published some paper together. Edge thickness is proportional to its weight, i.e., to the number of papers that both researchers have coauthored.
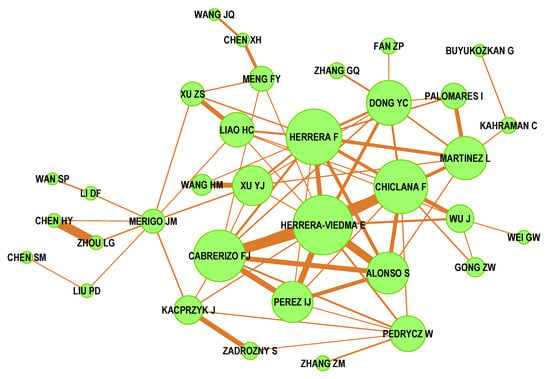
Figure 9.
Collaboration network of the 1% most prolific authors.
3.6. What Countries and Institutions Are Leading Research? (RQ6)
Figure 10 shows the number of papers that each country’s researchers have published. The most prolific countries are China (39.25% of the papers), Spain (9.64%), United States of America (5.15%), United Kingdom (4.29%), Taiwan (4.10%), Turkey (4.07%), and India (3.25%).
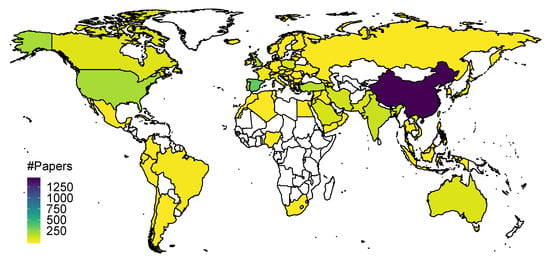
Figure 10.
Most prolific countries.
Table 2 summarizes the most prolific organizations, showing the number of papers that their researchers have published, how many times those articles have been cited, and the organizations’ h-index (limited to the sample).

Table 2.
Most prolific organizations.
3.7. What Journals Are Publishing Most Articles? (RQ7)
Table 3 shows the journals that have published most articles. Again, the table includes the total number of papers, the citations per journal, and the journal’s h-index. The last column will be described in Section 3.8.

Table 3.
Most prolific journals.
3.8. Is There Any Journal Productivity Pattern? (RQ8)
Analogous to Lotka’s law for authors’ productivity (see Section 3.4), there is another bibliometric law for journal productivity called Bradford’s law [56]. It predicts an inverse relationship between the number of papers published in an area and the number of journals where the articles appear. In other words, a few journals usually account for a high portion of the total publications, while a high number of journals publish fewer articles in the area.
In our case, there are 2862 papers in the sample; 1016 published in conferences and 1846 published in journals. Although a total of 32 journals have published the 1856 articles, 9 of them have published 66% of the articles, i.e., journal productivity concentration is even higher than the one predicted by Bradford’s law. Figure 11 compares the cumulative distributions of the empirical data and the data predicted by Bradford’s law, according to the procedure proposed by Egghe and Rousseau [57]. Roughly speaking, suppose that the journals in the sample are sorted according to the number of articles into 3 groups, each one including of all articles approximately. Those groups are named Bradford’s zones. They are registered in Table 3’s last column, and highlighted with different colors in Figure 11 (Zone 1 in blue, Zone 2 in pink, and Zone 3 in yellow). Zone 1 comprises 2 core journals. Zone 2 includes 5 journals, thus Bradford’s constant n is . Although Bradford’s law predicts that the number of journals in Zone 3 should be , the empirical number of journals is much bigger: 25. Trying with different numbers of zones produces even more distant results.

Figure 11.
Comparison of Bradford’s law 2:5:154.
3.9. What Are the Most Relevant Themes of Research? (RQ9)
The complete results of the science mapping analysis we performed to determine the most prominent themes of the AI-GDM research field (RQ9) and their longitudinal evolution (RQ10) are available in the following public repository: https://github.com/rheradio/AI-GDM-BibAnalysis.
A strategic diagram is shown for each of the periods 1991–2009, 2010–2014 and 2015–2019. In each period, the volume of the spheres is proportional to the number of published documents associated with each research theme.
In the first period, 1991–2009, according to the strategic diagram shown in Figure 12, the GDM research field was focused on 17 themes. Nine of them stand out since they are motor, basic, and transversal: fuzzy-sets, public-investment-decision, multi-attribute-group-decision-making, trapezoid-fuzzy-numbers, consistency (i.e., approaches to measure the level of consistency of the information provided by the experts), information-retrieval, OWA-operators, TOPSIS, and decision-making.
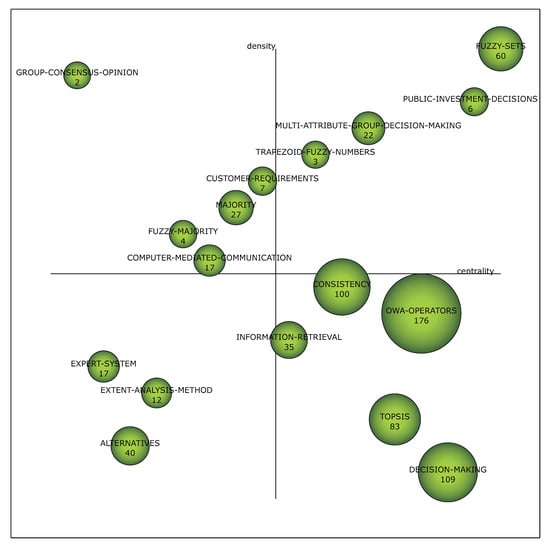
Figure 12.
Strategic diagram for the 1991–2009 period.
Taking into account the performance measures shown in Table 4, the themes OWA-operators, decision-making, and consistency got more than 100 documents. Considering the citations achieved, OWA-operators is the most cited theme, reaching more than 10,000 citations. Moreover, consistency and TOPSIS, with more than 6000 citations, achieved a significant impact.

Table 4.
Performance of the themes in the 1991–2009 period.
In the next period, 2010–2014, as it is shown in Figure 13, the GDM research field delved into the following ten themes (motor plus basic and transversal): OWA-operators, majority (i.e., the soft-computing approach that relaxes the total consensus, seeking the alternative supported by most experts), analytical-network-process, consistency, additive-consistency, vague-set-theory, TOPSIS, linguistic-variables, fuzzy-sets, and decision-making.
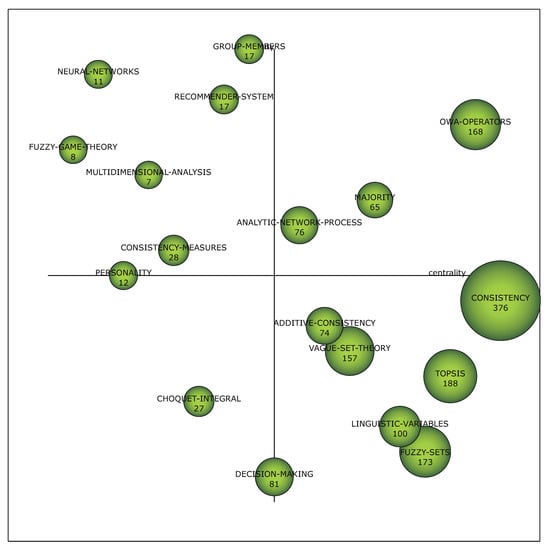
Figure 13.
Strategic diagram for the 2010–2014 period.
Bear in mind that according to the performance measures in Table 5, the themes consistency, TOPSIS, fuzzy-sets, OWA-operators, vague-set-theory, and lingustic-variables got more than 100 documents. Furthermore, the theme consistency, with more than 15,000 citations, almost double the impact of the second more cited theme. Moreover, the themes TOPSIS, fuzzy-sets, and vague-set-theory stand out with more than 6000 citations.

Table 5.
Performance of the themes in the 2010–2014 period.
As Figure 14 shows, the primary main research fields turned around 12 main themes in the last period, 2015–2019: terms-sets, AHP, Vikor-method, similarity-measures, consensus, consensus-reaching-process, multi-attribute-group-decision-making, supplier-selection, multi-criteria-group-decision-making, uncertainty, fuzzy-sets, and linguistic-term-sets.
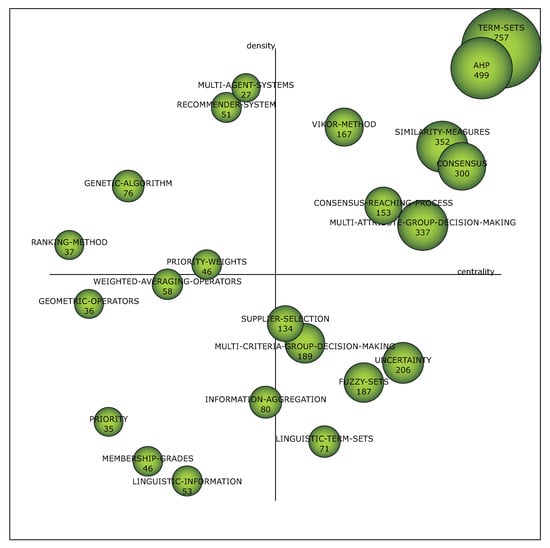
Figure 14.
Strategic diagram for the 2015–2019 period.
Moreover, according to the performance measures shown in Table 6, except for linguistic-terms-sets, the main themes pointed above got a great number of documents (more than 100). Taking into account the achieved citations, Term-sets was the most cited theme, with more than 11,000 citations. In comparison with the previous periods, themes have had high impact considering this period’s small citation window. In addition, themes AHP, similarity-measures, multi-attribute-group-decision-making, and consensus achieved more than 4000 citations.

Table 6.
Performance of the themes in the 2015–2019 period.
3.10. How Has the Interest in Those Themes Evolved over Time? (RQ10)
This section discusses the thematic network evolution, describing how these themes evolved through the years, and how the topics emerged and changed. For that reason, an evolution map [47] is provided, in which each column represents a period. There is a link between the themes of two consecutive periods if both themes have keywords in common. Indeed, the link strength is proportional to the Inclusion index (the more words they have in common, the thicker the link).
Therefore, analyzing the themes across three consecutive periods, we can summarize the conceptual evolution of AI-GDM in seven thematic areas (Figure 15): (i) multi-attribute/criteria in GDM, (ii) analytical network process, (iii) decision-making and uncertainty, (iv) fuzzy sets, (v) recommender systems, (vi) consensus and majority, and (vii) agent systems.
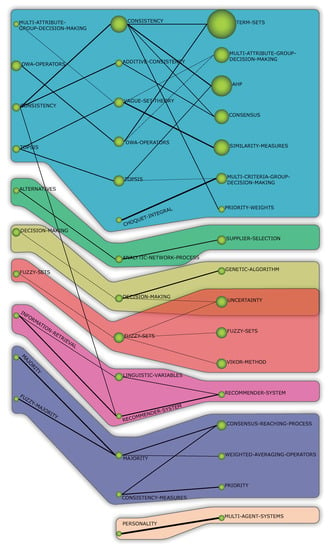
Figure 15.
Thematic areas’ conceptual evolution.
Furthermore, for each thematic area, a set of bibliometric indicators were calculated to show the performance and impact score. In that way, Table 7 shows for each thematic area, the total number of documents, the number of citations achieved, and the h-index. It is worth noting that the documents were associated with each thematic area using the algebraic union of the documents belonging to each theme, so it could be possible that the same documents count in different research areas. That is, the sum of the documents could be different from the total number of documents analyzed in this study.

Table 7.
Performance of thematic areas.
Considering the thematic areas shown in Figure 15, and their performance measures, we should point out that AI-GDM has been mainly focused on the research area of multi-attribute criteria, as it is the largest one (it has the biggest number of documents). Also, it achieves the highest number of citations count. The thematic network fuzzy-sets also has a significant number of documents, which have been highly cited.
3.11. What Are the Main Application Domains? (RQ11)
WoS provides a classification system called, research areas that organizes publications according to their subjects into 252 areas. Research literature on AI-GDM spreads over a variety of application domains: 19.67% of the papers fall into the Engineering area, 15.79% into Operations Research Management Science, 7.97% into Automation Control Systems, etc. The word cloud in Figure 16 shows the foremost application domains; words have been abbreviated, and their size is proportional to the number of articles classified in the corresponding areas.
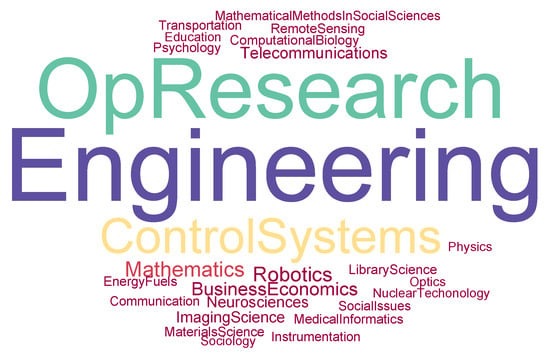
Figure 16.
Main application domains.
4. Conclusions and Future Challenges
In this paper, a systematic and highly automated bibliometric workflow has been followed to analyze the literature on group decision-making based on artificial intelligence. Our longitudinal analysis shows that:
- Research on AI-GDM is increasing as the number of papers and citations to those papers is growing substantially.
- Most research has been carried out by Chinese universities. Nevertheless, a few Spanish investigators lead research in terms of productivity and collaboration network centrality.
- Two basic bibliometric laws hold to a great extent, Lotka’s law and Bradford’s law, which model authors’ and journal productivity concentrations, respectively.
- AI-GDM is being applied to a variety of domains, including engineering, operations research management science, automation control systems, robotics, economic, telecommunications, imaging science, etc.
- Currently, themes such as terms-sets, analytical-hierarchical-process, Vikor-method, similarity-measure, consensus, consensus-reaching-process, and multi-attribute- group-decision-making are motor in AI-GDM research.
- In summary, the conceptual evolution of the AI-GDM research fields delved into seven thematic areas: multi-attribute/criteria in GDM, analytical network process, decision-making and uncertainty, fuzzy sets, recommender systems, consensus and majority, and agent systems.
Finally, recent literature on AI-GDM reveals the following trends and challenges:
- There is an increased need to support the consensus of huge groups of decision-makers. This need arises in several contexts, such as social networks, e-democracy platforms, crowd-funding systems, group recommender systems, etc. Those large groups are typically decomposed into smaller ones by applying different clustering algorithms, such as hierarchical clustering [58], discriminant analysis [59], etc.
- In classical GDM, a reduced group of experts needs to make a consensual decision. Presently, the experts’ group is often replaced by internet users’ opinions. As a result, natural language processing techniques have started to be applied for mining linguistic information that is subsequently processed by GDM systems [60].
- As AI-GDM problems become more complex, advanced models and simulations are required to support the experts’ group dynamics [61], e.g., for identifying the most influential experts, detecting manipulative and non-cooperative behaviors, etc.
- Deep learning has started to be used [62] for (i) estimating the importance (or weight) of the experts, their preferences, and their relationships, and (ii) learning the optimal settings of parameterized aggregation operators.
Author Contributions
Conceptualization: R.H., D.F.-A., C.C., and M.J.C.; Data curation: R.H. and M.J.C.; Formal analysis: R.H. and M.J.C.; Funding acquisition: R.H. and C.C.; Investigation: R.H. and M.J.C.; Methodology: M.J.C.; Project administration: M.J.C.; Resources: R.H., D.F.-A., C.C., and M.J.C.; Software: R.H. and M.J.C.; Supervision: M.J.C. and C.C.; Validation: D.F.-A.; Visualization: R.H. and M.J.C.; Writing-original draft: R.H. and M.J.C.; Writing-review & editing: D.F.-A. and C.C. All authors have read and agreed to the published version of the manuscript.
Funding
This work has been supported by (i) the Spanish Ministry of Science, Innovation and Universities, under grants with reference DPI2016-77677-P and PID2019-105381GA-I00 (iScience), and (ii) the Community of Madrid, under the research network CAM RoboCity2030 S2013/MIT-2748.
Conflicts of Interest
The authors declare no conflict of interest.
References
- Huber, G.P. Issues in the design of group decision support systems. MIS Q. 1984, 8, 195–204. [Google Scholar] [CrossRef]
- Cabrerizo, F.J.; Ureña, R.; Pedrycz, W.; Herrera-Viedma, E. Building consensus in group decision making with an allocation of information granularity. Fuzzy Sets Syst. 2014, 255, 115–127. [Google Scholar] [CrossRef]
- Cabrerizo, F.J.; Morente-Molinera, J.A.; Pedrycz, W.; Taghavi, A.; Herrera-Viedma, E. Granulating linguistic information in decision making under consensus and consistency. Expert Syst. Appl. 2018, 99, 83–92. [Google Scholar] [CrossRef]
- Bellman, R.E.; Zadeh, L.A. Decision-Making in a Fuzzy Environment. Manag. Sci. 1970, 17, 141–164. [Google Scholar] [CrossRef]
- Morente-Molinera, J.A.; Kou, G.; Pang, C.; Cabrerizo, F.J.; Herrera-Viedma, E. An automatic procedure to create fuzzy ontologies from users’ opinions using sentiment analysis procedures and multi-granular fuzzy linguistic modelling methods. Inf. Sci. 2019, 476, 222–238. [Google Scholar] [CrossRef]
- Yager, R.R. On ordered weighted averaging aggregation operators in multicriteria decision-making. IEEE Trans. Syst. Man Cybern. 1988, 18, 183–190. [Google Scholar] [CrossRef]
- Kacprzyk, J.; Fedrizzi, M.; Nurmi, H. Group decision making and consensus under fuzzy preferences and fuzzy majority. Fuzzy Sets Syst. 1992, 4, 21–31. [Google Scholar] [CrossRef]
- Herrera, F.; Herrera-Viedma, E.; Verdegay, J. Direct approach processes in group decision making using linguistic OWA operators. Fuzzy Sets Syst. 1996, 79, 175–190. [Google Scholar] [CrossRef]
- Herrera, F.; Herrera-Viedma, E.; Verdegay, J. A model of consensus in group decision making under linguistic assessments. Fuzzy Sets Syst. 1996, 78, 73–87. [Google Scholar] [CrossRef]
- Dong, Y.; Zhang, H. Multiperson decision making with different preference representation structures: A direct consensus framework and its properties. Knowl.-Based Syst. 2014, 58, 45–57. [Google Scholar] [CrossRef]
- Quesada, F.J.; Palomares, I.; Martínez, L. Using Computing with Words for Managing Non-cooperative Behaviors in Large Scale Group Decision Making. In Granular Computing and Decision-Making: Interactive and Iterative Approaches; Pedrycz, W., Chen, S.M., Eds.; Springer International Publishing: Berlin/Heidelberg, Germany, 2015; pp. 97–121. [Google Scholar]
- Ertugrul, I. Fuzzy Group Decision Making for the Selection of Facility Location. Group Decis. Negot. 2014, 20, 725–740. [Google Scholar] [CrossRef]
- Chen, C.T. Extensions of the TOPSIS for group decision-making under fuzzy environment. Fuzzy Sets Syst. 2000, 114, 1–9. [Google Scholar] [CrossRef]
- Erdoǧmuş, S.; Aras, H.; Koç, E. Evaluation of alternative fuels for residential heating in Turkey using analytic network process (ANP) with group decision-making. Renew. Sustain. Energy Rev. 2006, 10, 269–279. [Google Scholar] [CrossRef]
- Govindan, K.; Sivakumar, R. Green supplier selection and order allocation in a low-carbon paper industry: Integrated multi-criteria heterogeneous decision-making and multi-objective linear programming approaches. Ann. Oper. Res. 2016, 238, 243–276. [Google Scholar] [CrossRef]
- Alonso, S.; Pérez, I.J.; Cabrerizo, F.J.; Herrera-Viedma, E. A linguistic consensus model for web 2.0 communities. Appl. Soft Comput. 2013, 13, 149–157. [Google Scholar] [CrossRef]
- Vahdani, B.; Mousavi, S.M.; Hashemi, H.; Mousakhani, M.; Tavakkoli-Moghaddam, R. A new compromise solution method for fuzzy group decision-making problems with an application to the contractor selection. Eng. Appl. Artif. Intell. 2013, 26, 779–788. [Google Scholar] [CrossRef]
- Jinhu, L.; Jing, L.; Couzin, I.D.; Levin, S.A. Emerging collective behaviors of animal groups. In Proceedings of the 7th World Congress on Intelligent Control and Automation, Chongqing, China, 25–27 June 2008; pp. 1060–1065. [Google Scholar]
- Xu, Y.; Cabrerizo, F.J.; Herrera-Viedma, E. A consensus model for hesitant fuzzy preference relations and its application in water allocation management. Appl. Soft Comput. 2017, 58, 265–284. [Google Scholar] [CrossRef]
- Singh, R.; Benyoucef, L. A consensus based group decision making methodology for strategic selection problems of supply chain coordination. Eng. Appl. Artif. Intell. 2013, 26, 122–134. [Google Scholar] [CrossRef]
- Heradio, R.; Cabrerizo, F.J.; Fernandez-Amoros, D.; Herrera, M.; Herrera-Viedma, E. A fuzzy linguistic model to evaluate the quality of Library 2.0 functionalities. Int. J. Inf. Manag. 2013, 33, 642–654. [Google Scholar] [CrossRef]
- He, T.; Wei, G.; Lu, J.; Wei, C.; Lin, R. Pythagorean 2-tuple linguistic VIKOR method for evaluating human factors in construction project management. Mathematics 2019, 7, 1149. [Google Scholar] [CrossRef]
- Deveci, M.; Özcan, E.; John, R.; Covrig, C.F.; Pamucar, D. A study on offshore wind farm siting criteria using a novel interval-valued fuzzy-rough based Delphi method. J. Environ. Manag. 2020, 270, 110916. [Google Scholar] [CrossRef] [PubMed]
- Pamucar, D.; Deveci, M.; Canıtez, F.; Lukovac, V. Selecting an airport ground access mode using novel fuzzy LBWA-WASPAS-H decision making model. Eng. Appl. Artif. Intell. 2020, 93, 103703. [Google Scholar] [CrossRef]
- Heradio, R.; Fernandez-Amoros, D.; Moral-Munoz, J.A.; Cobo, M.J. Rough Sets: A Bibliometric Analysis from 2014 to 2018. In Proceedings of the 53rd Hawaii International Conference on System Sciences, Maui, HI, USA, 7–10 January 2020; pp. 1747–1756. [Google Scholar]
- Cobo, M.J.; Martínez, M.A.; Gutiérrez-Salcedo, M.; Fujita, H.; Herrera-Viedma, E. 25 years at Knowledge-Based Systems: A bibliometric analysis. Knowl.-Based Syst. 2015, 80, 3–13. [Google Scholar] [CrossRef]
- Moral-Muñoz, J.; Carballo-Costa, L.; Herrera-Viedma, E.; Cobo, M. Production Trends, Collaboration, and Main Topics of the Integrative and Complementary Oncology Research Area: A Bibliometric Analysis. Integr. Cancer Ther. 2019, 18. [Google Scholar] [CrossRef]
- López-Robles, J.; Otegi-Olaso, J.; Porto Gómez, I.; Cobo, M. 30 years of intelligence models in management and business: A bibliometric review. Int. J. Inf. Manag. 2019, 48, 22–38. [Google Scholar] [CrossRef]
- Cobo, M.J.; Lopez-Herrera, A.; Herrera-Viedma, E.; Herrera, F. Science mapping software tools: Review, analysis, and cooperative study among tools. J. Am. Soc. Inf. Sci. Technol. 2011, 62, 1382–1402. [Google Scholar] [CrossRef]
- Heradio, R.; Perez-Morago, H.; Fernandez-Amoros, D.; Cabrerizo, F.J.; Herrera-Viedma, E. A bibliometric analysis of 20 years of research on software product lines. Inf. Softw. Technol. 2016, 72, 1–15. [Google Scholar] [CrossRef]
- Heradio, R.; de la Torre, L.; Galan, D.; Cabrerizo, F.J.; Herrera-Viedma, E.; Dormido, S. Virtual and remote labs in education: A bibliometric analysis. Comput. Educ. 2016, 98, 14–38. [Google Scholar] [CrossRef]
- Fortunato, S.; Bergstrom, C.T.; Börner, K.; Evans, J.A.; Helbing, D.; Milojević, S.; Petersen, A.M.; Radicchi, F.; Sinatra, R.; Uzzi, B.; et al. Science of science. Science 2018, 359, eaao0185. [Google Scholar] [CrossRef]
- Garfield, E. Introducing citation classics. The human side of scientific reports. Curr. Comments 1977, 1, 5–7. [Google Scholar]
- Callon, M.; Courtial, J.; Laville, F. Co-word analysis as a tool for describing the network of interactions between basic and technological research: The case of polymer chemsitry. Scientometrics 1991, 22, 155–205. [Google Scholar] [CrossRef]
- Hirsch, J.E. An index to quantify an individual’s scientific research output. Proc. Natl. Acad. Sci. USA 2005, 102, 16569–16572. [Google Scholar] [CrossRef] [PubMed]
- Coulter, N.; Monarch, I.; Konda, S. Software Engineering As Seen Through Its Research Literature: A Study in Co-word Analysis. J. Am. Soc. Inf. Sci. 1998, 49, 1206–1223. [Google Scholar] [CrossRef]
- Moher, D.; Liberati, A.; Tetzlaff, J.; Altman, D. Preferred reporting items for systematic reviews and meta-analyses: The PRISMA statement. PLoS Med. 2009, 6, 1–6. [Google Scholar] [CrossRef] [PubMed]
- Börner, K.; Chen, C.; Boyack, K.W. Visualizing knowledge domains. Annu. Rev. Inf. Sci. Technol. 2003, 37, 179–255. [Google Scholar] [CrossRef]
- Kitchenham, B.; Charters, S. Guidelines for Performing Systematic Literature Reviews in Software Engineering; Technical Report; Keele University: Keele, UK; University of Durham: Durham, UK, 2007. [Google Scholar]
- Wohlin, C.; Runeson, P.; da Mota Silveira Neto, P.A.; Engström, E.; do Carmo Machado, I.; de Almeida, E.S. On the reliability of mapping studies in software engineering. J. Syst. Softw. 2013, 86, 2594–2610. [Google Scholar] [CrossRef]
- Petersen, K.; Vakkalanka, S.; Kuzniarz, L. Guidelines for conducting systematic mapping studies in software engineering: An update. Inf. Softw. Technol. 2015, 64, 1–18. [Google Scholar] [CrossRef]
- Sugimoto, C.R.; Lariviere, V. Measuring Research: What Everyone Needs to Know; Oxford University Press: Oxford, UK, 2018. [Google Scholar]
- Noyons, E.; Moed, H.; Van Raan, A. Integrating research performance analysis and science mapping. Scientometrics 1999, 46, 591–604. [Google Scholar] [CrossRef]
- Moed, H.F. New developments in the use of citation analysis in research evaluation. Arch. Immunol. Ther. Exp. 2009, 57, 13–18. [Google Scholar] [CrossRef]
- Andrés, A. Measuring Academic Research: How to Undertake a Bibliometric Study; Chandos Publishing: Cambridge, UK, 2009. [Google Scholar]
- Martinez, M.; Herrera, M.; Lopez-Gijon, J.; Herrera-Viedma, E. H-Classics: Characterizing the concept of citation classics through H-index. Scientometrics 2014, 98, 1971–1983. [Google Scholar] [CrossRef]
- Cobo, M.J.; López-Herrera, A.G.; Herrera-Viedma, E.; Herrera, F. An approach for detecting, quantifying, and visualizing the evolution of a research field: A practical application to the Fuzzy Sets Theory field. J. Inf. 2011, 5, 146–166. [Google Scholar] [CrossRef]
- van Eck, N.J.; Waltman, L. How to normalize cooccurrence data? An analysis of some well-known similarity measures. J. Am. Soc. Inf. Sci. Technol. 2009, 60, 1635–1651. [Google Scholar]
- Kandylas, V.; Upham, S.P.; Ungar, L.H. Analyzing Knowledge Communities Using Foreground and Background Clusters. ACM Trans. Knowl. Discov. Data 2010, 4, 1–35. [Google Scholar] [CrossRef]
- Law, J.; Bauin, S.; Courtial, J.P.; Whittaker, J. Policy and the mapping of scientific change: A co-word analysis of research into environmental acidification. Scientometrics 1988, 14, 251–264. [Google Scholar] [CrossRef]
- Turner, W.; Rojouan, F. Evaluating input/output relationships in a regional research network using co-word analysis. Scientometrics 1991, 22, 139–154. [Google Scholar] [CrossRef]
- Cahlik, T. Comparison of the Maps of Science. Scientometrics 2000, 49, 373–387. [Google Scholar] [CrossRef]
- Lotka, A.J. The frequency distribution of scientific productivity. J. Wash. Acad. Sci. 1926, 16, 317–323. [Google Scholar]
- Posner, R.A. Public Intellectuals: A Study of Decline; Harvard University Press: Harvard, MA, USA, 2001. [Google Scholar]
- Bonacich, P. Factoring and weighting approaches to status scores and clique identification. J. Math. Sociol. 1972, 2, 113–120. [Google Scholar] [CrossRef]
- Bradford, S.C. Sources of information on specific subjects. Eng. Illus. Wkly. J. 1934, 137, 85–86. [Google Scholar]
- Egghe, L.; Rousseau, R. Introduction to Informetrics: Quantitative Methods in Library, Documentation and Information Science; Elsevier Science Ltd.: Amsterdam, The Netherlands, 1990. [Google Scholar]
- Zhu, J.; Zhang, S.; Chen, Y.; Zhang, L. A Hierarchical Clustering Approach Based on Three-Dimensional Gray Relational Analysis for Clustering a Large Group of Decision Makers with Double Information. Group Decis. Negot. 2016, 25, 325–354. [Google Scholar] [CrossRef]
- Liu, B.; Shen, Y.; Chen, X.; Chen, Y.; Wang, X. A partial binary tree DEA-DA cyclic classification model for decision makers in complex multi-attribute large-group interval-valued intuitionistic fuzzy decision-making problems. Inf. Fusion 2014, 18, 119–130. [Google Scholar] [CrossRef]
- Zuheros, C.; Martinez-Camara, E.; Herrera-Viedma, E.; Herrera, F. Decision making model based on expert evaluations extracted with sentiment analysis. In Proceedings of the Alan-Turing Conference on Decision Support and Recommender Systems (DSRS-Turing’19), London, UK, 21–22 November 2019. [Google Scholar]
- Koczy, L.T.; Medina, J.; Reformat, M.; Wong, K.W.; Yoon, J.H. Computational Intelligence in Modeling Complex Systems and Solving Complex Problems. Complexity 2019, 2019, 1076–2787. [Google Scholar] [CrossRef]
- Aggarwal, M. Learning of aggregation models in multi criteria decision making. Knowl.-Based Syst. 2017, 119, 1–9. [Google Scholar] [CrossRef]
© 2020 by the authors. Licensee MDPI, Basel, Switzerland. This article is an open access article distributed under the terms and conditions of the Creative Commons Attribution (CC BY) license (http://creativecommons.org/licenses/by/4.0/).