Waste Segregation FMEA Model Integrating Intuitionistic Fuzzy Set and the PAPRIKA Method


1
Department of Business Management, Technical School of Industrial Engineering, University of Castilla-la Mancha, 13071 Ciudad Real, Spain
2
CEG-IST, Instituto Superior Técnico, Universidade de Lisboa, 1649-004 Lisboa, Portugal
Mathematics 2020, 8(8), 1375; https://doi.org/10.3390/math8081375
Submission received: 8 July 2020
/
Revised: 9 August 2020
/
Accepted: 12 August 2020
/
Published: 17 August 2020
(This article belongs to the Special Issue Applications of Fuzzy Optimization and Fuzzy Decision Making)
Abstract
:Segregation is an important step in health care waste management. If done incorrectly, the risk of preventable infections, toxic effects, and injuries to care and non-care staff, waste handlers, patients, visitors, and the community at large, is increased. It also increases the risk of environmental pollution and prevents recyclable waste from being recovered. Despite its importance, it is acknowledged that poor waste segregation occurs in most health care organizations. This study therefore intends to produce, for the first time, a classification of failure modes related to segregation in the Nuclear Medicine Department of a health care organization. This will be done using Failure Mode and Effects Analysis (FMEA), by combining an intuitionistic fuzzy hybrid weighted Euclidean distance operator, and the multicriteria method Potentially All Pairwise RanKings of all possible Alternatives (PAPRIKA). Subjective and objective weights of risk factors were considered simultaneously. The failure modes identified in the top three positions are: improper storage of waste (placing items in the wrong bins), improper labeling of containers, and bad waste management (inappropriate collection periods and bin set-up).
1. Introduction
Health care waste (HCW) has increased considerably over recent decades due to the increase in population, number and size of health care organizations, and also through the use of disposable medical products [1]. Furthermore, in middle and low-income countries, health care waste production has increased considerably due to better access to health services. In higher income countries, the rapid ageing of the population has led to an increase in the use of health services [2,3]. This increase in HCW has been calculated at 330% over the 17-year period analyzed in Korkut [4], although the rise in the number of hospital beds was only 10%.
Waste produced as a result of health care activities carries a greater chance of causing infection and injury than other types of waste. Although only 15% of HCW is considered hazardous material that may be infectious, toxic or radioactive [5], improper segregation of health care waste leads to mixing this waste with non-hazardous waste and so to a much higher quantity of potentially hazardous waste [6]. This increases risk of injury and toxic effects, and means more time, more staff, more steps and higher transport costs in order for it to be properly disposed of [7]. If hazardous waste were immediately separated from other waste, however, the amount of dangerous waste could be reduced by 2–5%, and the risk of infection to the workers handling the waste would also be reduced [8]. A simple training program in segregation could lead to savings of 26.3% [9]. If there is no segregation of hazardous from other waste, all health care waste must be considered infectious [10].
Segregation is therefore an important step in HCW management, and consists of separating out the waste flows depending on their hazardous properties, the type of treatment, and the disposal process to be applied [8]. The World Health Organization (WHO) classifies HCW into the categories shown in Table 1. The recommended way of identifying HCW categories is to classify the waste in bags or bins of suitable materials, coded by colors, properly labeled and each in its proper place as described in WHO [5]; the basic recommendations given by the WHO should also be borne in mind [8]:
- The procedure should always take place at the source where the waste is produced.
- It can be easily applied by all care staff and is uniformly applied throughout the country.
- It is safe and guarantees absence of infectious HCW in the domestic waste flow.
- It should be well known and understood by the care staff of the health care organization.
- It should be regularly monitored to make sure that these recommendations are still being met.
Improper HCW segregation increases the risk of preventable infections, toxic effects and injuries to care and non-care staff, waste handlers, patients, visitors and the community at large. The greatest risk posed by infectious waste is accidental needle stick injuries, which can cause hepatitis B and hepatitis C and HIV infection, and recently, COVID-19. There are however numerous other diseases which can be transmitted by contact with infectious health care waste [10]. To this should be added the increase in risk of environmental pollution by cleaning waste (considered dangerous) from combustion gases. This occurs, for instance, in the process of incinerating phthalates in waste disposal sites for HCW [11] made up of polyvinyl chloride (PVC) [7], which is used in tubes and bags for saline solution, plasma and blood for transfusions, dialysis, surgical gloves, etc. It should be further borne in mind that proper segregation has other advantages when applied to non-hazardous waste, since it can be classified into recyclables, biodegradable waste and non-recyclables. If these waste categories are mixed up when they are produced, it may be impossible to prepare the recyclable waste for recovery [5].
The production and segregation of waste in health care facilities is regulated by international, national, and regional legislation, which states that waste holders are responsible for managing it appropriately, in terms both of segregation and of disposal [9]; it is, however, recognized that poor waste segregation is found in most health care organizations [12]. The problems most commonly found are lack of awareness, of health risks associated with HCW, lack of training and competence in the proper handling of waste, lack of waste management and disposal systems, deficiencies in human and economic resources, and the low priority given to the subject [13].
There are a few studies analyzing health care waste management, among which the following should be especially noted. Gai et al. [14] analyzed the results of introducing national regulations and standards for HCW management in China. It showed that the amount produced by primary health care centers is much higher than that of secondary hospitals, which is attributed to the mixing of general waste with medical waste. The study showed that establishing responsibility for medical waste management in departments and treatment rooms, prior education, and experience in learning, can be major factors that determine the knowledge of care staff in HCW management. There is therefore an urgent need for regular training programs and the proper provision of protective measures to improve the safety at work of cleaning staff. With the same goal, Moreira and Gunther [15] analyzed the improvements stemming from a medical waste management plan in Brazil a year after its introduction; the results showed that although total waste generation had increased by 9.8%, the volume of non-recyclable materials fell by 11%, the volume of recyclable materials rose by 4%, and it was also possible to segregate 7% of organic waste to be used as compost. The rate of infectious waste generation in critical areas fell from 0.021 to 0.018 kg/procedure. It was necessary to change the behavior of the staff through training. Abd El-Salam [16] studied HCW management practices in Egypt, and found that 38.9% was considered hazardous waste, and that segregation did not follow the standards, with the result that a certain amount of medical waste was mixed with domestic waste. Thus, the inappropriate practices detected are: ineffective segregation at source, inappropriate collection methods, unsafe storage of waste, inadequate financial and human resources for proper management, and deficient control of waste disposal, lack of suitable protective equipment, and lack of training and clear lines of responsibility between the departments involved in the management of hospital waste. Ferreira and Teixeira [17] suggested that waste segregation is the main deficiency found in healthcare waste practice in Portugal, while the perceptions of risk to health care staff are related to the difficulties of correctly segregating waste, and the lack of knowledge about the importance of this segregation. Manga et al. [18] assessed HCW management systems in Cameroon, highlighting how problems with the most common waste treatment and disposal methods are: dumping in uncontrolled and poorly designed tips, and incineration with inappropriate measures to address emissions to air, soil and water. They noted that the main challenges in developing countries are segregation, collection, inefficient transport of waste flow, lack of suitable training for staff, deficient collection of waste and separation of infectious and general recyclable waste, deficient legislation, management of infectious waste without adequate personal protection equipment, illegal dumping of waste and disposal together with other municipal waste. Sharma and Gupta [19] analyzed HCW management in India, and found that private hospitals produced more HCW than public ones. They saw a great need for human resources departments in hospitals that can optimally design policies and processes related to the management of health care waste. Korkut [4] indicated that to reduce the amount of HCW in Turkey, the mixture of different types of waste should be prevented, and so should the unnecessary use of hospital materials. But the best way to control the impact of HCW is to ensure that only hazardous waste is sent to treatment, while the rest is treated as household waste. Sahiledengle [20] recognized that the key aspect of an effective management of HCW is segregation of the waste at the point of production, regardless of the treatment and disposal of waste. In this study on segregation practices in Ethiopian hospitals, it can be seen that only half of health workers have good segregation practices, and to improve results, it recommends the allocation of sufficient onsite waste containers and regular training. Likewise, Kumar et al. [21] assessed the effectiveness of an intensive training program in HCW management in Pakistan, showing that training is an effective method to improve knowledge, attitudes and practices among healthcare personnel regarding infectious waste management. Along the same lines is the study by Abdo et al. [22], which showed the improvements provided by an educational program in the management of infectious and sharps waste in Kuwait.
Therefore, all the studies analyzed in different countries emphasize the importance of carrying out a proper segregation at source and that the training of health care staff is essential. This is the specific area in which this research is carried out trying to detect the failure modes that contribute most significantly to segregation problems. Although the number of studies analyzing HCW management in different countries is very important, there are no studies that prioritize segregation failure modes using a widely recognized objective method, Failure Mode and Effects Analysis (FMEA). FMEA has been widely and successfully applied in different typologies of industries and products and with different goals [23,24]. However, traditional FMEA presents numerous problems that hinder its applicability to real problems. Intuitionistic Fuzzy Sets (IFS) has been shown to be a very useful tool in FMEA for dealing with vagueness and uncertainty in the real-world risk assessment process [25].
The main contributions of this research are:
- Determining the failure modes related to environmental problems in the Nuclear Medicine Department of a health care organization with a powerful need to improve segregation of the waste produced.
- Prioritizing the various failure modes.
- Solving deficiencies of traditional FMEA by using, for the first time, a combination of an intuitionistic fuzzy hybrid weighted Euclidean distance operator and the multicriteria method Potentially All Pairwise RanKings of all possible Alternatives (PAPRIKA).
- Using a group of experts characterized by assigning an importance weight to each team member, in accordance with the latest trends in the application of FMEA [26].
- Most studies only consider subjective or objective weights of risk factors. This study considers subjective and objective weights of risk factors simultaneously.
PAPRIKA has been used in place of other multicriteria methods because it involves more judgements than traditional scoring methods, it is simpler to apply, and it reflects the preferences of decision makers more accurately [27]; additionally it is cost-effective, reproducible and it is less cognitively burdensome for decision makers than other methods. Another advantage is that is produce a set of weightings for each decision maker, unlike other MCDM methods, which only give aggregated data. This allows comparisons of weightings between subgroups of participants [28].
The paper is structured as follows. Firstly, it includes a literature review on FMEA and the problems with traditional FMEA, along with multicriteria techniques and intuitionistic fuzzy sets in FMEA. Intuitionistic Fuzzy Failure Model and Effect Analysis methodology is then described. Next, the waste segregation FMEA model integrating Intuitionistic Fuzzy Hybrid Weighted Euclidean Distance Operator and PAPRIKA method applied to the Nuclear Medicine service of a hospital is described. Then the results obtained in the Health Care Organisation are set out. Finally come the discussion, conclusions and references.
2. Literature Review
FMEA is a systematic and analytical technique that combines the technology and experience of experts to identify, analyze and prevent possible failure modes or difficulties in product and process before they take place; the aim is to determine preventive actions in systems, products, processes or services to eliminate or diminish the probability of failures and errors [29]. FMEA is the subjective assessment of risk dependent on expert judgement [30].
Traditional FMEA uses a risk priority number (RPN) to prioritize failure modes in a system, process, design, product or service. In this way, limited company resources can be allocated to the high-risk failure modes. The RPN is obtained by multiplying the probability of occurrence of the failure (O), the severity of the failure (S) and the ability to detect the failure before the impact of the effect occurs (D).
O, S and D are usually measured on a scale comprising 10 levels from 1 to 10, as shown in the example for the probability of Occurrence in Table 2. Failure modes with higher RPN are considered to be of greater importance, and they should be afforded greater attention with respect to risk mitigation.
Traditional FMEA employs a risk priority number (RPN) to prioritize failure modes of a system, process, design, product or service. In this way, limited company resources can be allocated to the high-risk failure modes. The RPN is obtained by multiplying the probability of occurrence of the failure (O), the severity of the failure (S) and the ability to detect the failure before the impact of the effect occurs (D).
Traditional FMEA processes use the following procedure [31]: (1) determine the scope of FMEA analysis; (2) designate FMEA team; (3) identify potential failure modes and effects; (4) determine O, S, and D of each failure mode; (5) calculate the RPN of each failure mode; (6) prioritize the failure modes; (7) report the results of the analysis; and finally (8) calculate the new RPNs when the failure modes have been diminished or eliminated.
Although traditional FMEA has been used successfully since 1960 in different types of companies and real-world examples, the crisp RPN method does, however, have important deficiencies ([1,24,32]):
- O, S and D are considered to have similar importance, which need not be the case in a practical application of the FMEA process.
- Different combinations of O, S and D can generate the same RPN value; however, their hidden risk implications can be totally different. This could cause loss of resources and time, or some high-risk failure modes may go unnoticed.
- O, S and D are difficult to determine precisely by FMEA team members, because a lot of information is often uncertain, vague or expressed in linguistic terms.
- The mathematical formula for calculating RPN is questionable because there is no scientific basis for why O, S and D should be multiplied to obtain RPN.
- The conversion of scores is different for the three risk factors. Thus, while a nonlinear conversion is used between O and the associated ratings, a linear transformation is used for D.
- The RPN only measures risk, but does not take into account the importance or cost of corrective actions in the analysis; Additionally, RPN cannot be used to measure the effectiveness of corrective actions.
- RPNs are not continuous, but rather have many gaps, since many numbers on [1, 1000] cannot be generated from Equation (1). Only 120 of the possible 1000 numbers can be obtained.
- Interdependencies between various failures modes and effects on the same levels and different levels of hierarchical structure of an engineering system are not considered.
- Equation (1) is strongly sensitive to variations in risk factor assessments; that is, a small variation in one rating can lead to a significantly larger effect on the RPN, depending on the values of the other risk factors.
- The RPN elements have many duplicate numbers, for example, 60 RPNs can be formed from 24 different combinations of values of O, S and D.
- The RPN considers only three risk factors related to safety; other important factors such as production cost, quality or other economic aspects are ignored.
- O, S, and D are assessed using discrete ordinal measurement scales. But they are treated as though the numerical operations on them, such as multiplication, were significant. The results are not only meaningless but are in fact misleading.
- The customers’ expectations are not usually taken into account during the risk analysis. Severity rates are generally established from the point of view of the organization and not that of its customers [33].
These deficiencies have led to inefficiencies in the practical applications of traditional FMEA [34]. Therefore, variations on traditional FMEA have been proposed, many of which include Multi-Criteria Decision Making (MCDM) analysis because prioritization of failure modes is a topic that considers multiple risk factors [26].
The literature review carried out by Liu [35] between 1992 and 2016 integrating FMEA with uncertainty theories and multicriteria decision making methods identified 56 contributions which have tried to solve the problems of the traditional FMEA. 16 of these studies used distance-based MCDM methods; 11 used compromise-ranking MCDM methods (that is, VIseKriterijumska Optimizacija I Kompromisno Resenje (VIKOR) and Technique for Order of Preference by Similarity to Ideal Solution (TOPSIS)); three papers used our ranking methods (QUALItative FLEXible (QUALIFLEX), ELimination Et Choice Translating REality (ELECTRE) and Preference Ranking Organisation METHod for Enrichment of Evaluations (PROMETHEE)); and eight used pairwise comparison MCDM methods (Analytic Hierarchy Process (AHP) and Analytic Network Process (ANP)). Eighteen other studies used other MCDM methods (Decision-Making Trial and Evaluation Laboratory (DEMATEL), multiple multi-objective optimization by ratio analysis (MULTIMOORA), COPRAS-G, etc.) and Eight used a hybrid MCDM method in which some of the above methods were combined. In addition, based on the 165 papers that included improvements in the application of FMEA, it can be seen how 85 of them used fuzzy sets, with Dempster–Shafer theory a long way behind with 10 contributions. In addition, the evolution of the publication of articles on improvements in FMEA follows a growing exponential trend, with a considerable increase from 2007.
A more recent literature review by Liu et al. [26] looked at 169 studies on FMEA integrated with different typologies of MCDM to counter the disadvantages of the use of RPN. Most of these studies used the risk factors (O, S, D), although in some cases they also use expected cost, cost of failures, profitability, failure mode importance, and weight of corrective actions, or multiple sub-risk factors for O, S, D. The most commonly used technique for the assignment of weights to the criteria is given directly, followed by expert judgement, the entropy method, fuzzy AHP, AHP, ordered weighting, Data Envelopment Analysis (DEA) and a combination of expert judgement and the entropy method.
In FMEA, the most commonly used MCDM methods, with 30.2% of contributions, are distance-based methods, among which Gray Relational Analysis (GRA) and TOPSIS stand out due to their simplicity and robustness, while DEMATEL, DEA, VIKOR, and Fuzzy Weighted Geometric Mean (FWGM) have also been applied frequently to prioritize failure modes in FMEA.
Among the more recent studies with hybrid models combining FMEA and MCDM is Kutlu and Ekmekçioğlu [36], who used fuzzy AHP to compute the weighting vector of three risk factors, and fuzzy TOPSIS to obtain a ranking for the failure modes. Fuzzy TOPSIS was also used by Mangeli et al. [37] for the same purpose. Wang et al. [38] used interval-valued intuitionistic fuzzy sets (IVIFSs) in an ANP method to obtain weightings for the risk factors, and the IVIF-COPRAS method to rank the failure modes. Bao et al. [39] combined FMEA with fuzzy AHP to assess occupational disease. Fattahi and Khalilzadeh [40] used a fuzzy weighted risk priority number instead of traditional RPN; the weightings of these risk factors were calculated via fuzzy AHP. Fuzzy MULTIMOORA was used to calculate the weight of each failure mode from the criteria time, cost, and profit. Tian et al. [41] used the fuzzy best-worst method to obtain weightings for the risk factors, and fuzzy VIKOR to prioritize the failure modes. Boral et al. [42], on the other hand, used fuzzy AHP to calculate the relative importance of the risk factors, and a modified Fuzzy Multi-Attribute Ideal Real Comparative Analysis (MAIRCA) to rank the failure modes. Zhu et al. [43] combined linguistic neutrosophic numbers, regret theory, and PROMETHEE to obtain the risk priorities of failure modes, taking into account psychological behaviors in the approach of the decision makers. Wang et al. [44] used AHP to calculate the weightings of the risk factors, while the failure modes were prioritised via the closeness coefficient. A wide variety of MCDM’s are therefore used to carry out FMEA analysis. However, in no prior case has PAPRIKA been used, despite its greater precision, and the ease with which it obtains judgements from the decision makers.
Numerous methods have combined fuzzy sets with FMEA to configure fuzzy FMEA; fuzzy sets based on triangular fuzzy numbers is the method most commonly preferred in the studies reviewed by Liu et al. [26] for risk assessment, such as [25,31,33,34,35,45,46,47,48,49,50].
However, the number of contributions using intuitionistic fuzzy sets in the field of FMEA is smaller despite the improvements they represent compared to fuzzy FMEA. Among these are Chang and Cheng [51], which integrated intuitionistic fuzzy sets and DEMATEL to prioritize failure modes in a 0.15 µm DRAM engraving process. Liu et al. [52] used the Intuitionistic Fuzzy Hybrid Weighted Euclidean Distance (IFHWED) operator for the prioritization of failure modes, while the uncertain assessments given by FMEA team members are treated as linguistic terms expressed in Intuitionistic Fuzzy Numbers (IFNs), and the Intuitionistic Fuzzy Weighted Averaging (IFWA) operator is used to add the FMEA team members individual judgements into a group assessment. Liu et al. [53] used the Interval 2-Tuple Hybrid Weighted Distance (ITHWD) operator and assignments provided by the FMEA team members are included using interval 2-tuple linguistic variables; additionally, subjective and objective weights of risk factors have been taken into account in the prioritization of the failure modes that appear in the blood transfusion process. Liu et al. [25] applied the intuitionistic fuzzy hybrid TOPSIS method to prioritize failure modes in super-twisted nematic color. The IFWA operator is employed to aggregate the trials of the FMEA team members. The IFHWED operator is then used to obtain the distances of each failure mode from intuitionistic fuzzy positive ideal and negative ideal solutions. Finally, a relative closeness coefficient is used to compute the risk priority of the failure modes. Both subjective and objective weights of risk factors are taken into account in the study. Guo [54] used linguistic variables and intuitionistic fuzzy numbers to evaluate S, O, and D and transform them into basic probability assignment functions; the Jousselme distance is then used to obtain the weightings of the decision makers. The weighted trial average is obtained and the classical Dempster combination rule is used to combine the modified mass functions. Tooranloo and Ayatollah [55] calculated the weight of risk factors using intuitionistic fuzzy linguistic terms and the IFWA operator to aggregate weighting factors while the failure modes of the quality of internet banking services have been prioritized using the intuitionistic fuzzy TOPSIS technique. Yazdi [56] used the IFHWED operator together with TOPSIS to prioritize hazards occurring in a gas refinery for welding and lamination processes. A heterogeneous group of experts was used to assign a level of confidence or weight to each expert for which AHP has been used. Mirghafoori et al. [57] analyze the quality of the electronic library services in a university library using entropy based on FMEA model in the intuitionistic fuzzy environment. Tooranloo et al. [58] evaluated 16 failure modes related with knowledge management in organizations in an oil and gas company. To do this, they determined the weight of each decision maker using linguistic expressions and intuitionistic fuzzy numbers. Next, an aggregated matrix of intuitionistic fuzzy decisions, based on the decision-makers’ judgements, was generated using the IFWA operator. The weight of each risk factor was calculated using linguistic expressions and intuitionistic fuzzy numbers through the IFWA operator. Since TOPSIS is being used in this intuitionistic environment, it is necessary to determine the intuitionistic fuzzy positive and negative ideal amounts for, then to compute the distance between failure items through positive and negative ideals. This was done using normalized Euclidean distance. Finally, the relative proximity ratio was calculated. The results were that the priority failure modes were identified to be lack of management commitment and leadership. Can [59] ranked corrective-preventive strategies through the combination of FMEA and Weighted Aggregated Sum Product Assessment (WASPAS). Intuitionistic fuzzy risk priority numbers, duration of exposure, occurrence, detection, severity, cost, and system safety factors were used.
Therefore, although the number of contributions that use an intuitionistic fuzzy set in FMEA is very limited, it has been successfully applied to different fields with the use of different distance operators. However, in no case has it been applied with the aim of prioritizing segregation failure modes in a health care organization. In the specific area of HCW, only the research by Liu et al. [60] used fuzzy set theory and VIKOR method selection for the appropriate treatment method in HCW. Linguistic variables are used to assign the ratings and weights to the criteria, while the Ordered Weighted Averaging (OWA) operator is used to aggregate individual opinions of decision makers into a group assessment.
3. Intuitionistic Fuzzy Failure Model and Effect Analysis Methodology
A risk classification procedure was designed using risk analysis techniques together with multicriteria techniques, and an FMEA methodology applied using the Intuitionistic Fuzzy Hybrid Weighted Euclidean Distance (IFHWED) Operator and the multicriteria method PAPRIKA.
This methodology has the advantage that when using linguistic terms for the assignment of values to the risk factors, these assessments are much more precise. For this purpose, the Intuitionistic Fuzzy Set (IFS) concept will be used. IFS was introduced by Atanassov [61] considering a generalization of fuzzy and more exhaustive elements than fuzzy conventional sets, which only have a membership function [62]; in addition, they allow the hesitation and the indeterminacy that are generally found in decision-making processes to be considered, something that is not taken into account in the fuzzy set [63]. They have a more logical mathematical framework to deal with inaccurate facts or incomplete information [55]. IFSs are characterized by a membership function, a non-membership function, and an indeterminacy function. Therefore, IFS is recognized as a suitable approach to deal with the ambiguities and uncertainties present in the realization of FMEA [51].
The methodology set out below allows the limitations of the traditional FMEA to be overcome, and its effectiveness to be improved. The uncertainty in the assessments of the team in the FMEA study is handled using linguistic terms expressed with intuitionistic fuzzy numbers.
If X is considered a fixed set, an IFS S in X is introduced in accordance with Equation (2) [35]:
where is a membership function and a non-membership function and is satisfied. Furthermore, is called the hesitation degree of and represents the degree of uncertainty or hesitancy of x to S, satisfying [64].
Whether is higher or lower is an indication that x is more or less uncertain respectively. If and are continuous functions, IFS regresses to traditional fuzzy sets when , while when is equal to 0 or 1, it is a crisp set.
is known as an Intuitionistic Fuzzy Number (IFN) and can be denoted by where , , and satisfying . and are respectively the largest and smallest IFNs.
Most FMEA methods consider only objective or subjective risk weights independently. To overcome this problem, objective and subjective weightings of risk factors are considered simultaneously in this methodology, as suggested in Liu et al. [25] and Liu [35]. Subjective weights are evaluated by a decision-making group using the linguistic terms shown in Table 4 [56]. Objective weights are determined using the ordered weights of the risk factors, which are derived from the method based on the normal distribution.
The decision group must provide individual assessments of failure modes using the linguistic terms defined by IFNs.
The Intuitionistic Fuzzy Distance (IFD) between two IFNs, α1 = (, ) and α2 = (, ) will be defined as shown in Equation (6) [25].
There are assumed to be l members in the decision group responsible for the assessment of m failure modes with respect to n risk factors. Each member of the decision group will have an assigned weighting (k = 1, 2, …, l) satisfying to reflect the relative importance of each member of the group.
Let , ) be an IFN provided by each member of the group to assess each failure mode with respect to each risk factor, and is the subjective weighting of each risk factor given by each member of the decision group. The Intuitionistic Fuzzy Weighted Averaging (IFWA) operator (see Equations (7) and (8)) will be used to aggregate the judgements and derive a consensus judgement stemming from the decision group [35].
where are the assessments of the group comprising l members for the failure modes with respect to the risk factors, and are the subjective weightings of the group for the risk factors of the l members of the group.
The subjective weightings of the risk factors will be determined using the subjective weightings of the group obtained from Equation (8). These weightings will be normalised using Equation (9) [35].
where is the hesitation degree, and .
The objective weightings of the risk factors were determined using the normal distribution-based method developed by Xu [66].
Next, reference series for risk factors should be established. These reference series should be the optimal level of all risk factors for failure modes in FMEA. When FMEA is being performed, the smaller score represents a lower risk, therefore, the minimum value can be used as a reference series. This can be expressed as shown in Equation (10).
The IFHWED operator is used to calculate the distances between the reference series and the aggregated results (see Equation (11)).
where is any permutation of (1, 2,…, n) such that and .
Next, all failure modes are classified in descending order of the IFHWEDs obtained. The greater distance implies a higher overall risk of failure mode.
The relative weights of the decision group members were provided in the form of non-fuzzy values because they are relatively easy to determine in the study. However, other methods, such as fuzzy AHP or the Delphi method, could be used. The linguistic terms included in Table 4 can also be applied and Equation (9) can be used to calculate them.
4. Waste Segregation FMEA Model Integrating Intuitionistic Fuzzy Sets and the PAPRIKA Method
The application of the methodology outlined in the previous section to prioritizing failure modes related to HCW segregation problems in a Hospital is shown below.
From the Central Services of the Health Service of Castilla-La Mancha (Spain) there is a great concern for reducing the amount of waste generated in a hospital. To do this, they consider the need to improve the segregation of hospital waste. For this study, the Nuclear Medicine Service is selected as a pilot unit in which to analyze the problems and solutions to be proposed. The choice of this service instead of others is because it generates a large amount of waste (it is the 11th service in terms of annual waste generation of the 41 into which the hospital is organized) and, in addition, it can generate waste of all the different possible typologies such as [67]:
- Group I: general, no risk.
- Group II: sanitary, assimilated to urban.
- Group III: sanitary, potentially infectious.
- Group IV: bodies and human remains.
- Group V: dangerous chemical waste.
- Group VI: cytotoxic with carcinogenic, mutagenic and teratogenic risk.
- Group VII: radioactive.
Radioactive waste is low and medium activity, does not generate heat and has a relatively short radioactive life (about 30 years as a limit). It is mainly about operating material such as gloves, rags, syringes, filters, etc.
The goal is to extend the improvement plans and actions to the other areas, units and services of the hospital.
The flow chart with the steps that have been followed in this investigation are shown in Figure 1.
In order to identify the failure modes related to waste segregation, surveys were carried out with personnel who work in the Nuclear Medicine Department: the head of department, a nuclear medicine specialist doctor, service supervisor, senior technicians, nurses and administrative assistants and caretakers. The results of the survey were that 60% of respondents believed that the service did not have adequate containers for type II waste, 62.5% of care and non-care staff did not perform correct segregation of type II waste, 56.25% of the respondents do not know the maximum time that elapses in the collection of waste, 93.75% of the staff do not know the weight thresholds (minimum and maximum) per container, 87.5% believe that there is no documentation with the action procedures in waste management, and 50% consider that the presence of intermediate waste containers in the department is necessary. From the complete results obtained from the survey, the failure modes shown in Table 5 were established.
Visual documents on non-conformities were also collected, such as, for example, Figure 2 shows how tweezers had been disposed of in a container for storing needles, the correct action being sterilization of the tweezers.
The judgements necessary for the application of this methodology were made by two Decision Makers (). One of them has had the role of Deputy Director of Technical Services of the Hospital, whose responsibility included the Environment Area of the Hospital. The other Decision Maker is an external expert, although he is knowledgeable about the environmental problems of the Hospital. Like [56], the experts used in the allocation of occurrence, severity and detectability in this research have very different knowledge and experiences in the area analyzed, being very positive for the allocation process. Table 6 shows the judgements given by both DMs evaluating the different failure modes described with respect to the criteria: occurrence, severity and detectability. A number of different linguistic term scales were gathered from the literature [35,52,55,68], to provide linguistic terms for assessing subjective weights of risk factors and for assessing failure modes. The linguistic scales were chosen from among the different options available by means of a questionnaire given to the decision makers about their preferences. The scales chosen were the nine-point rating scale shown in Table 3, and the same scale was used for the three risk criteria to avoid confusion in the assessment of failure modes, and the scale in Table 4. The results of the aggregation of the judgements using Equations (7) and (8) are shown in Table 7. A weight of 0.25 has been assigned to and 0.75 to .
Applying the method based on the normal distribution of Xu [66], the objective weights of the risk factors are obtained. For this, the Ordered Weighted Averaging (OWA) operator is used to determine their associated weightings. The OWA operator has been used in many applications, especially in environmental problems [60,69]. This operator has the advantage that the input data are rearranged in descending order, and the weights associated with the OWA operator are the weights of the ordered positions of the input data rather than of the input data itself [60].
If is the mean of the collection of 1, 2, ..., n, and ( is the standard deviation of the collection 1, 2, ..., n and both can be calculated from the expressions:
Then the weight vector of the OWA operator can be calculated from the equation [66]:
The order of the criteria, Occurrence (O), Severity (S) and Detectability (D), and thus the weighting assigned to each of them, was decided by one of the decision makers used in the study. Therefore, for n = 3 we obtain:
Therefore, the vector of objective weightings obtained is the following:
Next, the PAPRIKA multicriteria technique [27] will be used to obtain the subjective weightings of the risk factors. PAPRIKA has been successfully applied in numerous real-world problems particularly related to the health care field, for example in patient prioritization [70,71], health technology prioritization [28,72], disease classification and diagnosis [73], disease prioritization for R&D [74], assessment of non-clinical hospital services [75], to analyze preferences for physical activity attributes in adults with chronic knee pain [76], or to value health states worse than dead [77].
PAPRIKA has been used, implemented through 1000minds software, since, in real time and very efficiently, it tracks all the potentially millions of pair rankings of the options made by decision makers. Furthermore, unlike other methods based on ratio measurements of the decision makers’ preferences, for example the ratio-scale measurement of 1 to 9 used by AHP, PAPRIKA selects an option from just two possibilities. This is a much simpler and more natural selection method [28]. All this provides great confidence in the answers provided by the decision makers [78].
PAPRIKA allows a ranking of alternatives to be obtained by comparing pairs of all potentially non-dominated pairs with respect to all possible alternatives in the model. A non-dominated pair is a pair of alternatives in which one of them has a higher rank in at least one criterion and a lower rank in at least one other criterion, and therefore a judgement of the decision maker is necessary for the alternatives to be classified by pairwise comparisons. On the other hand, a dominated pair is a pair of alternatives in which one of them has a higher rank category in at least one criterion and none of a lower rank in the other criterion, so it is not necessary to make the comparison. The number of pairwise comparisons is minimized by a method that identifies all pairs classified as evident within the explicit pair ranking [27].
The steps to be followed to apply this technique are:
- Definition of the criteria and the levels of each criterion.
- Definition of possible alternatives and obtaining of total scores.
- Identification of undominated pairs.
- Classification of non-dominated pairs and identification of all implicitly ranked pairs.
- Obtaining the global ranking of alternatives.
PAPRIKA starts out by identifying all the pairs of options defined for two criteria simultaneously, and which involve compensation. Each decision maker must choose in random order between pairs of options. Each time the decision maker classifies a pair of options, all the remaining hypothetical options that could be classified by pairs by transitivity are identified and eliminated. For example, if a decision maker prefers A to B, and then B to C, then by transitivity, A has priority over C. This procedure guarantees that the number of questions put to the decision maker is minimized. However, the decision maker classifies by pairs all the alternatives differentiated in two criteria simultaneously, both explicitly and implicitly, that is, by transitivity. The number of questions put to the decision maker depends on the number of criteria and on the levels associated to each criterion. As an example, with four criteria and three or four levels per criterion, approximately 30 judgements are required [78]. Some questions are repeated as an internal consistency check [79]. From the classifications by explicit pairs, 1000Minds using linear programming, which can be consulted in Hansen and Ombler [27], to calculate the weightings of the criteria. The decision makers’ weights are averaged to obtain mean weights and standard deviations for the decision makers as a set. Significant differences in the mean weights for the criteria (p < 0.05) are assessed by variance analysis for the normally distributed variables, and by the Kruskal-Wallis rank test when the normality criterion was not satisfied [79].
According to [79], the global values for risk , and value , are calculated from Equations (15) and (16) respectively. For each alternative j, the normalised means of the weightings for each criterion i, are multiplied by the performance scores for the risk Ri,j, and value-based criteria Vi,j.
Comparing two of the methods most widely used in the literature, AHP and TOPSIS, and one of the newly-created MCDM, the Characteristic Objects METhod (COMET) [80] with PAPRIKA, shows the following. AHP uses a hierarchical, multilevel structure to conceptualize how the alternatives can achieve the main goal. The weights of the criteria are established based on pairwise comparisons. Pairwise comparisons are used at each level to provide estimates for the weights of the criteria and also for the alternatives, resulting in a pairwise comparison matrix. The criteria weights are determined by the principal eigenvector method, and a consistency ratio is defined to assess the consistency of judgements. TOPSIS uses a rational, intuitive logic, which allows the best alternatives to be sought for each criterion, with a simple mathematical formula which takes into account the values of the weights of each criterion in the calculation process, as well as whether the criterion is a cost or a benefit. The order of the alternatives is calculated from the geometric distance to the positive and negative ideal solutions. However, it does not have a specific procedure for obtaining the weightings of the criteria, and so many studies use AHP to obtain these weightings, causing similar problems to AHP.
AHP and TOPSIS have the problem that they may undergo all the types of rank reversal caused by change of local priorities before and after an alternative is added or deleted. In the case of TOPSIS this is due to the calculation of the norm and the choice of the ideal positive and negative solutions. Although modifications have been introduced into these techniques to avoid this rank reversal, the phenomenon has not been perfectly resolved [81] and it may be considered as the main flaw in most MCDM methods [82]. COMET, on the other hand, completely avoids rank reversal because there is no comparison between the decision variants assessed. It also allows a relatively simple identification of linear and non-linear decision-maker functions, increasing its applicability to both linear and non-linear problems [83]. This method accounts for correlation between the components of an MCDM function, and comparisons between the characteristic objects are simpler than comparisons between alternatives [80]. Thus, when a decision maker compares two characteristic objects, the more preferred is given one point, and the second gets nil point, whereas if the preferences are equal, both objects are awarded half a point. After the final object comparison, the complete fuzzy rule base is obtained. The preference of alternative is calculated as the sum of the product of all activated rules, their degrees of fulfilment, and their preference values.
In PAPRIKA, weightings between criteria are obtained by comparing the preference or equality of one criterion relative to another, while in COMET the comparison is carried out between characteristic objects (relative to all criteria at once), choosing the best each time. The accuracy obtained with COMET and PAPRIKA may therefore be considered better than with AHP and TOPSIS, which are based on the use of a scale from 1 to 9, and its inverse, and so the comparison requires a greater number of options than COMET and PAPRIKA. An example of use described in Sałabun and Piegat [82] shows that COMET has a lower root mean square error (RMSE) and a higher ratio of correct answers than AHP and TOPSIS, and therefore gives greater accuracy.
Furthermore, the comparison process used by both COMET and PAPRIKA leads to low biased results, since participants can express their true preferences more freely, and in both cases, software is needed to apply it. AHP, PAPRIKA and COMET all come with very intuitive software for applying the method, but only in the case of COMET is the associated software capable of calculating the behavior of the arithmetic intervals, hesitant fuzzy sets and intuitionistic fuzzy sets [84]. In this regard, COMET is an intuitionistic approach, unlike the other methods previously mentioned.
In the case of PAPRIKA, the number of further necessary questions is reduced dynamically, as a function of the decisions already made, by eliminating the dominated alternatives. Although any number of criteria and scale levels can be included, as their number increases the number of potential alternatives (combinations) increases exponentially. In the case of COMET, the number of required questions increases polynomially relative to the number of characteristic objects; even in the most optimistic case, which assumes that each linguistic variable will have two characteristic values, the number of questions increases exponentially with the number of criteria [84]; however, by creating a hierarchical structure, the number of pairwise comparisons in the COMET technique is considerably reduced.
The main advantage of the PAPRIKA methodology is that the criteria weights can be constructed without explicitly asking decision makers about them. This technique also provides information on the value functions related to the different criteria, which requires greater effort by the analysts and decision makers than with the other methods [85]. Furthermore, care must be taken to guarantee that the number of sets of options used (combining the various criteria and scale levels) gives sufficient data for the statistical analysis.
The results obtained with the help of the 1000Minds software are shown below, taking into account the assessments of four decision makers who constitute a heterogeneous group: two of them belong to the Hospital staff, one of them being in charge of the Hospital’s Environment service, and the other two are university experts. Decision makers are identified as DM1 to DM4. The preference values obtained by the DMi are shown in Table 8. Three categories or scale levels have been considered in each risk criterion. The ranking of the criteria or risk factors is shown in Table 9. Table 10 shows the relative importance between the criteria in a pairwise comparison. The weights of the risk criteria or normalized criteria and the scores of each criterion (means) are shown in Table 11.
5. Results
was established following the recommendation of Liu [35]. Regarding the reference series for the risk factors, considering that the lower the score, the lower the risk, the minimum value can be used, thus, taking .,. Once the reference series of the risk factors, the objective and subjective weightings of the risk factors were obtained, the calculation of the distances between the reference series and the aggregated results using the IFHWED operator, defined in Equation (11), were established. Table 12 shows the final ranking of failure modes to be treated in the Nuclear Medicine Department of the hospital. It can be seen that the failure mode ranked first is waste mismanagement, followed by incorrect labeling and incorrect storage of the waste.
The sensitivity analysis gives the results shown in Table 13. As can be seen, the methodology is robust since there is only an inversion in the classification of the failure modes 4 and 6, which are in 5th and 6th positions, in the case of and . The same full ranking of failure modes was maintained for the remaining cases.
6. Validation
The methodology described was validated in two ways. Firstly, linguistic terms are used to assess the subjective weights of risk factors, rather than PAPRIKA. Secondly, using fuzzy TOPSIS, a recognized and widely used technique, which has also been used successfully in various studies where it is combined with FMEA.
To validate the proposed methodology, the linguistic terms in Table 4 were used to assess the subjective weights of risk factors, rather than PAPRIKA. Two DMs were used for this, the same ones who provided the linguistic assessments of the failure modes and who also provided the judgements in the PAPRIKA method. The resulting judgements are shown in Table 14.
To determine the subjective weightings of the risk factors, the subjective weightings of the group obtained from Equation (8), will be used.
These weights are to be normalized according to Equation (8), giving the weights:
Once the reference series of the risk factors were established, the calculation of the distances between the reference series and the aggregated results using the IFHWED operator, defined in Equation (11), the final ranking of failure modes is obtained (see Table 15). φ = 0.6 was used again in this case, as with PAPRIKA.
The sensitivity analysis gives the results shown in Table 16. The methodology can be seen to be robust, since the same complete ranking of failure modes was maintained for all the assessed values of .
It can be seen that the ranking using PAPRIKA or linguistic terms to evaluate the subjective weights of risk factors is the same, and there is no change in ranking of the failure modes between the two methodologies. The differences between the values obtained with linguistic terms and those from PAPRIKA are 0.289% on average. Five values are found to be slightly higher with PAPRIKA compared to linguistic terms, and one value is the same with the two methodologies. The valuations with PAPRIKA are therefore very slightly higher than when only IFHWED and linguistic terms are used. Thus, PAPRIKA slightly increases the risk assessment in the failure modes compared to IFHWED and linguistic terms.
The methodology that combines IFHWED and PAPRIKA with a methodology that includes the weightings obtained via fuzzy linguistic terms and fuzzy TOPSIS was also checked, to obtain the classification of the failure modes. The fuzzy linguistic scale for weightings traditionally used in fuzzy TOPSIS is shown in Table 17 (see [36]). The linguistic variables for the ratings are shown in Table 18. Using the linguistic variables from Table 17 on the risk factors, from the two decision makers previously used in this study, the values shown in Table 19 are obtained. A weight of 0.25 is assigned to and 0.75 to as in the methodology described in our study. The weighted normalised decision matrix is shown in Table 20.
The distances and of each weighted alternative obtained from the fuzzy positive ideal solution (FPIS) and the farthest distance from a fuzzy negative ideal solution (FNIS) are shown in Table 21. The Table also includes the Closeness Coefficient (CC) of each failure mode, and the resulting ranking.
If the ranking obtained with the methodology described here is compared with that found using fuzzy TOPSIS, it is seen that the rankings is similar. The only change is between failure modes 8 and 9, in 4th and 8th position.
Since this difference exists in the classification of alternatives, the most frequently-used measures of the analysis of the ranking similarity in decision-making problems were applied: Spearman, Kendall and Goodman-Kruskal coefficients [86,87,88]. Spearman’s coefficient, , is interpreted as a percentage of the rank variance of one variable, explained by the other variable [88]. Equation (17) was used to calculate Spearman’s coefficient, where is the difference between the rankings obtained via the MCDM methods and the number of elements in the ranking. The Kendall, τ, and Goodman-Kruskal, G, coefficients are calculated from Equations (18) and (19) respectively, where is the number of compatible pairs, the number of non-compliant pairs, and the number of all pairs. These coefficients represent the difference between the probability that the variables compared will be in the same order for both variables and the probability that they will be in the opposite order.
The values obtained for these coefficients are: ; therefore, Spearman’s coefficient suggests strong or high association, as it is between 0.7 and 0.9. As expected, Spearman’s coefficient is greater than the other coefficients, since the latter are more sensitive to error, or discrepancies in the data. The Kendall and Goodman-Kruskal coefficients show some positive relation, in that knowing the order of the independent variable assists in predicting the order of the dependent variable, but there is not high concordance. However, the difference at the top should be more significant than an error at the bottom of the ranking. To solve this problem, therefore, the Value of Similarity (WS) coefficient suggested in Sałabun and Urbaniak [88] is also calculated. This WS coefficient is strongly related to the difference between two rankings at particular positions, and the top of the ranking has a more significant influence on similarity than the bottom. Equation (20) is used to calculate the WS coefficient.
where N is a ranking length, and are defined as the positions in the ranking of the ith element in ranking x and ranking y respectively. If the WS coefficient is less than 0.234, then the similarity is low, while if the value is higher than 0.808, then the similarity is high [88]. In the case checked, WS = 0.934, and therefore the similarity is high. This is because of the similar in the rankings with only two variations of the nine alternatives, and because the three top positions in the ranking do not undergo change.
Thus, the proposed methodology using FMEA in the segregation of health care waste is considered to be validated by two different methodologies.
7. Discussion
Although there are many papers analyzing health waste management problems in different countries, especially in middle and low-income countries, they are descriptive studies at the country or wide geographical area level, so they do not focus on the problems of a specific hospital. However, as can be seen in this study, health waste management problems also exist in high-income countries. Although the problems may have different failure modes in middle and low-income countries than in high income countries, the results cause similar risks for health personnel and other staff working in the health care organization, for patients and visitors, and for the environment. Therefore, it should be analyzed in detail not only in low-income countries where it seems that the studies are focused on this topic, but in all countries.
In addition, it should be noted that in no case studied in the literature on health waste management have risk assessment techniques such as FMEA been used. Such techniques are, however, not uncommon in risk assessment in other areas such as assessing machinery and device failures, improving the decision process of the emergency department of a hospital, evaluating safety risks in organizations, evaluating options of the production process, improving the process of purchasing in a hospital, etc.
Therefore, this study focuses on a higher level of precision than the current literature, although at the hospital level studied, improvement actions may be strategic.
The use of the intuitionistic fuzzy FMEA methodology, in addition to solving the problems derived from using classical FMEA, prioritizes failure modes in the segregation of health care waste in a very practical way, always based on expert judgement. By using linguistic terms, the significance of each failure mode can be readily established, and when weighting each decision maker, a reliability can be assigned to each judgement issued, which is highly advisable when, for example, decision makers have different levels of knowledge about the specific facility being assessed.
The goal of the hospital at the first stage was to maintain the number of containers used, but to obtain a weight per container higher than that achieved up to that point, since that would be a hallmark of better segregation and compliance with the regulations regarding minimum weights per container (since it had been observed that containers have sometimes been collected without meeting the stipulated minimums). Once this first step was taken, the second part consisted of reducing the number of containers and the total weight. For this, the amount of waste (kg) and the number of containers generated by the Nuclear Medicine Departments were monitored on a monthly basis.
In view of the prioritization of the failure modes obtained, the incorrectness in the placing of material in the containers is in first place. To address this, especially regarding hazardous waste, a poka-yoke system was designed. Poka-yoke are systems originally devised at Toyota, to avoid mistakes in the operation of a system. This is a sticker (see Figure 3) to be placed on the lids of the 3-litre containers. This sticker will serve a dual purpose: on the one hand, it will serve to remind the user of what parts to insert for correct segregation and, on the other, it will prevent the erroneous insertion of certain objects (for example, syringes). Figure 3a) shows the profiles of the lid of the 3-litre container (red), the thickness of a poorly segregated syringe (blue) and the final design of a sticker (green). Although the sticker can remain attached to the container when it is collected, it has a strategically placed tab to enable it to be removed at any time.
In addition, an informative brochure has been produced to make the care staff of the Nuclear Medicine Department aware of the importance of a good segregation and the improvement that it would mean for their working conditions and risk reduction. The brochure consists of 24 sides (in Spanish); Attempts have been made, in a casual way, to make the user aware of the problems in their environment and to visualize different correct and incorrect segregation actions. As an example, two pages of the brochure are shown (see Figure 4 and Figure 5 with the text in Spanish). Information about the collection time, its location and cleaning times has also been included in the brochure. Posters have also been created. The brochure was distributed digitally and on paper, while the posters are put up at the Nuclear Medicine Department, to provide information for both workers and patients. The information campaign has been reinforced with a series of training talks at the department. There is also an intention to certify the research, so the Quality Unit would look at the possibility of offering these talks, not as a mere instrument of information, but also for training.
Failure mode 5, which occupies the last position in the ranking, despite being one of the problems that is clearest according to the view of human resources, could be solved with a proper relocation of containers. Although there is a lack of space for the placement of new containers, these would not be necessary if the healthcare staff make proper use of those that are currently available.
Since this research began, changes have been observed in the worker’s culture in this regard, and thus, the Environmental Technician announced that, after obtaining the latest data on recycling and collection of waste material in the department, a significant decrease had been seen in waste generated.
8. Conclusions
Segregation is recognized as an important step in health care waste management; however, it is also observed that poor waste segregation exists in health care organizations in a generalized way, with the lack of awareness about related health risks with health care waste, the lack of education and training in proper waste management, the absence of waste management and disposal systems, insufficient human and economic resources, and the low priority assigned to the topic being perceived as the most common problems.
Incorrect segregation can affect hospital care staff, but also non-care staff, for example, facility maintenance or cleaning personnel, waste handlers, and patients and companions, until it becomes a public health problem. It also has implications for the environment and reduces the possible amount of waste to be recycled. In addition, it increases the amount of hazardous waste generated, since the wrong mix means that all mixed waste has to be treated as hazardous. However, despite the importance of segregation, the number of studies that prioritize the failure modes related to segregation is non-existent, with only descriptive studies associated with countries being found. However, the literature does show multiple examples of using FMEA for risk prioritization in other areas.
Therefore, this study has designed a prioritization of failure modes related to segregation in the Nuclear Medicine Department of a hospital. For this, an intuitive fuzzy FMEA methodology was used to avoid the many problems presented by crisp FMEA. PAPRIKA has been used to obtain the subjective risk criteria weights, while the distribution-based method has been used to calculate the objective weights.
The methodology described has been validated in two ways: using linguistic terms, rather than PAPRIKA, to assess the subjective weights of risk factors, and with fuzzy TOPSIS. In the first case the ranking is the same, and in the second, there is only one change between the classification of two failure modes. WS coefficient is used to calculate the level of similarity between the models, and WS = 0.934, and therefore the similarity is high. A sensitivity analysis was also carried out to show the robustness of the methodology.
The proposed methodology can help other health care organizations to classify their failure modes relative to health care waste management and focus improvement efforts on the most critical failure modes. In addition, it can be seen how, by initiating a study in the Hospital on the problem of segregation, the staff becomes more aware and the segregation data of the department analyzed improves.
As future research, the aim is to incorporate additional risk factors to the O, S, and D considered in this study and use them to build a hierarchical structure that contributes to a better prioritization of failures modes. Furthermore, PAPRIKA has not been tested on the decision-making paradox, where different decision-making methods can yield different results, when applied to exactly the same decision problem and data, but it could exhibit this phenomenon; therefore, other techniques such as Measuring Attractiveness by a Categorical Based Evaluation Technique (MACBETH) or the more up-to-date COMET method, could be used to assign subjective weights to said risk criteria and sub-criteria.
Also, future research will use methods different from the OWA operator to determine the objective weights and compare the results obtained.
The research described was performed using the results of a survey carried out with personnel who work in the Nuclear Medicine Department of a specific Hospital; due to the subjective nature of surveys, it is proposed that the failure modes related to health care segregation be generated using data from government sources or national private agencies to make the results more objective. In this way, the failure modes generated will affect not just the care services at one hospital, but will also be more generally characteristic of behavior throughout the country.
Funding
This research was funded by the University of Castilla-La Mancha and the European Union through the European Regional Development Fund to the Predictive Analysis Laboratory (PREDILAB) group (2020-GRIN-28770).
Conflicts of Interest
The author declares no conflict of interest.
References
- Liu, H.C.; Liu, L.; Liu, N. Risk evaluation approaches in failure mode and effects analysis: A literature review. Expert Syst. Appl. 2013, 40, 828–838. [Google Scholar] [CrossRef]
- Minoglou, M.; Gerassimidou, S.; Komilis, D. Healthcare Waste Generation Worldwide and Its Dependence on Socio-Economic and Environmental Factors. Sustainability 2017, 9, 220. [Google Scholar] [CrossRef] [Green Version]
- Vaccari, M.; Tudor, T.; Perteghella, A. Costs associated with the management of waste from healthcare facilities: An analysis at national and site level. Waste Manag. Res. 2018, 36, 39–47. [Google Scholar] [CrossRef] [PubMed]
- Korkut, E.N. Estimations and analysis of medical waste amounts in the city of Istanbul and proposing a new approach for the estimation of future medical waste amounts. Waste Manag. 2018, 81, 168–176. [Google Scholar] [CrossRef] [PubMed]
- Safe Management of Wastes from Health-Care Activities, 2nd ed.; Chartier, Y.; Emmanuel, J.; Pieper, U.; Prüss, A.; Rushbrook, P.; Stringer, R.; Townend, W.; Wilburn, S.; Zghondi, R. (Eds.) World Health Organization: Geneva, Switzerland, 2014; Available online: https://apps.who.int/iris/bitstream/handle/10665/85349/9789241548564_eng.pdf;jsessionid=DB89B73BACE6CA03F815F758C29D4726?sequence=1 (accessed on 26 June 2020).
- Kanbar, A.; Abdessater, M.; Dabal, C.; El Khoury, J.; Akl, H.; El Hachem, C.; Halabi, R.; Elias, S.; Boustany, J.; El Khoury, R. Health-care waste segregation among surgical team groups: A new assessment method. Perioper. Care Oper. Room Manag. 2020, 20. [Google Scholar] [CrossRef]
- Thornton, J.; McCally, M.; Orris, P.; Weinberg, J. Hospitals and plastics. Dioxin prevention and medical waste incinerators. Public Health Rep. 1996, 111, 298–313. [Google Scholar] [PubMed]
- Preparation of National Health-Care Waste Management Plans in Sub-Saharan Countries Guidance Manual; World Health Organization: Geneva, Switzerland, 2005; Available online: https://apps.who.int/iris/bitstream/handle/10665/43118/924154662X.pdf (accessed on 26 June 2020).
- Mosquera, M.; Andrés-Prado, M.J.; Rodríguez-Caravaca, G.; Latasa, P.; Mosquera, M.E.G. Evaluation of an education and training intervention to reduce health care waste in a tertiary hospital in Spain. Am. J. Infect. Control 2014, 42, 894–897. [Google Scholar] [CrossRef]
- Management of Solid Health-Care Waste at Primary Health-Care Centres: A Decision-Making Guide; World Health Organization: Geneva, Switzerland, 2005; Available online: https://apps.who.int/iris/handle/10665/43123 (accessed on 22 June 2020).
- Libro Verde. Cuestiones Medioambientales Relacionadas con el PVC; Comisión de las Comunidades Europeas: Bruselas, Belgium, 26 July 2000; Available online: https://ec.europa.eu/environment/waste/pvc/pdf/es.pdf (accessed on 16 June 2020).
- Mbongwe, B.; Mmereki, B.T.; Magashula, A. Healthcare waste management: Current practices in selected healthcare facilities, Botswana. Waste Manag. 2008, 28, 226–233. [Google Scholar] [CrossRef]
- Health-Care Waste; World Health Organization: Geneva, Switzerland, 2018; Available online: https://www.who.int/news-room/fact-sheets/detail/health-care-waste (accessed on 17 June 2020).
- Gai, R.Y.; Xu, L.Z.; Li, H.J.; Zhou, C.C.; He, J.J.; Shirayama, Y.; Tang, W.; Kuroiwa, C. Investigation of health care waste management in Binzhou District, China. Waste Manag. 2010, 30, 246–250. [Google Scholar]
- Moreira, A.M.; Gunther, W.M. Assessment of medical waste management at a primary health-care center in Sao Paulo, Brazil. Waste Manag. 2013, 33, 162–167. [Google Scholar] [CrossRef]
- Abd El-Salam, M.M. Hospital waste management in El-Beheira Governorate, Egypt. J. Environ. Manag. 2010, 91, 618–629. [Google Scholar] [CrossRef] [PubMed]
- Ferreira, V.; Teixeira, M.R. Healthcare waste management practices and risk perceptions: Findings from hospitals in the Algarve region, Portugal. Waste Manag. 2010, 30, 2657–2663. [Google Scholar] [CrossRef] [PubMed]
- Manga, V.E.; Forton, O.T.; Mofor, L.A.; Woodard, R. Health care waste management in Cameroon: A case study from the Southwestern Region. Resour. Conserv. Recycl. 2011, 57, 108–116. [Google Scholar] [CrossRef]
- Sharma, S.K.; Gupta, S. Healthcare waste management scenario: A case of Himachal Pradesh (India). Clin. Epidemiol. Glob. Health 2017, 5, 169–172. [Google Scholar] [CrossRef] [Green Version]
- Sahiledengle, B. Self-reported healthcare waste segregation practice and its correlate among healthcare workers in hospitals of Southeast Ethiopia. BMC Health Serv. Res. 2019, 19, 591. [Google Scholar] [CrossRef] [Green Version]
- Kumar, R.; Somrongthong, R.; Shaikh, B.T. Effectiveness of intensive healthcare waste management training model among health professionals at teaching hospitals of Pakistan: A quasi-experimental study. BMC Health Serv. Res. 2015, 15, 81. [Google Scholar] [CrossRef] [Green Version]
- Abdo, N.M.; Hamza, W.S.; Al-Fadhli, M.A. Effectiveness of education program on hospital waste management. Int. J. Workplace Health Manag. 2019, 12, 457–468. [Google Scholar] [CrossRef]
- Yang, J.; Huang, H.Z.; He, L.P.; Zhu, S.P.; Wen, D. Risk evaluation in failure mode and effects analysis of aircraft turbine rotor blades using Dempster–Shafer evidence theory under uncertainty. Eng. Fail. Anal. 2011, 18, 2084–2092. [Google Scholar] [CrossRef]
- Zheng, H.; Tang, Y. Deng Entropy Weighted Risk Priority Number Model for Failure Mode and Effects Analysis. Entropy 2020, 22, 280. [Google Scholar] [CrossRef] [Green Version]
- Liu, H.C.; You, J.X.; Shan, M.M.; Shao, L.N. Failure mode and effects analysis using intuitionistic fuzzy hybrid TOPSIS approach. Soft Comput. 2015, 19, 1085–1098. [Google Scholar] [CrossRef]
- Liu, H.C.; Chen, X.Q.; Duan, C.Y.; Wang, Y.M. Failure mode and effect analysis using multi-criteria decision making methods: A systematic literature review. Comput. Ind. Eng. 2019, 135, 881–897. [Google Scholar] [CrossRef]
- Hansen, P.; Ombler, F. A new method for scoring additive multi-attribute value models using pairwise rankings of alternatives. J. Multi-Criteria Decis. Anal. 2009, 15, 87–107. [Google Scholar] [CrossRef]
- Martelli, N.; Hansen, P.; van den Brink, H.; Boudard, A.; Cordonnier, A.L.; Devaux, C.; Pineau, J.; Prognon, P.; Borget, I. Combining multi-criteria decision analysis and mini-health technology assessment: A funding decision-support tool for medical devices in a university hospital setting. J. Biomed. Informatiz. 2016, 59, 201–208. [Google Scholar] [CrossRef] [PubMed] [Green Version]
- Balaraju, J.; Raj, M.G.; Murthy, C.S. Fuzzy-FMEA risk evaluation approach for LHD machine-A case study. J. Sustain. Min. 2019, 18, 257–268. [Google Scholar] [CrossRef]
- Moubray, J. Reliability-Centered Maintenance; Industrial Press Inc.: New York, NY, USA, 1992. [Google Scholar]
- Liu, H.C.; Chen, Y.Z.; You, J.X.; Li, H. Risk evaluation in failure mode and effects analysis using fuzzy digraph and matrix approach. J. Intell. Manuf. 2016, 27, 805–816. [Google Scholar] [CrossRef]
- Kumru, M.; Kumru, P.Y. Fuzzy MFEA application to improve purchasing process in a public hospital. Appl. Soft Comput. 2013, 13, 721–733. [Google Scholar] [CrossRef]
- Braglia, M.; Frosolini, M.; Montanari, R. Fuzzy TOPSIS approach for failure mode, effects and criticality analysis. Qual. Reliab. Eng. Int. 2003, 19, 425–443. [Google Scholar] [CrossRef]
- Huang, J.; Li, Z.S.; Liu, H.C. New approach for failure mode and effect analysis using linguistic distribution assessments and TODIM method. Reliab. Eng. Syst. Saf. 2017, 167, 302–309. [Google Scholar] [CrossRef]
- Liu, H.C. FMEA Using Uncertainty Theories and MCDM Methods. In FMEA Using Uncertainty Theories and MCDM Methods; Springer: Singapore, 2016. [Google Scholar]
- Kutlu, A.C.; Ekmekçioğlu, M. Fuzzy failure modes and effects analysis by using fuzzy TOPSIS-based fuzzy AHP. Expert Syst. Appl. 2012, 39, 61–67. [Google Scholar] [CrossRef]
- Mangeli, M.; Shahraki, A.; Saljooghi, F.H. Improvement of risk assessment in the FMEA using nonlinear model, revised fuzzy TOPSIS, and support vector machine. Int. J. Ind. Ergon. 2019, 69, 209–216. [Google Scholar] [CrossRef]
- Wang, L.; Liu, H.; Quan, M. Evaluating the risk of failure modes with a hybrid MCDM model under interval-valued intuitionistic fuzzy environment. Comput. Ind. Eng. 2016, 102, 175–185. [Google Scholar] [CrossRef]
- Bao, J.; Johansson, J.; Zhang, J. An occupational disease assessment of the mining industry’s occupational health and safety management system based on FMEA and an improved AHP model. Sustainability 2017, 9, 94. [Google Scholar] [CrossRef] [Green Version]
- Fattahi, R.; Khalilzadeh, M. Risk evaluation using a novel hybrid method based on FMEA, extended MULTIMOORA, and AHP methods under fuzzy environment. Saf. Sci. 2018, 102, 290–300. [Google Scholar] [CrossRef]
- Tian, Z.P.; Wang, J.Q.; Zhang, H.Y. An integrated approach for failure mode and effects analysis based on fuzzy best-worst, relative entropy, and VIKOR methods. Appl. Soft Comput. 2018, 72, 636–646. [Google Scholar] [CrossRef]
- Boral, S.; Howard, I.; Chaturvedi, S.K.; McKee, K.; Naikan, V.N.A. An integrated approach for fuzzy failure modes and effects analysis using fuzzy AHP and fuzzy MAIRCA. Eng. Fail. Anal. 2020, 108, 104195. [Google Scholar] [CrossRef]
- Zhu, J.; Shuai, B.; Li, G.; Chin, K.S.; Wang, R. Failure mode and effect analysis using regret theory and PROMETHEE under linguistic neutrosophic context. J. Loss Prev. Process. Ind. 2020, 64, 104048. [Google Scholar] [CrossRef]
- Wang, Z.; Ran, Y.; Chen, Y.; Yu, H.; Zhang, G. Failure mode and effects analysis using extended matter-element model and AHP. Comput. Ind. Eng. 2020, 140, Article 106233. [Google Scholar] [CrossRef]
- Dong, C. Failure mode and effects analysis based on fuzzy utility cost estimation. Int. J. Qual. Reliab. Manag. 2007, 24, 958–971. [Google Scholar] [CrossRef] [Green Version]
- Ilangkumaran, M.; Shanmugam, P.; Sakthivel, G.; Visagavel, K. Failure mode and effect analysis using fuzzy analytic hierarchy process. Int. J. Product. Qual. Manag. 2014, 14, 296–313. [Google Scholar] [CrossRef]
- Safari, H.; Faraji, Z.; Majidian, S. Identifying and evaluating enterprise architecture risks using FMEA and fuzzy VIKOR. J. Intell. Manuf. 2016, 27, 475–486. [Google Scholar] [CrossRef]
- Shi, J.L.; Wang, Y.J.; Jin, H.H.; Fan, S.J.; Ma, Q.Y.; Zhou, M.J. A modified method for risk evaluation in failure mode and effects analysis. J. Appl. Sci. Eng. 2016, 19, 177–186. [Google Scholar]
- Carpitella, S.; Certa, A.; Izquierdo, J.; La Fata, C.M. A combined multi-criteria approach to support FMECA analyses: A real-world case. Reliab. Eng. Syst. Saf. 2018, 169, 394–402. [Google Scholar] [CrossRef] [Green Version]
- Sakthivel, G.; Saravanakumar, D.; Muthuramalingam, T. Application of failure mode and effect analysis in manufacturing industry—An integrated approach with FAHP-fuzzy TOPSIS and FAHP-fuzzy VIKOR. Int. J. Product. Qual. Manag. 2018, 24, 398–423. [Google Scholar] [CrossRef]
- Chang, K.H.; Cheng, C.H. A risk assessment methodology using intuitionistic fuzzy set in FMEA. Int. J. Syst. Sci. 2010, 41, 1457–1471. [Google Scholar] [CrossRef]
- Liu, H.C.; Liu, L.; Li, P. Failure mode and effects analysis using intuitionistic fuzzy hybrid weighted Euclidean distance operator. Int. J. Syst. Sci. 2014, 45, 2012–2030. [Google Scholar] [CrossRef]
- Liu, H.C.; You, J.X.; You, X.Y. Evaluating the risk of healthcare failure modes using interval 2-tuple hybrid weighted distance measure. Comput. Ind. Eng. 2014, 78, 249–258. [Google Scholar] [CrossRef]
- Guo, J. A risk assessment approach for failure mode and effects analysis based on intuitionistic fuzzy sets and evidence theory. J. Intell. Fuzzy Syst. 2016, 30, 869–881. [Google Scholar] [CrossRef]
- Tooranloo, H.S.; Ayatollah, A.S. A model for failure mode and effects analysis based on intuitionistic fuzzy approach. Appl. Soft Comput. 2016, 49, 238–247. [Google Scholar] [CrossRef]
- Yazdi, M. Risk assessment based on novel intuitionistic fuzzy-hybrid-modified TOPSIS approach. Saf. Sci. 2018, 110, 438–448. [Google Scholar] [CrossRef]
- Mirghafoori, S.H.; Izadi, M.R.; Daei, A. Analysis of the barriers affecting the quality of electronic services of libraries by VIKOR, FMEA and entropy combined approach in an intuitionistic-fuzzy environment. J. Intell. Fuzzy Syst. 2018, 34, 2441–2451. [Google Scholar] [CrossRef]
- Tooranloo, H.S.; Ayatollah, A.S.; Alboghobish, S. Evaluating knowledge management failure factors using intuitionistic fuzzy FMEA approach. Knowl. Inf. Syst. 2018, 57, 1–23. [Google Scholar]
- Can, G.F. An intutionistic approach based on failure mode and effect analysis for prioritizing corrective and preventive strategies. Hum. Factors Ergon. Manuf. 2018, 28, 130–147. [Google Scholar] [CrossRef]
- Liu, H.C.; Wu, J.; Li, P. Assessment of health-care waste disposal methods using a VIKOR-based fuzzy multi-criteria decision making method. Waste Manag. 2013, 33, 2744–2751. [Google Scholar] [CrossRef] [PubMed]
- Atanassov, K.T. Intuitionistic Fuzzy Sets. Fuzzy Sets Syst. 1986, 20, 87–96. [Google Scholar] [CrossRef]
- Xu, Z. Approaches to multiple attribute group decision making based on intuitionistic fuzzy power aggregation operators. Knowl.-Based Syst. 2011, 24, 749–760. [Google Scholar] [CrossRef]
- Xu, Z.; Zhao, N. Information fusion for intuitionistic fuzzy decision making: An overview. Inf. Fusion 2016, 28, 10–23. [Google Scholar] [CrossRef]
- Liu, H.C.; You, J.X.; Lin, Q.L.; Li, H. Risk assessment in system FMEA combining fuzzy weighted average with fuzzy decision-making trial and evaluation laboratory. Int. J. Comput. Integr. Manuf. 2015, 28, 701–714. [Google Scholar] [CrossRef]
- Xu, Z. Intuitionistic Fuzzy Aggregation Operators. IEEE Trans. Fuzzy Syst. 2007, 15, 1179–1187. [Google Scholar]
- Xu, Z.S. An overview of methods for determining OWA weights. Int. J. Intell. Syst. 2005, 20, 843–865. [Google Scholar] [CrossRef]
- Carnero, M.C. Assessment of Environmental Sustainability in Health Care Organizations. Sustainability 2015, 7, 8270–8291. [Google Scholar] [CrossRef] [Green Version]
- Zhao, J.; You, X.Y.; Liu, H.C.; Wu, S.M. An Extended VIKOR Method Using Intuitionistic Fuzzy Sets and Combination Weights for Supplier Selection. Symmetry 2017, 9, 169. [Google Scholar] [CrossRef]
- Llopis-Albert, C.; Palacios-Marques, D. Applications of ordered weighted averaging (OWA) operators in environmental problems. Multidiscip. J. Educ. Soc. Technol. Sci. 2017, 4, 52–63. [Google Scholar] [CrossRef] [Green Version]
- Fitzgerald, A.; de Coster, C.; McMillan, S.; Naden, R.; Armstrong, F.; Barber, A.; Cunning, L.; Conner-Spady, B.; Hawker, G.; Lacaille, D.; et al. Relative urgency for referral from primary care to rheumatologists: The Priority Referral Score. Arthritis Care Res. 2011, 63, 231–239. [Google Scholar] [CrossRef] [PubMed]
- Hansen, P.; Hendry, A.; Naden, R.; Ombler, F.; Stewart, R. A new process for creating points systems for prioritising patients for elective health services. Clin. Gov. Int. J. 2012, 17, 200–209. [Google Scholar] [CrossRef]
- Sullivan, T.; Hansen, P. Determining criteria and weights for prioritizing health technologies based on the preferences of the general population: A New Zealand pilot study. Value Health 2017, 20, 679–686. [Google Scholar] [CrossRef] [PubMed] [Green Version]
- Shiboski, C.H.; Shiboski, S.C.; Seror, R.; Criswell, L.A.; Labetoulle, M.; Lietman, T.M.; Rasmussen, A.; Scofield, H.; Vitali, C.; Bowman, S.J.; et al. 2016 American College of Rheumatology/European League against Rheumatism classification criteria for primary Sjögren’s syndrome: A consensus and data-driven methodology involving three international patient cohorts. Arthritis Rheumatol. 2017, 69, 35–45. [Google Scholar] [CrossRef]
- Tacconelli, E.; Carrara, E.; Savoldi, A.; Harbarth, S.; Mendelson, M.; Monnet, D.L.; Pulcini, C.; Zorzet, A. Discovery, research, and development of new antibiotics: The WHO priority list of antibiotic-resistant bacteria and tuberculosis. Lancet Infect. Dis. 2018, 18, 318–327. [Google Scholar] [CrossRef]
- Lasorsa, I.; Padoano, E.; Marceglia, S.; Accardo, A. Multi-criteria decision analysis for the assessment of non-clinical hospital services: Methodology and case study. Oper. Res. Health Care 2019, 23. [Google Scholar] [CrossRef]
- Pinto, D.; Bockenholt, U.; Lee, J.; Chang, R.W.; Hansen, P. Preferences for physical activity: A conjoint analysis involving people with chronic knee pain. Osteoarthr. Cartil. 2019, 27, 240–247. [Google Scholar] [CrossRef] [Green Version]
- Sullivan, T.; Hansen, P.; Ombler, F.; Derrett, S.; Devlin, N. A new tool for creating personal and social EQ-5D-5L value sets, including valuing ‘dead’. Soc. Sci. Med. 2020, 246. [Google Scholar] [CrossRef]
- PAPRIKA Method. Available online: https://www.1000minds.com/about/paprika (accessed on 22 July 2020).
- De Nardo, P.; Gentilotti, E.; Mazzaferri, F.; Cremonini, E.; Goossens, H.; Tacconelli, E.; The Members of the COVID-19 MCDA Group. Multi-Criteria Decision Analysis to prioritize hospital admission of patients affected by COVID-19 in low-resource settings with hospital-bed shortage. Int. J. Infect. Dis. 2020. [Google Scholar] [CrossRef]
- Sałabun, W. The Characteristic Objects Method: A New Distance based approach to multicrieria decision making problems. J. Multi-Criteria Decis. Anal. 2015, 22, 37–50. [Google Scholar]
- Wang, Y.M.; Elhag, T.M.S. An approach to avoiding rank reversal in AHP. Decis. Support. Syst. 2006, 42, 1474–1480. [Google Scholar] [CrossRef]
- Sałabun, W.; Piegat, A. Comparative analysis of MCDM methods for the assessment of mortality in patients with acute coronary syndrome. Artif. Intell. Rev. 2017, 48, 557–571. [Google Scholar]
- Sałabun, W.; Piegat, A.; Wątróbski, J.; Karczmarczyk, A.; Jankowski, J. The COMET Method: The First MCDA Method Completely Resistant to Rank Reversal Paradox; European Working Group “Multiple Criteria Decision Aiding” Series 3, n° 39; Spring: Berlin/Heidelberg, Germany, 2019. [Google Scholar]
- Sałabun, W.; Karczmarczyk, A. Using the COMET Method in the Sustainable City Transport Problem: An Empirical Study of the Electric Powered Cars. Procedia Comput. Sci. 2018, 126, 2248–2260. [Google Scholar] [CrossRef]
- Németh, B.; Molnár, A.; Bozóki, S.; Wijaya, K.; Inotai, A.; Campbell, J.D.; Kaló, Z. Comparison of weighting methods used in multicriteria decision analysis frameworks in healthcare with focus on low- and middle-income countries. J. Comp. Eff. Res. 2019, 8. [Google Scholar] [CrossRef] [Green Version]
- Mulliner, E.; Malys, N.; Maliene, V. Comparative analysis of MCDM methods for the assessment of sustainable housing affordability. Omega 2016, 59, 146–156. [Google Scholar] [CrossRef]
- Faizi, S.; Rashid, T.; Salabun, W.; Zafar, S.; Watróbski, J. Decision making with uncertainty using hesitant fuzzy sets. Int. J. Fuzzy Syst. 2017, 20, 93–103. [Google Scholar] [CrossRef] [Green Version]
- Sałabun, W.; Urbaniak, K. A New Coefficient of Rankings Similarity in Decision-Making Problems. In Computational Science—ICCS 2020; Lecture Notes in Computer Science; Krzhizhanovskaya, V., Závodszky, G., Lees, M.H., Dongarra, J.J., Sloot, P.M.A., Brissos, S., Teixeira, J., Eds.; Springer: Cham, Switzerland, 2020; Volume 12138. [Google Scholar] [CrossRef]
Figure 1.
Flowchart of the study.
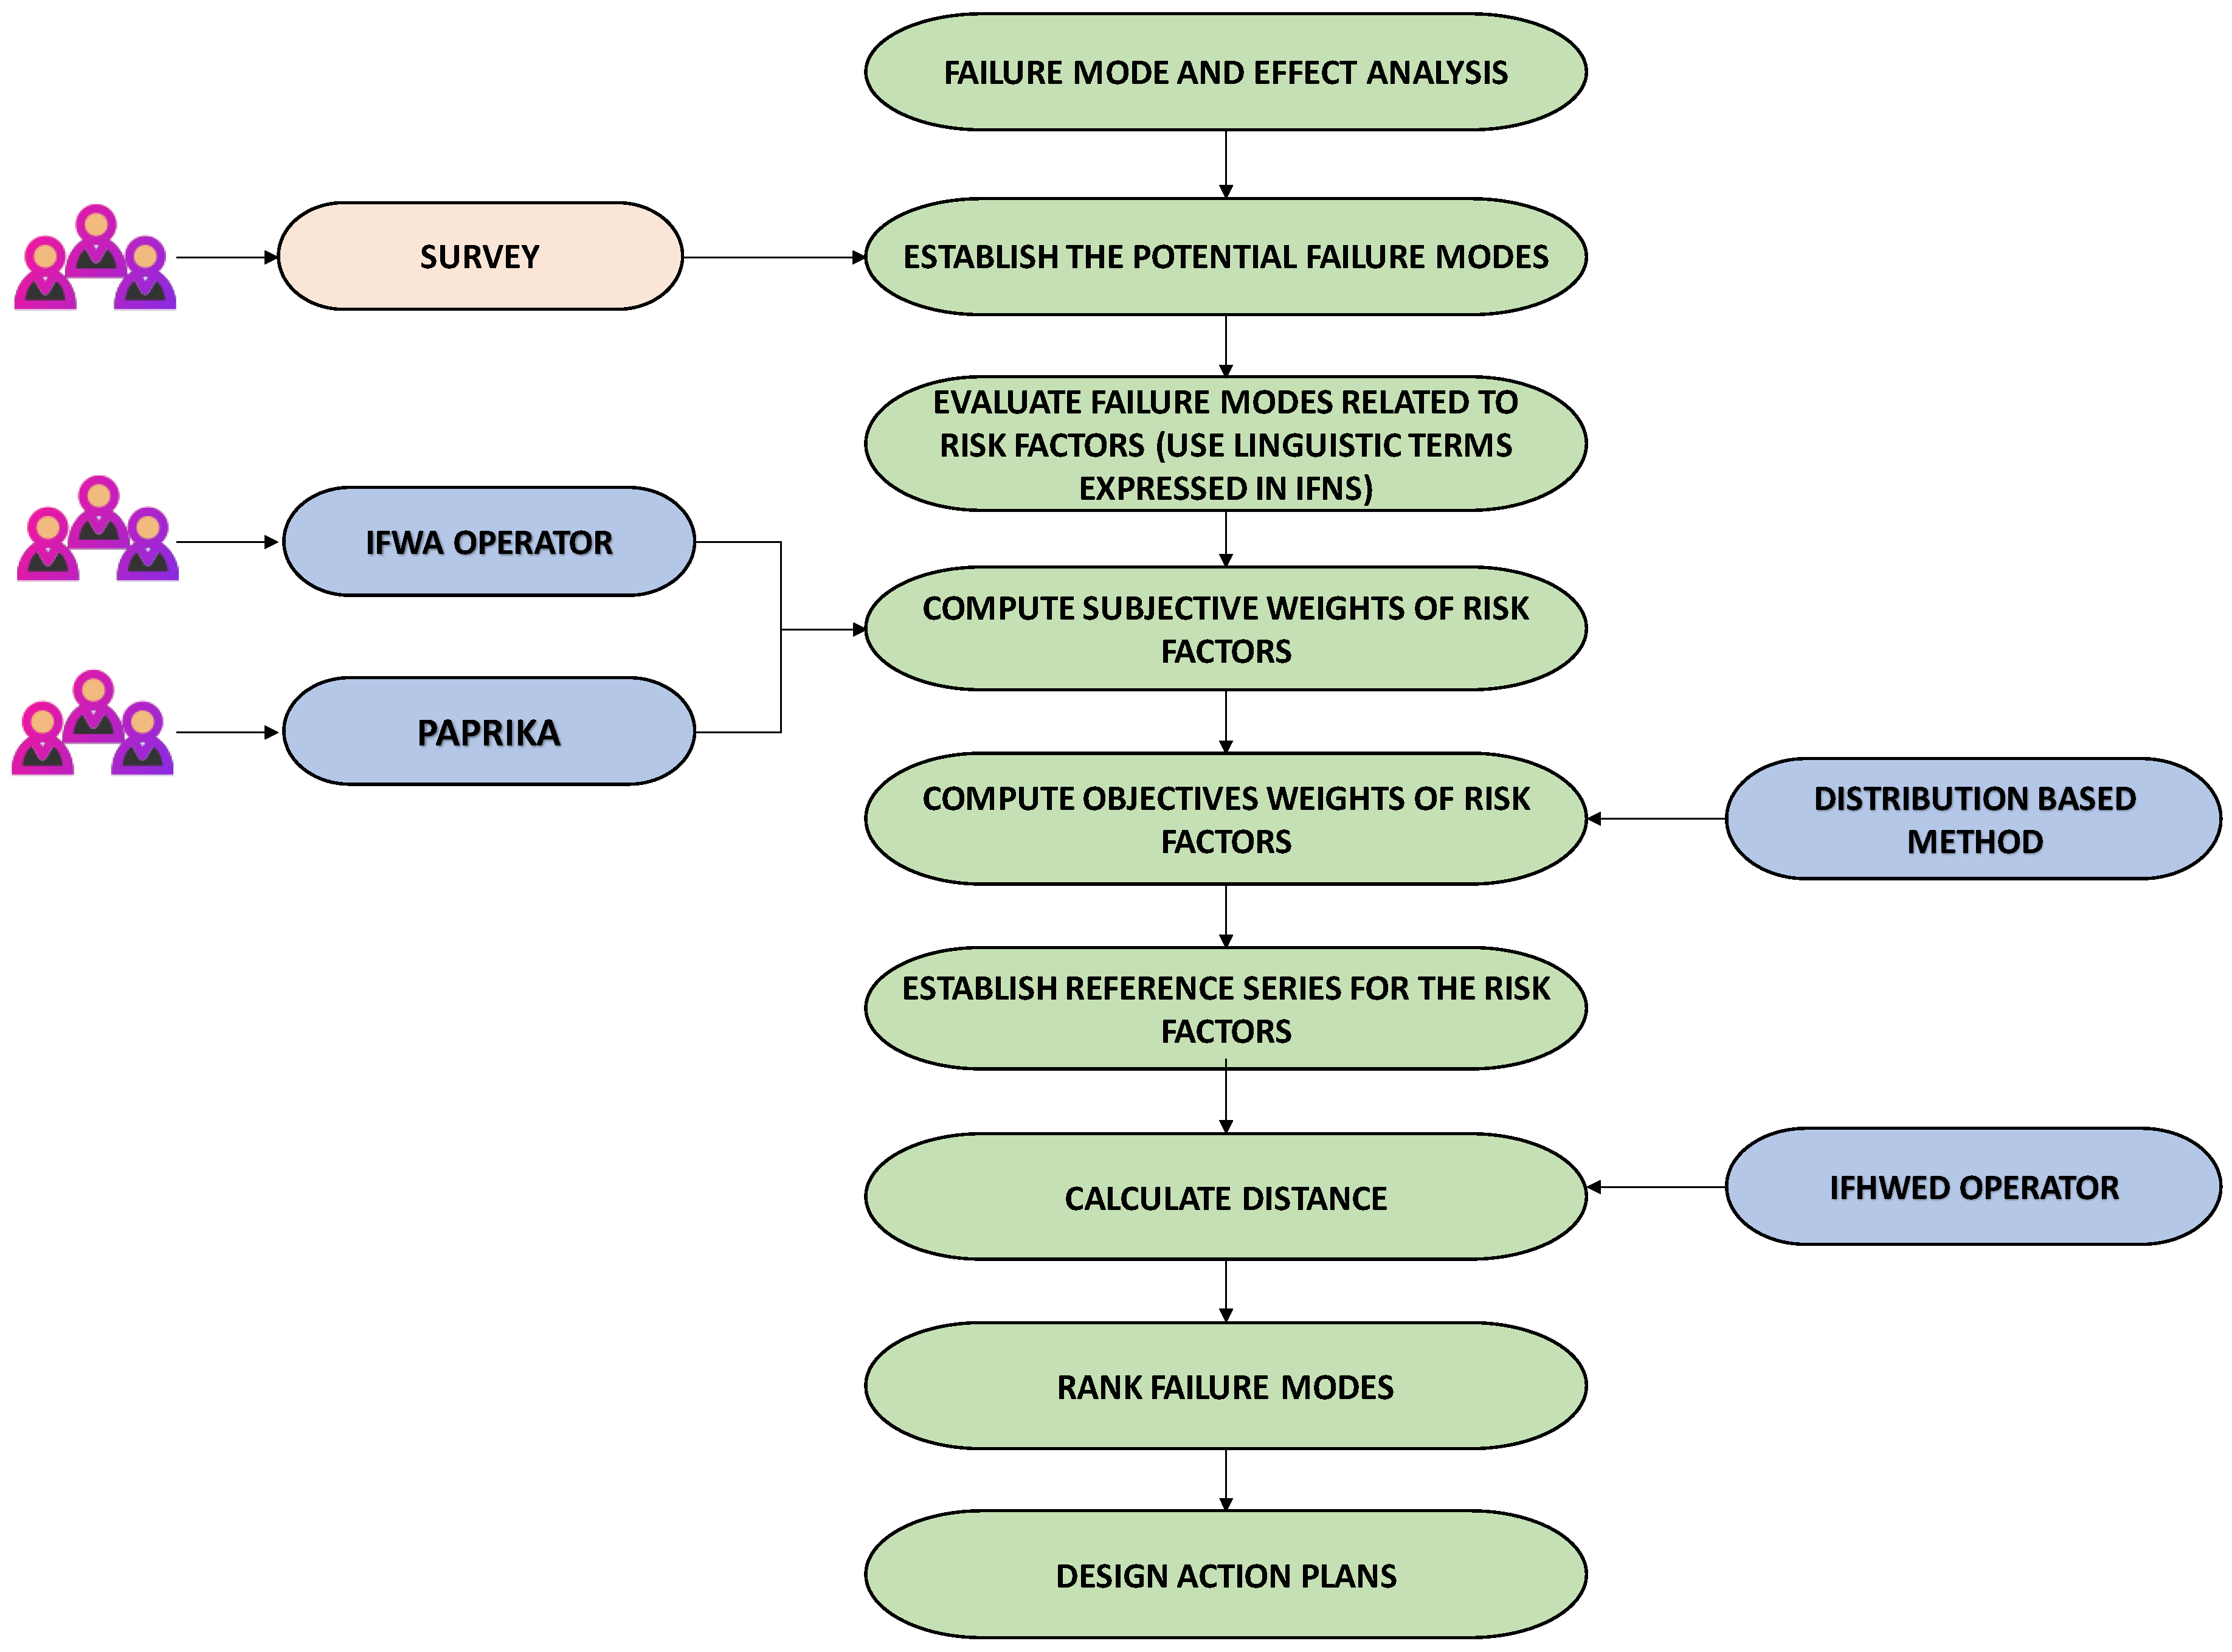
Figure 2.
Incorrect segregation of waste documented in the Nuclear Medicine Service.

Figure 3.
Sticker to be placed on 3-litre containers (a) Design; (b) Final sticker.


Figure 4.
Information on identification of containers and signage.

Figure 5.
Correct and incorrect segregation actions.


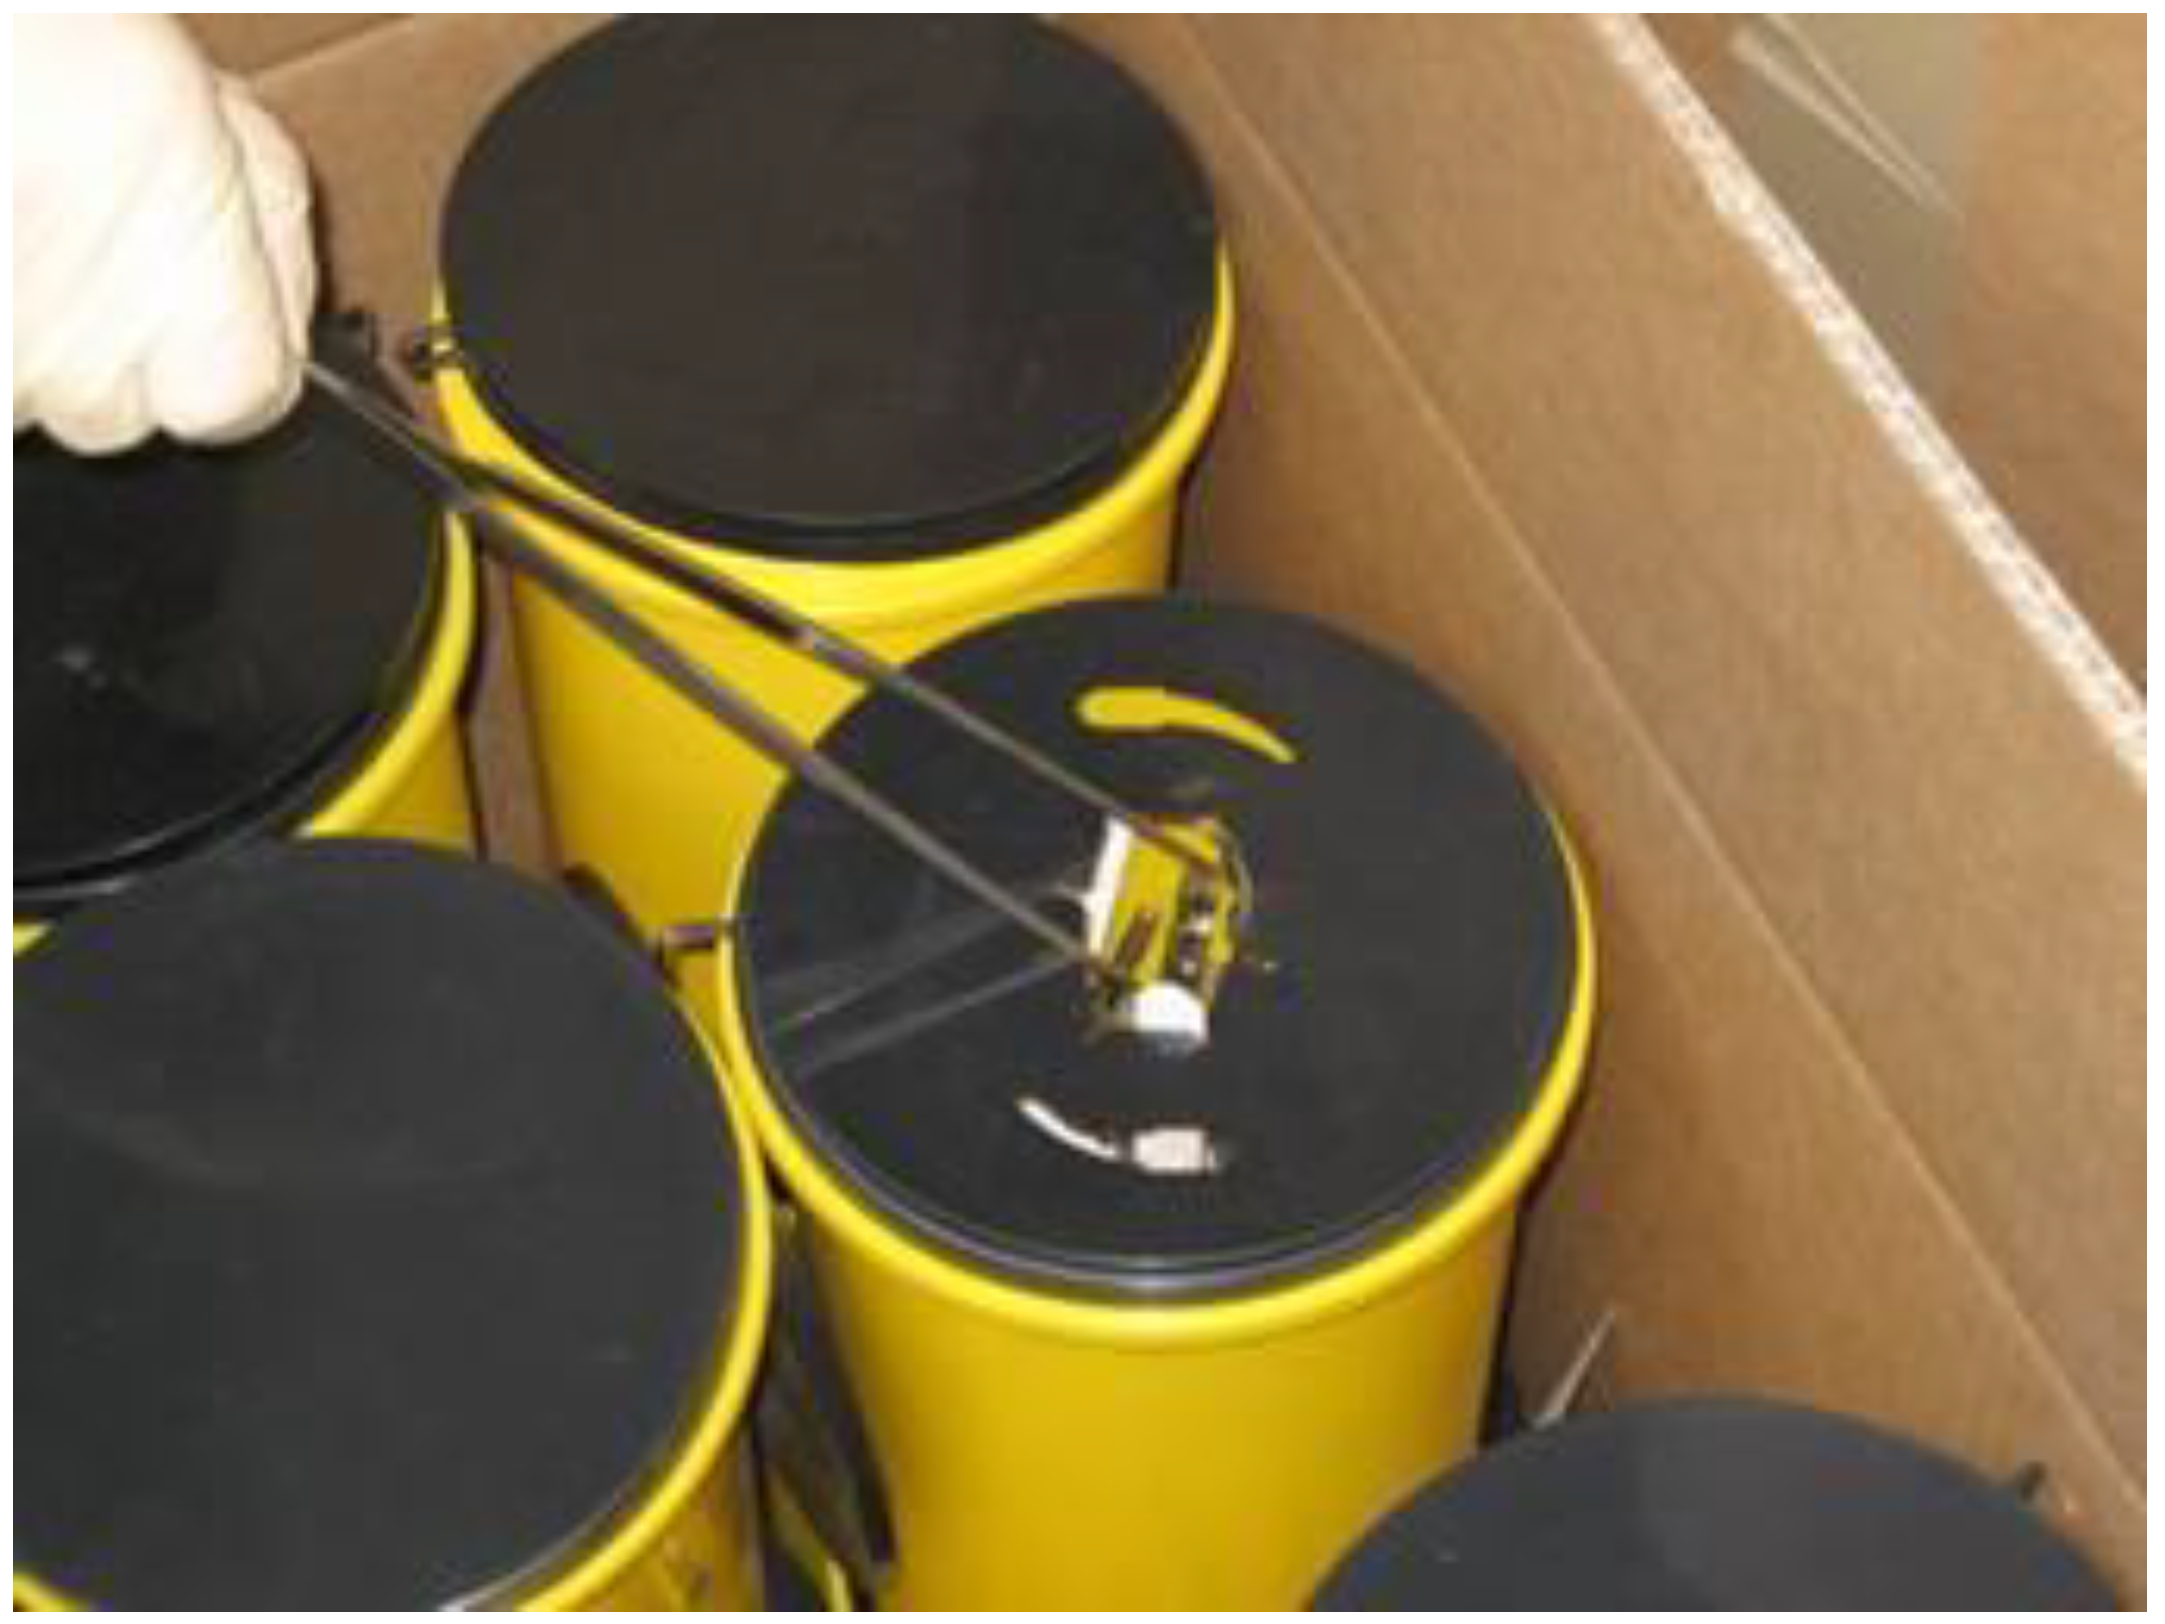
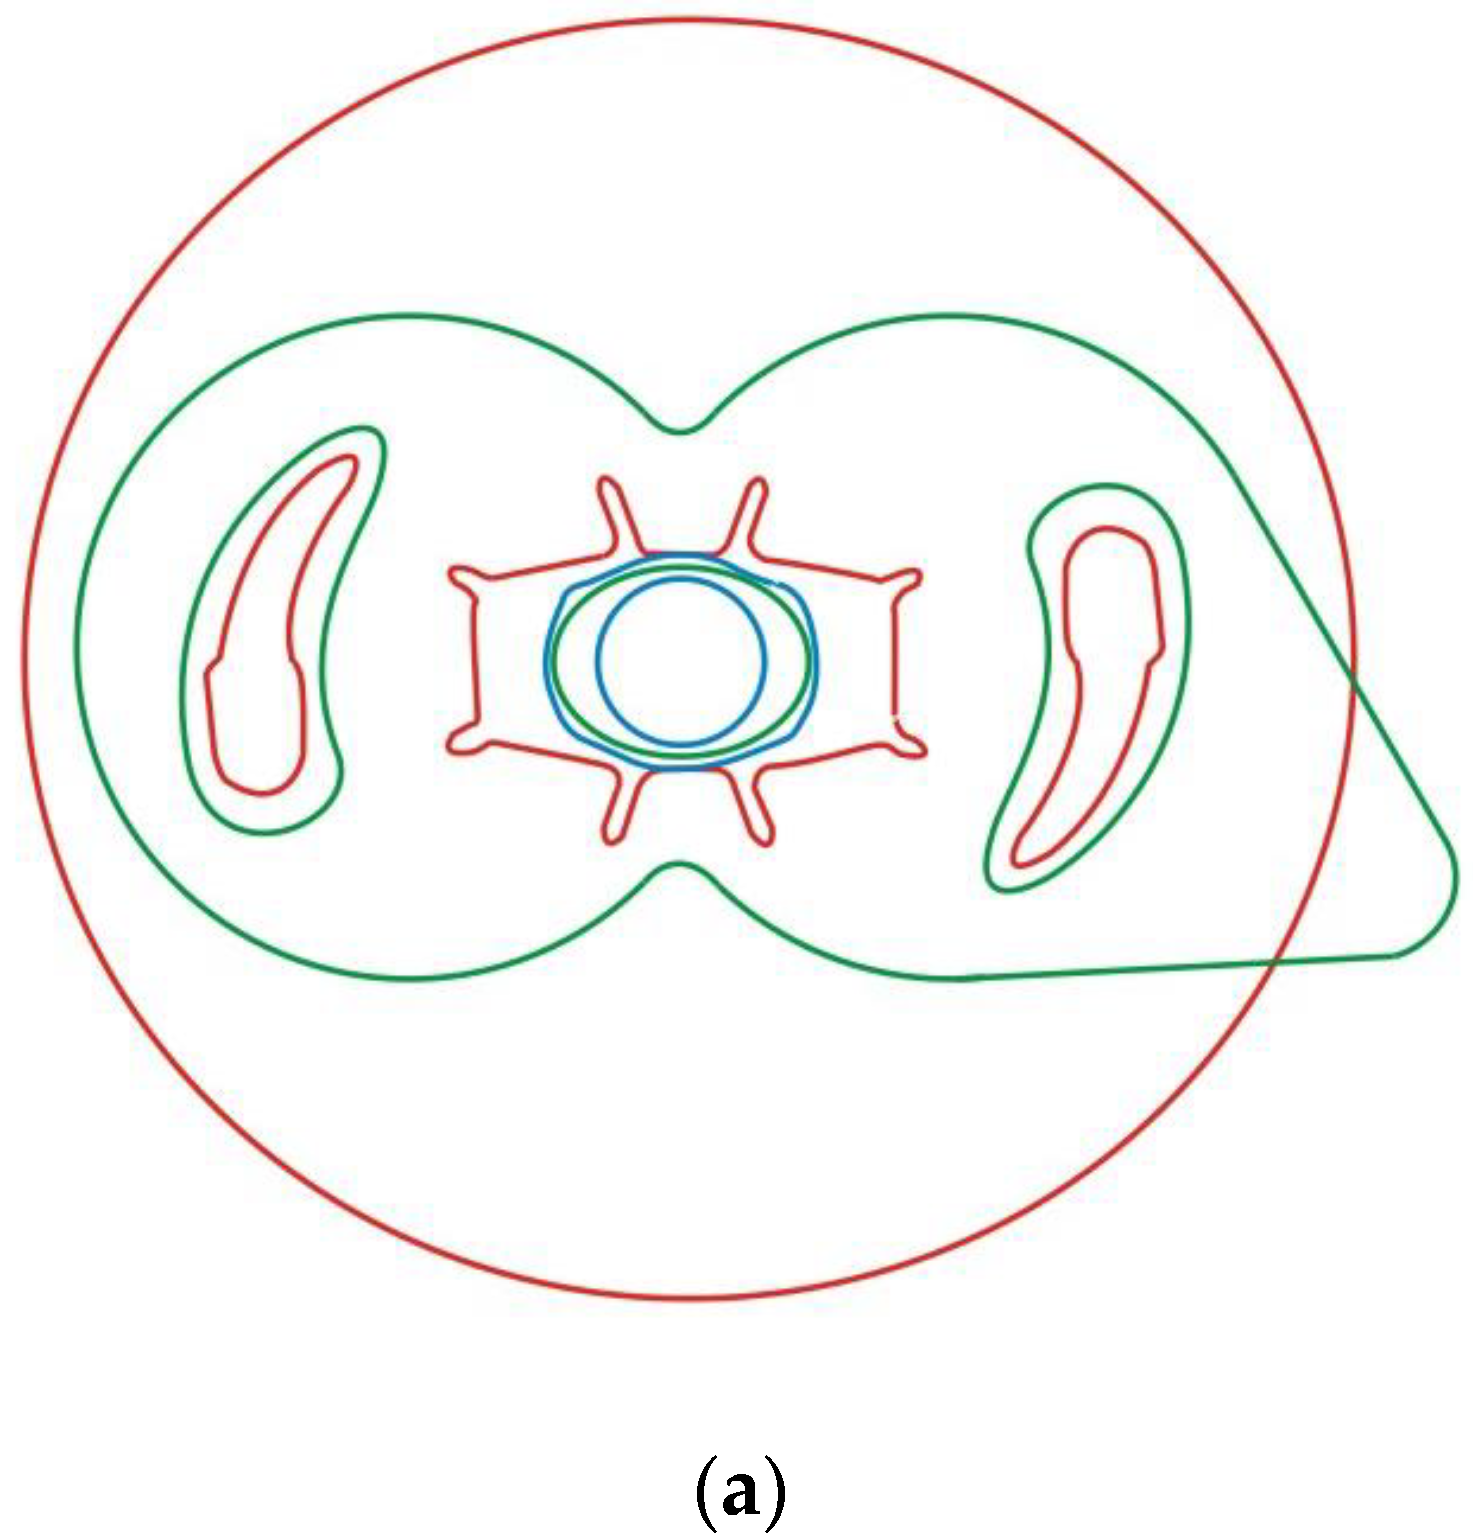
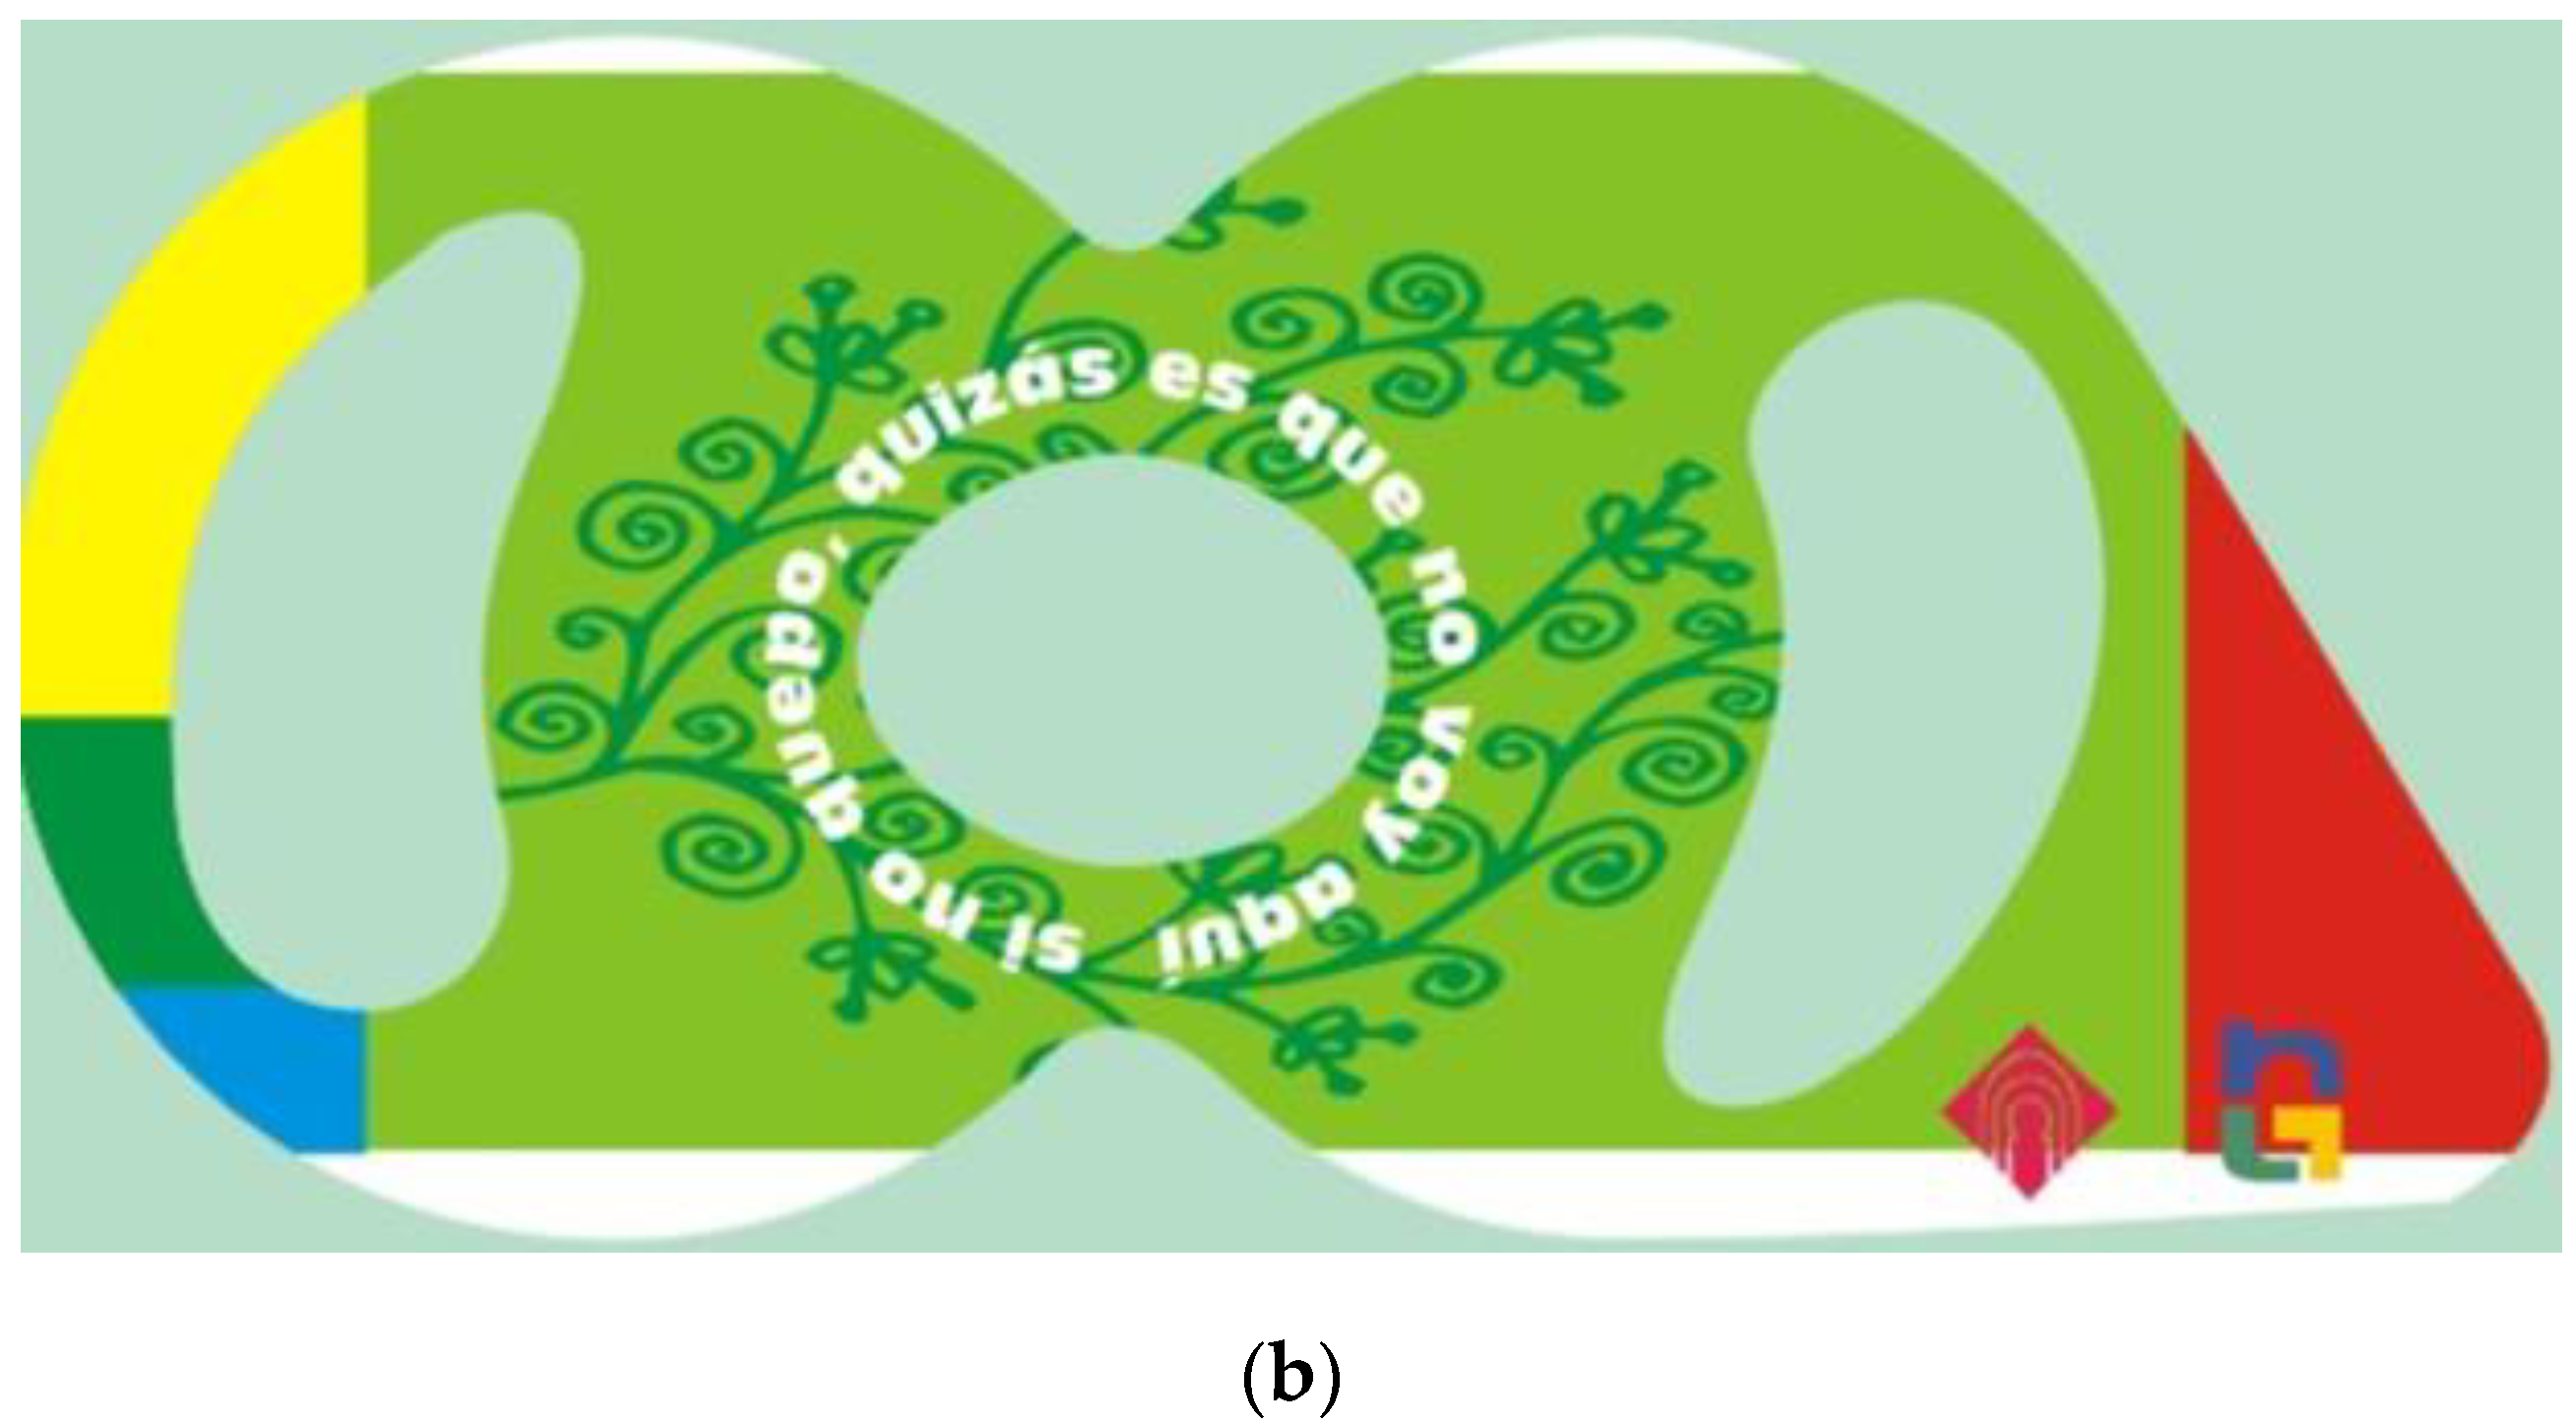
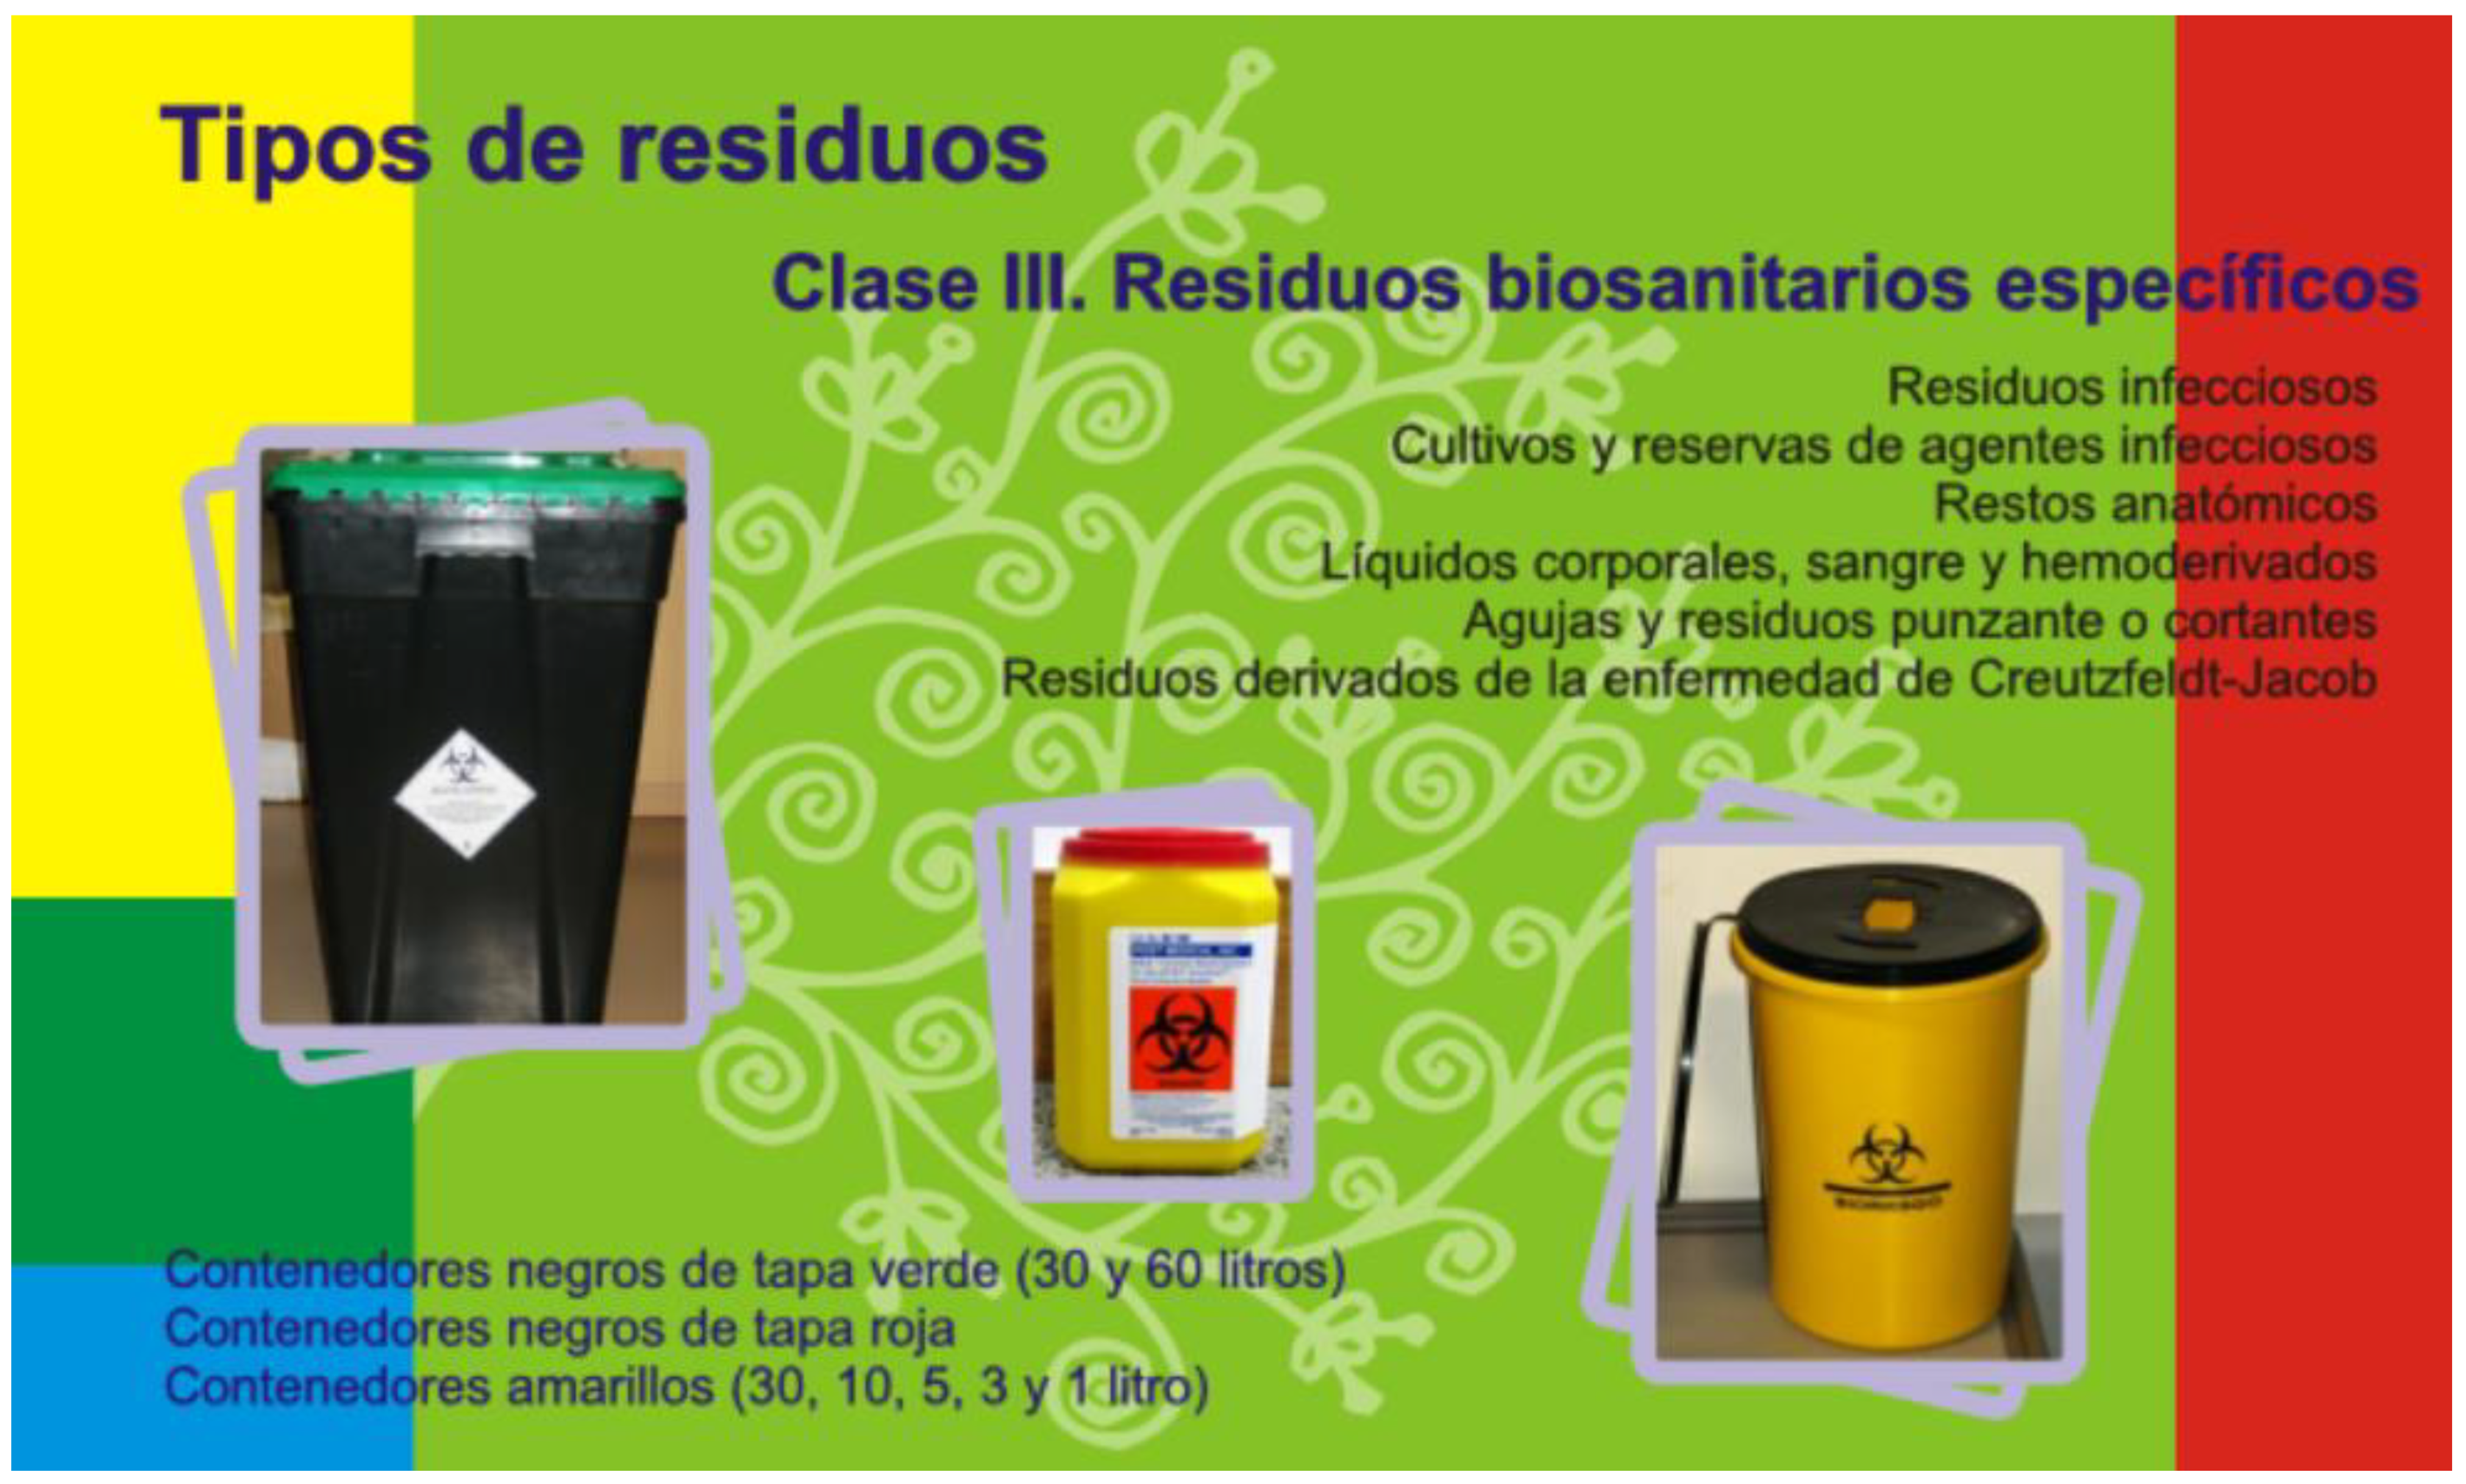
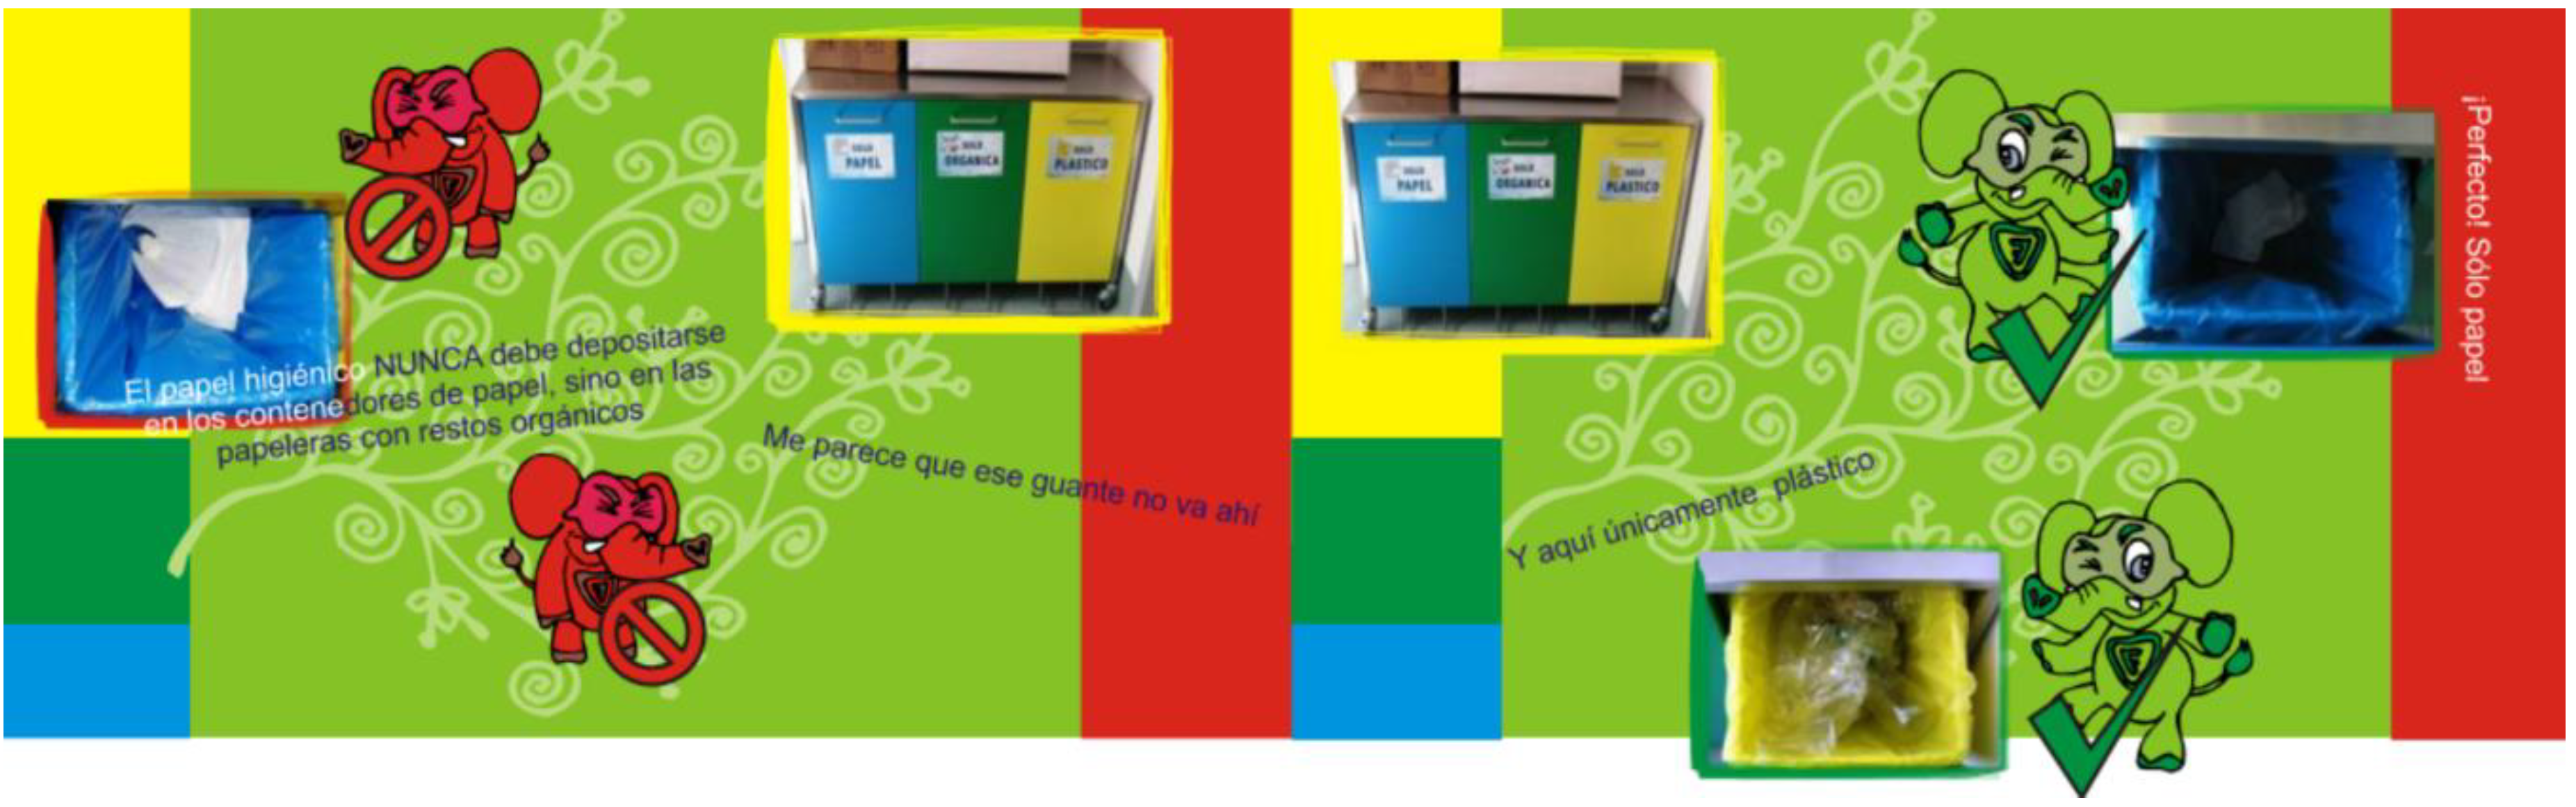
Table 1.
Categories of health care waste [5].
Table 1.
Categories of health care waste [5].
| Non-Hazardous or General Health Care Waste | Hazardous Health Care Waste | |||||
|---|---|---|---|---|---|---|
| Infectious Waste | Sharps Waste | Pathological Waste | Pharmaceutical Waste, Cytotoxic Waste | Chemical Waste | Radioactive Waste | |
| Waste that contains no biological, chemical, radioactive or physical hazard. | Waste that contains, or is suspected of containing, pathogens, and poses a risk of transmission of disease, for example, water and other waste contaminated with blood or other bodily fluids, including highly infectious waste such as laboratory cultures and microbiological stocks; excreta and other materials that have been in contact with patients with highly infectious diseases in isolation wards. | Used or unused sharps, for example, hypodermic, intravenous or other needles; auto-disposable syringes; syringes with attached needles; infusion sets; scalpels; pipettes; knives, blades, broken glass. | Human tissues, organs or fluids; body parts, foetuses, unused blood products. | Pharmaceuticals that are past their use-by date or have become unnecessary, items contaminated by or containing pharmaceuticals. Cytotoxic waste containing substances with genotoxic properties, for example, waste containing cytostatic drugs (often used in cancer therapy); genotoxic chemicals. | Waste containing chemical substances, for example laboratory reagents; film developer; disinfectants that are past their use-by date, or that will no longer be necessary; solvents; waste with a high content of heavy metals, such as batteries, broken thermometers and blood pressure gauges. | For example, unused radiotherapy or laboratory research liquids; contaminated glassware, packages or absorbent paper; urine and excreta from patients treated with unsealed radionuclides. |
Table 2.
Ratings of probability of occurrence of a failure mode [1].
Table 2.
Ratings of probability of occurrence of a failure mode [1].
| Rank | Probability of Failure | Possible Failure Rates |
|---|---|---|
| 10 | Extremely high: failure almost inevitable | ≥1 in 2 |
| 9 | Very high | 1 in 3 |
| 8 | Repeated failures | 1 in 8 |
| 7 | High | 1 in 20 |
| 6 | Moderately high | 1 in 80 |
| 5 | Moderate | 1 in 400 |
| 4 | Relatively low | 1 in 2000 |
| 3 | Low | 1 in 15,000 |
| 2 | Remote | 1 in 150,000 |
| 1 | Nearly impossible | ≤1 in 1,500,000 |
Table 3.
Linguistic terms for assessing failure modes.
| Linguistic Terms | IFN |
|---|---|
| Extremely low (EL) | (0.10, 0.90) |
| Very low (VL) | (0.25, 0.70) |
| Low (L) | (0.30, 0.60) |
| Medium low (ML) | (0.40, 0.50) |
| Medium (M) | (0.50, 0.50) |
| Medium high (MH) | (0.60, 0.30) |
| High (H) | (0.70, 0.20) |
| Very high (VH) | (0.75, 0.20) |
| Extremely high (EH) | (0.90, 0.10) |
Table 4.
Linguistic terms for assessing subjective weights of risk factors.
| Linguistic Terms | IFN |
|---|---|
| Very low (VL) | (0.10, 0.85) |
| Low (L) | (0.25, 0.70) |
| Moderate (M) | (0.50, 0.50) |
| High (H) | (0.75, 0.20) |
| Very high (VH) | (0.90, 0.05) |
Table 5.
Nuclear Medicine Department segregation failure modes.
| Failure Mode | Description |
|---|---|
| Failure mode 1 | Incorrect labeling; for example, marking a container as organic material when in fact it is a container for glass |
| Failure mode 2 | Poor waste management; for example: putting bags inside a container implying that a container is permanent when it is not, lack of collection with the necessary frequency |
| Failure mode 3 | Improperly stored waste; deposit items in containers that do not correspond; for example, organic matter to a glass container |
| Failure mode 4 | Collection of containers when they reach minimum weights per container |
| Failure mode 5 | Lack of space for correct placement of containers or new containers |
| Failure mode 6 | Lack of information from healthcare staff on: collection time, container location, weight thresholds, maximum and minimum container |
| Failure mode 7 | Lack of signage/posters on environmental risks |
| Failure mode 8 | Lack of training of health personnel on environmental risks |
| Failure mode 9 | Lack of continuous control of data on quantities/weights/elements generated |
Table 6.
Evaluation of the failure modes in each criterion by the DMs.
| Criteria | Occurrence | Severity | Detectability | |||
|---|---|---|---|---|---|---|
| Decision Maker | ||||||
| Failure mode 1 | EH | H | EH | MH | VH | M |
| Failure mode 2 | VH | H | VH | MH | M | H |
| Failure mode 3 | EH | MH | EH | MH | VH | H |
| Failure mode 4 | M | H | MH | H | VH | M |
| Failure mode 5 | ML | ML | ML | M | MH | ML |
| Failure mode 6 | H | MH | MH | MH | M | H |
| Failure mode 7 | MH | M | MH | H | VL | H |
| Failure mode 8 | VH | MH | H | MH | M | H |
| Failure mode 9 | M | H | ML | MH | M | MH |
Table 7.
Evaluation of the failure modes in each criterion by the DMs.
| Criteria | Occurrence | Severity | Detectability | |||
|---|---|---|---|---|---|---|
| Decision Maker | ||||||
| Failure mode 1 | 0.444 | 0.168 | 0.411 | 0.228 | 0.293 | 0.398 |
| Failure mode 2 | 0.362 | 0.200 | 0.324 | 0.271 | 0.292 | 0.251 |
| Failure mode 3 | 0.411 | 0.228 | 0.411 | 0.228 | 0.362 | 0.200 |
| Failure mode 4 | 0.292 | 0.251 | 0.315 | 0.221 | 0.293 | 0.398 |
| Failure mode 5 | 0.164 | 0.500 | 0.194 | 0.500 | 0.213 | 0.440 |
| Failure mode 6 | 0.305 | 0.271 | 0.274 | 0.300 | 0.292 | 0.251 |
| Failure mode 7 | 0.241 | 0.440 | 0.315 | 0.221 | 0.247 | 0.274 |
| Failure mode 8 | 0.324 | 0.271 | 0.305 | 0.271 | 0.292 | 0.251 |
| Failure mode 9 | 0.215 | 0.251 | 0.229 | 0.341 | 0.250 | 0.341 |
Table 8.
Preferential values given by decision makers.
| DM1 | DM2 | DM3 | DM4 | Median | Mean | |
|---|---|---|---|---|---|---|
| Occurrence | ||||||
| High | 0% | 0% | 0% | 0% | 0% | 0% |
| Medium | 12.1% | 16.0% | 14.3% | 12.5% | 13.4% | 13.7% |
| Low | 24.2% | 20.0% | 28.6% | 16.7% | 22.1% | 22.4% |
| Severity | ||||||
| Very severe | 0% | 0% | 0% | 0% | 0% | 0% |
| Severe | 24.2% | 12.0% | 14.3% | 20.8% | 17.6% | 17.8% |
| Not severe | 39.4% | 48.0% | 50.0% | 50.0% | 49.0% | 46.8% |
| Detectability | ||||||
| Not detected | 0% | 0% | 0% | 0% | 0% | 0% |
| Sometimes detected | 18.2% | 8.0% | 7.1% | 8.3% | 8.2% | 10.4% |
| High capacity for detection | 36.4% | 32.0% | 21.4% | 33.3% | 32.7% | 30.8% |
Table 9.
Ranking of risk factors.
| Risk Criteria | dm1 | DM2 | DM3 | DM4 | Median | Mean |
|---|---|---|---|---|---|---|
| Occurrence | 1st | 1st | 1st | 1st | 1.000 | 1.000 |
| Severity | 3rd | 3rd | 2nd | 3rd | 3.000 | 2.750 |
| Detectability | 2nd | 2nd | 3rd | 2nd | 2.000 | 2.250 |
Table 10.
Relative importance of risk factors in comparison by pairs.
| Risk Criteria | Severity | Occurrence | Detectability |
|---|---|---|---|
| Occurrence | 1.0 | 2.1 | 1.5 |
| Severity | 0.5 | 1.0 | 0.7 |
| Detectability | 0.7 | 1.4 | 1.0 |
Table 11.
Weightings of risk criteria.
| Risk Criteria | Weightings | Categories | Individual Valuation (0–100) |
|---|---|---|---|
| Occurrence | 0.468 | High | 0.0 |
| Medium | 61.4 | ||
| Low | 100.0 | ||
| Severity | 0.224 | Very severe | 0.0 |
| Severe | 38.1 | ||
| Not severe | 100.0 | ||
| Detectability | 0.308 | Not detected | 0.0 |
| Sometimes detected | 33.8 | ||
| High capacity for detection | 100.0 |
Table 12.
Ranking of failure modes using IFHWED and subjective weights in risk criteria using PAPRIKA.
Table 12.
Ranking of failure modes using IFHWED and subjective weights in risk criteria using PAPRIKA.
| Failure Modes | Ranking | |
|---|---|---|
| Failure mode 1 | 0.574 | 2nd |
| Failure mode 2 | 0.546 | 3rd |
| Failure mode 3 | 0.589 | 1st |
| Failure mode 4 | 0.511 | 5th |
| Failure mode 5 | 0.353 | 9th |
| Failure mode 6 | 0.508 | 6th |
| Failure mode 7 | 0.479 | 7th |
| Failure mode 8 | 0.522 | 4th |
| Failure mode 9 | 0.462 | 8th |
Table 13.
Sensitivity analysis using IFHWED and subjective weightings of risk factors using PAPRIKA.
Table 13.
Sensitivity analysis using IFHWED and subjective weightings of risk factors using PAPRIKA.
| Failure Modes | IFHWED + PAPRIKA | Ranking | IFHWED + PAPRIKA | Ranking | IFHWED + PAPRIKA | Ranking |
|---|---|---|---|---|---|---|
| Failure mode 1 | 0.573 | 2nd | 0.574 | 2nd | 0.575 | 2nd |
| Failure mode 2 | 0.542 | 3rd | 0.544 | 3rd | 0.549 | 3rd |
| Failure mode 3 | 0.589 | 1st | 0.589 | 1st | 0.589 | 1st |
| Failure mode 4 | 0.516 | 6th | 0.513 | 5th | 0.508 | 6th |
| Failure mode 5 | 0.354 | 9th | 0.353 | 9th | 0.353 | 9th |
| Failure mode 6 | 0.505 | 5th | 0.506 | 6th | 0.510 | 5th |
| Failure mode 7 | 0.493 | 7th | 0.486 | 7th | 0.471 | 7th |
| Failure mode 8 | 0.521 | 4th | 0.521 | 4th | 0.522 | 4th |
| Failure mode 9 | 0.458 | 8th | 0.460 | 8th | 0.464 | 8th |
Table 14.
Risk criteria judgements.
| Criteria | Occurrence | Severity | Detectability |
|---|---|---|---|
| (0.75, 0.2) | (0.9, 0.05) | (0.5, 0.5) | |
| (0.9, 0.05) | (0.75, 0.2) | (0.5, 0.5) |
Table 15.
Ranking of failure modes.
| Failure Modes | Ranking | |
|---|---|---|
| Failure mode 1 | 0.579 | 2nd |
| Failure mode 2 | 0.545 | 3rd |
| Failure mode 3 | 0.590 | 1st |
| Failure mode 4 | 0.517 | 5th |
| Failure mode 5 | 0.352 | 9th |
| Failure mode 6 | 0.505 | 6th |
| Failure mode 7 | 0.488 | 7th |
| Failure mode 8 | 0.522 | 4th |
| Failure mode 9 | 0.460 | 8th |
Table 16.
Sensitivity analysis.
| Failure Modes | IFHWED | Ranking | IFHWED | Ranking | IFHWED | Ranking |
|---|---|---|---|---|---|---|
| Failure mode 1 | 0.575 | 2nd | 0.577 | 2nd | 0.582 | 2nd |
| Failure mode 2 | 0.541 | 3rd | 0.543 | 3rd | 0.547 | 3rd |
| Failure mode 3 | 0.589 | 1st | 0.590 | 1st | 0.590 | 1st |
| Failure mode 4 | 0.518 | 5th | 0.517 | 5th | 0.517 | 5th |
| Failure mode 5 | 0.353 | 9th | 0.352 | 9th | 0.351 | 9th |
| Failure mode 6 | 0.504 | 6th | 0.505 | 6th | 0.506 | 6th |
| Failure mode 7 | 0.496 | 7th | 0.492 | 7th | 0.483 | 7th |
| Failure mode 8 | 0.521 | 4th | 0.521 | 4th | 0.522 | 4th |
| Failure mode 9 | 0.457 | 8th | 0.459 | 8th | 0.461 | 8th |
Table 17.
Linguistic scale for the weights.
| Linguistic Terms | Triangular Fuzzy Number |
|---|---|
| Very Low (VL) | (0, 0, 0.1) |
| Low (L) | (0, 0.1, 0.3) |
| Medium Low (ML) | (0.1, 0.3, 0.5) |
| Medium (M) | (0.3, 0.5, 0.7) |
| Medium High (MH) | (0.5, 0.7, 0.9) |
| High (H) | (0.7, 0.9, 1.0) |
| Very High (VH) | (0.9, 1.0, 1.0) |
Table 18.
Linguistic scale for the ratings.
| Linguistic Terms | Triangular Fuzzy Number |
|---|---|
| Very Poor (VP) | (0, 0, 1) |
| Poor (P) | (0, 1, 3) |
| Medium Poor (MP) | (1, 3, 5) |
| Fair (F) | (3, 5, 7) |
| Medium Good (MG) | (5, 7, 9) |
| Good (G) | (7, 9, 10) |
| Very Good (VG) | (9, 10, 10) |
Table 19.
Risk criteria judgements.
| Criteria | Occurrence | Severity | Detectability |
|---|---|---|---|
| (0.7, 0.9, 1) | (0.9, 1, 1) | (0.3, 0.5, 0.7) | |
| (0.9, 1, 1) | (0.7, 0.9, 1) | (0.3, 0.5, 0.7) |
Table 20.
Weighted normalized decision matrix.
| Alternative | Occurrence | Severity | Detectability |
|---|---|---|---|
| Failure mode 1 | (0.340, 0.464, 0.500) | (0.276, 0.414, 0.500) | (0.090, 0.188, 0.298) |
| Failure mode 2 | (0.319, 0.439, 0.500) | (0.257, 0.390, 0.500) | (0.075, 0.175, 0.298) |
| Failure mode 3 | (0.298, 0.415, 0.475) | (0.276, 0.414, 0.500) | (0.120, 0.238, 0.350) |
| Failure mode 4 | (0.234, 0.342, 0.425) | (0.237, 0.390, 0.500) | (0.090, 0.188, 0.298) |
| Failure mode 5 | (0.043, 0.146, 0.250) | (0.079, 0.195, 0.316) | (0.045, 0.125, 0.245) |
| Failure mode 6 | (0.255, 0.390, 0.475) | (0.197, 0.341, 0.474) | (0.075, 0.175, 0.298) |
| Failure mode 7 | (0.298, 0.415, 0.475) | (0.237, 0.390, 0.500) | (0.053, 0.113, 0.193) |
| Failure mode 8 | (0.213, 0.342, 0.425) | (0.119, 0.244, 0.369) | (0.075, 0.175, 0.298) |
| Failure mode 9 | (0.313, 0.437, 0.500) | (0.225, 0.347, 0.425) | (0.060, 0.150, 0.280) |
Table 21.
The distances, Closeness Coefficients and ranking of failure modes.
| Alternatives | Distances | CC | Ranking | |
|---|---|---|---|---|
| Failure mode 1 | 11.9923 | 1.0573 | 0.08102 | 2nd |
| Failure mode 2 | 12.0335 | 1.0252 | 0.07851 | 3rd |
| Failure mode 3 | 11.9886 | 1.0640 | 0.08152 | 1st |
| Failure mode 4 | 12.1169 | 0.9435 | 0.07224 | 5th |
| Failure mode 5 | 12.5326 | 0.5491 | 0.04197 | 9th |
| Failure mode 6 | 12.1278 | 0.9441 | 0.07222 | 6th |
| Failure mode 7 | 12.1242 | 0.9263 | 0.07098 | 7th |
| Failure mode 8 | 12.2642 | 0.8068 | 0.06172 | 8th |
| Failure mode 9 | 12.1027 | 0.9529 | 0.07299 | 4th |
© 2020 by the author. Licensee MDPI, Basel, Switzerland. This article is an open access article distributed under the terms and conditions of the Creative Commons Attribution (CC BY) license (http://creativecommons.org/licenses/by/4.0/).
Share and Cite
MDPI and ACS Style
Carnero, M.C. Waste Segregation FMEA Model Integrating Intuitionistic Fuzzy Set and the PAPRIKA Method. Mathematics 2020, 8, 1375. https://doi.org/10.3390/math8081375
AMA Style
Carnero MC. Waste Segregation FMEA Model Integrating Intuitionistic Fuzzy Set and the PAPRIKA Method. Mathematics. 2020; 8(8):1375. https://doi.org/10.3390/math8081375
Chicago/Turabian StyleCarnero, María Carmen. 2020. "Waste Segregation FMEA Model Integrating Intuitionistic Fuzzy Set and the PAPRIKA Method" Mathematics 8, no. 8: 1375. https://doi.org/10.3390/math8081375
Note that from the first issue of 2016, this journal uses article numbers instead of page numbers. See further details here.