Article

RNA: A Reject Neighbors Algorithm for Influence Maximization in Complex Networks

Software College of Northeastern University, Shenyang 110169, China
*
Author to whom correspondence should be addressed.
Mathematics 2020, 8(8), 1313; https://doi.org/10.3390/math8081313
Submission received: 10 July 2020 / Revised: 3 August 2020 / Accepted: 5 August 2020 / Published: 7 August 2020
(This article belongs to the Special Issue Computational Mathematics and Neural Systems)

Abstract

:
The influence maximization problem (IMP) in complex networks is to address finding a set of key nodes that play vital roles in the information diffusion process, and when these nodes are employed as ”seed nodes”, the diffusion effect is maximized. First, this paper presents a refined network centrality measure, a refined shell (RS) index for node ranking, and then proposes an algorithm for identifying key node sets, namely the reject neighbors algorithm (RNA), which consists of two main sequential parts, i.e., node ranking and node selection. The RNA refuses to select multiple-order neighbors of the seed nodes, scatters the selected nodes from each other, and results in the maximum influence of the identified node set on the whole network. Experimental results on real-world network datasets show that the key node set identified by the RNA exhibits significant propagation capability.

1. Introduction

Many systems in the real world exist in the form of complex networks, ranging from protein interaction networks in living organisms to interstellar gravitational networks in space. Complex networks are high-level abstractions of complex systems. People hope to reveal the information, laws, and knowledge hidden behind data through quantitative and effective data analysis and mining of networks. Research on the influence maximization problem (IMP) in complex networks is a hot topic in network science, which is also known as identification of a key node set or multiple influential nodes, which refers to selecting k initial propagation seed nodes under the premise of a given budget, to maximize the impact on network propagation [1,2]. The IMP is essential to control and understand a complex system’s spreading capabilities and ensure efficient information diffusion, such as in rumor-like dynamics of viral marketing.
Research on the identification of a key nodeset originated from Domingos and Richardson’s thinking in viral marketing [3]. It is easy to understand that the probability of customers purchasing products not only depends on the inherent desirability of the products but also on the influence of other customers. Therefore, under a limited marketing budget, finding a small group of customers to provide discounts to and maximize the final total sales is the best for business. Since only a small group of nodes is allowed to be selected as seed nodes, when the target network is vast, i.e., in the context of big data, selecting a small group of seed nodes is much more difficult. Kempe et al. proved that the IMP is an NP-hard problem and proposed a greedy algorithm based on the two classic information diffusion models, the linear threshold model (LT) and independent cascade model (IC) [4]. As far as we know, Kempe et al.’s work was the first to formalize the influence maximization as a discrete optimization problem.
In recent years, along with the fast development of social networks, especially online social networks, researchers have started to give more effort to solving the challenges of the IMP in big data. Thai, My T. et al. summarized the challenges in social big data analysis into emerged data-related challenges and big data analysis processes [5]. A survey article by [6] summarized the types of social influence evaluation metrics into centrality measures, link topological ranking measures, and entropy measures. Furthermore, they classified existing IMP algorithms into greedy-based algorithms, heuristic-based algorithms, and others such as voting-based and greedy-based, and heuristic-based hybrid algorithms. To our understanding, the most significant challenge of the IMP in big data is high computational complexity. Because there is no need to re-evaluate a large number of nodes in each time step to find the node with the largest marginal effect, Leskovec et al. proposed a CELF (cost-effective lazy forward) optimization algorithm [7]. The proposed algorithm obtained about 700 times performance improvement and an approximate optimal result as compared with the original greedy algorithm. To provide an efficient IMP solution, research work by [8] provided an entropy ranking and a min-cut two-phase IMP solution. To solve the ”computationally-hard” problem influencing calculations after deciding seed nodes, research work [9] proposed a lazy forwarding approach on differential evolution algorithm. To balance the running time and the influence spread of IMP solution, Wei Chen et al. proposed a scalable influence maximization solution for viral marketing in large-scale social networks [10]. Because of IMP’s practical importance in various domains, such as viral marketing and personalized recommendation, researchers also started to introduce more and more rich information other than network structure to overcome the challenges of IMP in big data [11,12].
In addition to the computational complexity challenge, the suitable design of influence evaluation metrics has always been one of the most widely discussed topics with respect to the IMP. Holme et al. [13] proposed recalculating the network centrality after each round of node selection. On the basis of a similar idea, Chen et al. proposed the degree discount algorithm [14], which achieved prominent experimental efficiency and approximated experimental results with the greedy algorithm. According to the point coloring theory in graph theory, Zhao et al. selected the nodes that wered scattered with each other, and propose a coloring algorithm to combine the key node sets [15]. Zhang et al. proposed a vote rank algorithm [16] by using adaptive recalculation. Each node obtained votes from its neighbor nodes in each round, and the voting ability of neighbor nodes of the selected node was weakened to select the node with the highest number of votes per round. He et al. [17] employed a community discovery algorithm to divide the network into several communities and extracted key nodes in each community according to a certain centrality index, which ensured that the selected nodes were sufficiently dispersed in the whole network. Bao et al. proposed the HC (heuristic clustering) algorithm [18] based on LP (local path) similarity index, in which nodes were divided into several clusters through clustering, and the central nodes in each cluster were extracted to form a key node set.
In fact, due to budget constraints and considering influence diffusion, when selecting a seed node set for the IMP, the influence and scattering degree of selected nodes are all essential factors that need to be considered. We have proposed a solution for the influence maximization problem in big data, which we have called the reject neighbors algorithm. The nodes of the target network are sorted according to their centrality, and then are filtered in terms of the proposed rules to make the filtered nodes more dispersed, and thereby maximum influence is achieved. Through propagation simulations on a large number of real network datasets, we verify that the reject neighbors algorithm performance is superior to comparison algorithms. The fundamental contributions of this study can be summarized as follows:
  • Proposed a refined k-shell centrality indicator for IMP;
  • Proposed a node ranking and a reject neighbors-based node selection two-phase IMP algorithm;
  • Achieved superior IMP results as compared with other state-of-the-art methods.
The main contents of the paper are as follows: First, the process of the reject neighbors algorithm is introduced in detail; in Section 2, and a simple verification is also performed on the dolphin social network [19]; subsequently, in Section 3, the relevant contents of the simulation experiment are introduced, including network dataset, evaluation index, comparison algorithm, and experimental results, and so on; finally, Section 4 concludes the whole paper.

2. Algorithm Design

The reject neighbors algorithm (RNA) is a solution for the influence maximization problem in a complex network. The RNA selects initial propagation seed nodes in a simple graph to maximize the impact on network propagation, which can be used for rumor-like dynamics of a viral marketing scenario. Moreover, the influence maximization problem in the field of recommendation systems [20,21,22] also provides a more practical application scenario for the application of the refined shell index. RNA includes two parts, i.e., node ranking and node selection. A node importance index named refined shell is put forward to facilitate the process of influence maximization.

2.1. Refined Shell Index

The k-shell decomposition is a well-established method for analyzing the structure of large networks [23], which assigns nodes of a target network to k different shells by iterative pruning the target network. The decomposition process is described as follows: In the first iteration, the edges of all nodes with a degree of 1 are removed first, after this, some nodes are left with one edge, therefore, the edges of these nodes with a degree of 1 are continually removed until there are no nodes with a degree of 1 left. Those removed edges are assigned a 1-shell value. Similarly, the edges of the nodes with a degree of 2 are removed and assigned a 2-shell value, in the second iteration. The iteration continues until all nodes have been assigned, and the shell value (k-shell value) of a node belonging to the i-shell is i. The larger the shell value of the nodes, the more critical these nodes are.
The k-shell decomposition divides nodes into different subgroups with different shell values from a global view, exploring the inner core of the network, which is efficient spreaders. On the contrary, taking degree centrality as an example, as the most straightforward measure of network centrality, degree centrality plays a vital role in network-related application research. However, degree centrality focuses on the local structural information of the network, while the network propagation behavior is a global view-oriented approach. Therefore, the effectiveness of using nodes with a high degree centrality for the IMP is usually not satisfactory [24]. Research on classic epidemic-propagation models and real-world networks has indicated that compared to highly connected or most central nodes, nodes from the core of the network identified by the k-shell decomposition were much more efficient spreaders [25].
Despite the described advantages, using the k -shell value for selection of the influential nodes suffers from a resolution limit. Figure 1 shows the dolphin social network as an example [19]. The dolphin social network has 62 nodes and 159 edges, and 36 nodes hold the maximal k-shell value of four, which accounts for more than half of the total number of nodes. For the single-source influence maximization problem (select only one node as initial propagation seed to maximize influence), we can sort nodes by k-shell values and choose the node having the highest k-shell value as the information source. However, if the application scenario requires a multiple source influence maximization solution, extra node selection steps are needed, which means the k-shell measure is too ”coarse” to be used to select the initial seed set. Moreover, this kind of coarse node importance division brings too much randomness to the extra steps, which is not conducive to further node selection. Therefore, this paper improves the k -shell index and proposes a refined shell (RS) index. This index inherits the advantages of k-shell centrality measurement and employs the local information of nodes to precisely differentiate the importance of nodes.
On the basis of the k-shell decomposition, the RS index further divides all nodes in each shell according to the degree, and the calculation method is formulated as:
{ R S ( i ) = S h e l l ( i ) + [ c o e f f i K × D e g r e e ( i ) + c o e f f i B ] c o e f f i K = 1 ( m a x D m i n D ) c o e f f i B = m i n D ( m a x D m i n D )
where Shell (i) denotes the k-shell value of node I; coeffiK and coeffiB are parameters used to normalize the degree of each layer of nodes; maxD and mind, respectively correspond to the maximum degree value and minimum degree value of all nodes in the shell layer where the node is located.
The RS index is optimized on the basis of k -shell, so the whole calculation process includes k-shell decomposition and normalization of node degree centrality in shell layer. The calculation process is as follows:
  • Set the number of shell layers s = 1;
  • Iteratively removing nodes with degree value of s in the network and removing their connected edges, these nodes constitute the s-shell layer of the network;
  • Calculate the maximum node degree, maxD, and the minimum node degree, mind, in this shell layer;
  • Calculate coeffiK and coeffiB according to Equation (1), thereby calculating RS (i) of nodes in the shell layer;
  • Increase the number of shell layers s, repeat steps 2, 3, and 4 until all nodes are removed.
The pseudocode of the RS index calculation is shown below.
Centrality: RS index
Input: The network G = n nodes, m edges
Output:RS (i) represents the RS value of the network node
1:s=1 // s represents the s-shell layer of the network
2:while num (G) > 0 do // num (G) represents the number of nodes in the network
3:while exists node (s) in G do //node (s) represents a node with degree s
4:    remove node (s) from G
5:    node (s) append to s-shell
6:end while
7:calculate maxD and minD in s-shell
8:calculate coeffiK and coeffiB in s-shell
9:calculate RS (i) in s-shell
10:s++
11:end while
Further partition of the nodes in each shell is conducted by employing the RS index, which makes the importance of nodes more precisely distinguished. Apart from keeping the advantages of the k-shell index in the spread of network information, the RS index avoids bringing too much randomness to the selection of downstream nodes. The next section describes the selection of nodes based on the RS index.

2.2. Node Selection

The simplest and most direct node selection strategy is the top-k method, that is, according to a network centrality measure to select the top k nodes as the key node set. In real-world networks, the characteristics of the rich man’s club phenomenon [26] are common, where key nodes are gathered together, which cause the influence of nodes to overlap with each other, and then degrade the diffusion of information. Therefore, the top-k method may not be very effective.
Selecting a group of key nodes scattered in the network is the essence of the identification of a key node set. Before introducing the specific algorithm, several variables need to be defined. The “seeds” collection is used to save seed nodes, that is, nodes that have been identified as key nodes. The “refuses” set is used to save nonseed nodes, that is, nodes that cannot be seed nodes. The order σ of the rejection domain is used to determine the order of the neighbor of the seed node and σ = 0 means the node itself. The procedures of RNA are as follows:
  • Sorting nodes in the network according to the RS index;
  • Select the rejection domain order σ;
  • Seeds store the seed nodes, and refuses store the neighbors of the seed nodes with the order from 0 to σ;
  • Traverse the sorted nodes. If the node is not in refuses, the node is added to seeds, and the node’s neighbors with the order of 0 to σ are added to refuses;
  • If the number of nodes is satisfied, the iteration is stopped, and the seeds set is the final key node set;
  • If the number of nodes is still not satisfied at the end of the traversal, then relax the limit conditions, that is, decrease the order of the rejection domain.
Repeat the above-mentioned steps (3) to (5) until the number of nodes is met.
The corresponding pseudocode of RNA (Algorithm 1) is as follows:
Algorithm 1: RNA
Inout: The network G = n nodes, m edges
Output: The key node-set Seeds
1:sort nodes into array by RS index // array is the sorted sequence of nodes
2:fori = 1 to n step 1:
3:if num not meets do // The number of nodes set in advance is satisfied
4:    if node not in Refuses do
5:      array[i] is added to Seeds
6:    [0, σ] neighbors of array [i] are added to Refuses
7:  end if
8:  else do
11:    return Seeds
12:  end if
13:  if i = n do
14:    σ--
15:  go to step 2 // return step 2
16:end if
17:end for
The order of the rejection domain turns into a parameter to be measured. When the order of the rejection domain is too low, the selected nodes are not scattered enough, and result in ineffectively spreading information; when the order of the rejection domain is too high, most nodes in the network are placed in the refuses set. There may be fewer nodes that meet the requirements after one round of the algorithm, therefore, we have to reduce the restriction conditions and run it multiple times. In the next section, we use the RNA to identify multiple influential nodes in a real small network dataset.
For the RS index calculation, k-shell decomposition is performed by traversing all nodes in the network, therefore, the time complexity of calculation of this index is O ( n ) . The RNA algorithm is executed based on the RS index. It traverses all nodes in the network and uses the arranged node set to identify the rejected neighbors. Therefore, the time complexity of this part is O ( n ) . In conclusion, the time complexity of the RNA is O ( n ) . In addition, the adjacency matrix of the network storage takes up n 2 space. Computing the RS index needs n storage units, then, the nodes in the process of sorting need n × logn storage units. In the process of iterative node filtering, the seeds set and refuses set need n storage units in total. To sum up, the space complexity of the RNA is O ( n 2 ) .

3. Experimental Analysis

In this paper, the RNA is used to carry out sufficient experiments on different types of public real network datasets with different data scale. Comparisons with existing algorithms prove that the RNA is effective in terms of network propagation influence range and network propagation speed.

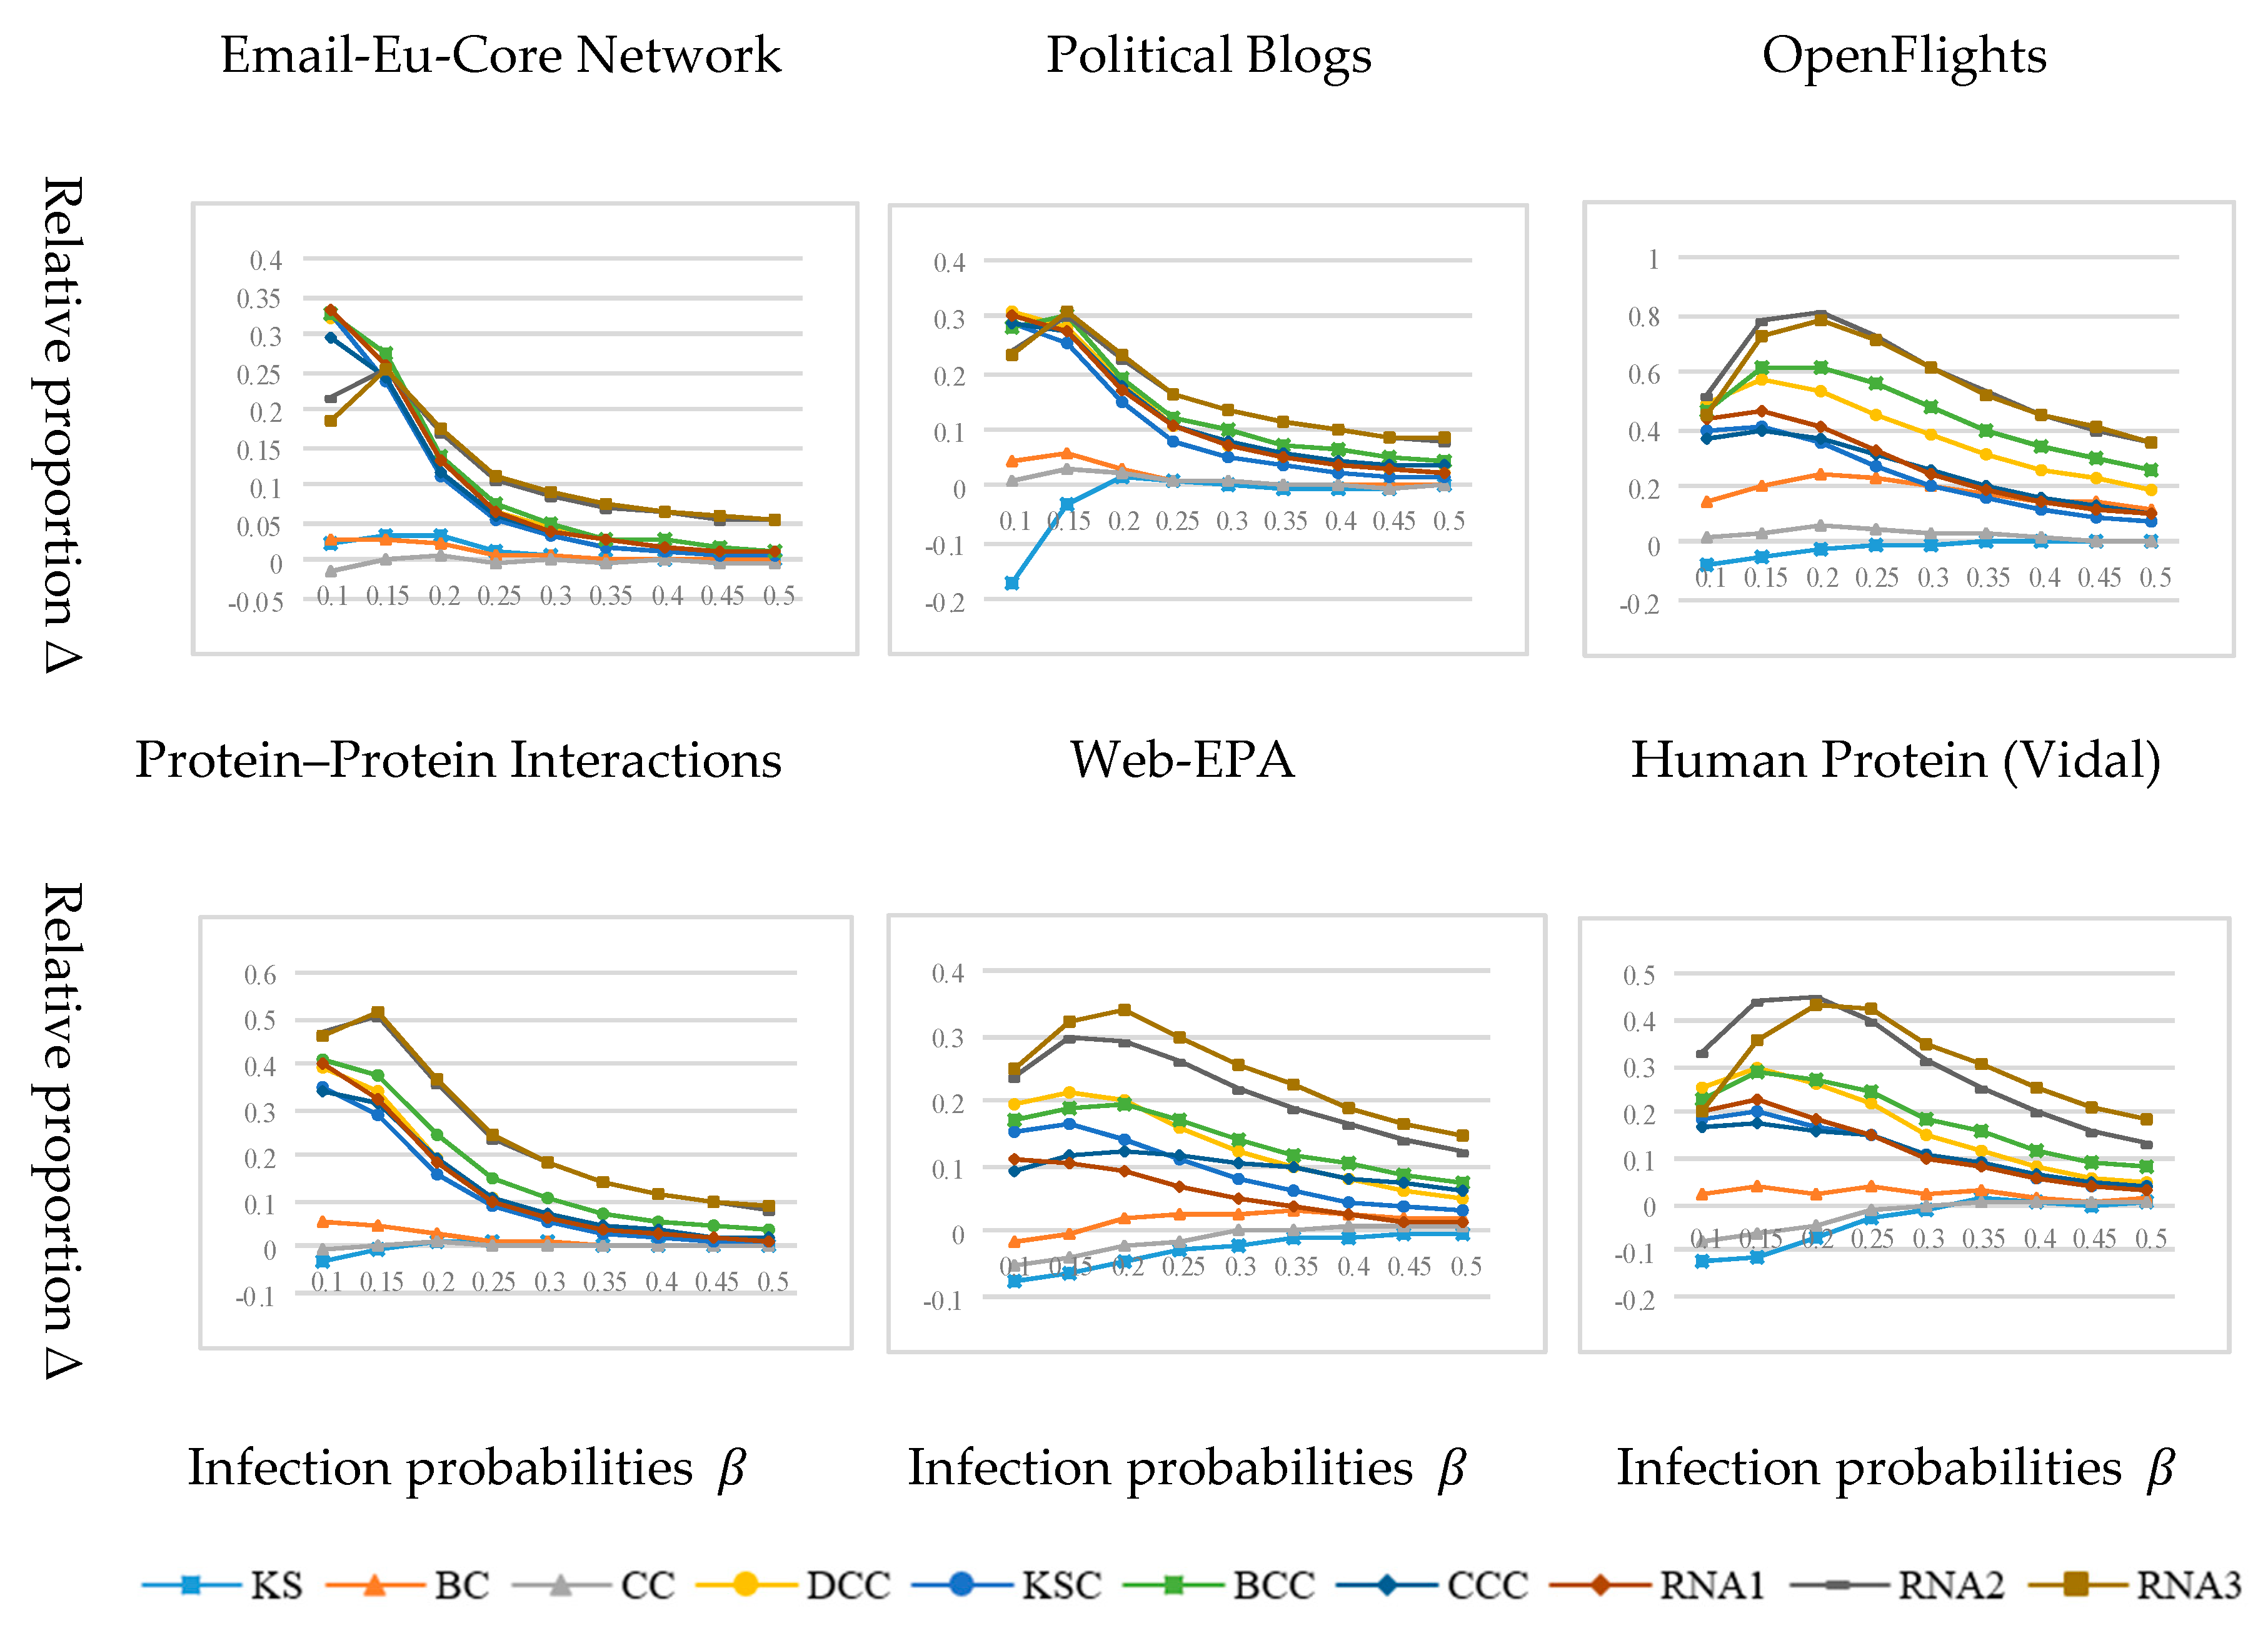
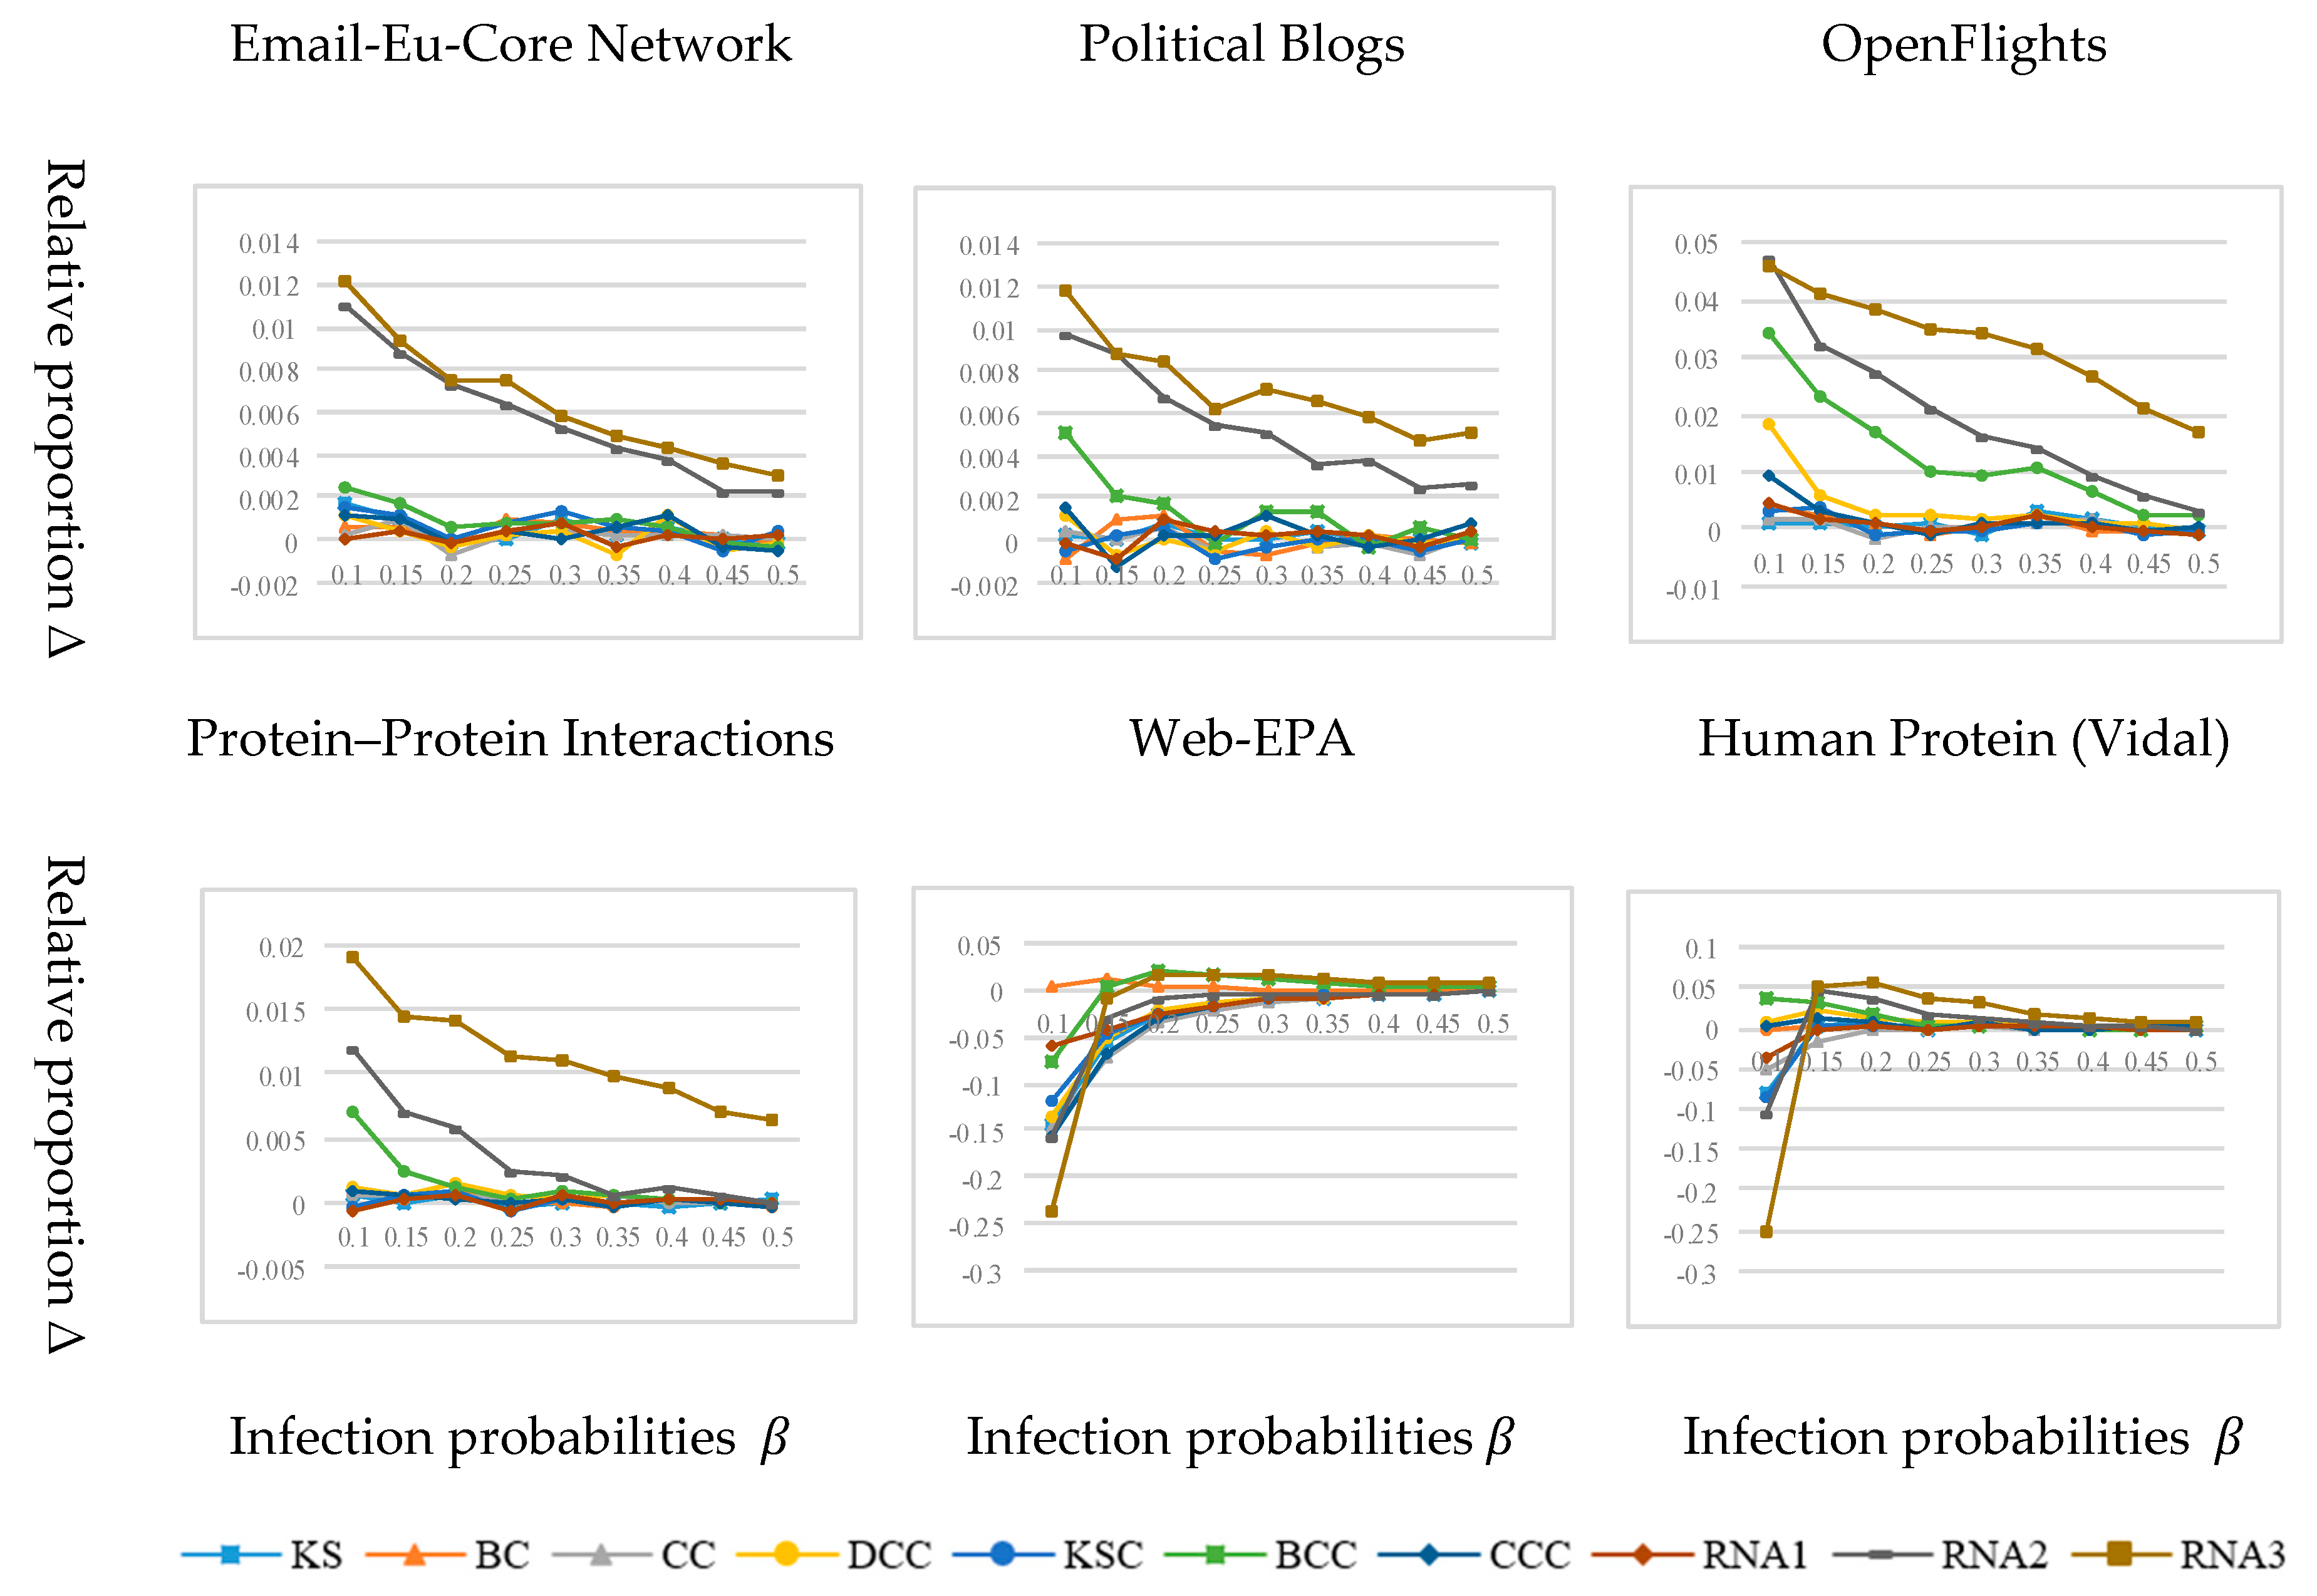
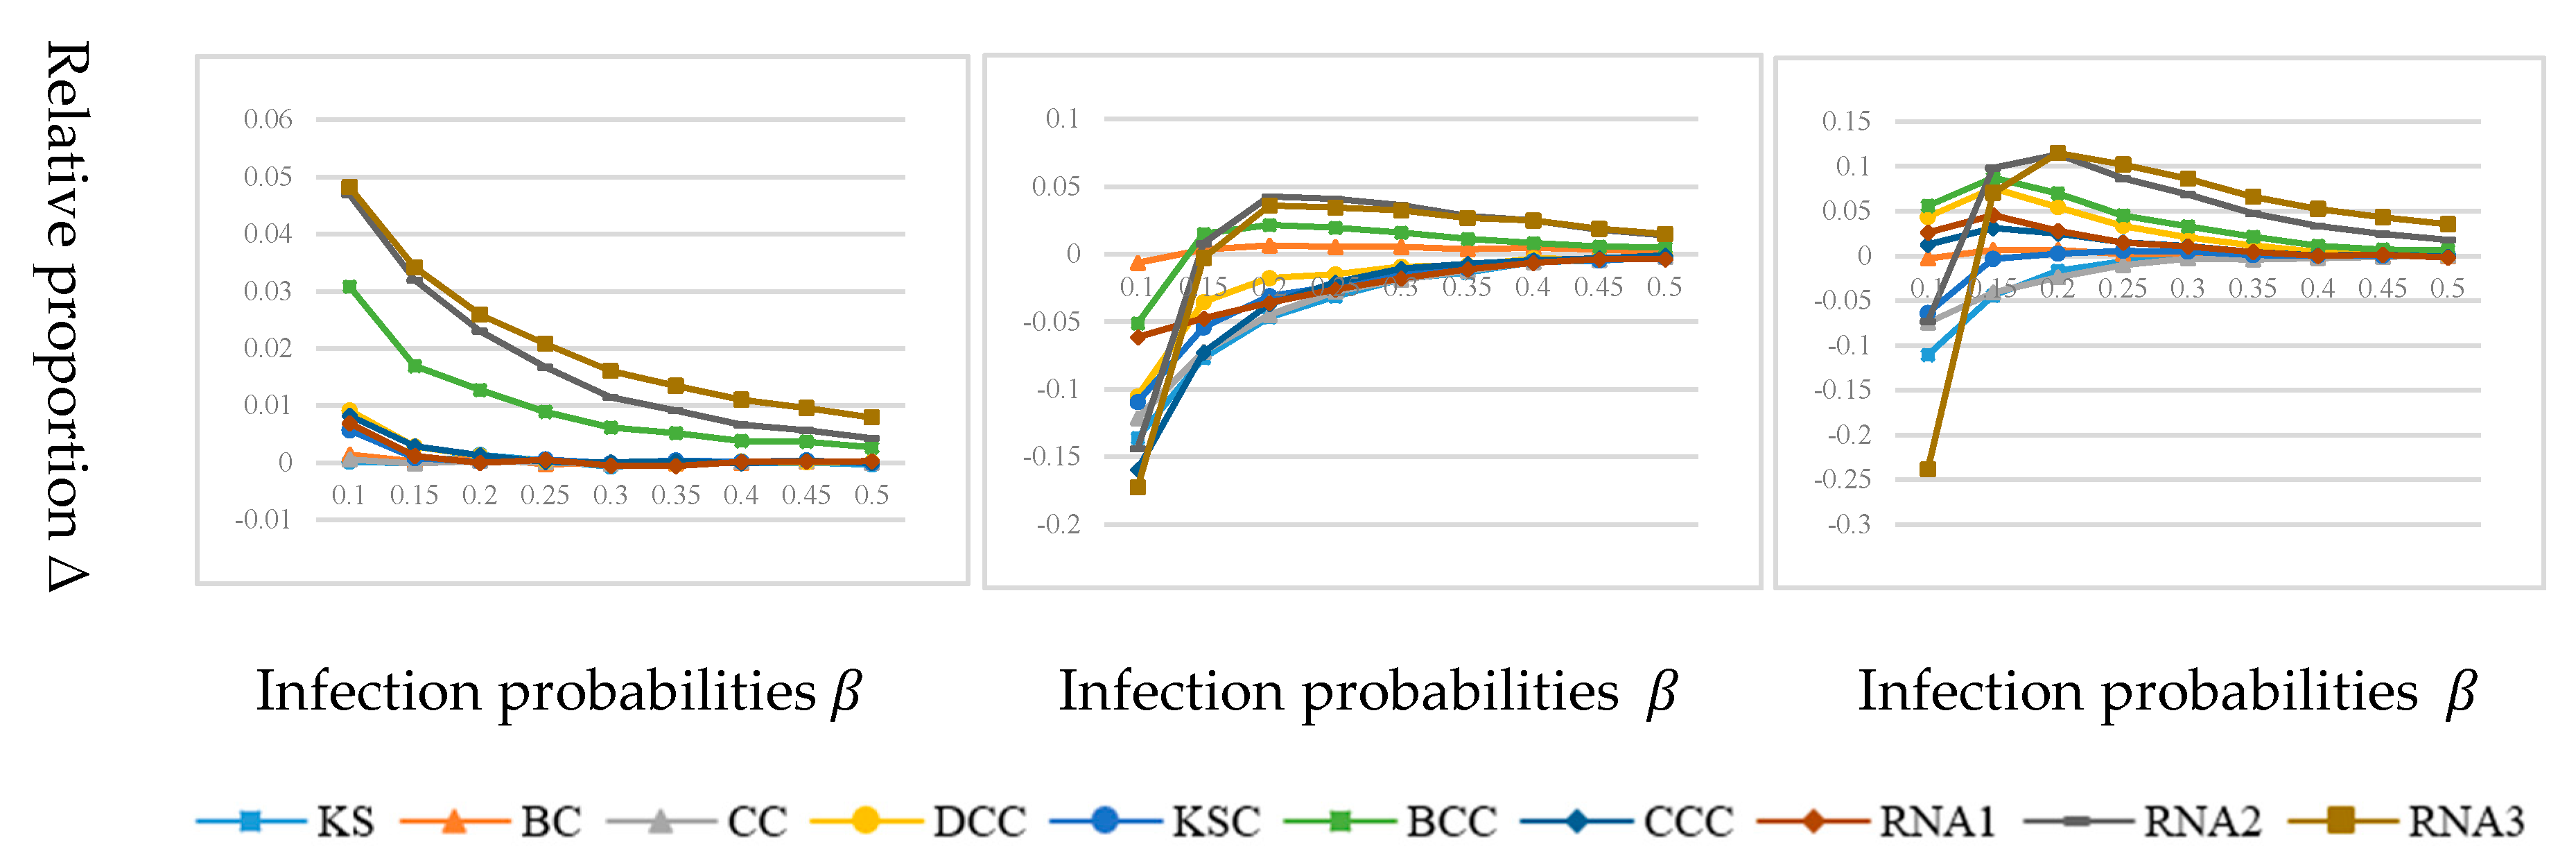
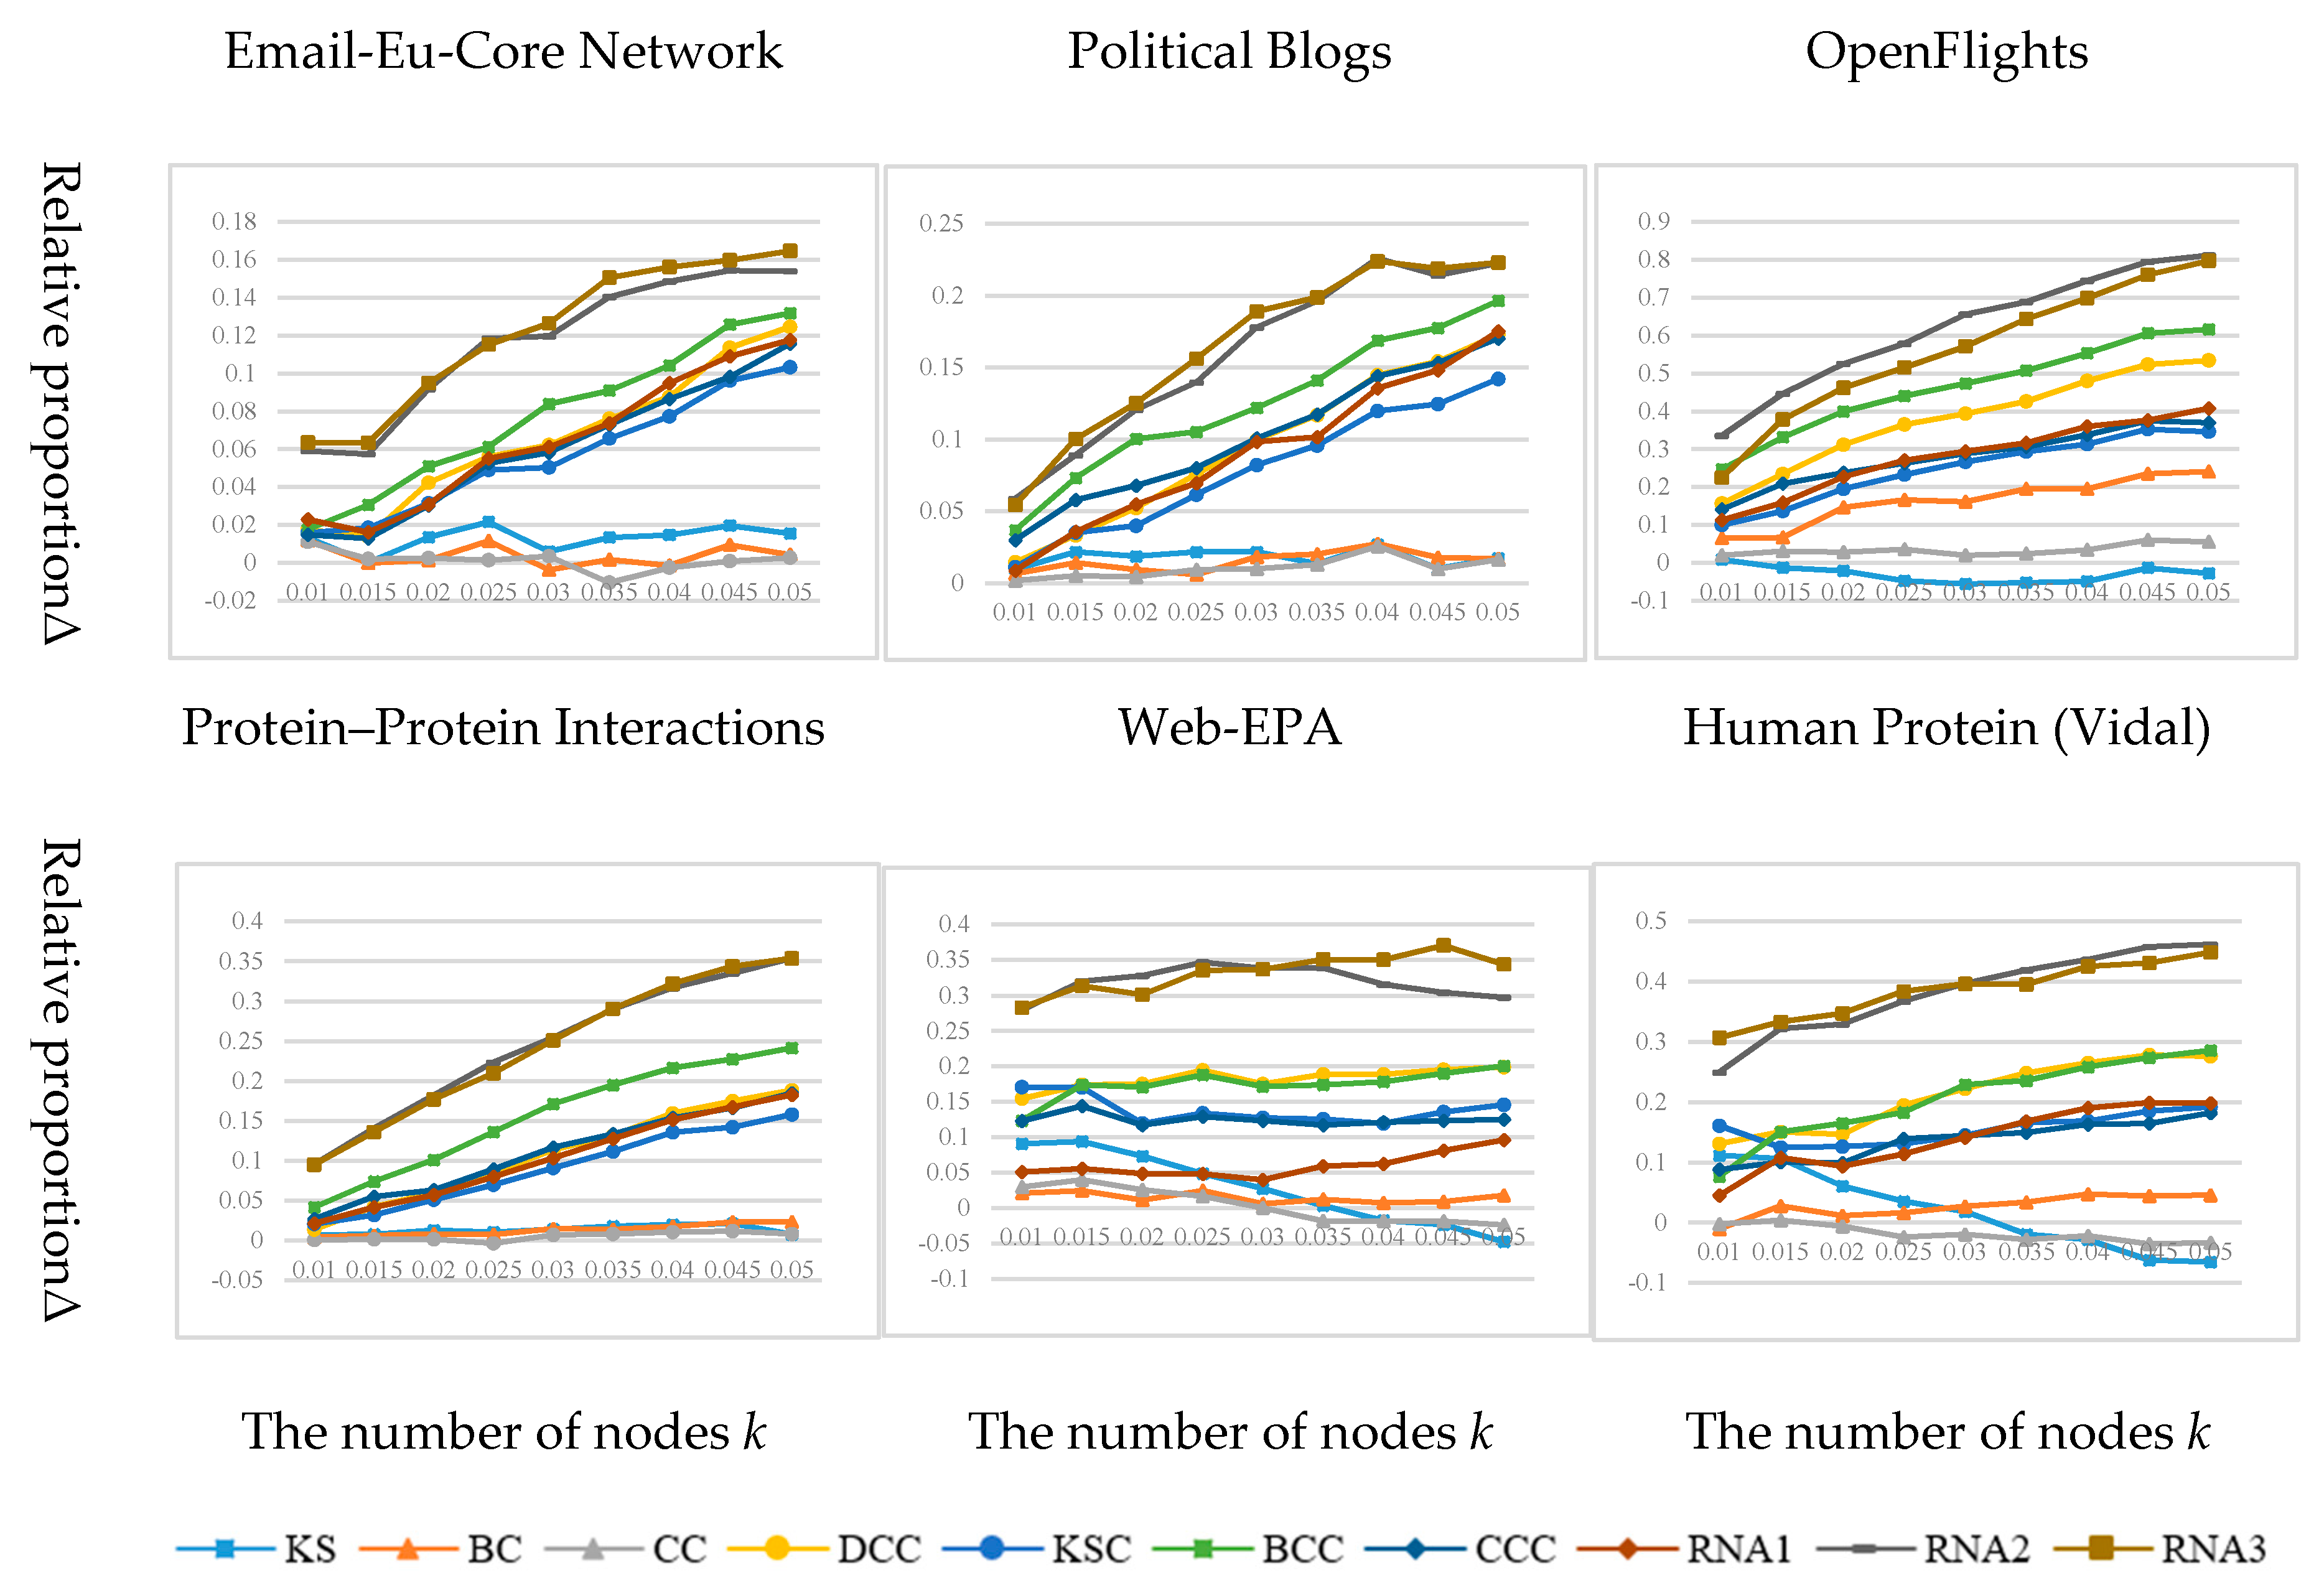
3.1. Evaluation Index

The key node set affects the propagation of the whole network information, therefore, it is necessary to evaluate the merit of the selected node set from the perspective of transmission. Kempe et al. proposed a general framework for maximizing influence, which considered the basic propagation model, in which each node could be active or not, and the trend of each node becoming active increased monotonously when its neighbors became active. If the propagation process started with a group of initially active nodes, then the influence of this group of nodes was the number of active nodes after the propagation process ended. Although such numerical results cannot be obtained by analysis, they can be accurately estimated by extensive simulation of the propagation process. Therefore, given the number of initial active nodes, the problem of influence maximization falls into maximizing the number of final active nodes.
In this paper, the classic epidemic propagation model, susceptible-infectious-recovered (SIR) model [27], is employed to verify the influence of key node set. It sets the node set identified by the key node set identification algorithm as infected state (I-state) and all other nodes as susceptible state (S-state). In the process of simulation propagation, the I-state nodes infect the S-state nodes with an infection probability of β every round. Meanwhile, the I-state nodes transform into removed state (R-state) nodes with a probability of γ. When there are no I-state nodes in the network, that is, all I-state nodes are transformed into R-state nodes, there is no infection behavior in the network, and the propagation process ends. At this time, the number of R-state nodes in the network indicate the network scope affected by the key node-set. In the actual process of network propagation, there are two specific implementations of single-point contact SIR and full-contact SIR. Their difference is whether I-state nodes of each round try to infect a single neighbor or all their neighbors. Full-contact SIR is more conducive to information transmission, while single-point contact SIR is more conducive to the analysis of transmission process. In this paper, both of the two SIR propagation models are analyzed in detail.
For the comparison algorithms, we selected the following two strategies: top- k and coloring. There are four different kinds of network centrality based on degree centrality, -shell, betweenness centrality, and closeness centrality. Top- k corresponds to the four algorithms of degree centrality (DC) [28], K-shell (KS) [25], betweenness centrality (BC) [29], and closeness centrality (CC) [30], respectively, and coloring corresponds to degree centrality coloring (DCC), K-shell coloring(KSC), betweenness centrality coloring (BCC), and closeness centrality coloring (CCC) algorithms [15], respectively.
In order to uniformly measure the difference of influence range of various algorithms on different datasets, the relative proportion of the influence range index marked as Δ is given as:
Δ = R i R D C R D C
where R i represents the number of final R state nodes in the network after the propagation simulation of a certain key node set recognition algorithm through the SIR model, that is, the network range affected by this key node set; R D C represents the network range ultimately affected by the top- k method based on degree centrality. The larger the Δ , the wider the propagation range of the node set identified by the algorithm.
In this paper, we measure the advantages and disadvantages of the key node set identification algorithms in influencing the network scope and also consider the differences in the propagation speed of different algorithms. The network propagation speed is defined as the ratio of the network range finally affected by a certain identification algorithm to the total number of rounds of network propagation, i.e., the average number of network nodes affected by each round of propagation, as shown in Equation (3):
v i = R i / t
To uniformly measure the difference of the propagation speed of various algorithms on different datasets, the relative proportional index of propagation speed δ is employed, as shown in Equation (4):
δ = v i v D C v D C
The propagation speed of different algorithms is compared with the Top- k method based on degree centrality. The larger the δ , the faster the influence propagation of the node set identified by the algorithm.
The above are the indicators that need to be compared in the key node set recognition task, where Δ and δ are used to measure the performance of key node sets identified by different algorithms in terms of network propagation range and speed, respectively.

3.2. Network Datasets

Considering the different attributes of actual networks in different application scenarios, in this paper, we selected different types of datasets of networks, including mail networks, blog networks, aviation networks, protein interaction networks, and Web networks. The dataset size was also considered and datasets of various scales were selected. At the same time, considering the possible impact of data sparsity on propagation, the selected datasets also have different data sparsity. Finally, we carry out a series of preprocessing on the determined dataset, including transforming the network into an undirected and unweighted network, taking the largest branch of the network as the experimental object, removing duplicated edges and self-edges, and deleting isolated nodes in the network.
The following datasets are employed for experiments:
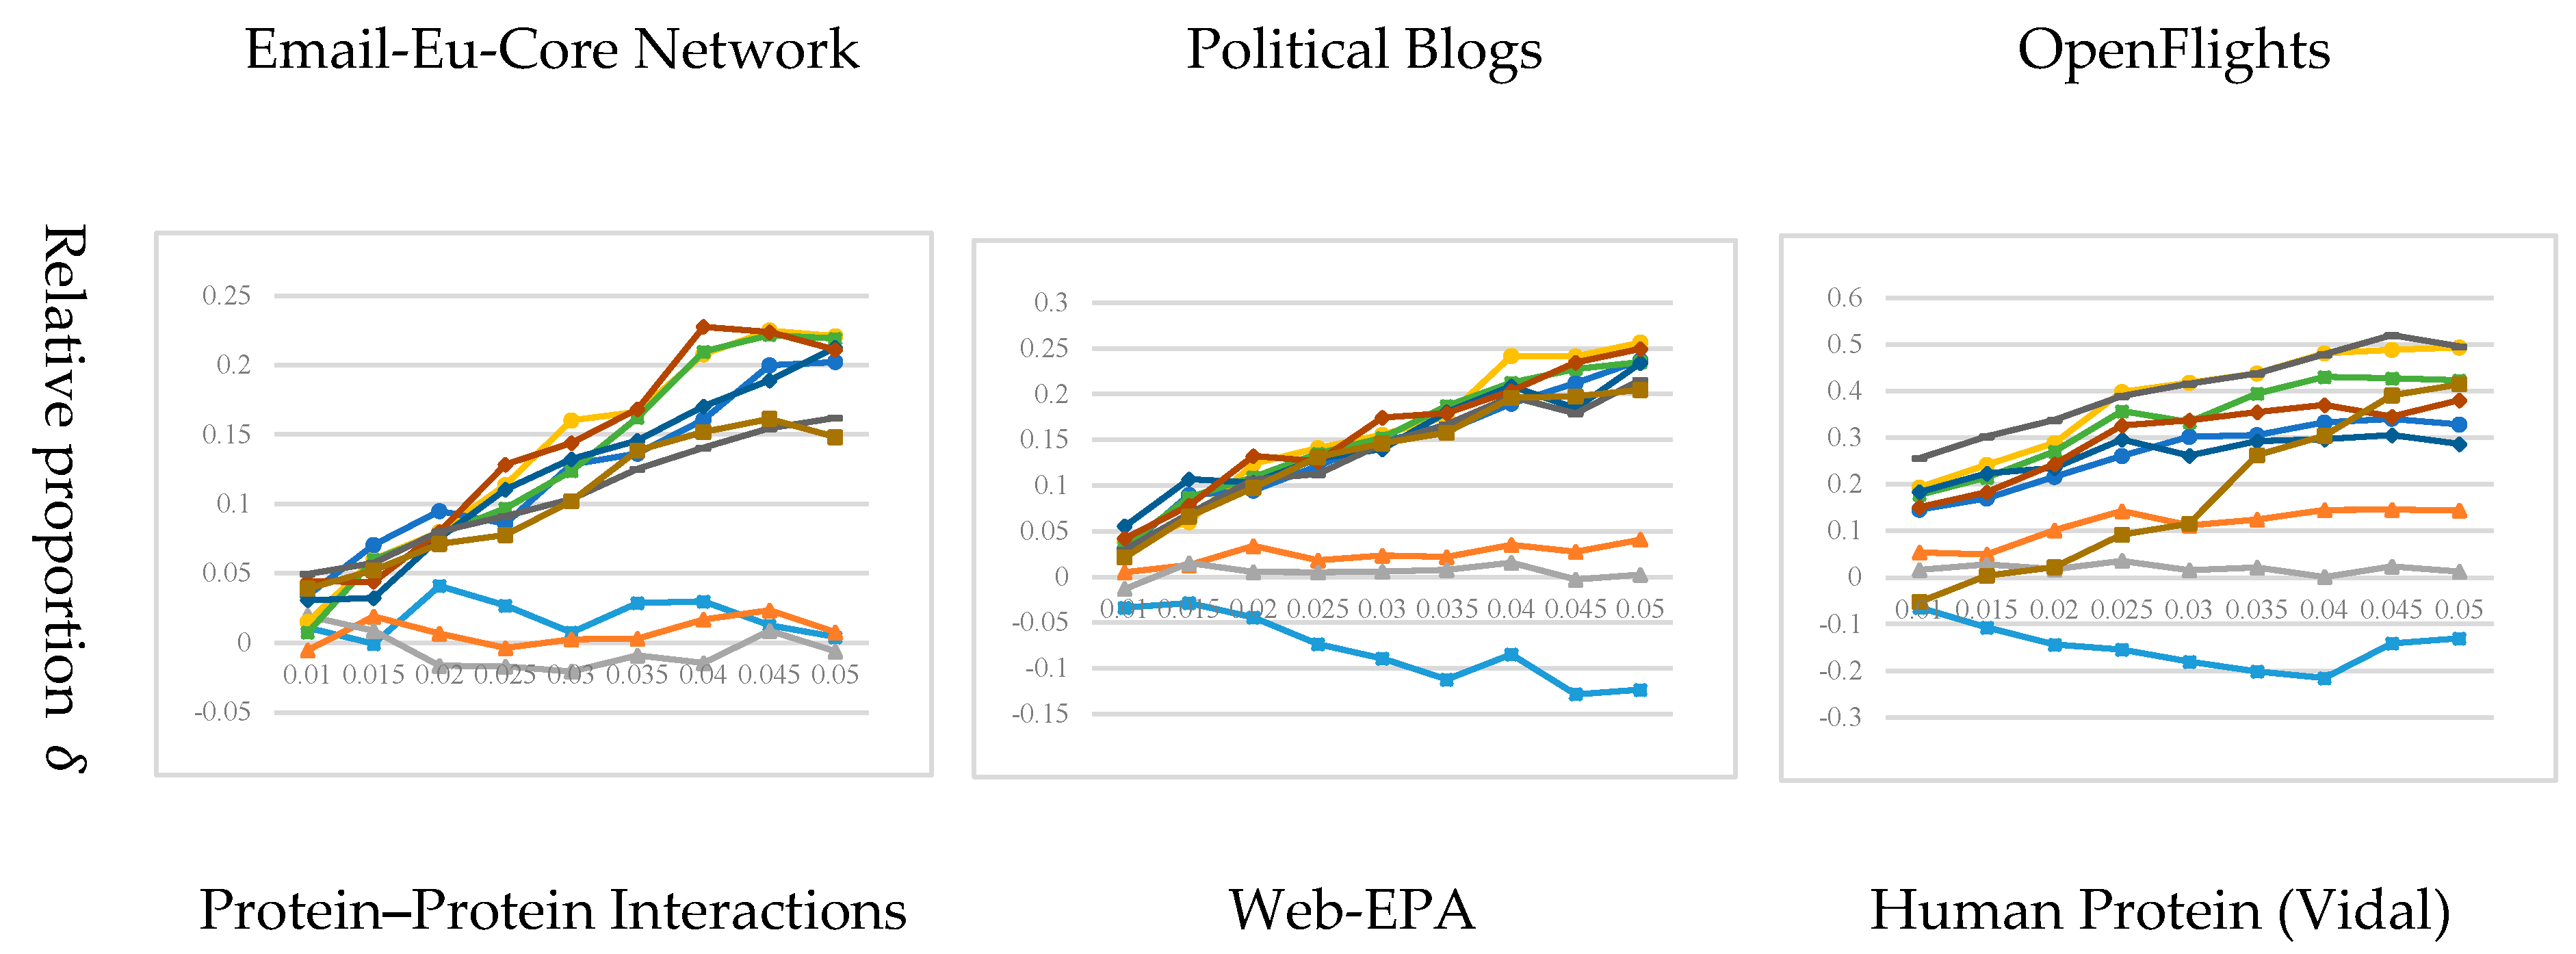
  • Email-Eu-Core Network [7] The dataset is generated using e-mail data from a large European research institution. If there is at least one e-mail exchange between the members of the two institutions, there is an edge in the network connecting the members of the two institutions. It merely contains the communication between the members of the organization and does not contain the communication information between the outside and the inside of the organization.
  • Political Blogs [31] The dataset is a hyperlink-oriented network between U.S. political blogs recorded by Adamic and Glance, in 2005.
  • OpenFlights [32] This dataset is extracted from the data of OpenFlights.org and corresponds to the network 14c in Tore Opsahl’s homepage dataset list. The network includes flights between airports around the world, and edges in the network indicate flights from one airport to another.
  • Protein–Protein Interaction [33] The network is a sub-network of human protein interaction network. The protein interaction network is a network of protein complexes formed by biochemical events or electrostatic forces, which can play unique biological functions as complexes. Nodes in the network represent proteins, whereas edges represent interactions between proteins.
  • Web-EPA [34] The dataset provides network data linked to www.epa.gov from a scientific network data warehouse called Network Repository, where nodes represent web pages and edges represent hyperlinks.
  • Human Protein (Vidal) [35] The network represents the initial version of the proteome scale map of human binary protein–protein interactions. Compared with the Protein–Protein Interactions network, the Human Protein (Vidal) network is sparser.
The topological properties of the network obtained after a series of pretreatments of the original network are shown in Table 1, which records the number of nodes, the number of edges, and the average degree of the network for each dataset.

3.3. Experimental Results and Analysis

On the basis of the SIR propagation model, the nodes identified by a key node set identification algorithm are set to I-state for propagation simulation, and the differences in propagation range and propagation speed between RNA and eight strategies such as DC, KS, BC, CC, DCC, KSC, BCC, and CCC are compared in turn. At the same time, considering the influence of the order of the rejection neighbor domain σ of RNA on node set selection, we assign the order of the rejection domain σ = 1, 2, and 3, corresponding to RNA1, RNA2, and RNA3, respectively.
The magnitude of the propagation influence is determined by many factors, including the implementation of the SIR model, infection probability β , removal probability γ , the initial number of nodes with I-state, etc. Therefore, in order to comprehensively consider various factors, we use the method of fixed parameters to carry out multiple groups of cross experiments. Simultaneously, each group of experiments was repeated 500 times independently to obtain the mean value to guarantee the reliability of the experimental results.
(1) The first group of experiments: The first group of experiments involved fixing the number of nodes in the key node set and comparing the relative proportion of transmission range of different algorithms with different infection probabilities.
There are two kinds of implementations for SIR, i.e., single-point contact SIR and full-contact SIR. Full-contact SIR tries to infect all its neighbors during each round of infection, and single-point contact SIR randomly infects one of its neighbors during each round of infection. Therefore, the full-contact SIR model is more conducive to the transmission of information, while a single-point contact SIR model is helpful to analyze the transmission process.
For the implementation of the single-point contact SIR model, the removal probability is specified as γ = 0.1 . We respectively select 1%, 3%, and 5% of the total number of network nodes as key node sets and take these nodes as I-state nodes in the SIR model. We observe the changes of the relative proportion that affect the network transmission range ( Δ ) under different infection probabilities ( β ). The experimental results are shown in Figure 2, Figure 3 and Figure 4.
As shown in Figure 2, Figure 3 and Figure 4, the RNA2 and RNA3 algorithms are superior to other compared algorithms, on the whole, under the single-point contact SIR model. There exist such cases when the probability of infection is low and the number of nodes is small (for example, the number of nodes in the node set is 1% and the infection probability is 0.1 in Figure 3), here, the RNA exhibits a slightly poor effect. This situation is caused by the fact that the single-point contact SIR model is not conducive to the rapid propagation of the network. At this time, if the number of nodes with I-state is small and relatively scattered, it leads to the end of the propagation behavior before it has spread, resulting in a small network propagation range and poor algorithm effect. With an increase of infection probability, we see that the RNA gets better and better than other algorithms. From these three groups of experiments, we found that if given more nodes in the key node-set, the RNA exhibits more obvious experimental effect. Therefore, considering different infection probabilities, the RNA presents good experimental results in terms of network propagation range based on the single-point contact SIR model.
For the implementation of the full-contact SIR model, the removal probability is specified as γ = 1 . We respectively select 1%, 3%, and 5% of the total number of network nodes as key node sets and take these nodes as I-state nodes in the SIR model. We observe the changes in the relative proportion that affect the network transmission range Δ under different infection probabilities β . The experimental results are shown in Figure 5, Figure 6 and Figure 7.
As can be seen from Figure 5, Figure 6 and Figure 7, based on the full-contact SIR model, the RNA2 and RNA3 algorithms are better than other algorithms in the experimental results on the four network datasets of Email-Eu-Core Network, Political Blogs, OpenFlights, and Protein–Protein Interactions. However, when the probability of infection is low, the experimental results of RNA on Web-EPA and Human Protein (Vidal) datasets are not satisfactory, because the two datasets are too sparse. As can be seen from Table 1, the average degree of the network is about 4, and the properties of this network are not conducive to propagation. Compared with other algorithms, it can be seen that the experimental results of most algorithms are not as good as DC when the infection probability is low. We conclude that, when the infection probability is low, the degree-based top-k algorithm in the sparse network is simple, but its effect on network propagation may be more obvious, and the simple algorithm may sometimes bring better experimental results. With an increase of infection probability, the RNA gradually shows its good transmission ability. Therefore, under full-contact SIR model and considering different infection probabilities, RNA shows good experimental results in terms of network propagation range.
(2) The second group of experiments: The second group of experiments involved fixing the infection probability and comparing the changes of the relative proportions of the propagation range of different algorithms recognizing different numbers of key nodes.
In the implementation of the single-point contact SIR model, we set infection probability β = 0.2 and removal probability γ = 0.1 , and in the implementation of the full-contact SIR model, β = 0.2 and γ = 1 are assigned. We take k = 1, 1.5, 2, 2.5, 3, 3.5, 4, 4.5, and 5% of the total number of network nodes as key node sets. In this experiment, we compare the changes in the relative proportion of node set propagation range Δ when different algorithms identify different numbers of key nodes. The experimental results are shown in Figure 8 and Figure 9.
As can be seen from Figure 8 and Figure 9, for both single-point contact SIR model and full-contact SIR model, when the infection probability β = 0.2 , the experimental results of the RNA2 and RNA3 algorithms for different numbers of key node sets identified on six real network datasets are far better than those of other algorithms, and the relative proportion of the propagation range presents an increasing trend. This shows that the RNA can identify more influential node sets that meet the requirements of node number when identifying key node sets with different node numbers. Therefore, the RNA achieves good experimental results in terms of network propagation range, whether under a single-contact SIR model or full-contact SIR model, after considering the identification of node-sets with different node numbers.
(3) The third group of experiments We employ different algorithms to identify key nodes of different number to compare the variations of the relative proportion in the propagation speed.
The information propagation under a full-contact SIR model converges rapidly, which is not conducive to analyze the propagation speed of key node sets. Therefore, in measuring the performance of different key node set identification algorithms in terms of propagation speed, simulation with a single-contact SIR model is under consideration. On the basis of the experiment in Figure 8, the number of rounds of the propagation process at the end of the propagation behavior is additionally counted. The propagation speed of each algorithm is calculated by using the propagation speed Equation in Section 3.1, and the relative proportion of network propagation speed δ is calculated accordingly. The experimental results are shown in Figure 10.
As can be seen from Figure 10, the experimental results of the RNA2 and RNA3 algorithms are pretty good with upper-middle level, especially when the rejection neighbor domain is 2 (namely RNA2), the advantages of RNA are particularly strong. Propagation speed reflects the number of S-state nodes infected by a node set in a unit infection round. Therefore, the RNA is competitive in propagation speed.
In summary, after considering the implementation of different SIR models, different infection probabilities, and the different initial number of nodes with I-state, the experiments prove that the RNA obtains an outstanding effect on the propagation influence range, as well as comparatively preferable propagation speed. Simultaneously, the comprehensive experiments based on the above network datasets also inspired us to consider that better experimental results could be attained when the order of rejection neighbor domain is set to 2 or 3.

4. Conclusions

Research on the influence maximization problem (IMP) in complex networks is an essential technique for supporting many kinds of practical applications. Because of budget constraints and the requirement for influence diffusion maximization, the process for selecting seed nodes for the IMP solution usually requires taking both influence and scattering degree of selected nodes into consideration.
In this paper, we proposed a two-step IMP solution called the RNA algorithm to fulfill these requirements. In the first step, we designed a refined network centrality measure called refined shell (RS) index to do node importance ranking. The RS indicator avoided the resolution limit of the k-shell decomposition. In the second step, we proposed a node selection approach called the reject neighbors algorithm (RNA) to filter out seed nodes from ranked nodes, which utilized the concept of reject neighbors to achieve the goal of decentralized node selection. We carried out a simulation experiment on six benchmark datasets and compared our algorithm’s performance with multiple commonly used IMP solutions. Experimental results and theoretical analysis showed that the RNA exhibited significant propagation capability and performed faster than compared approaches.
Because of the big social data boom, we have found that research on the IMP is still in its infancy and facing some essential challenges. The diversity of social networks, the incomplete knowledge of big data, and the network dynamics all raise new challenges for research on the IMP. In the context of big data, we believe that many more problems and challenges will show up from both theoretical and practical perspectives. For future research, in addition to network structure information, we believe that the precious information attached to nodes should be well used in the IMP solution.

Author Contributions

Conceptualization, D.C. and B.F.; methodology, B.F. and D.C.; software; validation, D.C. and D.W.; formal analysis, J.Y.; investigation, B.F.; resources, J.Y.; data curation, B.F.; writing—original draft preparation; writing—review and editing, X.H.; supervision, D.C.; project administration, D.C. and D.W.; funding acquisition, D.C. and D.W. All authors have read and agreed to the published version of the manuscript.

Funding

This work is partially supported by the Liaoning Natural Science Foundation under grant no. 20170540320, the Fundamental Research Funds for the Central Universities under grants no. N161702001, N2017010, and no. N172410005-2.

Conflicts of Interest

The authors declare no conflict of interest.

References

  1. Lü, L.; Chen, D.; Ren, X.; Zhang, Q.; Zhang, Y.-C.; Zhou, T. Vital nodes identification in complex networks. Phys. Rep. 2016, 650, 1–63. [Google Scholar] [CrossRef] [Green Version]
  2. De Arruda, G.F.; Barbieri, A.L.; Rodriguez, P.M.; Rodrigues, F.A.; Moreno, Y.; Costa, L.D.F. Role of centrality for the identification of influential spreaders in complex networks. Phys. Rev. E 2014, 90, 032812. [Google Scholar] [CrossRef] [PubMed] [Green Version]
  3. Domingos, P.; Richardson, M. Mining the network value of customers. In Proceedings of the Seventh ACM SIGKDD International Conference, San Francisco, CA, USA, 26–29 August 2001; pp. 57–66. [Google Scholar]
  4. Kempe, D.; Kleinberg, J.; Tardos, É. Maximizing the spread of influence through a social network. In Proceedings of the Ninth ACM SIGKDD International Conference, Washington, DC, USA, 24–27 August 2003; pp. 137–146. [Google Scholar]
  5. Thai, M.T.; Wu, W.; Xiong, H. Big Data in Complex and Social Networks; CRC Press: Boca Raton, FL, USA, 2016; pp. 1–242. [Google Scholar] [CrossRef]
  6. Peng, S.; Zhou, Y.; Cao, L.; Yu, S.; Niu, J.; Jia, W. Influence analysis in social networks: A survey. J. Netw. Comput. Appl. 2018, 106, 17–32. [Google Scholar] [CrossRef]
  7. Leskovec, J.; Kleinberg, J.; Faloutsos, C. Graph evolution. ACM Trans. Knowl. Discov. Data 2007, 1, 2. [Google Scholar] [CrossRef]
  8. Sancen-Plaza, A.; Mendez-Vazquez, A. Influence Maximization for Big Data Through Entropy Ranking and Min-Cut. In Proceedings of the 9th IEEE International Conference on Collaborative Computing: Networking, Applications and Worksharing, Austin, TX, USA, 20–23 October 2013; pp. 87–95. [Google Scholar]
  9. Roy, M.; Pan, I. Lazy Forward Differential Evolution for Influence Maximization in Large Data Network. SN Comput. Sci. 2020, 1, 1–6. [Google Scholar] [CrossRef] [Green Version]
  10. Chen, W.; Wang, C.; Wang, Y. Scalable influence maximization for prevalent viral marketing in large-scale social networks. In Proceedings of the 16th ACM SIGKDD International Conference, Washington, DC, USA, 24–28 July 2010; pp. 1029–1038. [Google Scholar]
  11. Li, Y.; Fan, J.; Wang, Y.; Tan, K.-L. Influence Maximization on Social Graphs: A Survey. IEEE Trans. Knowl. Data Eng. 2018, 30, 1852–1872. [Google Scholar] [CrossRef]
  12. Banerjee, S.; Jenamani, M.; Pratihar, D.K. A survey on influence maximization in a social network. Knowl. Inf. Syst. 2020, 62, 3417–3455. [Google Scholar] [CrossRef] [Green Version]
  13. Holme, P.; Kim, B.J.; Yoon, C.N.; Han, S.K. Attack vulnerability of complex networks. Phys. Rev. E 2002, 65, 056109. [Google Scholar] [CrossRef] [Green Version]
  14. Chen, W.; Wang, Y.; Yang, S. Efficient influence maximization in social networks. In Proceedings of the the 15th ACM SIGKDD International Conference, Paris, France, 28 June–1 July 2009; pp. 199–208. [Google Scholar]
  15. Zhao, X.; Huang, B.; Tang, M.; Zhang, H.; Chen, D.-B. Identifying effective multiple spreaders by coloring complex networks. EPL Europhys. Lett. 2014, 108, 68005. [Google Scholar] [CrossRef] [Green Version]
  16. Zhang, J.-X.; Chen, D.-B.; Dong, Q.; Zhao, Z.-D. Identifying a set of influential spreaders in complex networks. Sci. Rep. 2016, 6, 27823. [Google Scholar] [CrossRef]
  17. He, J.-L.; Fu, Y.; Chen, D.-B. A Novel Top-k Strategy for Influence Maximization in Complex Networks with Community Structure. PLoS ONE 2015, 10, e0145283. [Google Scholar] [CrossRef] [PubMed]
  18. Bao, Z.-K.; Liu, J.-G.; Zhang, H. Identifying multiple influential spreaders by a heuristic clustering algorithm. Phys. Lett. A 2017, 381, 976–983. [Google Scholar] [CrossRef]
  19. Lusseau, D.; Schneider, K.; Boisseau, O.J.; Haase, P.; Slooten, E.; Dawson, S.M. The bottlenose dolphin community of Doubtful Sound features a large proportion of long-lasting associations. Behav. Ecol. Sociobiol. 2003, 54, 396–405. [Google Scholar] [CrossRef]
  20. Stai, E.; Kafetzoglou, S.; Tsiropoulou, E.; Papavassiliou, S. A holistic approach for personalization, relevance feedback & recommendation in enriched multimedia content. Multimed. Tools Appl. 2016, 77, 283–326. [Google Scholar] [CrossRef]
  21. Bobadilla, J.; Ortega, F.; Hernando, A.; Gutierrez, A.; Ortega, F. Recommender systems survey. Knowl. Based Syst. 2013, 46, 109–132. [Google Scholar] [CrossRef]
  22. Pouli, V.; Kafetzoglou, S.; Tsiropoulou, E.; Dimitriou, A.; Papavassiliou, S.; Vasiliki, P. Personalized multimedia content retrieval through relevance feedback techniques for enhanced user experience. In Proceedings of the 13th International Conference on Telecommunications (ConTEL), Graz, Austria, 13–15 July 2015; pp. 1–8. [Google Scholar]
  23. Carmi, S.; Havlin, S.; Kirkpatrick, S.; Shavitt, Y.; Shir, E. A model of Internet topology using k-shell decomposition. Proc. Natl. Acad. Sci. USA 2007, 104, 11150–11154. [Google Scholar] [CrossRef] [Green Version]
  24. Dey, P.; Chaterjee, A.; Roy, S. Influence maximization in online social network using different centrality measures as seed node of information propagation. Sadhana 2019, 44, 205. [Google Scholar] [CrossRef] [Green Version]
  25. Kitsak, M.; Gallos, L.K.; Havlin, S.; Liljeros, F.; Muchnik, L.; Stanley, H.E.; Makse, H.A. Identification of influential spreaders in complex networks. Nat. Phys. 2010, 6, 888–893. [Google Scholar] [CrossRef] [Green Version]
  26. Zhou, S.; Mondragon, R. The Rich-Club Phenomenon in the Internet Topology. IEEE Commun. Lett. 2004, 8, 180–182. [Google Scholar] [CrossRef] [Green Version]
  27. Hethcote, H.W. The Mathematics of Infectious Diseases. SIAM Rev. 2000, 42, 599–653. [Google Scholar] [CrossRef] [Green Version]
  28. Wolfe, A.W. Social Network Analysis: Methods and Applications. Am. Ethnol. 1997, 24, 219–220. [Google Scholar] [CrossRef]
  29. Freeman, L.C. A Set of Measures of Centrality Based on Betweenness. Sociometry 1977, 40, 35. [Google Scholar] [CrossRef]
  30. Gullickson, T. Review of Social Network Analysis: A Handbook. Contemp. Psychol. 1993, 38, 655. [Google Scholar] [CrossRef]
  31. Adamic, L.A.; Glance, N. The political blogosphere and the 2004 U.S. election. In Proceedings of the 3rd International Workshop on Software Engineering for Parallel Systems, Amsterdam, The Netherlands, 1 November 2016; pp. 36–43. [Google Scholar]
  32. Opsahl, T.; Agneessens, F.; Skvoretz, J. Node centrality in weighted networks: Generalizing degree and shortest paths. Soc. Netw. 2010, 32, 245–251. [Google Scholar] [CrossRef]
  33. Livstone, M.; Breitkreutz, B.-J.; Stark, C.; Boucher, L.; Chatr-Aryamontri, A.; Oughtred, R.; Nixon, J.; Reguly, T.; Rust, J.; Winter, A.; et al. The BioGRID Interaction Database. Nat. Proc. 2011. [Google Scholar] [CrossRef]
  34. Rossi, R.A.; Ahmed, N.K. The network data repository with interactive graph analytics and visualization. In Proceedings of the Twenty-Ninth AAAI Conference on Artificial Intelligence, Austin, TX, USA, 25–30 January 2015; pp. 4292–4293. [Google Scholar]
  35. Rual, J.-F.; Venkatesan, K.; Hao, T.; Hirozane-Kishikawa, T.; Dricot, A.; Li, N.; Berriz, G.F.; Gibbons, F.D.; Dreze, M.; Ayivi-Guedehoussou, N.; et al. Towards a proteome-scale map of the human protein–protein interaction network. Nature 2005, 437, 1173–1178. [Google Scholar] [CrossRef] [PubMed]
Figure 1. Dolphin social network.
Mathematics 08 01313 g001
Figure 2. In the single-point contact susceptible-infectious-recovered (SIR) model, the relationship between Δ and β with 1% nodes in the key node set.
Mathematics 08 01313 g002
Figure 3. In the single-point contact SIR model, the relationship between Δ and β with 3% nodes in the key node set.
Mathematics 08 01313 g003
Figure 4. In the single-point contact SIR model, the relationship between Δ and β with 5% nodes in the key node set.
Mathematics 08 01313 g004
Figure 5. In full-contact SIR model, the relationship between Δ and β . with 1% nodes in key node set.
Mathematics 08 01313 g005
Figure 6. In full-contact SIR model, the relationship between Δ and β . with 3% nodes in key node-set.
Mathematics 08 01313 g006aMathematics 08 01313 g006b
Figure 7. In full-contact SIR model, the relationship between Δ and β with 5% nodes in key node set.
Mathematics 08 01313 g007
Figure 8. In the single-point contact SIR model, the relationship between Δ and k with β = 0.2 .
Mathematics 08 01313 g008
Figure 9. In the full-contact SIR model, the relationship between Δ and k with β = 0.2 .
Mathematics 08 01313 g009
Figure 10. In the single-contact SIR model, the relationship between δ and k with β = 0.2 .
Mathematics 08 01313 g010aMathematics 08 01313 g010b
Table 1. Datasets for verifying propagation influence.
DatasetsNodesEdges k
Email-Eu-Core Network98616,06432.5842
Political Blogs122216,71427.3552
OpenFlights290515,64510.7711
Protein–Protein Interactions385237,84119.6475
Web-EPA425388974.1839
Human Protein (Vidal)278366074.3169

