1. Introduction
Queueing theory is successfully applied in various fields of human activity for optimization of the consumption and scheduling certain restricted resources and provisioning the high quality of service. The overwhelming majority of the existing literature in this theory is devoted to the systems with homogeneous customers; see, e.g., [
1]. Because real-world customers are very often heterogeneous in many respects, new developments in the analysis of queues with heterogeneous customers are of great importance. The heterogeneity of the customers with respect to the required resources, level of service, and their economical or social value causes the necessity of the optimal management of their service. Such management can be implemented, e.g., in various generalizations of polling disciplines, processor sharing, applying versatile priority schemes. For some references, see, e.g., [
2]. Priority schemes assume the assignment of a certain priority to each class of customers and providing the advantage of access to the restricted resource (we will call this resource as a server) to available customers having the highest priority. Static priorities suggest that once the priorities are assigned, a low priority customer does not have any chance to start service until the server finishes service of all high priority customers presenting in the system. This may cause a low priority customer to wait in the queue much longer than the just arrived high priority customer. To avoid this evident unfairness to the low priority customers, dynamic priorities were taken into consideration. The dynamic priority assumes, e.g., that the low priority customers obtain the chance to start service in presence of high priority customers when: (i) the queue of the low priority customers exceeds some threshold values, see, e.g., [
3,
4,
5,
6]; or (ii) some relation between the queue lengths of priority and non-priority customers is fulfilled, see, e.g., [
7]; or (iii) a certain limit of the number of high priority customers that can overtake the low priority customers is exceeded, see, e.g., [
8]. The use of dynamic priorities allows to essentially improve the quality of the system operation. The shortcomings of such priorities are: (i) the necessity to permanently monitor the values of the queue length of different classes of customers what is not always possible (or costly) in some real-world systems and (ii) dependence of the waiting time of a concrete low priority customer on the rate of future arrival of other low priority customers. Another opportunity of providing more fair access to low priority customers is assumed in the models where a low priority customer can become higher priority customer after a certain period of waiting in the buffer. A currently popular model assumes that the low priority customers accumulate a priority during the stay in the queue. The accumulation of the priority may be described as some function, e.g., linear or piece-wise linear function, of the time spent by the customer in a queue. The rate of the increase of the priority may depend on the class to which the customer belongs. Such a type of model was considered, e.g., in the papers [
9,
10,
11,
12,
13,
14]. The main interest to the queues with accumulating priorities stems from their applicability to modeling operation of emergency departments of hospitals. Arriving customers (patients) are preliminarily sorted (triaged) into several groups according to the severity of the patient’s condition. However, during the waiting for treatment by the doctors, a state of health of some patient, which was initially classified as not requiring very urgent treatment, can become essentially worse and this patient has to be transferred to the group of very urgent patients. Because in the described situation the increase of the priority of a customer is not defined by some deterministic function of the elapsed waiting time, another type of model, with the randomized change of a priority, exists in the literature. This type of model was considered, e.g., in [
15,
16] and the recent paper [
17]. The table presenting the state of art in the analysis of queues with priority change after some random amount of time is presented in [
17]. It follows from that table that only a few papers consider the models where the arrival processes of customers of different types are not defined by the stationary Poisson arrival process, while it is already well recognized that the flows in many real systems and networks are poorly described by the stationary Poisson arrival process. The rare exceptions, when a more complicated arrival process is considered, are the papers [
18,
19,
20]. In all these papers, an arbitrary number of priority classes is suggested. In [
18], it is assumed that all the flows, except the flow having the highest priority, are described by the stationary Poisson arrival process. The arrival flow of customers having the highest priority is described by a much more general Markov arrival process (
); see, e.g., [
21,
22,
23] for more details. In [
19,
20], the arrival flow is described by even more general marked Markov arrival process (
). The
as the essential generalization of the
to the case of heterogeneous customers, was introduced in [
24]. The models with the
or
are much more difficult for analysis than the models with the stationary Poisson arrival process. This explains why only some bounds and tail distributions were obtained in [
18] and only the problem of establishing the ergodicity condition (but not the problem of computation of the stationary distribution of the system states and performance measures) is solved in [
19,
20]. The problem of computation of the stationary distribution of the system states is successfully solved in [
17] but only for two classes of customers. The advantage of our paper over [
17] is that we suggest any finite number
R of priority classes. The arrival process is described by the
. The system has a finite buffer and any arriving customer is admitted to the buffer if it is not full. If the buffer is full while some waiting customers have lower priority than the arriving customer, the arriving customer pushes out from the buffer a customer having the lowest priority among the presenting ones. During the stay in the buffer, after an exponentially distributed time, any customer can increase its priority. The service time has a phase-type distribution. After the service completion, the next service is provided for a customer with the highest priority among the presented in the buffer.
It is worth mentioning that the problem of assigning the priorities to different classes of customers is often closely related to the problem of the account of possible impatience of customers from different classes, e.g., if customers of two types are almost equally valuable for the system, the more impatient customers should be given higher priority (and the possibility to increase the priority during the waiting time in a buffer) to avoid the loss of the customer and possible starvation (and poor utilization) of the server in the future. In our model, we pay significant attention to the account of impatience.
Besides the above-mentioned popular model of treatment of patients in a hospital emergency department, we mention the following examples of potential applications of the considered model to the analysis and optimization of real-world systems.
- (1)
Let us consider the operation of an information transmission channel. Several kinds of information having approximately the same transmission times, but having different importance for the system and different tolerance to the delay are transmitted through this channel. Initially, the priorities can be assigned to the different types of information depending on their importance. However, to avoid the loss of low priority and delay-sensitive information units (and possible under-utilization of the channel in the future), it makes sense to allow a low priority information unit whose obsolescence time is almost expired to become a high priority information unit and receive the service soon.
- (2)
Let us consider the operation of a first aid station. The station has to accept the calls for help, categorize the urgency of the required help, and to manage the assignment of the necessary ambulance car for providing help, e.g., in the Republic of Belarus (as of 1 January 2020), there are three possible categories of the urgency of the required help.
- (a)
An emergency call—when a patient suddenly has diseases, conditions and (or) exacerbation of chronic diseases that pose a threat to the patient’s life and (or) others requiring emergency medical intervention;
- (b)
An urgent call is associated with a sharp deterioration in the patient’s health status when it is not possible to clarify the reasons for treatment;
- (c)
A less urgent call—when the patient suddenly has diseases, conditions, and/or exacerbation of chronic diseases without obvious signs of a threat to the patient’s life, requiring urgent medical intervention.
Accordingly, the emergency call has the highest priority, the urgent call has the middle priority, and the less urgent calls have the lowest priority. However, along with this categorization and establishing the priority in service, there exist strict standards for starting the provisioning of help. A dispatcher has to assign an ambulance car for providing help to patients before the fixed deadlines. In Minsk, the capital of the Republic of Belarus, these standards are fixed as four minutes for the emergency call, fifteen minutes for the urgent call, and sixty minutes for the less urgent call. Violation of this standard is punished. In this example, the service time can be interpreted as a time between the sequential release of ambulance cars. The service time essentially depends on the number of available cars and medical teams. The results of the analysis of the model given in our paper can be useful for the optimization of the work of the described first aid station via a proper choice of the number of ambulance teams to guarantee the required quality of service.
Methodological value of the paper consists of presenting a way for analysis of various transitions of a set of interacting Markov processes, which define the dynamics of the number of customers of several types in the system, caused by new customers of various types arrival, service completion, departure due to impatience, changing the priority, and pushing out the low priority customers in the case of the buffer overflow.
The organization of the text is as follows. In
Section 2, the mathematical model is described and graphically illustrated. The multi-dimensional Markov chain including as components the total number of customers in the system, the states of the underlying processes of customers arrival and service, and the number of customers of all types presenting in the system is defined in
Section 3. The set of matrices defining the probabilities or intensities of transitions of the number of customers of all types are given and the generator of the Markov chain is written down. Formulas for computation of the main performance measures of the system are presented in
Section 4. The numerical example illustrating the dependence of performance measures of the system on the capacity of the buffer is presented in
Section 5. The importance of account of a complicated pattern of arrival process and variance of the service time is demonstrated there.
Section 6 concludes the paper.
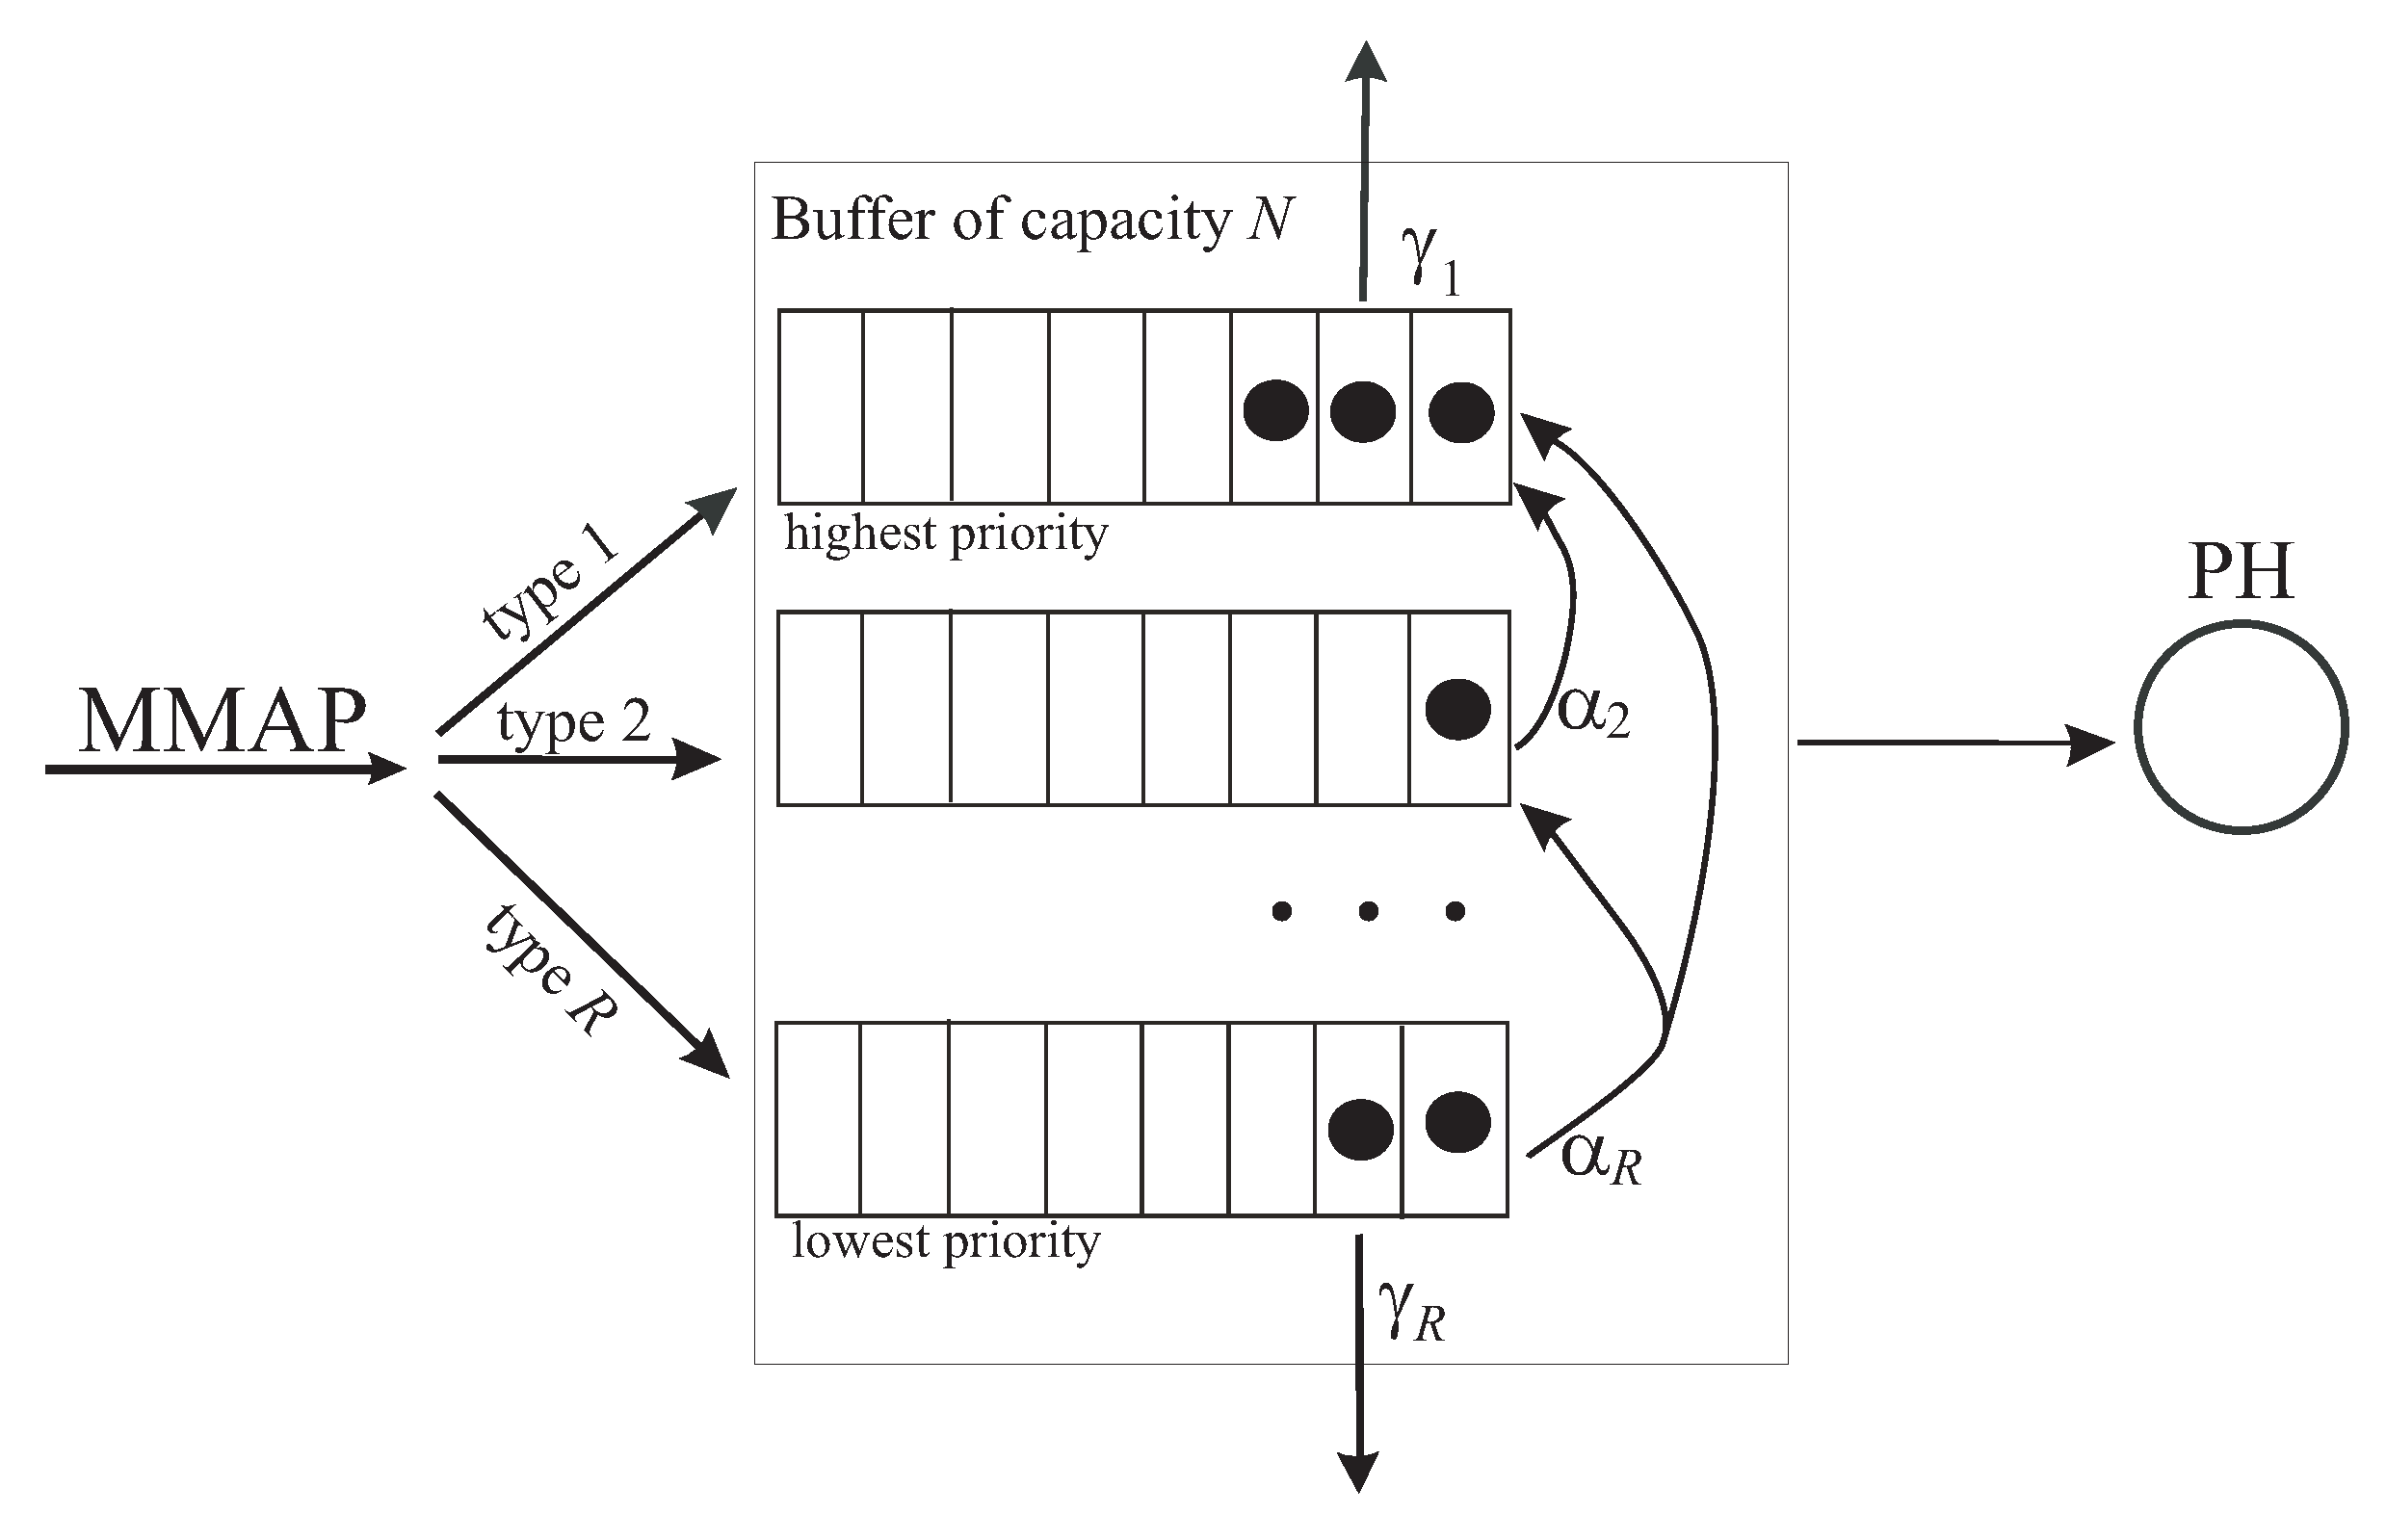
2. Mathematical Model
We consider a single-server queuing system where service is provided to
R types of customers. The structure of the system is presented in
Figure 1.
The customer arrival process is assumed to be defined by the
(see, e.g., [
24]). As the recent papers where the queuing models with the
are analyzed, we can mention, e.g., [
25,
26,
27].
Customer arrivals in the can occur at the moments of the transitions of the irreducible continuous-time Markov chain having a state space The is completely described by the square matrices Hereinafter, the denotation like means that the parameter r takes values
The matrix defines the transition intensities of the underlying process that lead to arrival of a type-r customer, The non-diagonal entries of the matrix define the transition intensities of the underlying process that do not lead to any arrival. The moduli of the diagonal entries of the matrix define the intensity of the the process departure of from its states. The matrix where is the generator of the underlying process.
The mean arrival rate is defined by where is the invariant probability row vector of the underlying process. This vector is computed as the unique solution for the finite system Hereinafter, denotes a column vector of appropriate size consisting of 1s and denotes a row vector consisting of zeroes.
The mean rate
of type-
r customers arrival is computed as
The squared coefficient of variation
of the intervals between successive arrivals is given by
The coefficient of correlation
of two successive intervals between arrivals is given by
The system has the finite common buffer space for storing the customers that arrive when the server is busy. The capacity of the buffer is Therefore, the total number of customers of all types, which can stay in the system simultaneously, is restricted by the number If a customer of any type arrives when the server is idle, the customer immediately starts processing by the server (service). If the server is busy but the buffer is not full, the customer of any type is placed into the buffer dedicated to this type of customers. There is no specific restriction on the capacity of the dedicated buffers, except that the total number of the customers staying in all these buffers always does not exceed the capacity
Customers of different types have different priorities. The priority defines the fate of the customer if it arrives when the buffer is full and the order of picking up the customers from the buffer when the server finishes service. We assume that type- customers have the non-preemptive priority over type-l customers, This means the following.
- (1)
If during the arrival of a type-r customer the server is busy and the number of customers in the buffer is N and there are no type- customers, the arriving customer is lost. If there are type- customers in the buffer then, with the probability the arriving customer is accepted to the buffer and one of the customers with the lowest priority among the presenting in the buffer is lost. With the complimentary probability the arriving customer is lost despite the presence in the system of customers with lower priority.
- (2)
Type-1 customers have the highest priority among all types of customers and if type-1 customers present in the buffer at a service completion epoch, one of these customers starts service, …, type R customers have the lowest priority. A customer of such a type has a chance to start service only if customers of types are absent in the buffer. Service of any customer cannot be preempted (interrupted) in the case of an arrival of a customer having a higher priority.
We assume that during the stay in the system, each customer of type- can increase its priority. It means that after exponentially distributed time with the parameter a type-r customer becomes a type-l customer with the probability independently of other customers. Here,
It is worth noting that more popular in the existing literature assumption is that only the head-of-the-line customer of each type can make a jump to the end of the queue of higher priority customers. We assume that each customer of any type can jump to higher priority class, independently of other customers. This means that not only the head-of-the-line customer has a clock counting the time till the jump, but each customer (not of the highest priority) has its own clock. Our assumption seems more realistic in some potential applications, e.g., health of any patient, not only the head-of-the-line patient in emergency department modeling example, can suddenly become worse. The same is true in applications where various information units become obsolete independently of the other units or different perishable foods have independent spoiling times. Note also, that, using the slight modification of some matrix blocks defined and constructed in the next section, the presented results can be extended to the models with the head-of-the-line customer priority jumps as well.
Customers staying in the buffer are impatient and can leave the system without service, independently of other customers, if the waiting time is too long. A type-r customer leaves the system without service after an exponentially distributed patience time with the parameter , Let us denote If the customer changes the priority, its patience time starts from the early beginning with the parameter corresponding to the new priority.
We assume that the service time of any type customer has a
distribution with the underlying Markov process
having a finite state space
and the irreducible representation
see, [
28]. We denote
The mean service time is given by
The mean service rate can be compute as
If during the service completion epoch there are customers in the buffer, the first customer among having the highest priority starts service. Otherwise, the server remains idle until the next arrival moment.
3. Process of the System States
The behavior of the system under study can be described by the regular irreducible continuous-time Markov chain
where, during the epoch
is the number of customers in the system,
is the state of the underlying process of the ,
• is the state of the underlying process of PH service process,
• is the number of type-r customers in the buffer,
To investigate the Markov chain let us enumerate its states in the direct lexicographic order of the components and , and in the reverse lexicographic order of the components
The most technically difficult and important part of the research is the analysis of the transitions of the process of the number of different type customers in the buffer. Let us firstly consider the process The process describes the transitions of the number of different types customers in the buffer when the total number of customers in the buffer is First, we present the algorithms for computing the set of the matrices that define the transition probabilities or transition intensities of the process at the moments of the changes, due to various reasons, of the components of this process when customers stay in the buffer.
Lemma 1. - (a)
Let be the matrix the entries of which define the intensities of transitions when some customer leaves the buffer due to impatience.
The matrices can be computed by the following way:
- 1.
Calculate the matrices using the recursive formulas: Here and after, I is the identity matrix and O is a zero matrix of an appropriate dimension;
- 2.
Calculate the matrices as
- (b)
Let be the matrix the entries of which define the intensities of transitions that occur when some customer increases its priority. Here, the matrix H defines the intensities of priorities increasing and has the following form: Calculation of the matrices can be performed as follows:
- 1.
Calculate the matrices which are obtained by deletion of first rows and columns from the matrix
- 2.
Calculate the matrices using the recursive formulas: where is the th entry of the matrix and is the number of rows of the matrix .
- 3.
Calculate the matrices using the recursive formulas: - 4.
Calculate the matrices and
- 5.
Calculate the matrices using the recursive formulas: - 6.
Calculate the matrices as
- (c)
Let be the matrix the entries of which define the transition probabilities at the moment when a new customer arrives to the system and the system capacity is not exhausted (there are customers in the buffer). Here, the row vector has the following form where is the probability that the arrived to the system customer has type-
Computation of the matrices can be performed as follows:
and where the matrices of block size are recursively computed as where the vectors are defined as
- (d)
Let be the matrix the entries of which define the transition probabilities at the moment when a customer with the maximal (among currently presenting in the system) priority is chosen for service.
The matrices can be computed as Here, is the binomial coefficient.
- (e)
Let the entries of the square matrix of size define the transition probabilities at the moment when a type-r customer arrives at the system when there are N customers in the buffer and the arriving customer tries to force out a customer with a lower priority from the buffer. All entries in each row of this matrix are equal to zero except one entry which is equal to 1. We assume that each row and column of the matrix correspond to some state of the process Note, that all states of the process are enumerated in the reverse lexicographical order of components . For example, the first row and column of the matrix correspond to the state , the second row and column correspond to the state ,…, the last row and column correspond to the state In the row of the matrix that corresponds to the state , the entry 1 is located in the column that corresponds to the same state only in the case if for all In this case, the arriving type-r customer is lost, because the customers with lower priority are absent in the buffer. If for some and is a maximum of such values then the entry 1 is located in the column that corresponds to the state In this case, the customer of type- has the lowest priority among the customers presenting in the system and an arriving type-r customer forces out one type- customer which departs from the system (is lost).
Proof. The derivation of the form of the matrices that describe the transitions of the process
is quite complicated and cumbersome. In derivations, we used some ideas of the paper [
29]. To explain the scheme of the derivation of the form of the presented matrices, we show here how to compute the matrices
the entries of which define the intensities of transitions of the components of the process
when some customer leaves the buffer due to impatience. The rest of the matrices that define the intensities of transition of the components of the process
can be obtained by the same way based on the careful account of possible transitions.
Computation of the matrices can be performed as follows. Let us introduce the matrices of the transition intensities of the components at the moment when there are n customers in the buffer and one of the customers leaves it due to impatience conditional on the fact that all customers have types where
It is clear, that for the matrices have the scalar form because all n customers are of type-R in this situation.
Let us consider the matrix
. This matrix defines the transition intensities of the components
at the moment when there are
n customers in the buffer and one of the customers leaves it due to impatience conditional on the fact that all customers have types
R or
Taking into account the reverse lexicographic order of components, by definition the first row of the matrix
corresponds to the state where all
n customers are of type-
, the second row corresponds to the state where
customers are of type-
and one customer is of type-
R, etc., the last row corresponds to the state where all
n customers are of type-
R. After the customer leaves the system, the number of customers in the buffer decreases by 1. Thus, the first column of the matrix
corresponds to the state where all
customers are of type-
, the second column corresponds to the state where
customers are of type-
and one customer is of type-
R, etc., the last column corresponds to the state where all
customers are of type-
R. Taking into account these considerations, it is easy to verify that the matrix
of size
has the form
or
Using the same reasonings, it can be shown that the matrix
of block size
has the following form
It is clear that the required matrices can be computed as
This proves the proposed formulas for computation of the matrices □
Remark 1. Derivation of the form of the matrices defined in Lemma 1 creates an opportunity to analyze not only the system under study in this paper but also many other queueing systems with a finite buffer and many types of customers having different priorities.
Let us introduce the following notation:
- •
⊗ and ⊕ indicate the symbols of the Kronecker product and sum of matrices, respectively, see [
30];
- •
- •
where denotes the diagonal matrix with the diagonal entries defined by the vector in the brackets;
- •
By analyzing all possible transitions of the Markov chain during an interval of infinitesimal length and rewriting the intensities of these transitions in the block matrix form, we obtain the following result.
Theorem 1. The infinitesimal generator Q of the Markov chain has the following block-tridiagonal structure The non-zero blocks are defined as follows: The Markov chain
is an irreducible and has a finite state space. Therefore, the stationary probabilities of the system states
always exist.
Let us form the row vectors of these probabilities which are enumerated in the reverse lexicographic order of the components and the direct lexicographic order of the components and
It is well known that the probability vectors
satisfy the following system of linear algebraic equations:
where
Q is the infinitesimal generator of the Markov chain
.
To compute the steady-state distribution of this Markov chain, it is necessary to solve system (1). The matrix of this system has the block-tridiagonal structure. Markov chains having the structure of the generator similar to the one defined in Theorem 1 are sometimes called in the existing literature as the Level-Dependent Quasi-Birth-and-Death processes; see, e.g., [
31]. System (1) is finite and can be directly solved via the use of the variety of the standard computer programs. However, the number of equations of the finite system (1) for queueing model under study can be large especially when the buffer capacity
N or the number of priority classes is large. Therefore, to effectively solve this system, it is desirable to apply an algorithm that exploits the sparse block-tridiagonal structure of the generator
Q. In particular, the algorithm given in [
32] can be recommended.
4. Performance Measures
The average number of customers in the buffer is
The average number
of type-
customers in the buffer can be computed as
The intensity of the output flow of successfully serviced customers is
The intensity of the output flow of customers who leave the buffer due to impatience is
The probability
of loss of an arbitrary customer is computed
The probability
of loss of an arbitrary customer due to impatience is computed
The intensity
of the output flow of the type-
customers who leave the buffer due to impatience is
where
is the row vector of size
R with all zero entries except the
r-th entry which is equal to
The average intensity
of the type-
customers transformation to the type-
r,
customers is computed as
The probability
of loss of an arbitrary type-
r customer due to impatience can be computed
Here, we assume that
The probability of an arbitrary type-
r customer loss upon arrival without trying to force out a customer with lower priority is
The probability of an arbitrary type-
r customer loss upon arrival despite an attempt to force out a customer with lower priority is
where the matrix
has all zero entries except the diagonal entries which are equal to the diagonal entries of the matrix
The probability of an arbitrary customer loss upon arrival is
The probability of an arbitrary type-
r customer loss upon arrival is
The probability that an arbitrary type-
r customer meets the full buffer upon arrival and forces out a customer with lower priority is
where the matrix
Let the square matrix of size define the transition probabilities of the process at the moment when a type-r customer arrives to the system when there are N customers in the buffer and the arriving customer forces out a type-l customer from the buffer. This matrix is defined by analogy with the matrix defined above. All entries in each row of this matrix are equal to zero except one entry which can be equal to 1. We assume that each row and column of the matrix correspond to some state of the process In the row of the matrix that corresponds to the state , the entry 1 is located in the column that corresponds to the state only in the case if for all and If this condition is false, all entries of this row are zero entries.
The intensity
of forcing out from the buffer type-
customers is
The probability
of the loss of an arbitrary customer due to forcing out is
The probability
of the loss of an arbitrary type-
customer due to forcing out is
5. Numerical Example
In this section, we illustrate the dependencies of some performance measures of the system on the buffer capacity N and show the poor quality of evaluation of the value of the loss probability via the following three simplifications of the model: (i) the arrival flow is assumed to be described not by the , but by the superposition of the stationary Poisson processes; (ii) the service time distribution is assumed to be not of a general phase-type, but exponential; (iii) the arrival flow is assumed to be the superposition of the stationary Poisson processes and the service time distribution is assumed to be exponential.
In this illustrative example, we consider a small information transmission device that is designed for transmission of four types of information. We assume that the distribution of the size of various types information units is the same. The information units of various types have different importance for the system and, correspondingly, have different priority. Let us assume that the arrivals of the units (customers) of different types are modeled by the
arrival process defined by the matrices:
It has the average arrival intensity the coefficient of correlation and the coefficient of variation The intensities of type-r customer arrivals are respectively.
The
service process is defined by the vector
and the sub-generator
The average service time is and the coefficient of variation is
The rest parameters are as follows:
Let us vary the buffer capacity N over the interval and calculate the main performance measures of the system. It is worth to note that capacity of the buffer not exceeding 25 is realistic in many real-world applications, e.g., in application for modeling emergency departments in a hospital, the number of waiting patients cannot be large because if this number grows, the ambulance cars will deliver new patients to other neighboring hospitals. In modeling the operation of an information transmission device, the capacity of the buffer can also be not very large due to fast obsolescence of the transmitted information.
For computations, we use a PC with an Intel Core i7-8700 CPU and 16 GB RAM, Mathematica 11.0. The computation time for all 25 different buffer capacities is about 15 min.
Figure 2 illustrates the dependence of the average number of customers in the buffer
and the average numbers
of type-
r customers in the buffer on the buffer capacity
As it is expected, the values
and
increase with the growth of the buffer capacity
Figure 3 illustrates the dependence of the average intensities
of type-
customers transformation to the type-
customers on the buffer capacity
All these intensities increase with the growth of the buffer capacity
N because the larger capacity of the buffer implies the longer stay of a customer in the buffer and, therefore, higher chances to increase the priority. The highest value of the intensity
among the values
is easily explained by the fact that about 45 percent of arriving customers are type-2 customers that can increase their priority only to type-1, a half of type-3 customers may increase the priority directly to type-1 and one third of type-4 customers may also increase the priority directly to type-1.
Figure 4 illustrates the dependence of the probability of an arbitrary customer loss upon arrival
and the probabilities of an arbitrary type-
customer loss upon arrival
on the buffer capacity
This figure confirms the intuitively clear fact that all these loss probabilities decrease with the growth of the buffer capacity.
Figure 5 illustrates the dependence of the probability
of the loss of an arbitrary customer due to forcing out and the probability
of the loss of an arbitrary type-
customer on the buffer capacity
The behavior of these probabilities for type-3 and type-4 customers is explained as follows. For small values of
these probabilities are small because there is a high probability that such customers are not admitted to the system at all (are lost at the entrance to the system). Then, when the buffer capacity
N increases, fewer customers of these types are lost at the entrance and, therefore, more customers are accepted to the buffer and are forced out by the high priority customers. After the buffer capacity
N reaches the values about 2 or 3, the probability that the high priority customers will meet full buffer essentially decreases and these customers have no need to force out type-3 and type-4 customers. Consequently, the probabilities
decrease when
N further increases.
Figure 6 illustrates the dependence of the probability
of the loss of an arbitrary customer due to impatience and the probability
of loss of an arbitrary type-
r customer due to impatience on the buffer capacity
When the buffer capacity increases, customers of all types spend more time in the buffer and are lost due to the impatience more frequently.
As it was announced above, one of the important goals of our numerical example is to demonstrate the poor quality of approximation of the value of the loss probability in the considered model with dynamically variable non-preemptive priorities by the value of the loss probability in more simple models coded below as and type priority models with the same rates of the arrival of different types of customers and the service rate. Using the model, one ignores that we assumed that the service time has the coefficient of variation not as the exponential distribution of the service time suggests. Using the model, one ignores that the inter-arrival times have the coefficient of correlation and the coefficient of variation not as the exponential distribution of inter-arrival times of different types of customers suggests. Using the model, one assumes a zero coefficient of inter-arrival times and the coefficient of variation of inter-arrival of all types of customers and the service times equal to 1.
Figure 7 illustrates the dependence of the probability
of the loss of an arbitrary customer on the buffer capacity
N for the considered
priority system and its particular cases coded as the
and
type systems.
One can see that the values of the loss probabilities computed for the approximating models are essentially smaller than the actual value. It is well known that queueing models with a finite buffer can help to solve the important problem of computing the required capacity N of the buffer, e.g., the problem of finding the minimum value of N such as the loss probability is less than 0.05 can be considered. Using the approximate value of this loss probability computed via the type system, one can compute that the buffer capacity is enough to guarantee the fulfillment of the inequality Using the approximate value of this loss probability computed via the type system, one can compute that the required buffer capacity is Using the approximate value of this loss probability computed via the type system, one can compute that the required buffer capacity is Furthermore, finally, if one properly accounts the values of the coefficients of correlation and variation via the use of the model, he/she obtains that the required buffer capacity is For and 9 the loss probability has values 0.1659179, 0.087093, and 0.081367, correspondingly, and is essentially larger than 0.05. Therefore, the simplified models give a quite poor estimation of the required capacity of the buffer.
6. Conclusions
We analyzed a quite general single-server queue with heterogeneous customers and a finite buffer. The arrival flow is defined by the what allows us to take into account the possible correlation of inter-arrival intervals of customers of different types. The service time distribution is of phase-type which allows to approximate more general distributions. Customers of various types have different impatience. It is assumed that the problem of assigning the non-preemptive priorities to different types of customers is solved in the assumption that during staying in the buffer customers can improve their priority. Presented above results allow computing the steady-state distribution of the system and the key performance measures of the system under any fixed set of the system parameters. This creates an opportunity for further use of the obtained results for the optimal scheduling of the flows (assigning the priorities and permissions to increase the priority) under any fixed cost criterion. The criterion may include, e.g., the profit gained via the service of different types of customers or the coefficient of utilization of the server and loss probabilities (rejection at the entrance of the system, pushing out by a high priority customer, leaving the system due to impatience) of different types of customers.
Results can be applied for optimization of the scheduling of: (i) information flows in communication networks where users are categorized into several groups according to their importance, in particular, possible damage caused by the loss or obsolescence of the corresponding information; (ii) patients with different degree of life threat in emergency departments; (iii) perishable goods and foods in warehouses, etc. As future directions of generalization of the considered model we can mention the account of possibility of different distribution of service time for different types of customers and possibility of unreliable service of customers similar to [
33].

