An Elderly Health Monitoring System Using Machine Learning and In-Depth Analysis Techniques on the NIH Stroke Scale


Abstract
1. Introduction
2. Materials and Methods
2.1. Stroke Disease of the Elderly
2.2. Research Subjects and Methods
2.3. Machine Learning in Stroke Analysis and Disease Prediction
3. A Stroke Severity Prediction and In-Depth Analysis System Using NIHSS
- Elderly users of stroke severity prediction and in-depth analysis applications collect real-time NIHSS data using various healthcare devices. The collected NIHSS data is transmitted to the medical network server through a wired or wireless communication network.
- The medical data server updates in real-time the NIHSS data collected by individual patients. In addition, the individual NIHSS data and health medical examination information are saved and transmitted to the health-screening information collection in the repository.
- Individual health screening and NIHSS data stored in the database of health screening data collection should be updated after filtering outlier or missing values. The data collected and stored in the database of health screening data collection is transmitted, in real-time, to the individual patient shared authentication module.
- The patient data and information collected at the medical center repository are forwarded to a module that generates a stroke severity learning model. Stroke severity learning model using NIHSS data analyzes patient-specific NIHSS data collected in real-time to determine the severity of stroke risk. In addition, to predict and analyze more accurate and faster stroke severity, important features in the medical center repository are selected or reduced, to ensure optimal prediction accuracy.
- The stroke severity learning and prediction model of the present system can select various machine learning algorithms and perform learning repeatedly. We also provide models that provide optimal prediction accuracy and analysis information through repetitive learning and performance verification.
- When NIHSS data collected in real-time is executed in the predictive model, it is possible to determine the severity of stroke and in-depth analysis information. In addition, the stroke severity prediction value and analysis information is provided to the system administrator. System administrators can provide alarms for stroke risk to patients and their families.
- In general, machine learning is a mechanism that generates a prediction model through random learning, and classifies and predicts real-time stroke severity by class using actual data. In this system, semantic analysis and in-depth analysis algorithms, such as the C4.5 decision tree, Bayesian, logistic regression, and random forest, which are represented by an analytical model rather than a black box of machine learning, can be utilized.
- Stroke severity management and monitoring server in the cloud-based environment receives the prediction and in-depth analysis of the severity for each patient. In addition, the stroke severity value and the analysis information are transmitted to the patient and the medical doctor, to execute an alarm application for emergency situations.
4. Experiment and Analysis
4.1. Experimental Environment and Considerations
4.2. An In-Depth Analysis on the Stroke Severity Using Machine Learning
5. Conclusions
Author Contributions
Funding
Conflicts of Interest
References
- Statistics Korea. The Cause of Death Statistics in Koreans. Available online: Kosis.kr/eng/statisticsList/statisticsListIndex.do?menuId=M_01_01&vwcd=MT_ETITLE&parmTabId=M_01_01#SelectStatsBoxDiv (accessed on 25 June 2020).
- Racosta, J.M.; Guglielmo, D.; Klein, F.R.; Riccio, P.M.; Giacomelli, F.M.; Toledo, M.E.G.; Cassará, F.P.; Tamargo, A.; Delfitto, M.; Sposato, L.A. Stroke severity score based on six signs and symptoms the 6 score—A simple tool for assessing stroke severity and in-hospital mortality. J. Stroke 2014, 16, 178–183. [Google Scholar] [CrossRef][Green Version]
- Lee, H.J.; Lee, J.S.; Choi, J.C.; Cho, Y.; Kim, B.J.; Bae, H.; Kim, D.; Ryu, W.; Cha, J.; Kim, D.H.; et al. Simple estimates of symptomatic intracranial hemorrhage risk and outcome after intravenous thrombolysis using age and stroke severity. J. Stroke 2017, 19, 229–231. [Google Scholar] [CrossRef] [PubMed]
- Sengupta, A.; Rajan, V.; Bhattacharya, S. A statistical model for stroke outcome prediction and treatment planning. In Proceedings of the IEEE 38th Annual International Conference of the Engineering in Medicine and Biology Society (EMBC), Orlando, FL, USA, 16–20 August 2016; pp. 2516–2519. [Google Scholar]
- Zhang, Q.; Xie, Y.; Ye, P.; Pang, G. Acute ischaemic stroke prediction from physiological time series patterns. J. Australas. Med. 2013, 6, 280–286. [Google Scholar] [CrossRef] [PubMed]
- Chien, K.L.; Su, T.C.; Hsu, H.C.; Chang, W.T.; Chen, P.C.; Sung, F.C.; Chen, M.F.; Lee, Y.T. Constructing the prediction model for the risk of stroke in a Chinese population. Am. Heart Assoc. 2010, 41, 1858–1864. [Google Scholar] [CrossRef]
- Brott, T.; Adams, H.P.; Olinger, C.P.; Marler, J.R.; Brasan, W.G.; Biller, J.; Spilker, J.; Holleran, R.; Eberle, R.; Hertzberg, V. Measurements of acute cerebral infarction: A clinical examination scale. Am. Heart Assoc. 1989, 20, 864–870. [Google Scholar] [CrossRef] [PubMed]
- Lyden, P.; Brott, T.; Tilley, B.; Welch, K.M.; Mascha, E.J.; Levine, S.; Haley, E.C.; Grotta, J.; Marler, J. Improved reliability of the NIH Stroke Scale using video training: NINDS TPA stroke study group. Am. Heart Assoc. 1994, 25, 2220–2226. [Google Scholar] [CrossRef] [PubMed]
- Meyer, B.C.; Lyden, P.D. The modified National Institutes of health stroke scale: Its time has come. J. Stroke 2009, 4, 267–273. [Google Scholar] [CrossRef]
- Schlegel, D.; Kolb, S.J.; Luciano, J.M.; Tovar, J.M.; Cucchiara, B.L.; Liebeskind, D.S.; Kasner, S.E. Utility of the NIH stroke scale as a predictor of hospital disposition. Am. Heart Assoc. 2003, 34, 134–137. [Google Scholar] [CrossRef]
- Yu, J.; Kim, D.; Park, H.; Chon, S.; Cho, K.H.; Kim, S.; Yu, S.; Park, S.; Hong, S. Semantic analysis of NIH stroke scale using machine learning techniques. In Proceedings of the 2019 International Conference on Platform Technology and Service (PlatCon), Jeju, Korea, 28–30 January 2019; pp. 82–86. [Google Scholar]
- Lai, S.M.; Duncan, P.W.; Keighley, J. Prediction of functional outcome after stroke: Comparison of the orpington prognostic scale and the NIH stroke scale. Am. Heart Assoc. 1998, 29, 1838–1842. [Google Scholar] [CrossRef]
- Powers, D.W. Assessment of the stroke patient using the NIH stroke scale. Emerg. Med. Serv. 2001, 30, 52–56. [Google Scholar]
- Shrestha, S.; Poudel, R.S.; Khatiwada, D.; Thapa, L. Stroke subtype, age, and baseline NIHSS score predict ischemic stroke outcomes at 3 months a preliminary study from Central Nepal. J. Multidiscip. Healthc. 2015, 8, 443–448. [Google Scholar] [CrossRef] [PubMed]
- Sartor, E.A.; Albright, K.; Boehme, A.K.; Morales, M.M.; Shaban, A.; Grotta, J.C.; Savitz, S.I.; Martin, S. The NIHSS score and its components can predict cortical stroke. J. Neurol. Disord. Stroke 2013, 2, 73–78. [Google Scholar]
- Wolf, P.A.; D’Agostino, R.B.; Belanger, A.J.; Kannel, W.B. Probability of stroke: A risk profile from the Framingham study. Am. Heart Assoc. 1991, 22, 312–318. [Google Scholar] [CrossRef] [PubMed]
- D’Agostino, R.B.; Vasan, R.S.; Pencina, M.J.; Wolf, P.A.; Cobain, M.; Massaro, J.M.; Kannel, W.B. General cardiovascular risk profile for use in primary care. Am. Heart Assoc. 2008, 6, 743–753. [Google Scholar] [CrossRef]
- Jee, S.H.; Park, J.W.; Lee, S.Y.; Nam, B.H.; Ryu, H.G.; Kim, S.Y.; Kim, Y.N.; Lee, Y.; Choi, S.M.; Yun, J.E. Stroke risk prediction model: A risk profile from the Korean study. J. Atheroscler. 2008, 197, 318–325. [Google Scholar] [CrossRef] [PubMed]
- Wang, T.J.; Massaro, J.M.; Levy, D.; Vasan, R.S.; Wolf, P.A.; D’Agostino, R.B.; Larson, M.G.; Kannel, W.B.; Benjamin, E.J. A risk score for predicting stroke or death in individuals with new-onset atrial fibrillation in the community: The framingham heart study. JAMA Netw. 2003, 290, 1049–1056. [Google Scholar] [CrossRef] [PubMed]
- Wang, S.; Zhang, J.; Lu, W. Sample size calculation for the proportional hazards model with a time-dependent covariate. Comput. Stat. Data Anal. 2014, 74, 217–227. [Google Scholar] [CrossRef]
- Barrett-Connor, E.; Cox, D.A.; Song, J.; Mitlak, B.; Mosca, L.; Grady, D. Raloxifene and risk for stroke based on the Framingham stroke risk score. Am. J. Med. 2009, 122, 754–761. [Google Scholar] [CrossRef]
- Carroll, K.J. On the use and utility of the Weibull model in the analysis of survival data. J. Control. Clin. Trials 2003, 24, 682–701. [Google Scholar] [CrossRef]
- Kannel, W.B.; McGee, D.L.; Castelli, W.P. Latest perspectives on cigarette smoking and cardiovascular disease. J.Card. Rehabil. 1984, 4, 267–277. [Google Scholar]
- Antithrombotic Trialists′ Collaboration. Collaborative meta-analysis of randomised trials of antiplatelet therapy for prevention of death, myocardial infarction, and stroke in high risk patients. BMJ 2002, 324, 71–86. [Google Scholar] [CrossRef] [PubMed]
- Ay, H.; Furie, K.L.; Singhal, A.; Smith, W.S.; Sorensen, A.G.; Koroshetz, W.J. An evidence-based causative classification system for acute ischemic stroke. Am. Neurol. Assoc. 2005, 58, 688–697. [Google Scholar] [CrossRef] [PubMed]
- National Health Insurance Service (NHIS). Available online: www.nhis.or.kr/retrieveHomeMain.xx (accessed on 25 June 2020).
- Lee, J.S.; Park, J.M.; Lee, T.H.; Lee, K.B.; Cho, S.J.; Han, Y.J.; Bae, M.K.; Lee, H.J.; Lee, J.Y. Development of a stroke prediction model for Korean. Korean Neurol. Assoc. 2010, 28, 13–21. [Google Scholar]
- American Heart Association. Available online: www.heart.org/en/health-topics/high-blood-pressure/understanding-blood-pressure-readings (accessed on 25 June 2020).
- Williams, B.T.; Dixon, R.A. Biochemical testing for acute medical emergencies in four district general hospitals. Br. Med. J. 1979, 1, 1313–1315. [Google Scholar] [CrossRef] [PubMed][Green Version]
- D’Agostino, R.B.; Wolf, P.A.; Belanger, A.J.; Kannel, W.B. Stroke risk profile: Adjustment for antihypertensive medication: The Framingham study. Am. Heart Assoc. 1994, 25, 40–43. [Google Scholar] [CrossRef] [PubMed]
- Khosla, A.; Cao, Y.; Lin, C.C.; Chiu, H.K.; Hu, J.; Lee, H. An integrated machine learning approach to stroke prediction. In Proceedings of the 16th ACM SIGKDD International Conference on Knowledge Discovery and Data Mining, Washington, DC, USA, 25–28 July 2010; pp. 183–192. [Google Scholar]
- Sundstrom, C. Machine Learning Algorithms for Stroke Diagnostics. Master’s Thesis, Biomedical Engineering Chalmers University of Technology-SE-412 96, Gothenburg, Sweden, 2014. [Google Scholar]
- Singh, M.S.; Choudhary, P. Stroke prediction using artificial intelligence. In Proceedings of the Industrial Automation and Electromechanical Engineering Conference (IEMECON), Bangkok, Thailand, 16–18 August 2017; pp. 158–161. [Google Scholar]
- Alexopoulos, E.; Dounias, G.D.; Vemmos, K. Medical diagnosis of stroke using inductive machine learning. Mach. Learn. Appl. 1999, 20–23. [Google Scholar]
- Sut, N.; Celik, Y. Prediction of mortality in stroke patients using multilayer perceptron neural networks. Turk. J. Med. Sci. 2012, 42, 886–893. [Google Scholar]
- Agrawal, R.; Imielinski, T.; Swami, A. Mining association rules between sets of items in large databases. In Proceedings of the ACM SIGMOD International Conference on Management of Data, Washington, DC, USA, 25–28 May 1993; pp. 207–216. [Google Scholar]
- Quinlan, J.R. Induction of decision trees. Mach. Learn. 1986, 1, 81–106. [Google Scholar] [CrossRef]
- Quinlan, J. C4.5: Programs for Machine Learning; Morgan Kaufmann Publishers: San Mateo, CA, USA, 1993. [Google Scholar]
- Kim, S.; Oh, S. Decision-tree-based Markov model for phrase break prediction. ETRI J. 2007, 29, 527–529. [Google Scholar] [CrossRef]
- Hall, M.; Frank, E.; Holmes, G.; Pfahringer, B.; Reutemann, P.; Witten, L.H. The WEKA data mining software: An update. ACM SIGKDD Explor. Newsl. 2009, 11, 10–18. [Google Scholar] [CrossRef]
- Shi, H.; Wang, H.; Huang, Y.; Zhao, L.; Qin, C.; Liu, C. A hierarchical method based on weighted extreme gradient boosting in ECG heartbeat classification. Comput. Methods Programs Biomed. 2019, 171, 1–10. [Google Scholar] [CrossRef] [PubMed]
- Yu, J.; Lee, H.; Im, Y.; Kim, M.S.; Park, D. Real-time classification of Internet application traffic using a hierarchical multi-class SVM. Trans. Internet Inf. Syst. 2010, 4, 859–876. [Google Scholar] [CrossRef]
- Yu, J.; Kim, M.; Bang, H.C.; Bae, S.H.; Kim, S.J. IoT as a applications: Cloud-based building management systems for the internet of things. Multimed. Tools Appl. 2016, 75, 14583–14596. [Google Scholar] [CrossRef]
- Yu, J.; Lee, B.; Park, D. Real-time cooling load forecasting using a hierarchical multi-class SVDD. Multimed. Tools Appl. 2014, 71, 293–307. [Google Scholar] [CrossRef]
- Oh, I.; Lee, J.; Moon, B. Hybrid genetic algorithms for feature selection. IEEE Trans. Pattern Anal. Mach. Intell. 2004, 26, 1424–1437. [Google Scholar] [PubMed]
- Hall, M. Correlation-Based Feature Selection for Machine Learning. Ph.D. Thesis, Waikato University, Hamilton, New Zealand, 1998. [Google Scholar]
- Yu, L.; Liu, H. Efficient feature selection via analysis of relevance and redundancy. J. Mach. Learn. Res. 2004, 5, 1205–1224. [Google Scholar]


| Gender | Patients (N) | Mean | Standard Deviation | Maximum | Minimum |
|---|---|---|---|---|---|
| Male | 117 | 74.44 | 6.775 | 90 | 65 |
| Female | 110 | 77.82 | 6.661 | 99 | 65 |
| Characteristics | No | Characteristics | No |
|---|---|---|---|
| Gender | Lesions | ||
| Male | 149 | Infarction | |
| Female | 138 | Anterior Cerebral Artery | 7 |
| Age | Middle Cerebral Artery | 164 | |
| 65~69 | 63 | Posterior Cerebral Artery | 25 |
| 70~79 | 120 | Basilar artery, Vertebral artery | 76 |
| 80~89 | 84 | Hemorrhage | |
| ≥90 | 8 | Cortex | 4 |
| Causes | Basal ganglion | 2 | |
| Infarction | 267 | Thalamus | 4 |
| Hemorrhage | 16 | Brain stem | 2 |
| Transient ischemic attacks | 4 | Cerebellum | 1 |
| History | Others | 3 | |
| Hypertension | 179 | NIHSS | |
| Diabetes | 79 | 0 (No Stroke Symptoms) | 16 |
| Previous stroke | 46 | 1~4 (Minor Stroke) | 149 |
| Cardiovascular disease | 20 | 5~15 (Moderate Stroke) | 88 |
| Nothing | 87 | 16~20 (Moderate to Severe Stroke) | 11 |
| Symptom | 21~42 (Severe Stroke) | 8 | |
| Weakness | 182 | ECG | |
| Dysarthria | 113 | Normal ECG | 108 |
| Aphasia | 26 | Abnormal ECG | 154 |
| Decreased consciousness | 40 | Borderline ECG | 18 |
| Facial palsy | 21 | ||
| Headache | 12 | ||
| Dizziness | 42 | ||
| Paresthesia | 12 |
| Vital Sign (N = 286) | Mean ± SD | Normal | |
| Systolic Blood Pressure (mmHg) | 154 ± 17.5 | <120 mmHg | |
| Diastolic Blood Pressure (mmHg) | 84 ± 12.5 | <80 mmHg | |
| Pulse (beat/min) | 79 ± 14.4 | 80–100 | |
| Respiration Rate (#/min) | 20 ± 2 | 12–20 | |
| Body Temperature (°C) | 37 ± 0 | 36.1 °C–37.2 °C | |
| Blood Pressure Test (N = 286) | Less Than Normal | Normal | More Than Normal |
| Systolic Blood Pressure (mmHg) | 0 | 87 | 199 |
| Diastolic Blood Pressure (mmHg) | 8 | 178 | 100 |
| Emergency Blood Test (N = 284) | Less Than Normal | Normal | More Than Normal |
| WBC (103/uL) | 3 | 233 | 48 |
| RBC (106/uL) | 125 | 158 | 1 |
| Hb (g/dL) | 57 | 218 | 9 |
| Hct (%) | 66 | 182 | 36 |
| Platelet (103/uL) | 31 | 249 | 4 |
| MCV (fL) | 5 | 264 | 15 |
| MCH (pg) | 3 | 281 | 0 |
| MCHC (g/dL) | 1 | 280 | 3 |
| MPV (fl) | 1 | 262 | 21 |
| Seg.Neutro (%) | 1 | 211 | 72 |
| Lymphocyte (%) | 80 | 200 | 4 |
| Monocyte (%) | 19 | 246 | 19 |
| Eosinophil (%) | 0 | 282 | 2 |
| Basophil (%) | 0 | 284 | 0 |
| Emergency Chemical Test (N = 261) | Less Than Normal | Normal | More Than Normal |
|---|---|---|---|
| TP(n) (g/dL) | 47 | 211 | 3 |
| Albumin (g/dL) | 197 | 64 | 0 |
| Glucose(n) (mg/dL) | 1 | 105 | 155 |
| TB(n) (mg/dL) | 12 | 235 | 14 |
| T.chol(n) (mg/dl) | 21 | 194 | 46 |
| AST(GOT) (U/L) | 0 | 250 | 11 |
| ALT(GPT) (U/L) | 0 | 252 | 9 |
| ALP (U/L) | 6 | 251 | 4 |
| CK(CPK) (U/L) | 55 | 196 | 10 |
| UN (U/L) | 3 | 188 | 70 |
| Cr (mg/dL) | 20 | 121 | 120 |
| Na (mEq/L) | 0 | 230 | 31 |
| K (mEq/L) | 13 | 247 | 1 |
| CI (mEq/L) | 12 | 229 | 20 |
| P (mEq/L) | 24 | 235 | 2 |
| Tca (mg/dL) | 68 | 192 | 1 |
| CRP (mEq/L) | 0 | 211 | 50 |
| CK-MB (ng/mL) | 7 | 237 | 17 |
| Troponin I (ng/mL) | 12 | 223 | 28 |
| Emergency Coagulation Test (N = 281) | Less Than Normal | Normal | More Than Normal |
| aPTT (sec) | 13 | 264 | 4 |
| PT (sec) | 140 | 130 | 11 |
| PT (%) | 7 | 274 | 0 |
| PT(INR) (ratio) | 0 | 280 | 1 |
| Emergency Urinalysis Test (N = 161) | Less Than Normal | Normal | More Than Normal |
| SG | 1 | 148 | 12 |
| pH | 0 | 161 | 0 |
| RBC (HPF) | 0 | 125 | 36 |
| WBC (HPF) | 0 | 127 | 34 |
| Sq.epi.cell (HPF) | 0 | 160 | 1 |
| Instructions | 1a | 1b | 1c | 2 | 3 | 4 | 5a | 5b | 6a | 6b | 7 | 8 | 9 | 10 | 11 | 12a | 12b |
|---|---|---|---|---|---|---|---|---|---|---|---|---|---|---|---|---|---|
| 1a. Level of Consciousness | 1.00 | ||||||||||||||||
| 1b. LOC Questions | 0.420** | 1.00 | |||||||||||||||
| 1c. LOC Commands | 0.502 ** | 0.785 ** | 1.00 | ||||||||||||||
| 2. Best Gaze | 0.400 ** | 0.209 ** | 309 ** | 1.00 | |||||||||||||
| 3. Visual | −0.027 | 0.021 | 0.052 | 0.014 | 1.00 | ||||||||||||
| 4. Facial Palsy | 0.053 | 0.101 | 0.096 | 0.250 ** | −0.138 * | 1.00 | |||||||||||
| 5a. Motor Arm (Left) | 0.236 ** | 0.389 ** | 0.456 ** | 0.174 ** | 0.033 | 0.102 | 1.00 | ||||||||||
| 5b. Motor Arm (Right) | 0.337 ** | 0.068 | 0.143 * | 0.382 ** | −0.114 | 0.191 ** | −0.21 ** | 1.00 | |||||||||
| 6a. Motor Leg (Left) | 0.228 ** | 0.332 ** | 0.408 ** | 0.182 ** | 0.018 | 0.103 | 0.834 ** | −0.22 ** | 1.00 | ||||||||
| 6b. Motor Leg (Right) | 0.342 ** | 0.053 | 0.125 | 0.375 ** | −0.040 | 0.176 ** | −0.21 ** | 0.847 ** | −0.21 ** | 1.00 | |||||||
| 7. Limb Ataxia | −0.039 | −0.063 | −0.114 | −0.053 | 0.045 | −0.071 | −0.158 * | −0.117 | −0.167 * | −0.132 * | 1.00 | ||||||
| 8. Sensory | −0.038 | −0.22 ** | −0.139 * | 0.010 | −0.112 | 0.023 | −0.138 * | 0.083 | −0.101 | 0.013 | −0.067 | 1.00 | |||||
| 9. Best Language | 0.349 ** | 0.770 ** | 0.757 ** | 0.206 ** | 0.072 | 0.107 | 0.480 ** | −0.034 | 0.403 ** | −0.052 | −0.080 | −0.162* | 1.00 | ||||
| 10. Dysarthria | 0.233 ** | 0.200 ** | 0.313 ** | 0.285 ** | 0.010 | 0.291 ** | 0.291 ** | 0.095 | 0.263 ** | 0.140 * | −0.090 | −0.014 | 0.292 ** | 1.00 | |||
| 11. Extinction and Inattention | 0.148 * | 0.183 ** | 0.184 ** | 0.534 ** | −0.033 | 0.336 ** | 0.056 | 0.396 ** | 0.056 | 0.379 ** | −0.094 | 0.028 | 0.138 * | 0.251 ** | 1.00 | ||
| 12. Distal Motor Function (Left) | −0.033 | 0.029 | −0.127 | 0.017 | 0.079 | −0.098 | −0.197 | −0.219 | −0.27 | −0.139 | −0.059 | −0.119 | −0.051 | 0.49 | −0.069 | 1.00 | |
| 12. Distal Motor Function (Right) | −0.026 | −0.103 | 0.113 | 0.014 | 0.059 | −0.058 | −0.133 | 0.094 | −0.127 | −0.069 | −0.069 | −0.21 | 0.038 | 0.86 | −0.033 | 0.071 | 1.00 |
| NIHSS Score | Stroke Severity |
|---|---|
| 0 | No Stroke Symptoms |
| 1~4 | Minor Stroke |
| 5~15 | Moderate Stroke |
| 16~20 | Moderate to Severe Stroke |
| 21~42 | Severe Stroke |
| Age | 1a | 1b | 1c | 2 | 3 | 4 | 5a | 5b | 6a | 6b | 7 | 8 | 9 | 10 | 11 | 12a | 12b |
|---|---|---|---|---|---|---|---|---|---|---|---|---|---|---|---|---|---|
| 68 | 0 | 0 | 0 | 0 | 0 | 1 | 0 | 4 | 0 | 4 | 0 | 0 | 0 | 1 | 0 | 1 | 0 |
| 86 | 2 | 1 | 1 | 1 | 0 | 1 | 1 | 2 | 0 | 1 | 1 | 0 | 2 | 0 | 1 | 0 | 1 |
| 75 | 0 | 0 | 0 | 0 | 0 | 2 | 1 | 0 | 0 | 1 | 0 | 0 | 0 | 0 | 1 | 0 | 0 |
| 92 | 2 | 2 | 2 | 0 | 0 | 0 | 3 | 1 | 0 | 3 | 2 | 0 | 0 | 2 | 2 | 1 | 0 |
| 65 | 0 | 1 | 0 | 1 | 1 | 0 | 2 | 1 | 0 | 1 | 2 | 0 | 0 | 1 | 1 | 0 | 0 |
| … | … | … | … | … | … | … | … | … | … | … | … | … | … | … | … | … | … |
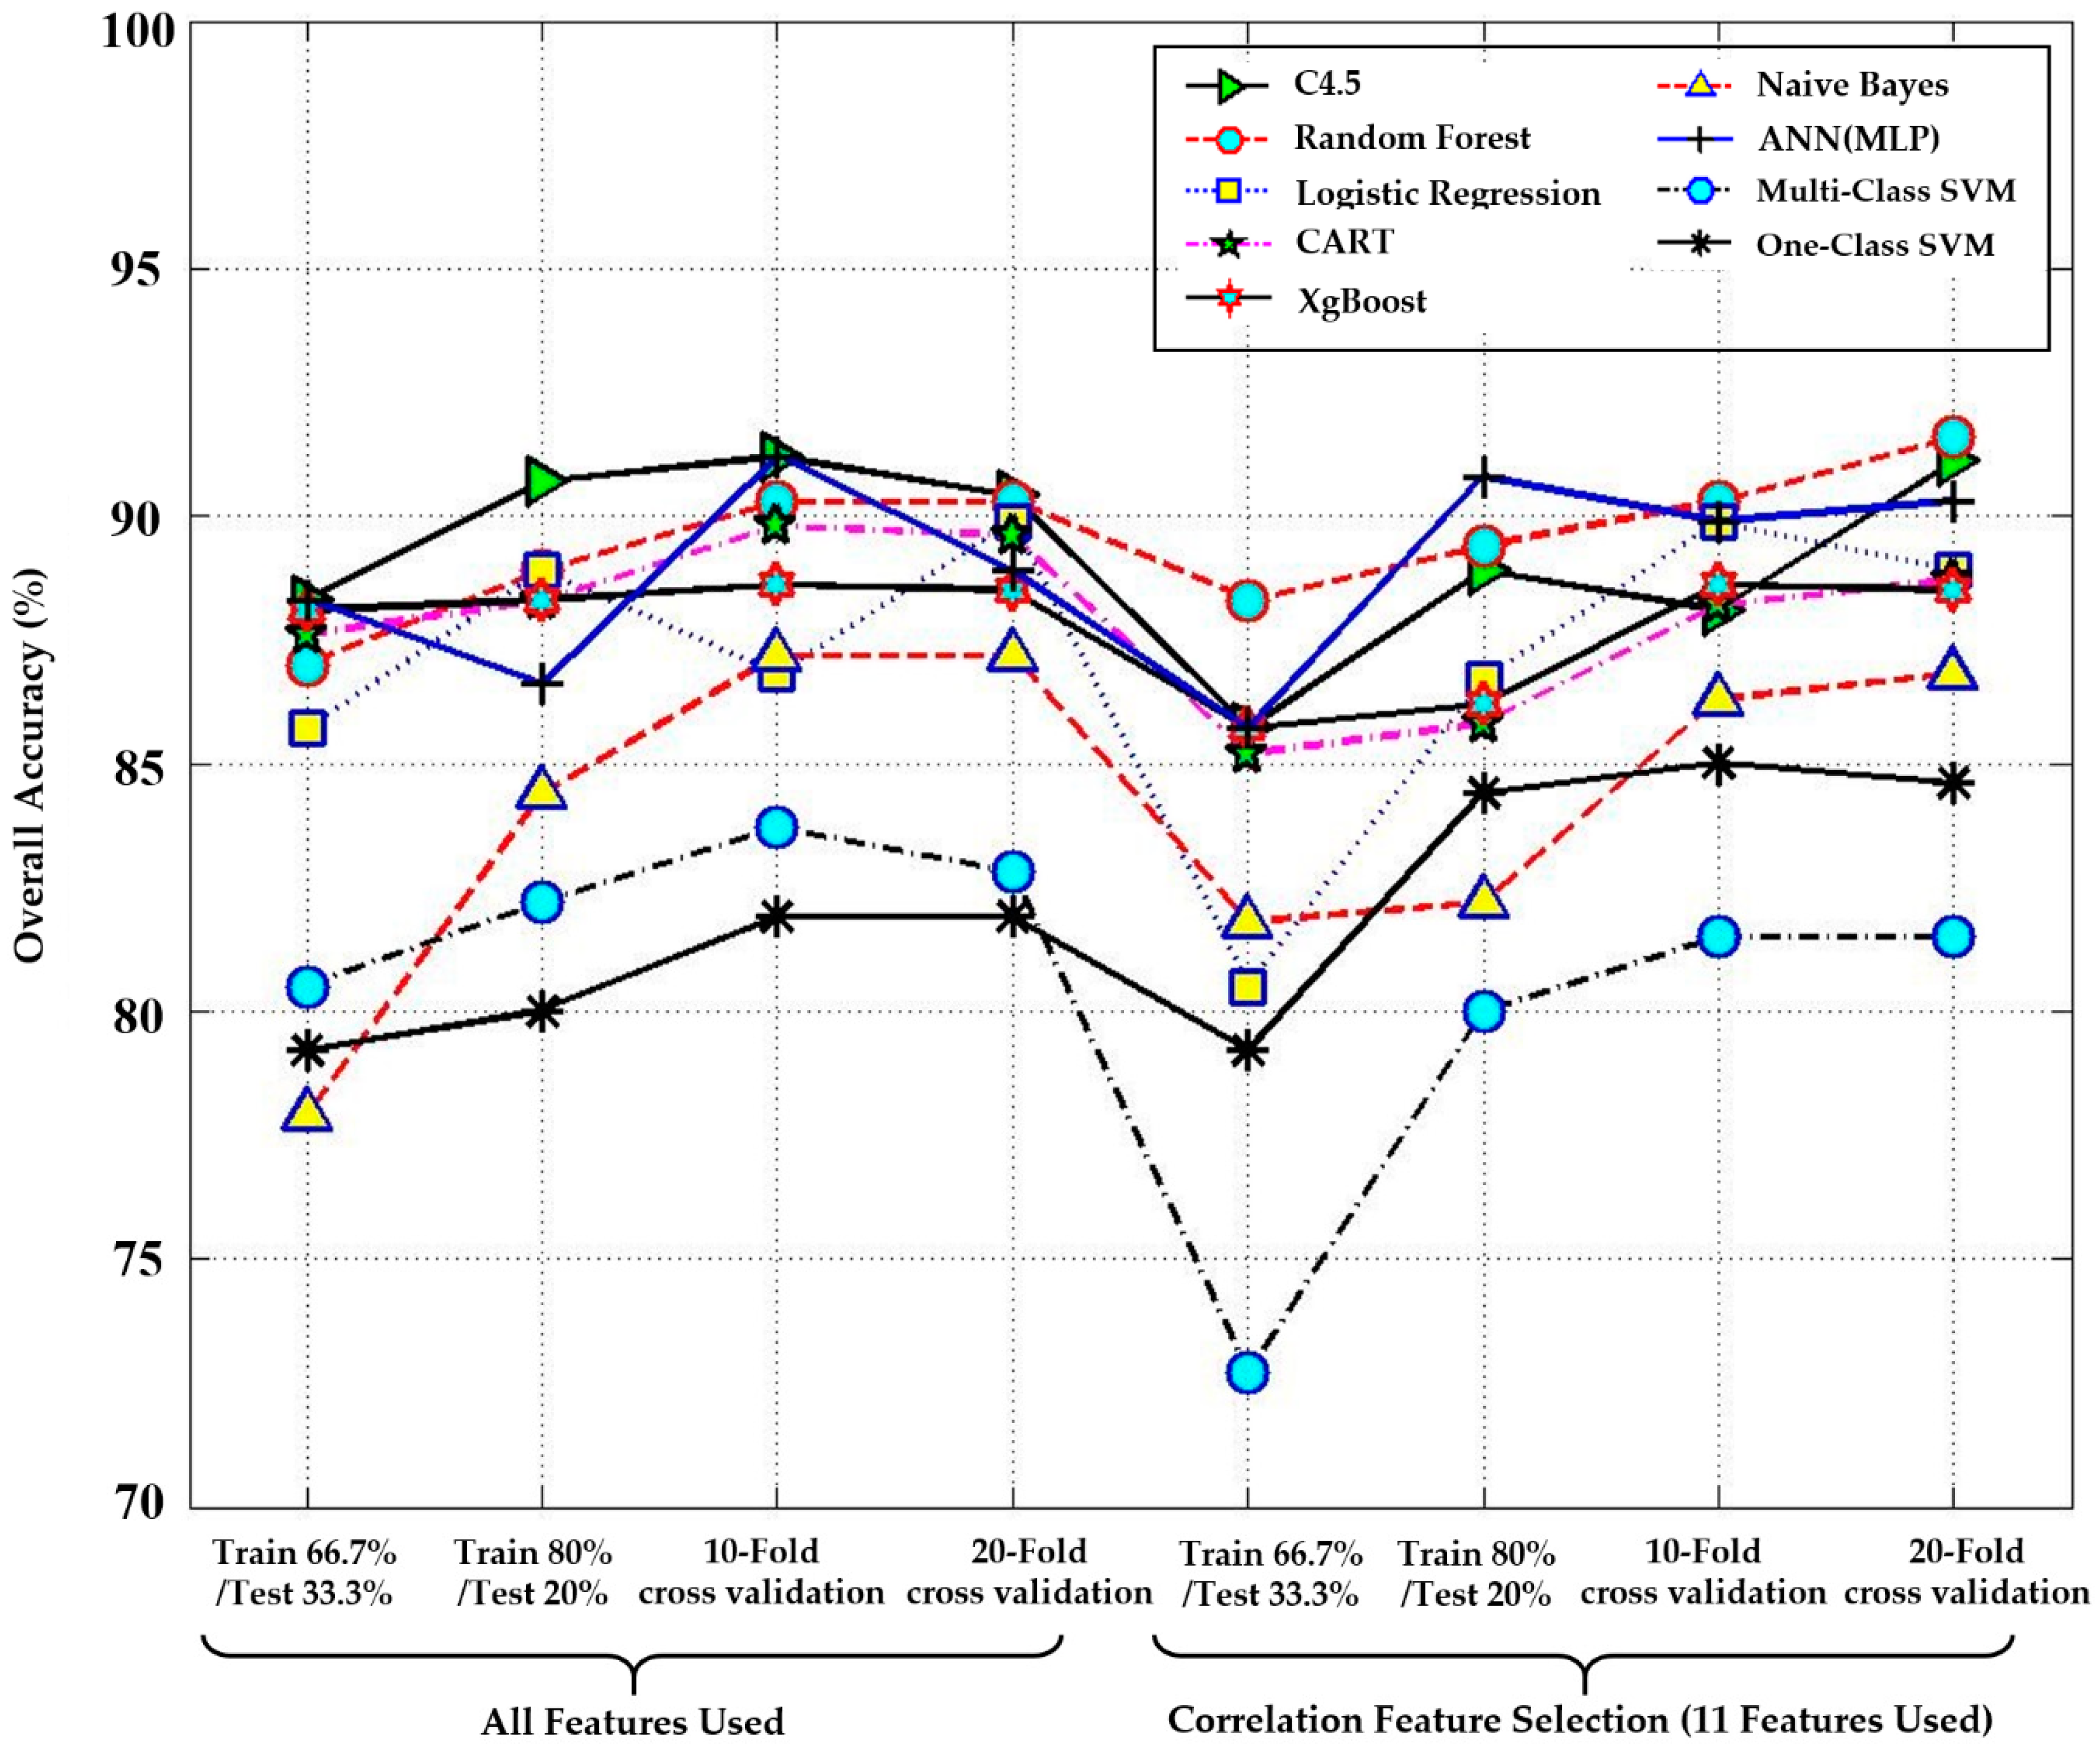
| Performance Measure | All Features Used | Correlation Feature Selection (CFS) (11 Features Used) | |||
|---|---|---|---|---|---|
| Methods | Recall | Precision | Recall | Precision | |
| C4.5 decision tree | 91.1 | 93.3 | 88.9 | 87.5 | |
| Random forest | 88.9 | 90.7 | 89.4 | 90.3 | |
| Logistic regression | 88.9 | 90.9 | 86.7 | 86.6 | |
| CART | 89.8 | 92.1 | 88.4 | 89.8 | |
| XgBoost | 88.6 | 89.6 | 88.9 | 91.2 | |
| Naïve Bayes | 84.4 | 88.1 | 82.2 | 86.7 | |
| ANN(MLP) | 86.6 | 85.7 | 91.1 | 92.3 | |
| Multi-class SVM | 82.2 | 84.5 | 80.0 | 82.1 | |
| One-class SVM | 80.0 | 85.4 | 84.4 | 87.8 | |
| Minor Stroke | Moderate Stroke | Moderate to Severe Stroke | Severe Stroke | Overall Accuracy |
|---|---|---|---|---|
| 91.67% | 84.21% | 100% | 100% | 91.11% |
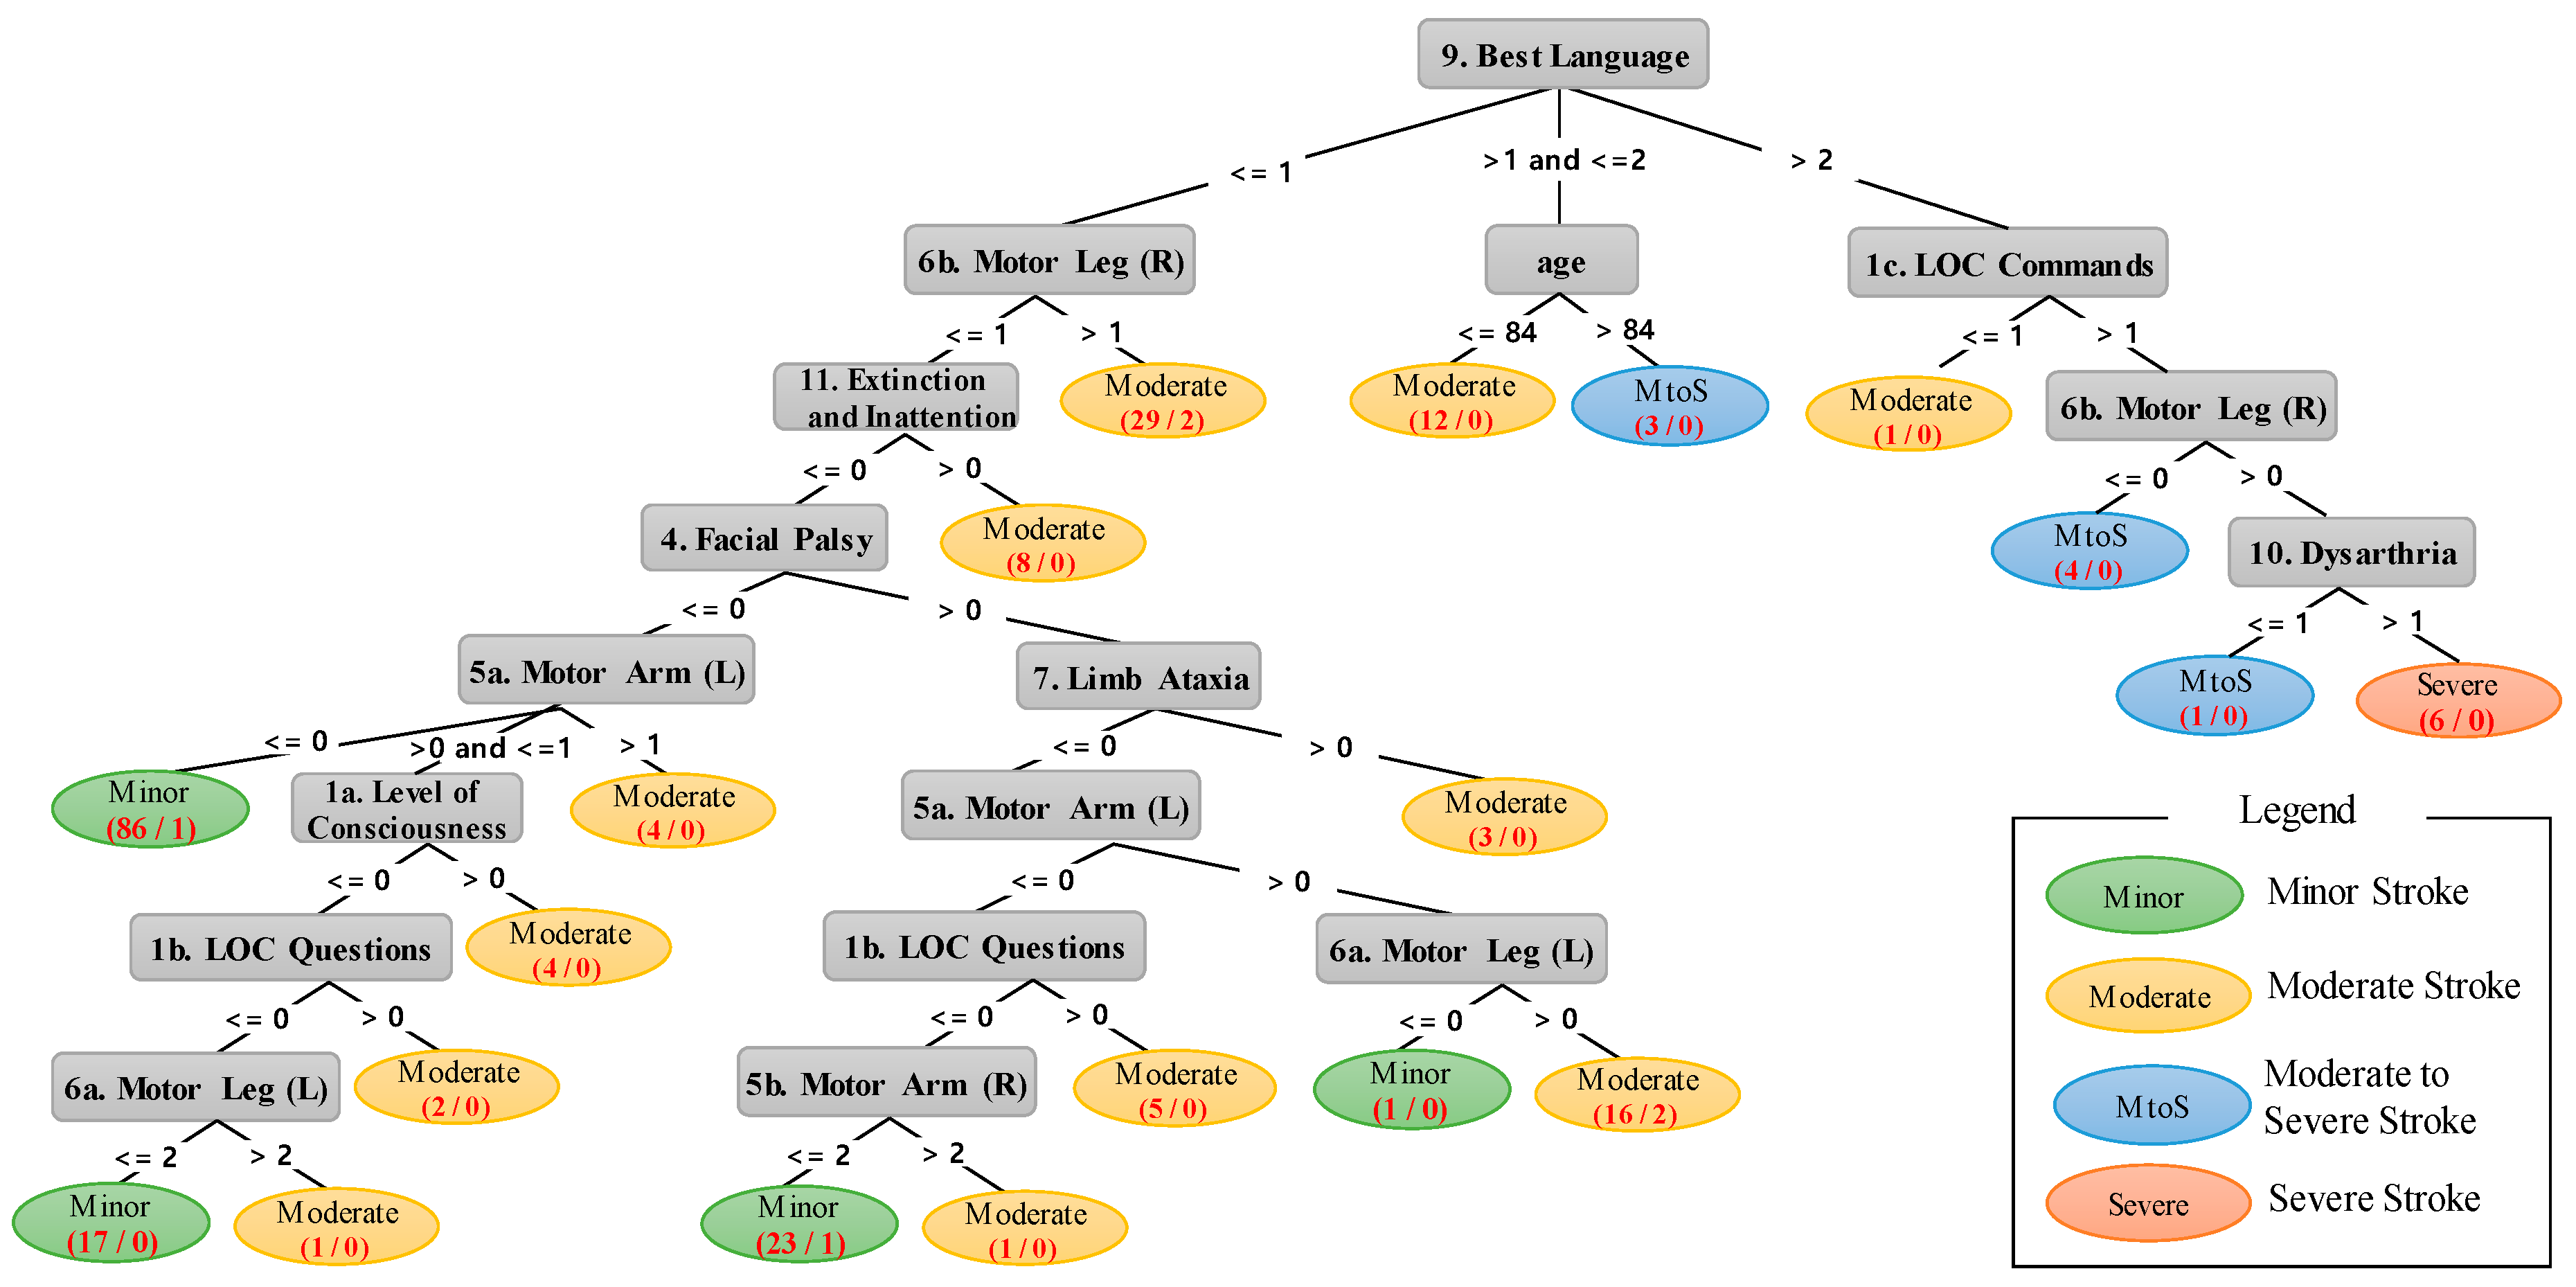
| Rule # | A Rules and Analysis Results Found in Figure 3. |
|---|---|
| 1 | IF 1 < Best Language ≤ 2 AND age ≤ 84 THEN Moderate stroke. |
| 2 | IF 1 < Best Language ≤ 2 AND age > 84 THEN Moderate-to-severe stroke. |
| 3 | IF Best Language > 2 AND LOC Commands ≤ 1 THEN Moderate stroke. |
| 4 | IF Best Language > 2 AND LOC Commands > 1 AND Motor Leg (Right) ≤ 0 Moderate-to-severe stroke. |
| 5 | IF Best Language > 2 AND LOC Commands > 1 AND Motor Leg (Right) > 0 AND Dysarthria ≤ 1 THEN Moderate-to-severe stroke. |
| 6 | IF Best Language > 2 AND LOC Commands > 1 AND Motor Leg (Right) > 0 AND Dysarthria > 1 THEN Severe stroke. |
| 7 | IF Best Language ≤ 1 AND Motor Leg (Right) > 1 THEN Moderate stroke. |
| 8 | IF Best Language ≤ 1 AND Motor Leg (Right) ≤ 1 AND Extinction and Inattention > 0 THEN Moderate stroke. |
| 9 | IF Best Language ≤ 1 AND Motor Leg (Right) ≤ 1 AND Extinction and Inattention ≤ 0 AND Facial Palsy ≤ 0 AND Motor Arm (Left) ≤ 0 THEN Minor stroke. |
| 10 | IF Best Language ≤ 1 AND Motor Leg (Right) ≤ 1 AND Extinction and Inattention ≤ 0 AND Facial Palsy ≤ 0 AND Motor Arm (Left) > 1 THEN Moderate stroke. |
| 11 | IF Best Language ≤ 1 AND Motor Leg (Right) ≤ 1 AND Extinction and Inattention ≤ 0 AND Facial Palsy ≤ 0 AND > 0 Motor Arm (Left) ≤ 1 AND Level of Consciousness > 0 THEN Moderate stroke. |
| 12 | IF Best Language ≤ 1 AND Motor Leg (Right) ≤ 1 AND Extinction and Inattention ≤ 0 AND Facial Palsy ≤ 0 AND > 0 Motor Arm (Left) ≤ 1 AND Level of Consciousness > 0 AND LOC Questions > 0 THEN Moderate stroke. |
| 13 | IF Best Language ≤ 1 AND Motor Leg (Right) ≤ 1 AND Extinction and Inattention ≤ 0 AND Facial Palsy ≤ 0 AND > 0 Motor Arm (Left) ≤ 1 AND Level of Consciousness > 0 AND LOC Questions ≤ 0 Motor Leg (Left) ≤ 2 THEN Minor stroke. |
| 14 | IF Best Language ≤ 1 AND Motor Leg (Right) ≤ 1 AND Extinction and Inattention ≤ 0 AND Facial Palsy ≤ 0 AND > 0 Motor Arm (Left) ≤ 1 AND Level of Consciousness > 0 AND LOC Questions ≤ 0 Motor Leg (Left) > 2 THEN Moderate stroke. |
| 15 | IF Best Language ≤ 1 AND Motor Leg (Right) ≤ 1 AND Extinction and Inattention ≤ 0 AND Facial Palsy > 0 AND Limb Ataxia > 0 THEN Moderate stroke. |
| 16 | IF Best Language ≤ 1 AND Motor Leg (Right) ≤ 1 AND Extinction and Inattention ≤ 0 AND Facial Palsy > 0 AND Limb Ataxia ≤ 0 AND Motor Arm (Left) > 0 AND Motor Leg (Left) ≤ 0 THEN Minor stroke. |
| 17 | IF Best Language ≤ 1 AND Motor Leg (Right) ≤ 1 AND Extinction and Inattention ≤ 0 AND Facial Palsy > 0 AND Limb Ataxia ≤ 0 AND Motor Arm (Left) > 0 AND Motor Leg (Left) > 0 THEN Moderate stroke. |
| 18 | IF Best Language ≤ 1 AND Motor Leg (Right) ≤ 1 AND Extinction and Inattention ≤ 0 AND Facial Palsy > 0 AND Limb Ataxia ≤ 0 AND Motor Arm (Left) ≤ 0 AND LOC Questions > 0 THEN Moderate stroke. |
| 19 | IF Best Language ≤ 1 AND Motor Leg (Right) ≤ 1 AND Extinction and Inattention ≤ 0 AND Facial Palsy > 0 AND Limb Ataxia ≤ 0 AND Motor Arm (Left) ≤ 0 AND LOC Questions ≤ 0 Motor Arm (R) ≤ 2 THEN Minor stroke. |
| 20 | IF Best Language ≤ 1 AND Motor Leg (Right) ≤ 1 AND Extinction and Inattention ≤ 0 AND Facial Palsy > 0 AND Limb Ataxia ≤ 0 AND Motor Arm (Left) ≤ 0 AND LOC Questions ≤ 0 Motor Arm (R) > 2 THEN Moderate stroke. |
© 2020 by the authors. Licensee MDPI, Basel, Switzerland. This article is an open access article distributed under the terms and conditions of the Creative Commons Attribution (CC BY) license (http://creativecommons.org/licenses/by/4.0/).
Share and Cite
Yu, J.; Park, S.; Lee, H.; Pyo, C.-S.; Lee, Y.S. An Elderly Health Monitoring System Using Machine Learning and In-Depth Analysis Techniques on the NIH Stroke Scale. Mathematics 2020, 8, 1115. https://doi.org/10.3390/math8071115
Yu J, Park S, Lee H, Pyo C-S, Lee YS. An Elderly Health Monitoring System Using Machine Learning and In-Depth Analysis Techniques on the NIH Stroke Scale. Mathematics. 2020; 8(7):1115. https://doi.org/10.3390/math8071115
Chicago/Turabian StyleYu, Jaehak, Sejin Park, Hansung Lee, Cheol-Sig Pyo, and Yang Sun Lee. 2020. "An Elderly Health Monitoring System Using Machine Learning and In-Depth Analysis Techniques on the NIH Stroke Scale" Mathematics 8, no. 7: 1115. https://doi.org/10.3390/math8071115
APA StyleYu, J., Park, S., Lee, H., Pyo, C.-S., & Lee, Y. S. (2020). An Elderly Health Monitoring System Using Machine Learning and In-Depth Analysis Techniques on the NIH Stroke Scale. Mathematics, 8(7), 1115. https://doi.org/10.3390/math8071115