This section focuses on the simulation of the proposed algorithms on the sample datasets with its outcomes and analysis. The algorithms are implemented in the Java language. It has been experimentally found that the computation time depends on the structure of the computation, number of user attributes, size of the graph edges, and the dataset.
5.3. Comparative Results & Analysis
The proposed methods are compared with the MDHS algorithm [
36,
46], the nearest neighborhood CF [
11,
23], UPOD [
6], and Dynamic Group Recommender (DGR) algorithms [
6,
49,
50,
51]. The following simulation parameters are applied during the execution of the proposed methods: λ = 0.5, the size of the recommendation list |
L| = 30, size of the neighborhood is 30,
k-
minimum to 100, and
k-
maximum to 200. The simulation outcomes are tabulated in
Table 1,
Table 2,
Table 3,
Table 4,
Table 5 and
Table 6. The results are compared using the statistical
t-test to find the significance of the proposed methods over the existing methods [
6]. The mean
and standard deviation
are calculated for the datasets after applying the
(Equation (19)) 100 times. Tables observe that the proposed methods are outperforming the existing techniques based on the metrics applied to evaluate the performance measurements. The data for user profiles can also be extracted from social networks. The average computational time (in seconds) for the proposed methods in the form of (proposed method 1, proposed method 2) for the
Movielens,
Last.FM,
Book-Crossing datasets are (8.2, 4.9), (9.8, 4.89), (8.75, 4.97) respectively.
The proposed methods are evaluated and compared with the other well-known strategies, such as CF, MDHS, and UPOD. The parameter λ has been set to 0.5 when comparing with MDHS and UPOD methods. The proposed methods are evaluated using the n group cross-validation in which the data set is divided into n groups of equal sizes. , that is, the users are those who are available both in testing and the training set, are considered for the evaluation.
The performance of the proposed methods with the existing methods is evaluated using the three metrics:
Recall (
List,
User),
Precision (
List,
User), and
Ranking Score (
User), and the recommendation list generated by the system is validated. The simulation outcomes are tested using the statistical
t-test with a level of significance α = 0.05 to check if there is a significant difference between the proposed methods, with the existing methods being statistically significant. The measures
and
are computed for each dataset, after applying the clustering with 10 executions. The inferences are analyzed from the experimental results, which are tabulated from tables
Table 1,
Table 2,
Table 3,
Table 4,
Table 5 and
Table 6. The figures which are indicated in bold conclude the better performance of the proposed methods over the existing methods.
The comparison of the mean
and standard deviation
to the
Movielens dataset is shown in
Table 1 and
Table 2 respectively. For this dataset, the measures are calculated as
= 198 and
. For this dataset, it has been found that there is no significant difference obtained in terms of parameters
and
concerning the
Ranking Score (
User) and
Recall (
List,
User) measures in the proposed methods. However, the proposed method 2 behaves well in terms of
Precision (
List,
User) measurements compared to other methods with the size of the recommendation list |
L| = 30.
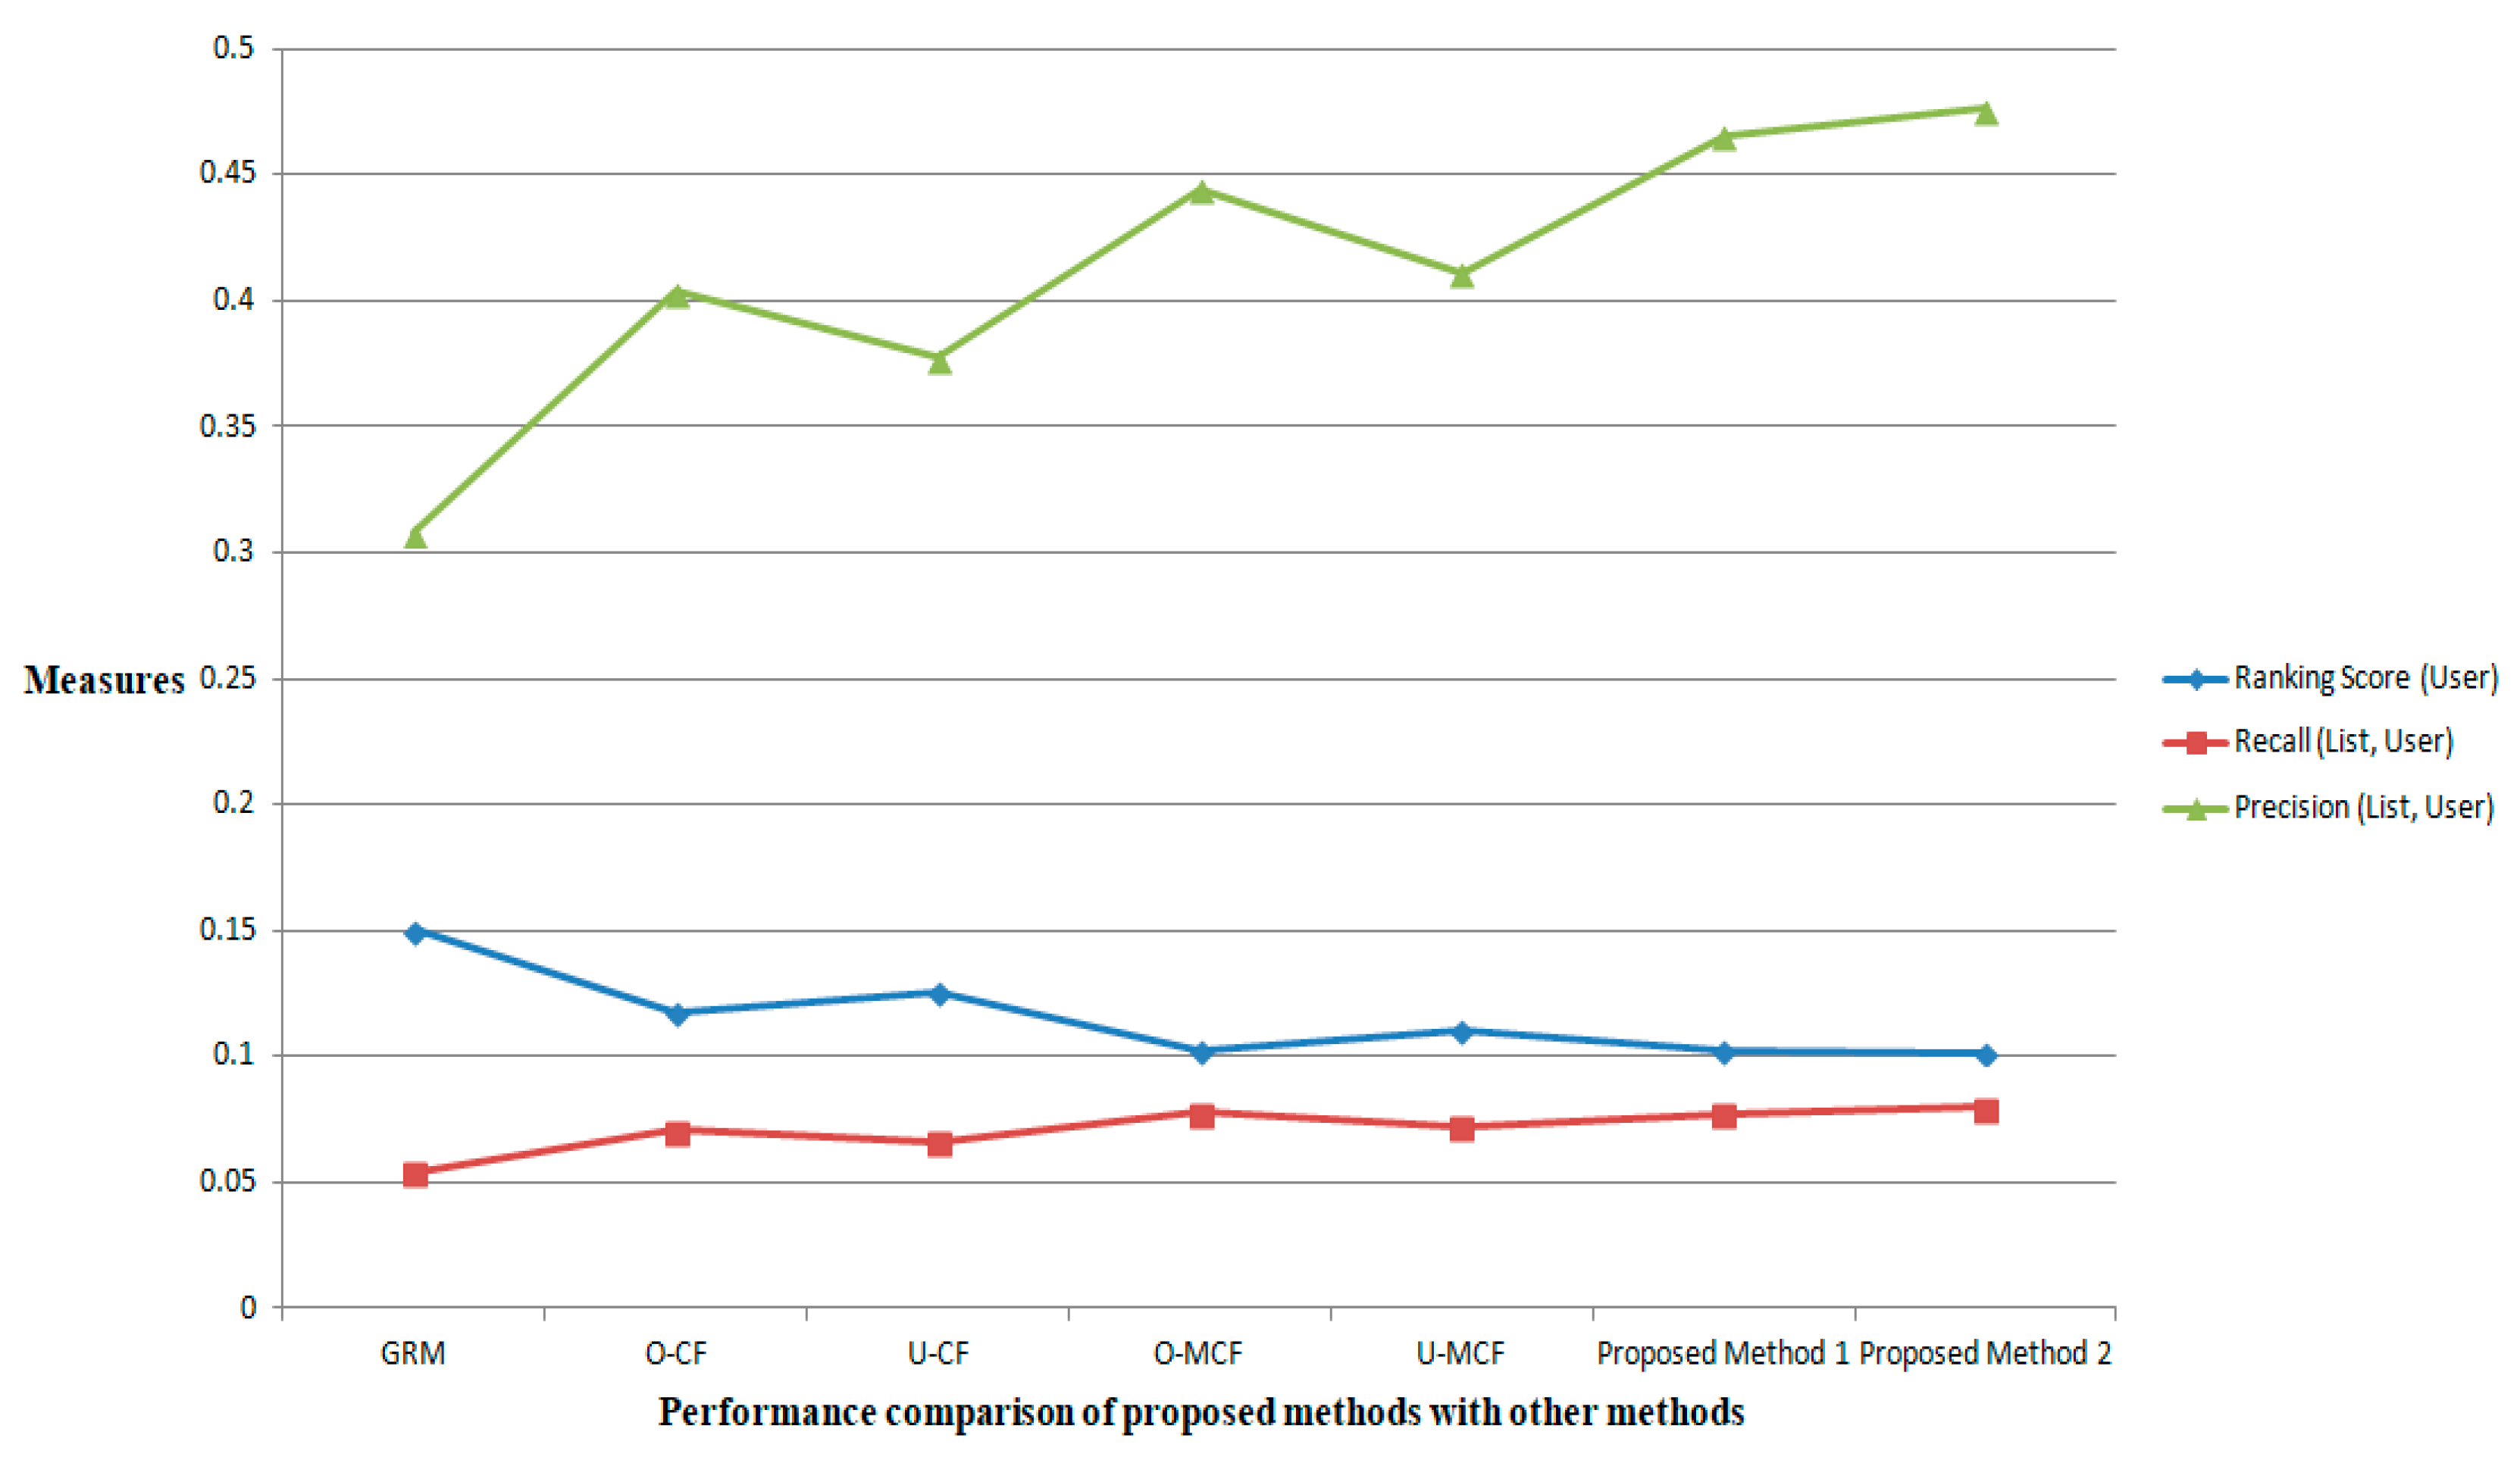
The accuracy of the proposed methods is also evaluated for the
MovieLens dataset with the same parameters considered in [
49]. To test the performance of the proposed recommenders, the
MovieLens dataset is divided into 90% of the training set and 10% of probe data. The dataset can also be divided into (80%, 20%), (70%, 30%), and so on. The only known information is available in the training set and no prediction is made in the probe set of data. For the
jth user
uj, the position of an uncollected object
oj is measured in the ordered queue. Then the position of
oj is obtained by dividing the particular location from the top by the total number of uncollected movies. Hence, a good recommender is expected to produce a small
Ranking Score (
User), which shows the better accuracy of the recommender. The performance comparison of the proposed methods with other methods for the
MovieLens dataset over the three metrics is shown in
Figure 5 [
49]. The simulation is conducted with 10% of probe data, L = 50. The values corresponding to the proposed methods are better ones concerning all three metrics.
The comparison of the mean
and standard deviation
to the
Last.FM dataset is shown in
Table 3 and
Table 4 respectively. For this dataset, the measures are calculated as
= 195 and
2.75. For the Last.FM dataset, the proposed method 2 performs better than the existing methods in terms of all performance metrics considered. For this dataset, there is no significant difference obtained even when the size of the recommendation list |L| becomes 30, while keeping the size of the neighborhood as <30 in all executions.
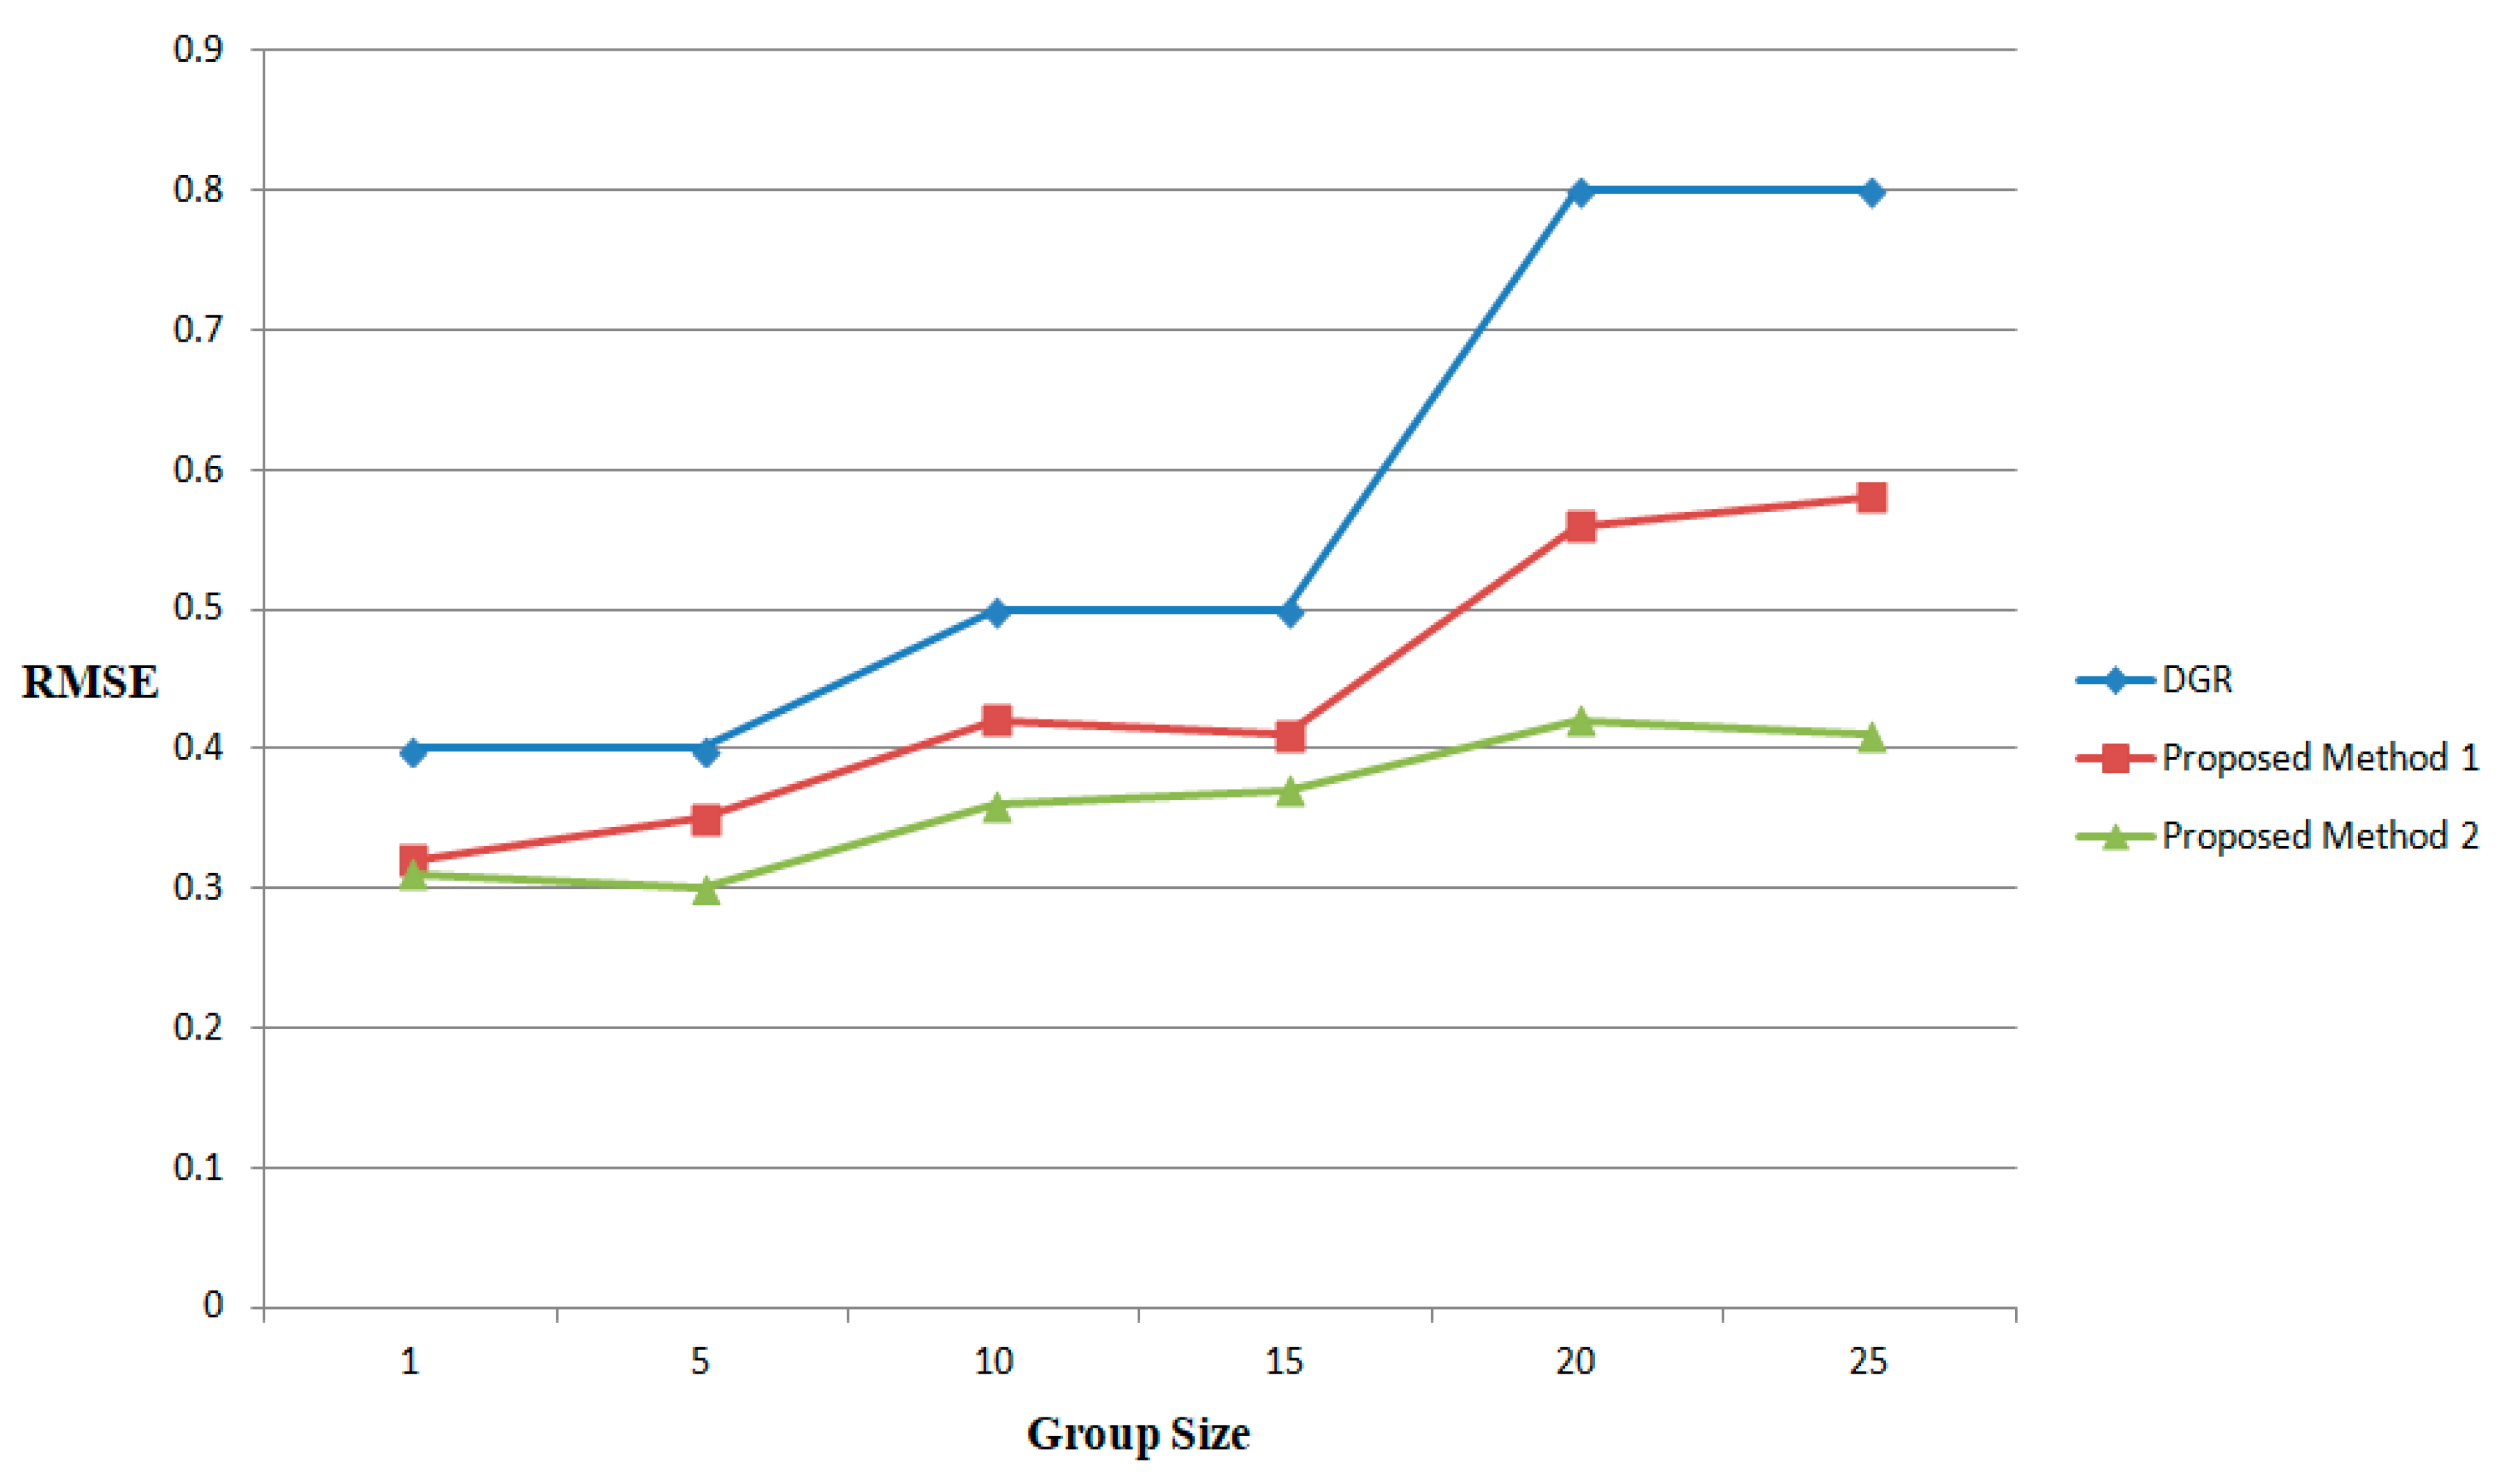
For
n, the number of ratings present in the test set, the quality of the predicted rating is obtained using RMSE [
50]. This metric compares the prediction ratings with the probe test set. The accuracy of the proposed methods is also evaluated for the
Last.FM dataset and the results are compared with the methods presented in [
50]. The minimum RMSE is considered for some of the methods presented in the DGR. The RMSE comparison of the proposed methods with DGR presented in [
50] is shown in
Figure 6. In the Figure, the size of the groups is plotted on the
X-axis and the RMSE is plotted on the
Y-axis. The predictions generated by the proposed recommenders are better than the existing methods. The experimental results further conclude that the proposed recommenders consider the features of the individual preferences of the group members and the specific features. It has also been found that the accuracy is slightly decreasing while the group size is increasing since the group recommendation depends on the diverse set of users and specific personal features.
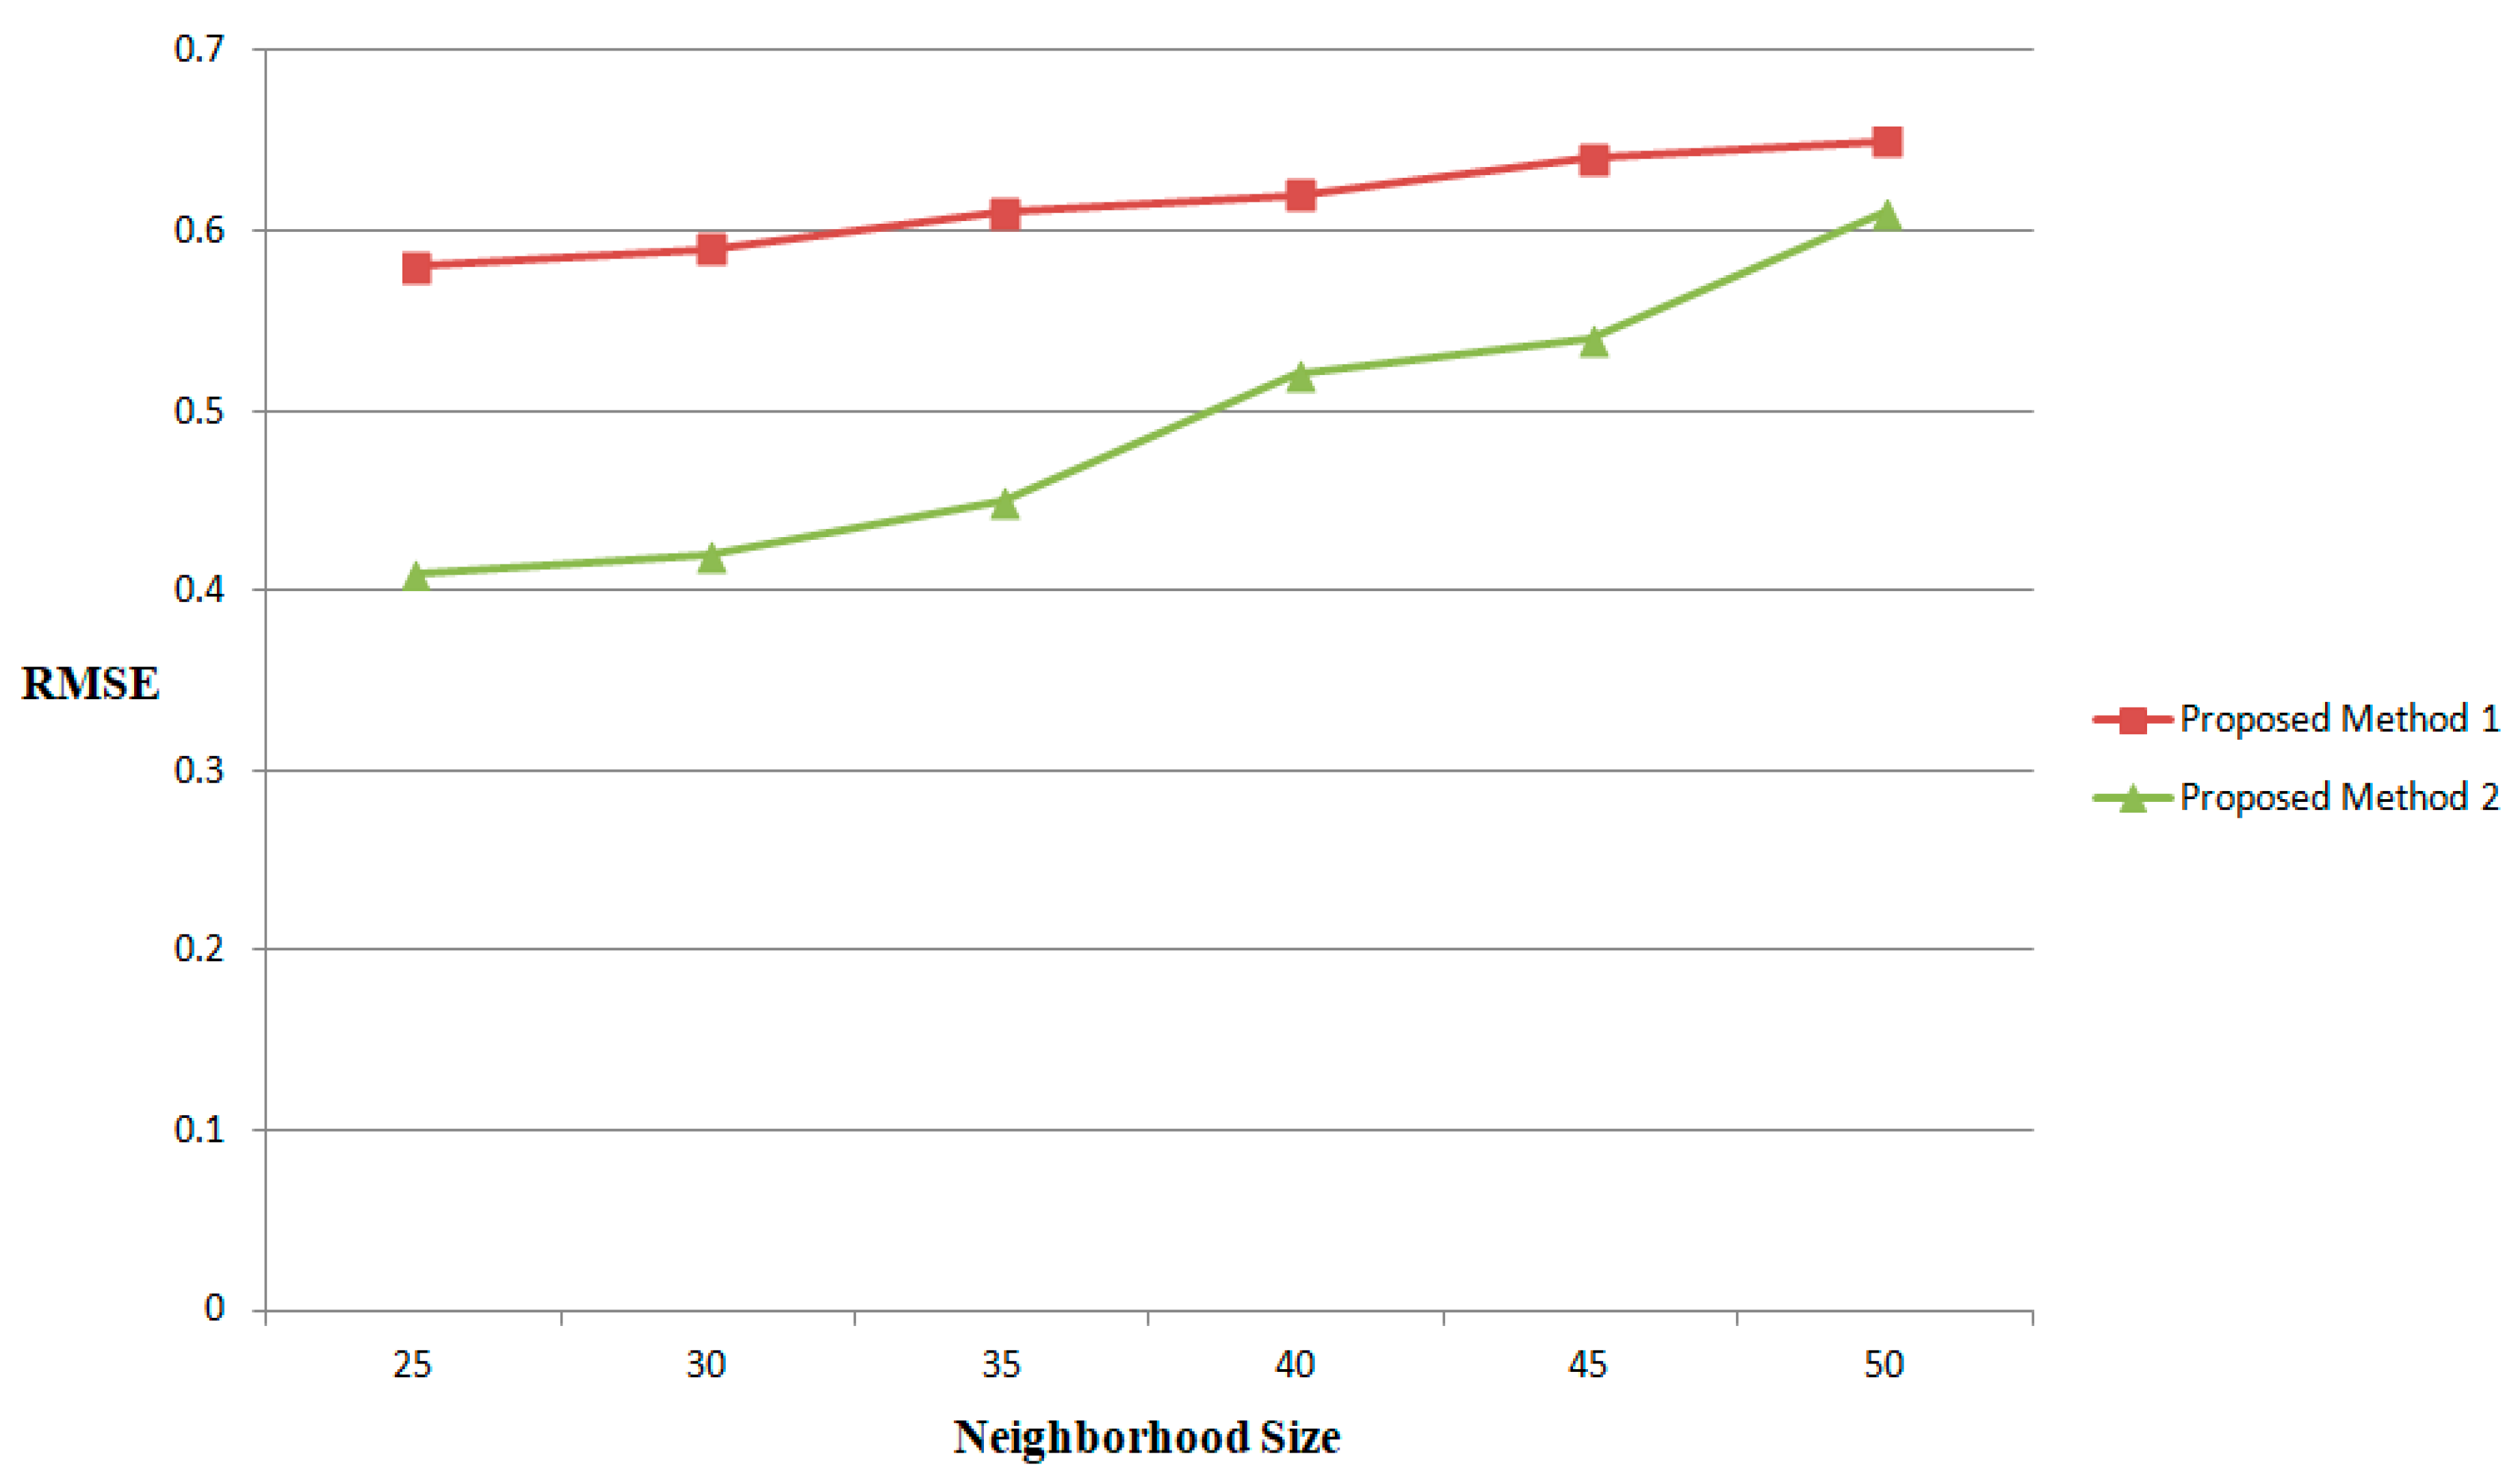
The performance of specific feature selection is also analyzed based on varying the values of neighborhood sizes |
S|. The interesting result is obtained during the simulation when the experiments are conducted for small, medium, and large neighborhood sizes |
S| and are shown in
Figure 7. The RMSE values of 41% and 37% are obtained in the proposed methods when |
S| < 20. When the value of |
S| increases, RMSE also increases. For large values of |
S|, there is a significant difference that becomes smaller in the proposed methods.
The average (
) & standard deviation (
) of observed ratings for the proposed datasets are shown in
Table 7.
The comparison of the mean
and standard deviation
to the
Book-Crossing dataset is shown in
Table 5 and
Table 6 respectively. For this dataset, the measures are calculated as
= 194 and
= 7.83. For this dataset, it has been found that there is a significant difference obtained in terms of parameters
and
concerning the
Precision (
List,
User) and
Recall (
List,
User) measures in the proposed methods. However, the proposed methods are competitive with the existing methods. The proposed method 2 performs well compared to proposed method 1. It has also been found that, for this dataset, there is no significant difference obtained even when the size of the recommendation list |
L| becomes 50 while keeping the size of the neighborhood as < 30 in all executions.
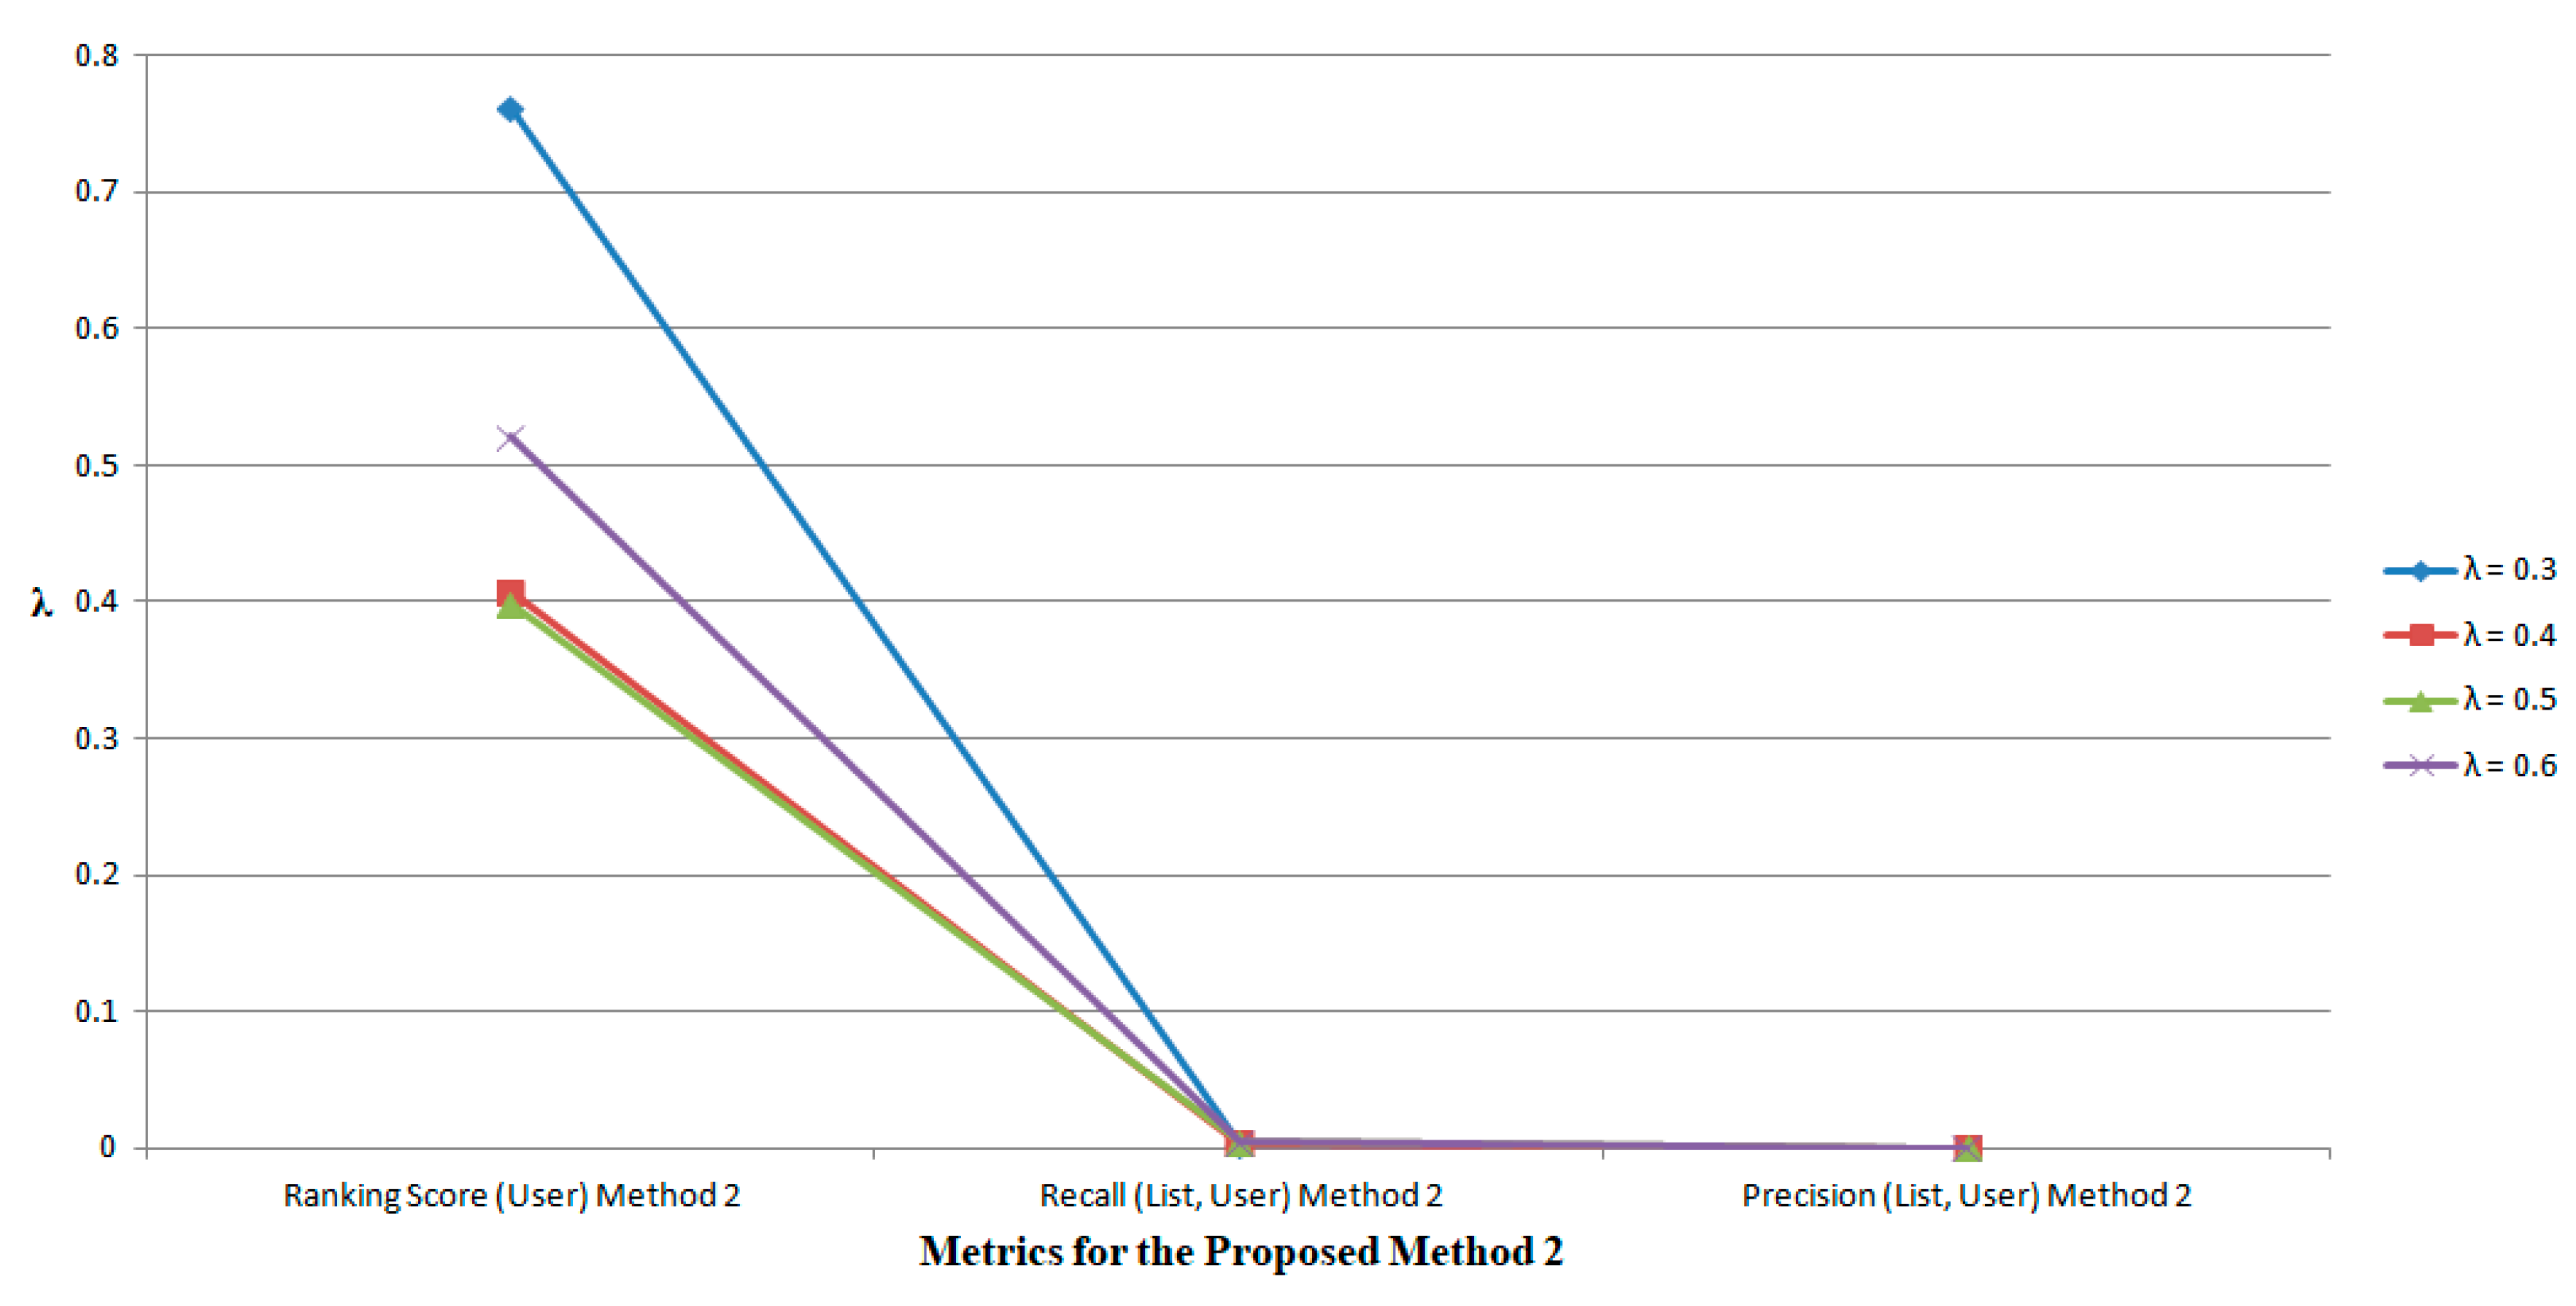
The proposed methods are simulated for the large scale data set
Book-Crossing which consists of 3421 users and 26,811 items on varying the tuning parameter λ for the different values as 0.3, 0.4, 0.5, and 0.6. The significant results are obtained and are shown in
Figure 8. It has been found that when λ < 0.5, the
Ranking Score (
User) increases while the
Precision (
List,
User) and
Recall (
List,
User) measures decrease. When λ > 0.5, the
Ranking Score (
User) also increases gradually and no such significant differences are obtained in the
Precision (
List,
User) and
Recall (
List,
User) measures. In this case, the experimental results show that the proposed method 2 can provide a better recommendation based on the defined metrics when λ = 0.5.
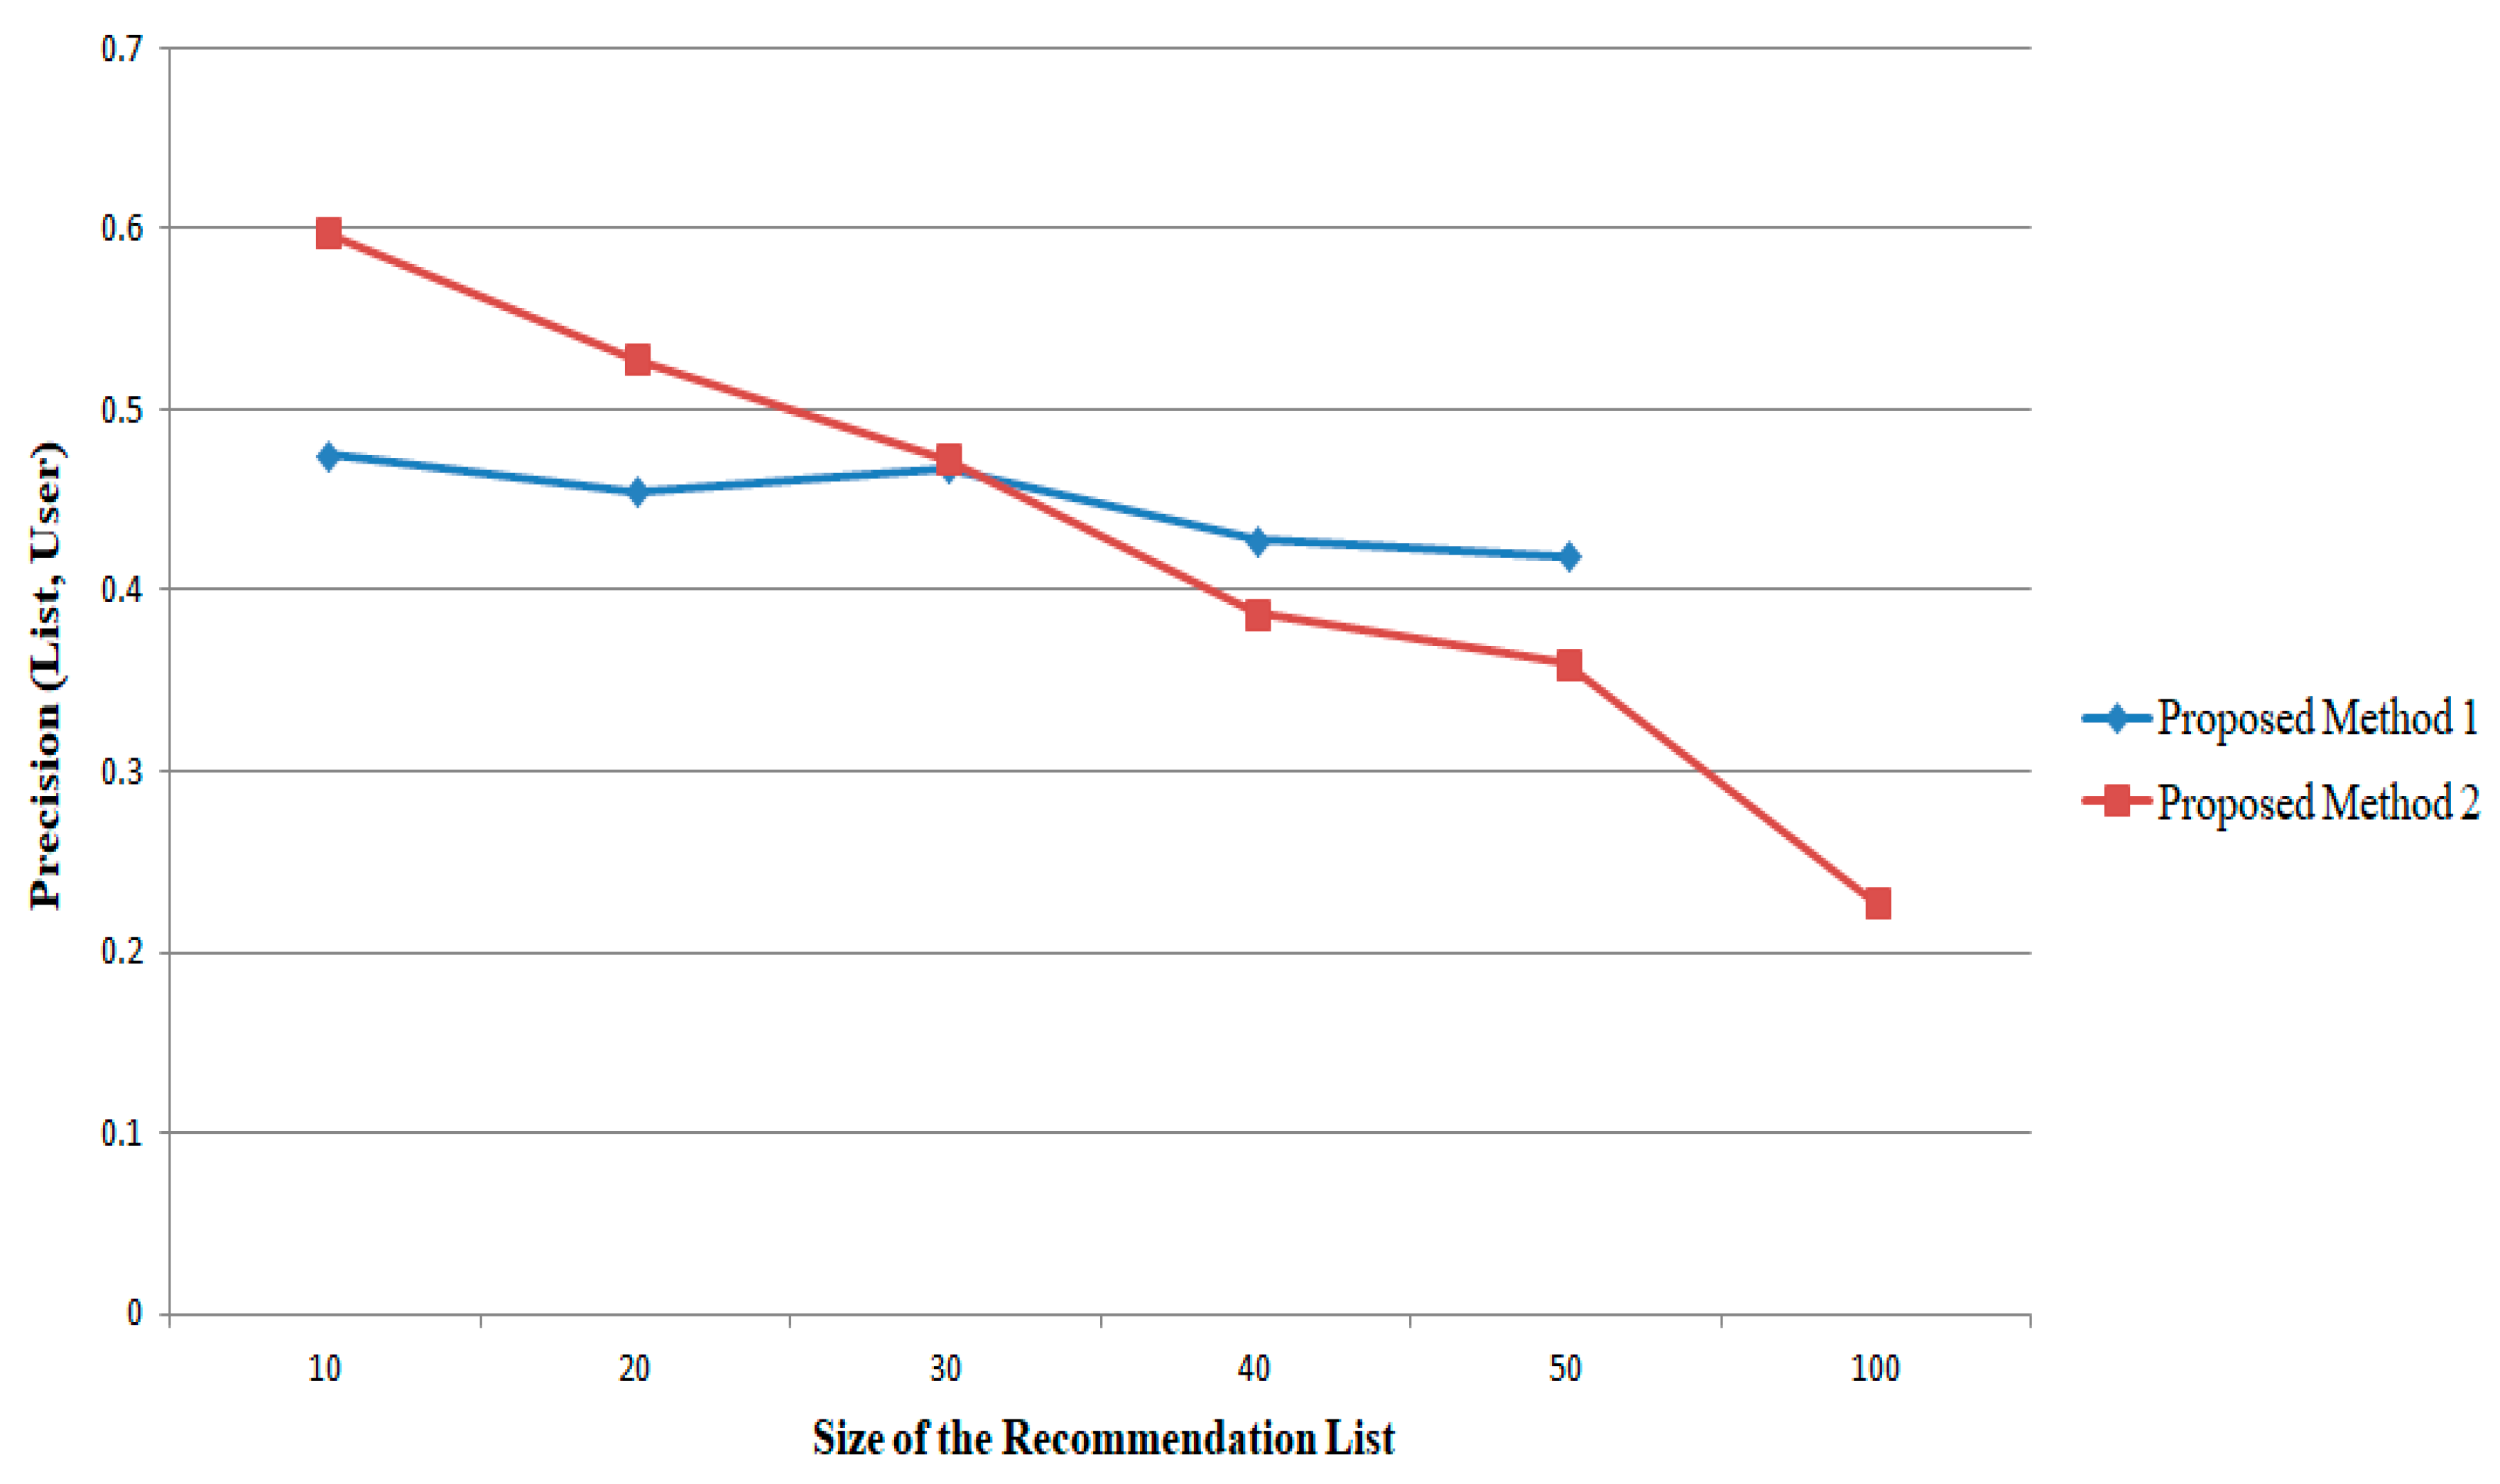
For the
Book-Crossing dataset, the metric
Precision (
List,
User) is evaluated for different sizes of the recommendation list, for example, for the values of |
L| = 10, 20, 30, 40, 50, and 100. The corresponding metric is plotted as shown in
Figure 9. When this metric becomes higher, the items that are in
L corresponding to the items list that is corresponding to the users present in the testing set values. By keeping the tuning parameter as λ = 0.5, the proposed method 2 provides better performance while |
L| ≤ 30. When |
L| > 30, it seems that the proposed method 1 provides better recommendation based on this metric.
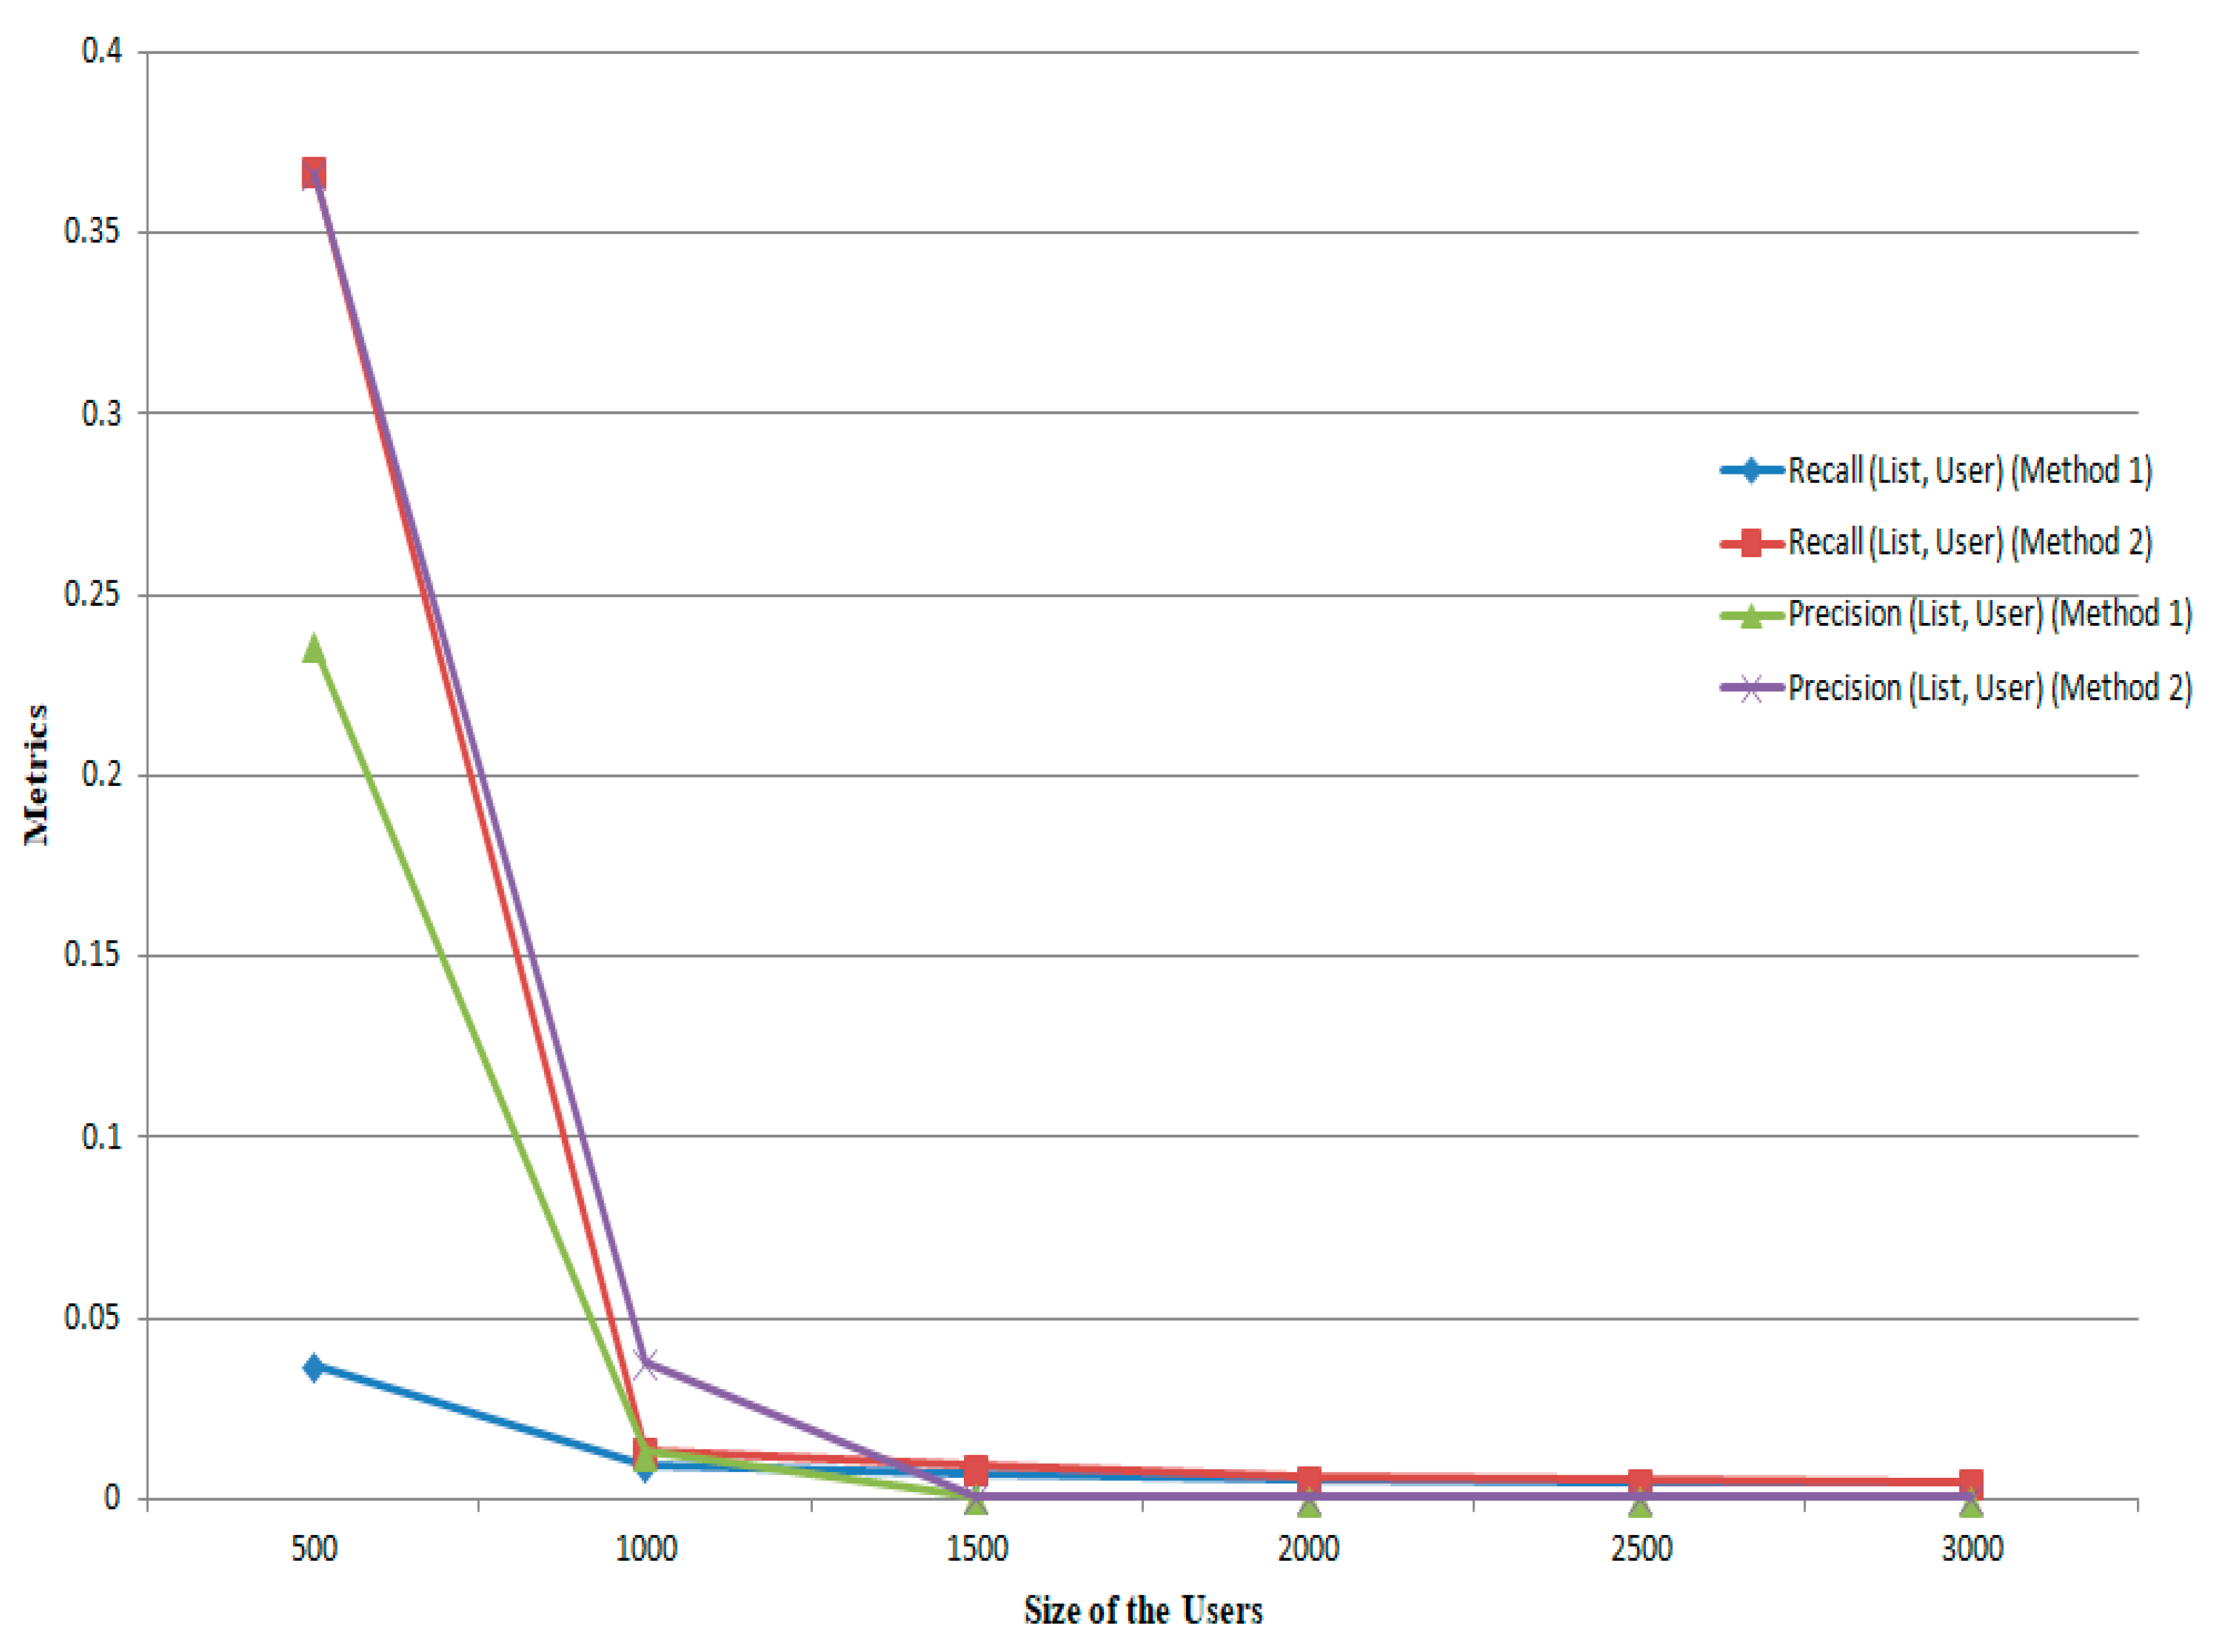
The experiments are also conducted for the
Book-Crossing dataset when varying the user sizes, for example, for the values of 500, 1000, 1500, 2000, 2500, and 3000, and the corresponding
Precision (
List,
User) &
Recall (
List,
User) metrics are plotted as shown in
Figure 10. The experimental results analyze that for small values of user sizes (≤500), higher values of these metrics are obtained. When the user sizes exceed 500, these metrics decrease gradually and the proposed method 2 performs better than the proposed method 1. The significant differences are obtained in these methods because the structure of computation of the methods depends on the number of user attributes, size of the recommendation list, the tuning parameter, and the number of graph edges produced in the bipartite graph. The maximum values of the (
Precision,
Recall) metrics obtained for the
Book-Crossing dataset in the proposed methods are (0.0004, 0.0042) and (0.0004, 0.0046) respectively.
5.4. Discussion of Important Results
The proposed methods are providing better performance compared to the existing methods. The discussion of the important results of the proposed methods is analyzed as follows:
The statistical measurements mean and standard deviation are calculated for the considered datasets after applying the (Equation (19)) 100 times. The expected entropy is minimized after applying more than 90 times. The proposed methods are evaluated using the n group cross-validation in which the data set is divided into n groups of equal sizes. , that is, the users are those who are available both in testing and the training set, are considered for the evaluation. The simulation outcomes are tested using the statistical t-test with a level of significance α = 0.05 to check if there is a significant difference between the proposed methods with the existing methods that is statistically significant. The measures and are computed for each dataset, after applying the clustering with the number of executions 10. It has been experimentally found that the accuracy of the proposed methods is slightly decreasing while the group size is increasing since the group recommendation depends on the diverse set of users and specific personal features.
The performance of specific feature selection is analyzed based on varying the values of neighborhood sizes |S|. The interesting result is obtained during the simulation when the experiments are conducted for small, medium, and large neighborhood sizes |S|. The RMSE values of 41% and 37% are obtained in the proposed methods when |S| < 20. When the value of |S| increases, RMSE also increases. For large values of |S|, there is a significant difference that becomes smaller in the proposed methods. The simulation of proposed methods on the large scale data set, Book-Crossing, when varying the tuning parameter λ for the different values such as 0.3, 0.4, 0.5, and 0.6, produces significant results. It has been experimentally found that when λ < 0.5, the Ranking Score (User) increases while the Precision (List, User) and Recall (List, User) measures decrease. When λ > 0.5, the Ranking Score (User) also increases gradually and no such significant differences are obtained in the Precision (List, User) and Recall (List, User) measures. In this case, the experimental results show that the proposed method 2 can provide a better recommendation based on the defined metrics when λ = 0.5.
For the Book-Crossing dataset, the simulation has been conducted for different sizes of |L| = 10, 20, 30, 40, 50, and 100. When this measurement becomes higher, the items that are in L correspond to the items list that is corresponding to the users present in the testing set values. By keeping the tuning parameter as λ = 0.5, the proposed method 2 provides better performance while |L| ≤ 30. When |L| > 30, it seems that the proposed method 1 provides better recommendation based on this metric. The simulation has been performed on the Book-Crossing dataset when varying the user sizes, in multiples of 500, up to the maximum of 3000. The experimental results analyze that for small values of user sizes (≤ 500), higher values of the metrics are obtained. When the user sizes exceed 500, the metrics decrease gradually and the proposed method 2 performs better than the proposed method 1. The significant differences are obtained in these methods because the structure of computation of the methods depends on the number of user attributes, size of the recommendation list, the tuning parameter, and the number of graph edges produced in the bipartite graph. The maximum values of the (Precision, Recall) metrics obtained for the Book-Crossing dataset in the proposed methods are (0.0004, 0.0042) and (0.0004, 0.0046) respectively. The proposed method 2 works well when λ = 0.5 with the size of the recommendation list |L| = 30 and the size of the neighborhood is 30, and it automatically tunes the tuning parameter λ.


