Article

Ranking Multi-Metric Scientific Achievements Using a Concept of Pareto Optimality

by
Shahryar Rahnamayan
1,
Sedigheh Mahdavi
1,
Kalyanmoy Deb
2 and
Azam Asilian Bidgoli
1,*
1
Nature Inspired Computational Intelligence (NICI) Lab, Department of Electrical, Computer, and Software Engineering, Ontario Tech University, Oshawa, ON L1G 0C5, Canada
2
Department of Electrical and Computer Engineering, Michigan State University (MSU), East Lansing, MI 48824, USA
*
Author to whom correspondence should be addressed.
Mathematics 2020, 8(6), 956; https://doi.org/10.3390/math8060956
Submission received: 18 April 2020 / Revised: 28 May 2020 / Accepted: 2 June 2020 / Published: 11 June 2020
(This article belongs to the Special Issue Evolutionary Computation 2020)

Abstract

:
The ranking of multi-metric scientific achievements is a challenging task. For example, the scientific ranking of researchers utilizes two major types of indicators; namely, number of publications and citations. In fact, they focus on how to select proper indicators, considering only one indicator or combination of them. The majority of ranking methods combine several indicators, but these methods are faced with a challenging concern—the assignment of suitable/optimal weights to the targeted indicators. Pareto optimality is defined as a measure of efficiency in the multi-objective optimization which seeks the optimal solutions by considering multiple criteria/objectives simultaneously. The performance of the basic Pareto dominance depth ranking strategy decreases by increasing the number of criteria (generally speaking, when it is more than three criteria). In this paper, a new, modified Pareto dominance depth ranking strategy is proposed which uses some dominance metrics obtained from the basic Pareto dominance depth ranking and some sorted statistical metrics to rank the scientific achievements. It attempts to find the clusters of compared data by using all of indicators simultaneously. Furthermore, we apply the proposed method to address the multi-source ranking resolution problem which is very common these days; for example, there are several world-wide institutions which rank the world’s universities every year, but their rankings are not consistent. As our case studies, the proposed method was used to rank several scientific datasets (i.e., researchers, universities, and countries) for proof of concept.

1. Introduction

Nowadays, ranking of scientific impacts is a crucial task and it is a focus of research communities, universities, and governmental funding agencies. In this ranking, the target entities can be researchers, universities, countries, journals, or conferences. Performance analysis and benchmarking of scientific achievement has a variety of substantial purposes. At the researcher level, the research’s impact is an important measure to define the main rules of academic institutions and universities on determination of funding, hiring, and promotions [1,2,3]. From the university’s view point, university rankings are considered as a source of strategic information for governments, funding agencies, and the media in order to compare universities; then students and their parents use university rankings as a selection criterion [4]. As the assessment of scientific achievement has gained a great deal of attention for various interested groups, such as students, parents, institutions, academicians, policy makers, political leaders, donors/funding agencies, and news media; several assessment methods have been developed in the field of bibliometry and scientometrics through the utilization of mathematical and/or statistical methods [1].
In order to measure a researcher’s performance, many indicators have been proposed which can also be utilized in other scientific areas. Traditional research indicators include the numbers of publications and citations, the average number of citations per paper, and the average number of citations per year [5]. In 2005, Hirsch [6] proposed a new indicator, called h-index, which revolutionized scientometrics (informetrics). The original definition of the h-index indicator is that, “A scientist has the index h if h of his/her N p papers have at least received h citations each, and the other N p h papers have no more than h citations each.” Later, other indicators were proposed to enhance the h-index. Additionally, h-index was defined for other scientific aggregation levels [7]. Ranking methods at researcher level tend to use only one indicator (h-index or its improved versions), but at other aggregation scientific levels they prefer to have a more comprehensive set of indicators. Research works in the scientometrics can be divided into the following two main categories: the first category includes methods which focus on introducing new indicators to enhance the performances of assessment metrics, and in the second category, methods attempt to develop enhanced ranking methods for obtaining ranks by using several various indicators.
There are various kinds of ranking methods; first, methods which focus only on one indicator; and second, methods which combine several of them. Considering only a specific indicator makes differences among the quality assessments of research outcomes very hard to be revealed. On the other hand, there are a few challenges for considering several indicators simultaneously. For instance, the method needs to find the proper weights for combining the indicators and also an efficient merging strategy to combine several different types of indicators.
In the field of optimization, an algorithm tries to find the best solution in a search space in terms of an objective function which should be minimized or maximized [8] accordingly. However, in singe-objective problems [9], there is only one objective to be optimized; in the multi-objective version, the algorithm tries to find a set of solutions based on more than one objective [10]. In the multi-objective optimization [11,12], the non-dominated sorting [13,14] is defined and used as a measure of efficiency in metaheuristic-based methods [15,16]. In [17], the basic dominance ranking was used to identify the excellent scientists according to all selected criteria. They selected all researchers in the first Pareto-front as excellent scientists, but by increasing the number of criteria (more than three) most compared entities were placed in the first Pareto front [17]. In this paper, we propose a modified, non-dominated sorting, which according to the basic dominance ranking, utilizes two main metrics and then two statistical metrics which are the computed means and medians of some ranks obtained by sorting each criterion’s value in all compared vectors. This ranking has many major advantages: (1) it can perform very well at ranking all compared vectors even with a large number of criteria; (2) each obtained Pareto front in the modified non-dominated sorting has a smaller number of vectors in compared to the basic non-dominated sorting approach; (3) it can consider the length time of academic research (called the research period) as an independent indicator, which makes it possible to compare junior and senior researchers; (4) it is independent and capable of accommodating new indicators; (5) there is no need to determine the optimal weights to combine indicators. The modified Pareto dominance ranking was used to rank two research datasets with many criteria, ranking universities (200 samples) and countries (231 samples); additionally, the basic dominance ranking was applied to rank two research datasets with a low number of the criteria, ranking computer science researchers based on h-index and period of publication (350 samples) and ranking of universities based on triple rankings resources (100 samples).
The remaining sections of this paper are organized as follows. Section 2 presents a background review which provides state-of-the-art scientific indicators and ranking methods. Section 3 describes the proposed ranking method in detail. Section 4 presents case studies and corresponding discussions. Finally, the paper is concluded in Section 5.

2. Background Review

In this section, we review several state-of-the-art scientific indicators and several recent ranking methods.

2.1. A Brief Description of State-of-the-Art Scientific Indicators

Several indicators have been proposed to measure the scientific achievements. The pioneer studies introduced some basic indicators and described how these indicators can be combined to find the general intuition of the scientific outputs for researchers [18,19]. These indicators can be categorized in the following three main groups [20,21]:
  • Production based indicators: these indicators were developed to assess the quantity of production such as the total number of published papers and the number of papers published during a limited time.
  • Impact based indicators: they were proposed to quantify the impact of the researchers’ publications; e.g., the total number of citations, the average number of citations per paper, the number of high-impact papers (papers with more than a specific number of citations), and the number of citations of the high-impact papers.
  • Indicators based on the impact of the journals: these indicators were designed to consider journals where the papers are published; e.g., the median impact factor of the journals, relative citation rates (publication citations compared with the average citations of papers in the journal), and normalized position of the journals (computed according to position of journal in the ordered list in term of impact factor).
Some advantages and disadvantages of well-known indicators [6,22] are shown in Table 1.
In 2005, Hirsch dramatically changed scientometrics (informetrics) by introducing the h-index measure. Several studies have discussed and extended the validity of the h-index [23] since its introduction. The h-index has some significant properties [24,25]. It considers two aspects, the number of publications and their impacts on research. It performs better than other basic indicators (total number of papers, total number of citations, average number of significant papers, etc.) at evaluating scientific achievements. In [25], an empirical study was conducted to confirm the superiority of the h-index over other basic indicators. In addition, the h-index can effortlessly be computed by using available resources such as the ISI Web of Science. Although it was extensively utilized as a scientometrics measure, it still suffers from the following drawbacks [1,26,27,28]:
  • The h-index highly depends on the length of the academic career (the research period) because it is supposed the publications and citations of researchers increase over time. The h-index of new researchers has a very low value, and so it is not applicable for comparing scientists at different stages of their academic careers.
  • It is field-dependent; therefore it can be useful to compare scientists in the same field of study.
  • The h-index never decreases and also it may increase even if no new papers are published because the number of received citations for scientists can be increased with time. However, the value of h-index indicates the impact of the publications; it is strongly dependent on one aspect of the research; i.e., the age of research. In order to compare two scientists fairly based on their research achievements, in addition to quality evaluation, the period of time that they have researched over is also important. In other words, for two researchers with the same value of h-index, the researcher with shorter research period is the more successful researcher. Consequently, the h-index cannot be a standalone metric to assess the rank of a scientist in terms of different criteria.
  • It is insensitive to performance changes because when first h articles received at least h times h, i.e., h 2 citations, it does not consider the number of citations they receive.
  • Additionally, the h-index suffers from the same issues as other indicators, such as self-citations and being field-dependent. Some of these issues include difficulty in finding reference standards, and also problems of collecting all required data to compute the h-index (for example, discriminating between scientists with the same names and initials is challenging).
Several variants of the h-index have been developed to overcome the drawbacks of the h-index. The m-quotient [6] was proposed to account for years since the first publication, and it is computed as follows.
m - quotient = h - index n ,
where n is the number of years since the first published paper of the scientist. Batista et al. [29] introduced a complementary index as the h I index which is defined by:
h I = h 2 / N a T ,
where N a T is the number of authors in the considered h papers. In [30], A-index was suggested as the average number of citations of publications included in the h(Hirsch)-core which is mathematically defined as.
A = 1 h j = 1 h c i t j
The A R index [31] was proposed as the square root of the sum of the average number of citations per year of articles included in the h(Hirsch)-core. The mathematical definition of the index is as bellow.
A R = j = 1 h c i t j a j ,
where a j is the age of jth paper. Liang et al. [26] suggested a new index, the R-index, which found by calculating the square root of the sum of citations in the Hirsch core without dividing by h. This indicator is mathematically defined as.
R = j = 1 h c i t j
Egghe [28] introduced the g index which is defined as the highest number g of papers such that the top g papers together have at least g 2 citations. Additionally, it has proven that there is a unique g for any set of papers and g > h . Egghe and Rousseau [32] proposed the citation-weighted h-index ( h w -index) as follows.
h w = j = 1 r 0 c i t j , r w ( i ) = j = 1 i c i t j h ,
where c i t j is the number of the j-th most cited paper; r 0 is the largest row index i such that r w ( i ) c i t i . In general, even enhanced version of h-index metrics suffer from combining several metrics instead of considering them simultaneously.

2.2. A Brief Review of Ranking Methods

At the researcher level, all mentioned indicators can be applied to measure researchers’ achievements. Although other scientific applications such as ranking scientific journals, research teams, research institutions, and countries tend to include a more comprehensive set of indicators, it is possible to apply the scientific indicators of researcher in other scientific comparative applications. For example, h-index can be calculated for an institute: “The h-index of an institute would be h 2 if h 2 number of its researchers have an h 1 -index of at least h 2 each, and the other ( N h 2 ) researchers have h 1 -indices lower than h 2 each” [7]. In following, we briefly review some common ranking methods and indicators for universities. University rankings mainly use two different general categorizes of methodologies [33,34,35,36,37,38,39]; the first category uses all indicators [40,41] to calculate a single score, while the second category focuses more on a single dimension of university performance, such as the quality of research output [4], career outcomes of graduates [37], or the mean h-index [42]. The other indicators for university rankings are publication and citation counts, student/faculty ratio, percentage of international students, Nobel and other prize commonality, number of highly cited researchers and papers, articles published in Science and Nature, the h-index, and web visibility. First, some ranking methodologies of the first category are briefly described as below.
Liu and Cheng [43] proposed a ranking strategy, called Academic Ranking of World Universities (ARWU), which considers four measures: quality of education, quality of faculty, research output, and per capita performance. For comparison of four measures, the following six indicators are considered: (1) alumni of a university winning a Nobel Prize or a Fields Medal, (2) staff of a university winning a Nobel Prize or a Fields Medal, (3) highly cited researchers in 21 broad scientific fields, (4) publications in Nature and Science, (5) publications indexed in Web of Science, and (6) per capita academic performance of a university. It gives a score of 100 for the best performing university in each category and this university is considered as the benchmark against for computing the scores of all other universities. Then, the total scores of Universities are calculated as weighted averages of their individual category scores [44]. THE-QS World University Ranking (THE-QS) (http://www.topuniversities.com) was published by the Quacquarelli Symonds Company and considers six distinct indicators: academic reputation according to a large survey (40%), employer reputation (10%), the student faculty ratio (20%), citations per faculty based on the Scopus database (20%), the proportions of international professors (5%), and international students (5%). The World University Ranking was developed by Times Higher Education (www.timeshighereducation.co.uk/world-university-rankings) [41] which considers 13 indicators to rank universities. These indicators are categorized into five areas: teaching (30%), research (30%), citations (30%), industry income (2.5%), and international outlook (7.5%). They normalize the citation impact indicator to be suitable for different scientific output data.
Another global ranking is the Scimago Institutions Rankings (SIR) developed by the Scimago research group in Spain (www.scimagoir.com) [45]. SIR combines a quantity and various quality metrics. Indicators are divided into three groups: research output (total number of the publication based on the Scopus database), international collaboration, leader output, high quality publications, excellence, scientific leadership (excellence with leadership, and scientific talent pool), innovation (innovative knowledge and technological impact), and societal (web size and the number of incoming links). The Cybermetrics Lab developed the Ranking Web of World Universities or Webometrics Ranking [46,47] which uses web data extracted from commercial search engines, including the number of webpages, documents in rich formats (pdf, doc, ppt, and ps), papers indexed by Google Scholar (indicator added in 2006), and the number of external in links as a measure of link visibility or impact. Higher Education Evaluation and Accreditation Council of Taiwan [48]) conducts university ranking which applies multiple indicators in the three categories: research productivity (the number of articles published in the past 11 years (10%) and the number of articles published in the current year (15%)), research impact (number of citations in the past 11 years (15%), number of citations in the past 2 years (10%), and average number of citations in the past 11 years (10%)), and research excellence (the h-index of the last 2 years (10%), the number of highly cited papers in the past 11 years (15%), and the number of articles of the current year in high impact journals (15%)). These rankings combine multiple weighted indicators to gain a single aggregate score to rank all universities. Additionally, some universities rankings [49,50] employed I-distance method [51] to apply all indicators for computing a single score as the rank. Besides its ability to calculate a single index (by considering several indicators) and consequently ranking countries, CIDI startegy utilizes the Pearson’s coefficients of correlation, calculated using the I-distance method. In this case, the relevance of each input measure will be preserved. The I-distance method specifies the most important indicator instead of calculating numerical weights. The rank of indicator is determined by ordering them based on these correlations. In following, we mention some of ranking methodologies of the second category. The Centre for Science and Technology Studies at Leiden University published the LEIDEN Ranking (http://www.cwts.nl/ranking/LeidenRankingWebsite) [4,52] which has two main categories of indicators: impact and collaboration. The impact group includes three indicators: mean citation score, mean normalized citation score, and proportion of top 10% publications. The collaboration group includes four indicators: proportion of inter-institutional collaborative publications, proportion of international collaborative publications, proportion of collaborative publications with industry, and mean geographical collaboration distance. The Leiden Ranking considers the scientific performance instead of combining multiple indicators of university performance in a single aggregate indicator. U-Multirank [53,54] employs the variety of institutional missions and profiles and includes teaching and learning-related indicators. Additionally, it considers the importance of a user-driven approach in which the stakeholders/users are asked to determine indicators and their quality for ranking. In [37], they proposed a ranking methodology which considers only career outcomes of university graduates. This ranking focuses on the impact of universities on industry by their graduates. The mean h-index was used in [42] as a ranking metric to rank the chemical engineering, chemistry, materials science, and physics departments in Greece.

3. Proposed Methodology

As mentioned in the Section 2, several indicators and ranking methods have been proposed to measure the scientific achievements. There are two main categories of ranking methods: in the first one, the methods use all indicators (multi-metric) and in the second one, the methods focus on only one indicator (single-metric). Ranking methods by focusing on one indicator of scientific achievements cannot reveal significant differences among compared entities. In ranking methods with several indicators, first they need to assign weights for indicators which have considerable impacts on the results of these raking methods [55,56]. Finding the proper weights according to importance of indicators is a challenging task [57]. They also suffer from combining several different kinds of indicators to achieve a single score. In this paper, we modify the dominance depth ranking proposed in [13,14] utilized in the multi-objective optimization to rank scientific achievements. In 1964, Pareto [58] proposed the Pareto optimality concept, which has been applied in a wide range of application, such as economics, game theory, multi-objective optimization, and the social sciences [59]. Pareto optimality was mathematically defined as a measure of efficiency in the multi-objective optimization [12,60]. We explain Pareto optimality concepts and also the proposed method and how it can be applied to evaluate scientific achievements. Without loss of generality, it is assumed that the optimal value of each criterion as a preference be a minimal value. Seeking the optimal value among both the minimal and maximal values is analogous, and if a criterion value element C i to be maximized, it is equivalent to minimize C i .
In the following, the Pareto optimality definitions are described by the assumption of the minimal value as the optimal.
Definition 1
((Pareto Dominance) [61]). A criterion vector u = ( u 1 , , u n ) dominates another criterion vector v = ( v 1 , , v n ) (denoted as u v ) if and only if i { 1 , , n } , u i v i and u v . This type of dominance is called weak dominance in which two vectors can be same in some objectives, but they should be different in at least one objective. However, in strict dominance, u has to be better on all objectives; i.e., it can not have the same objective value with v.
The Pareto optimality concept is defined from the dominance concept as follows.
Definition 2
(Definition (Pareto Optimality) [61]). A criterion vector u in a set of criterion vectors (S) is a Pareto optimal vector (non-dominated) if for every vector x, x does not dominate u, x u .
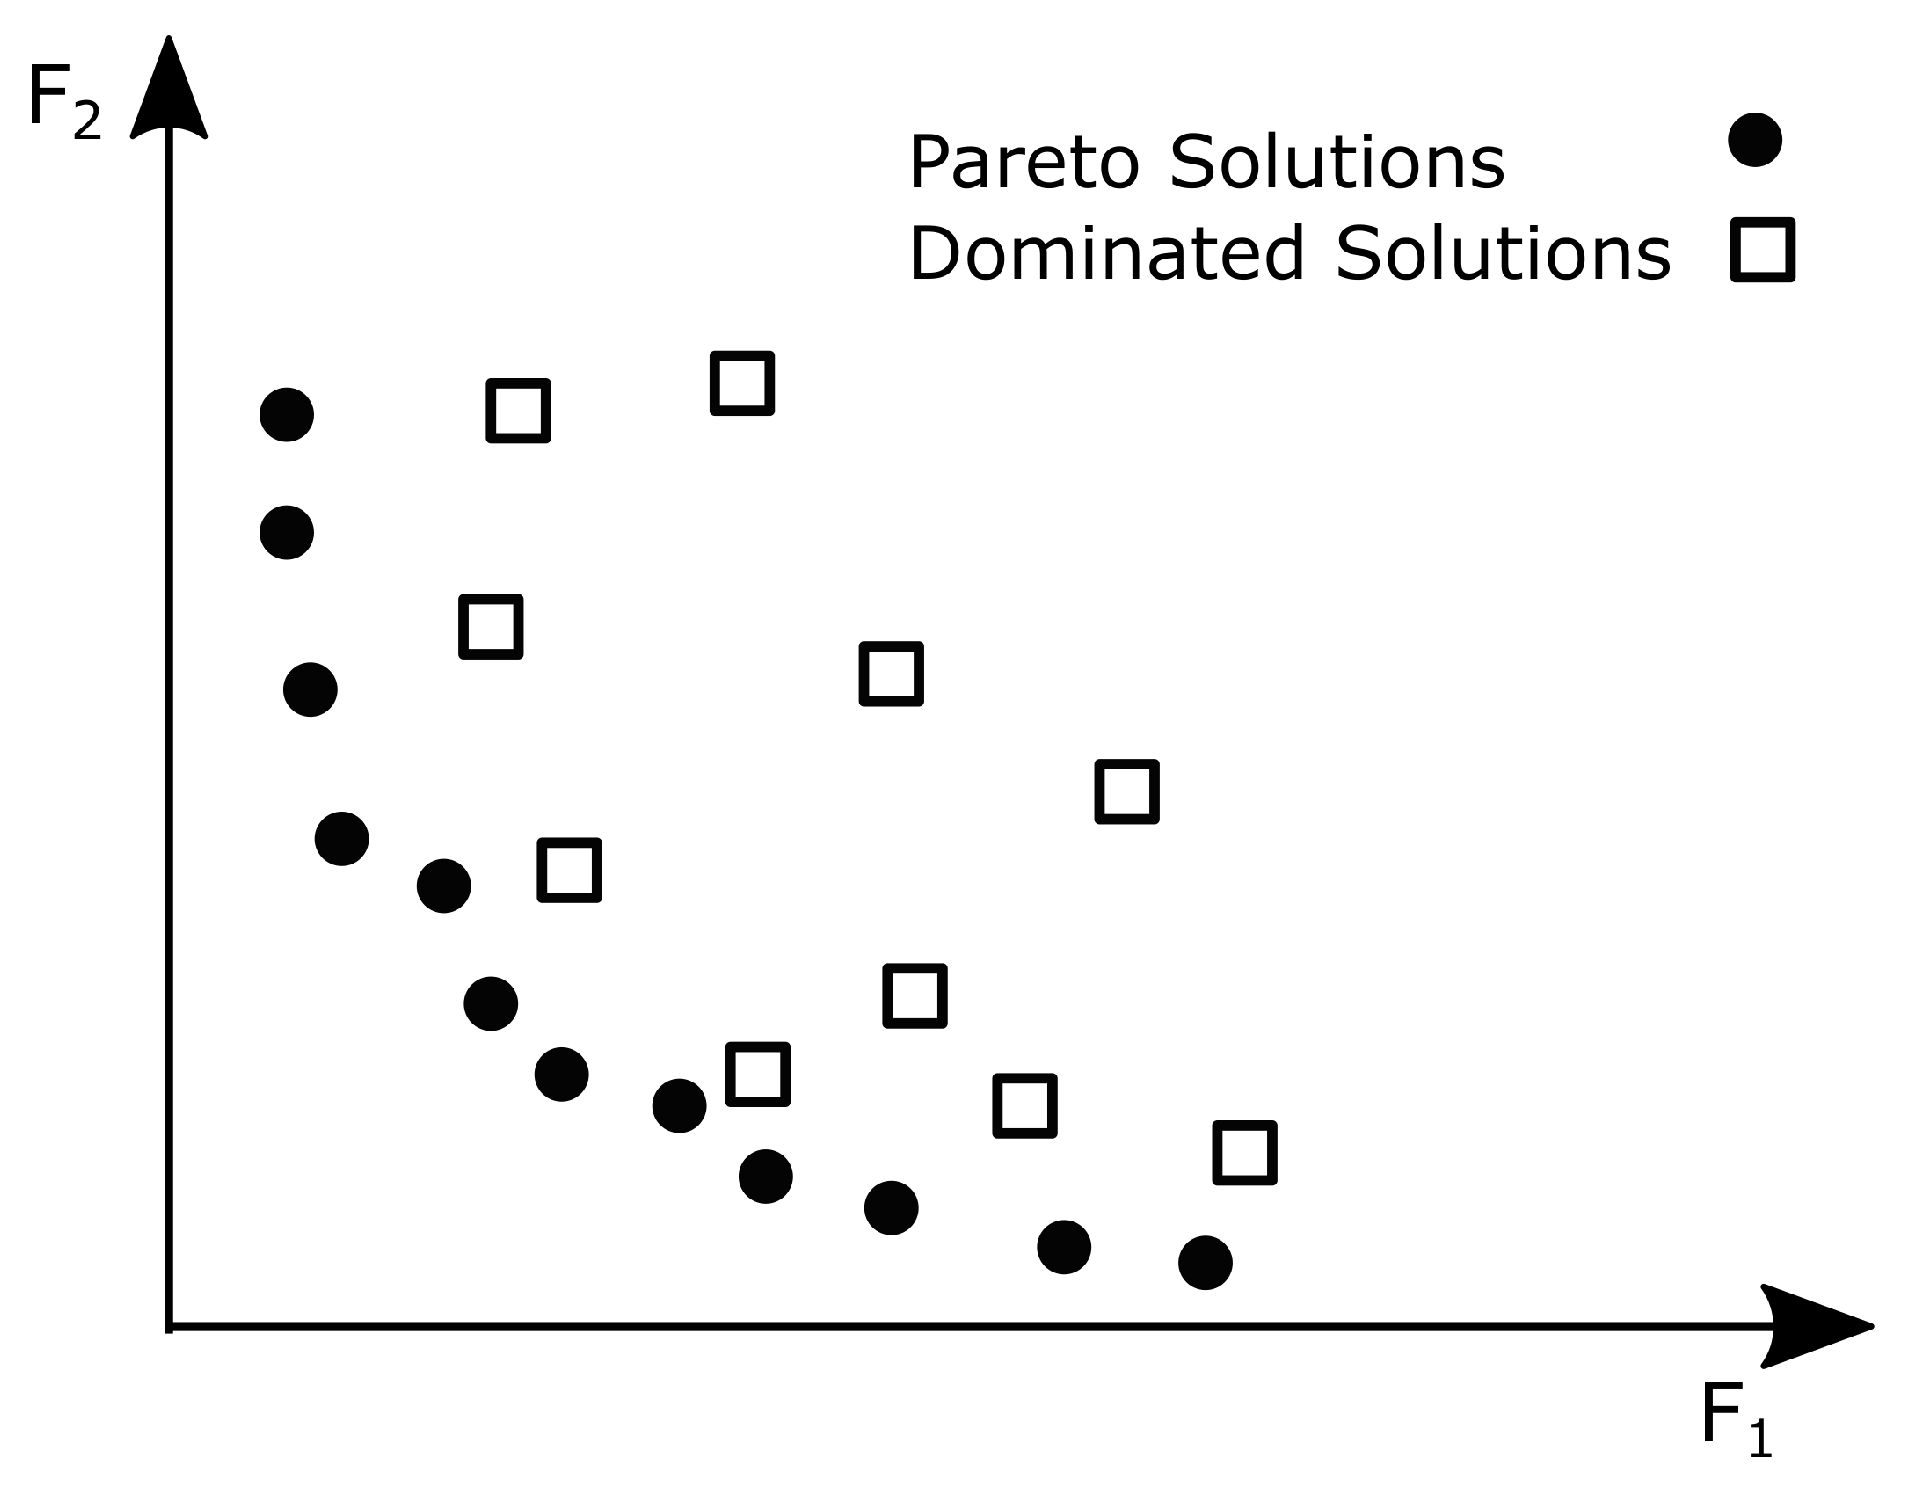
Figure 1 shows Pareto optimal solutions and dominated solutions for a criterion value vectors (2D) ( f 1 , f 2 ). According to this definition, for a set of objective function vectors or criterion value vectors, the Pareto set is denoted as all Pareto optimal vectors which have no elements (criterion values) that can be decreased without simultaneously causing an increase in at least one of the other elements of vectors (assuming a Min-Min case).
Definition 3
(Definition (Pareto-front) [61]). For a given set S, the Pareto front is defined as set S { x S | y S , y x } .
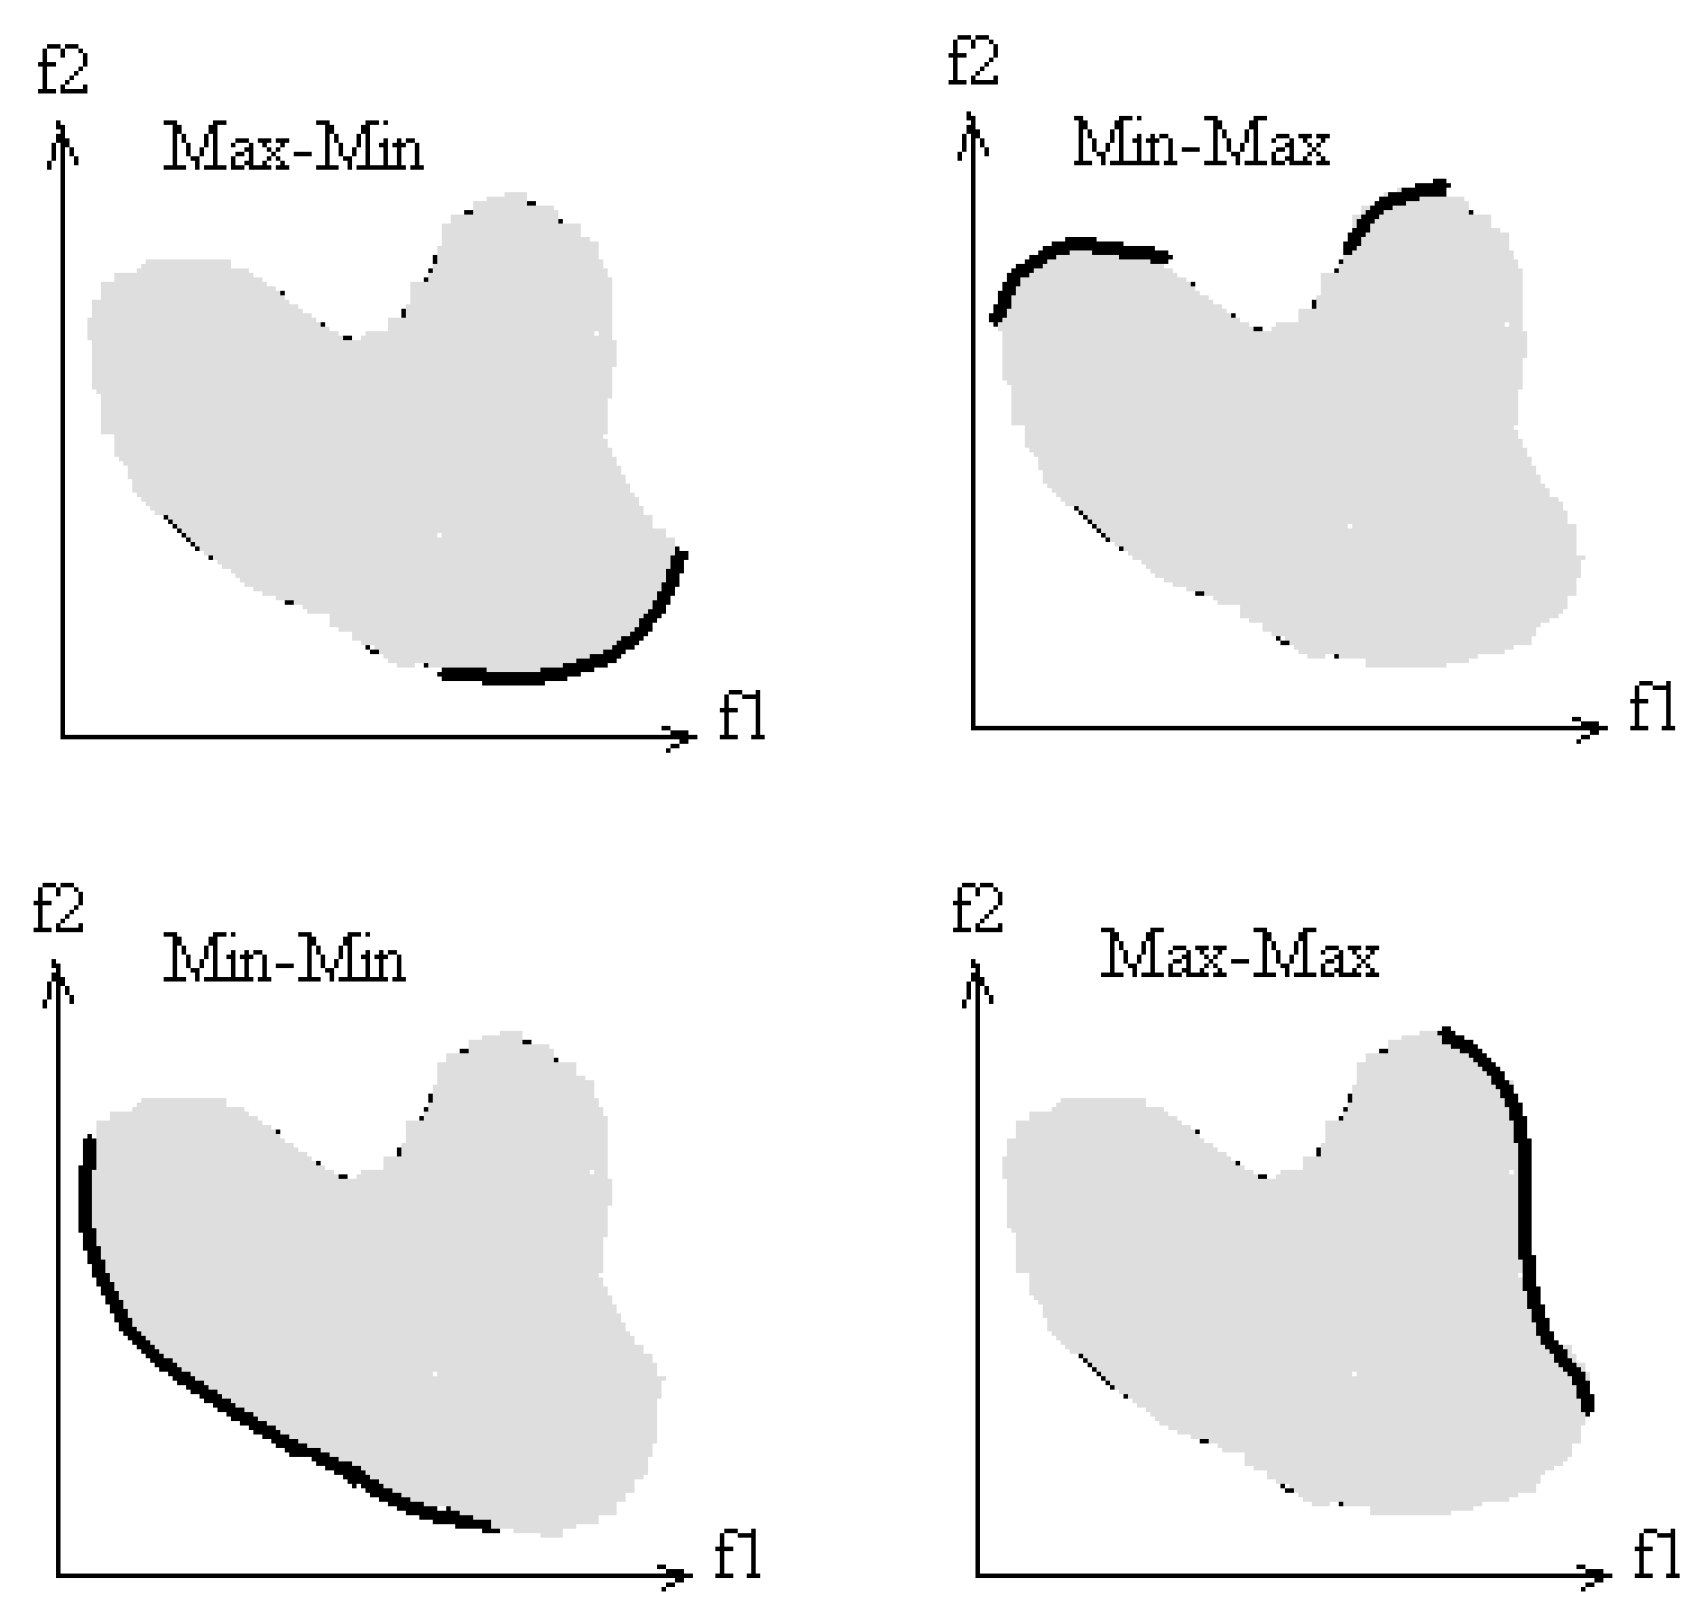
Figure 2 shows the Pareto front for two dimensional space for all four possible cases for minimizing or maximizing of two objective function vectors ( f 1 , f 2 ) or a two criterion value vectors ( f 1 , f 2 ).
Dominance depth ranking in the non-dominated sorting genetic algorithm (NSGA-II) was proposed by Deb et al. [13] to partition a set of objective function vectors (criterion value vectors) into several clusters by Pareto dominance concept. First, the non-dominated vectors in a set of criterion value vectors assigned to rank 1 and form the first Pareto front (PF1), and all these non-dominated vectors are removed. Then, non-dominated solutions are determined in the set and form the second Pareto front (PF2). This process is repeated for other remaining criterion value vectors until there is no vector left. Figure 3 illustrates an example of this ranking for a set of eight points (criterion value vectors) and Table 2 shows the coordinates of points. First points 1, 2, 3, and 4 as non-dominated solutions are ranked to rank 1. Then, for the rest of the points (points 5, 6, 7, and 8), non-dominated solutions are determined so points 5 and 6 as non-dominated solutions are ranked as 2 and removed. In the last iteration, the remaining points 7 and 8 are ranked as rank 3. The details of non-dominated sorting algorithm is presented in Algorithm 1.
Algorithm 1 Non-dominated sorting algorithm.
Mathematics 08 00956 i001
In [17], the dominance concept was used to identify the excellent scientists whose performances cannot be surpassed by others with respect to all criteria. The proposed method can provide a short-list of the distinguished researchers in the case of award nomination. It computes the sum of all criteria and sorts all researchers according to this calculated sum value. After that, the researcher with the maximum sum r m a x is placed in the skyline set. The second best researcher is compared with the researcher in the skyline set ( r s k y l i n e ); if he/she is not dominated by r m a x , he/she is added into the skyline set. This process is repeated for all remaining researchers to construct the skyline set: if they are not dominated by all researchers in the skyline set ( r s k y l i n e ), then they are added into the skyline set. In fact, they select all researchers in the first Pareto front using the dominance concept. There is a well-known problem with the first Pareto created by the basic non-dominated sorting [17]. By increasing the number of criteria (more than three criteria) in the set of the criterion value vectors, a large number of the compared vectors become non-dominated vectors and are placed in the first Pareto front. By increasing the number of criteria, the chance of placing a criterion value vector while having only one better criterion value in the first Pareto front is increased. In order to demonstrate this problem, Table 3 shows three Pareto fronts by the non-dominated sorting for countries data extracted from the site “http://www.scimagojr.com” including five indicators: citable documents (CI-DO), citations, self-citations (SC), citations per document (CPD), and h-index; Table 3 shows the results of the non-dominated sorting method. As it can be seen from Table 3, three countries, Panama, Gambia, and Bermuda, are in the first Pareto front because they have higher values for only one criterion indicator (CPD) while other criteria values are low. Additionally, Montserrat has the rank 2 because it has the high value for only the CPD indicator.
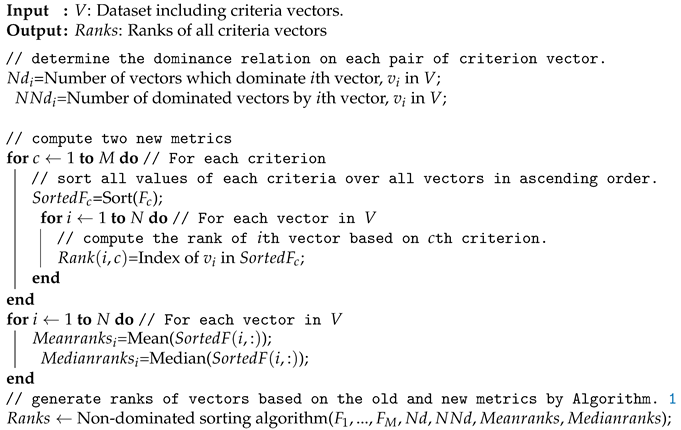
In this paper, we propose a modified non-dominated sorting (described in Algorithm 2) to rank the scientific data. First we use the dominance depth ranking for all vectors; after that for each criterion value vector two new statistical metrics are calculated. For each vector, two metrics are the dominated number and the non-dominated number which show the number of the dominated vectors by this vector and the number of vectors which dominate this vector. Additionally, we used two other statistical measures proposed in [62]. These statistical measures are computed to sort the criterion value vectors. In [62], first for each criterion value C i , all vectors are sorted according to this criterion value C i in ascending order and their ranks are assigned based on their sorting order. After that, for each criterion value vector some statistical measures like the minimum of its rank or the sum of its rank are used to make Pareto fronts.
We also sort all vectors according to each criterion value and calculate the ranks of vectors corresponding this sorting; after that we compute the mean and median of ranks of each vector as two new metrics. Table 2 shows an example of computed new metrics for eight points in Figure 3. F 1 and F 2 are the values of sample points in Figure 3 which are considered just as the numerical examples for a two-objective problem. For each point, ranks (two columns Ranks-F1 and Ranks-F2) for two criterion vectors ( F 1 , F 2 ) are computed according to their sorting order. Thus, we have four new statistical metrics (the mean and median of ranks, also the dominated number and the non-dominated number) which we use as criteria (objectives) to measure various levels of scientific achievement by applying dominance depth ranking again to make all Pareto fronts. We used the basic non-dominated sorting for data with two and three criteria and the modified non-dominated sorting for the data with more than three criteria. The proposed method has major advantages that are described in detail. In this method, vectors with one better criterion value than others cannot move toward the first front. Additionally, increasing the number of criteria cannot negatively influence the obtained ranks (no big portion of entities in the first front, as before); each rank corresponding to a Pareto front has a smaller number of vectors, so in total it assigns more ranks to the criterion vectors.
Algorithm 2 Modified non-dominated sorting algorithm.
Mathematics 08 00956 i002
In order to demonstrate the performance of this modified non-dominated sorting, Table 4 shows four Pareto fronts by the modified non-dominated sorting for extracted country data. Because the considered criteria have different scales, in all experiments, in order to apply the proposed method, they are normalized. As can be seen in the first Pareto front, only the United States is placed and Panama is in the forth Pareto front. Additionally, other countries with only one high criterion value, Gambia and Bermuda, which are in the first Pareto front by the non-dominated sorting method (as it can be seen in Table 3) are not placed in four Pareto fronts obtained by the modified non-dominated sorting method. Additionally, it can be seen that the number of countries in each Pareto front by using the modified non-dominated sorting is smaller than in basic non-dominated sorting.
In addition, we consider the period research as a new criterion value. Using Pareto dominance ranking makes it possible to have the research period as an independent indicator to be considered for ranking the scientific data. Considering the research period as the indicator provides a predication mean for some research cases. For example, suppose for comparing authors, criterion values be h-index and the research period A i = ( h i n d e x , t i m e ) : two authors A 1 = ( 80 , 40 ) and A 2 = ( 20 , 10 ) would be in the same Pareto front because based on Pareto optimality concept, they do not dominate each other; therefore, we can predict that the author A 2 probably will be able to have the same performance as the author A 1 (or even better) after some years. According to observed values of indicators for universities, authors, and countries, this method can be utilized for prediction of their future performance. Additionally, the time length indicator enhances this ranking method with a traceable feature; that means by collecting data during times, we can observe how the performances of universities or researchers change and if they can improve their Pareto front ranks or not. In addition, this method can be applied to compute ranks by using obtained ranks from other ranking methods (ranking by multiple resources). In this way, each indicator is an obtained rank from a ranking method and it is expected that the non-dominated vectors in the first Pareto front contain the vectors with the minimum/maximum values of indicators, for Min-Min or Max-Max cases, respectively. Pareto dominance ranking can take into account any new kind of indicator as a new criterion value.

4. Experimental Case Studies and Discussion

We run the basic Pareto dominance ranking on the following scientific data with two and three criteria and modified Pareto dominance ranking on the following scientific data with more than three criteria. The first dataset includes 350 top computer science researchers (http://web.cs.ucla.edu/~palsberg/h-number.html) which contains a partial list of computer science researchers who each has an h-index of 40 or higher according to the Google Scholar report. This data has two indicators: research period (a low value is better) and h-index (a high value is better). The h-index values were collected from Google Scholar for the year 2016 and research period values were calculated from the year of the first publication of an author so far. The second dataset includes the 200 top universities ranked by URAP (a nonprofit organization (http://www.urapcenter.org)). This dataset has six indicators: article, citation, total document (TD), article impact total (AIT), citation impact total (CIT), and international collaboration (IC). The third dataset has 231 top countries (for the year 2015) extracted from the site SJR (http://www.scimagojr.com), including six indicators: documents, citable documents (CI-DO), citations, self-citations (SC), citations per document (CPD), and h-index. We do not consider the SC indicator because it is not certain that the maximum value or minimum value of this value is desirable. The forth dataset consists of the three ranks of 100 top common universities collected from three resources; the QS World University Rankings (https://www.topuniversities.com), URAP (http://www.urapcenter.org), and CWUR Rankings (http://cwur.org). In the following, we report all results of mentioned approaches on the four datasets in detail.

4.1. The First Case Study: Ranking Researchers

Table A1 indicates the names of researchers, research period, h-index, and the obtained Pareto ranks from the basic Pareto dominance ranking (Pareto ranking). From Table A1, it can be seen that first Pareto ranks include researchers with high values of h-index and low research period values. For instance, the researcher “Zhi-Hua Zhou” has the minimum value of research period 14 and the researcher “A. Herbert” has the maximum value of h-index, 162. Researchers in the first Pareto front are A. Herbert, K. Anil, Han Jiawei, Van Wil, Buyya Rajkumar, Perrig Adrian, and Zhou Zhi-Hua; the second Pareto front contains Shenker Scott, Foster Ian, Salzberg Steven, Schlkopf Bernhard, Schmid Cordelia, Abraham Ajith, and Xiao Yang. Additionally, it can be observed that researchers with the maximum value of research year indicator (40) are associated with the higher rank because they are dominated by other researchers according to Pareto dominance concept. Researchers having values close to the value of h-index 52 or higher are associated with the higher rank due to the Pareto dominance concept. Figure 4 shows the ranks in terms of Pareto fronts for all researchers. It can be seen from Figure 4 that the extent of improvement for a researcher A i can change his/her Pareto front ranking by looking at researchers which dominate A i and are located in the better Pareto fronts.
To gain a better understanding of the Pareto ranking with each indicator, we plot the obtained Pareto ranks from the first rank to the thirty fifth versus each indicator. In Figure 5, vertical lines demonstrate Pareto ranks from the first rank to the thirty fifth, which at the top of each line indicates the maximum value of the indicator; its bottom is the minimum value of the indicator; and the short horizontal tick in the middle of each line is the average value of the indicator. Figure 5 indicates that the research period of the first Pareto front includes values with the maximum and minimum of the length time. That is reasonable because it is expected that authors who have had more time have higher h-index values so they could be located in the first Pareto front, and younger authors having had shorter research periods and reasonable h-index values also could be in the first Pareto front. The average values of the research period for the beginning Pareto fronts are low values while the last Pareto fronts have higher average values. From Figure 5, we can see that the maximum, average, and minimum of h-index values for Pareto fronts decrease from the first Pareto front to the 35th. Additionally, the first Pareto front has the maximum h-index values and the last Pareto front includes the minimum h-index values.

4.2. The Second Case Study: Ranking of Universities

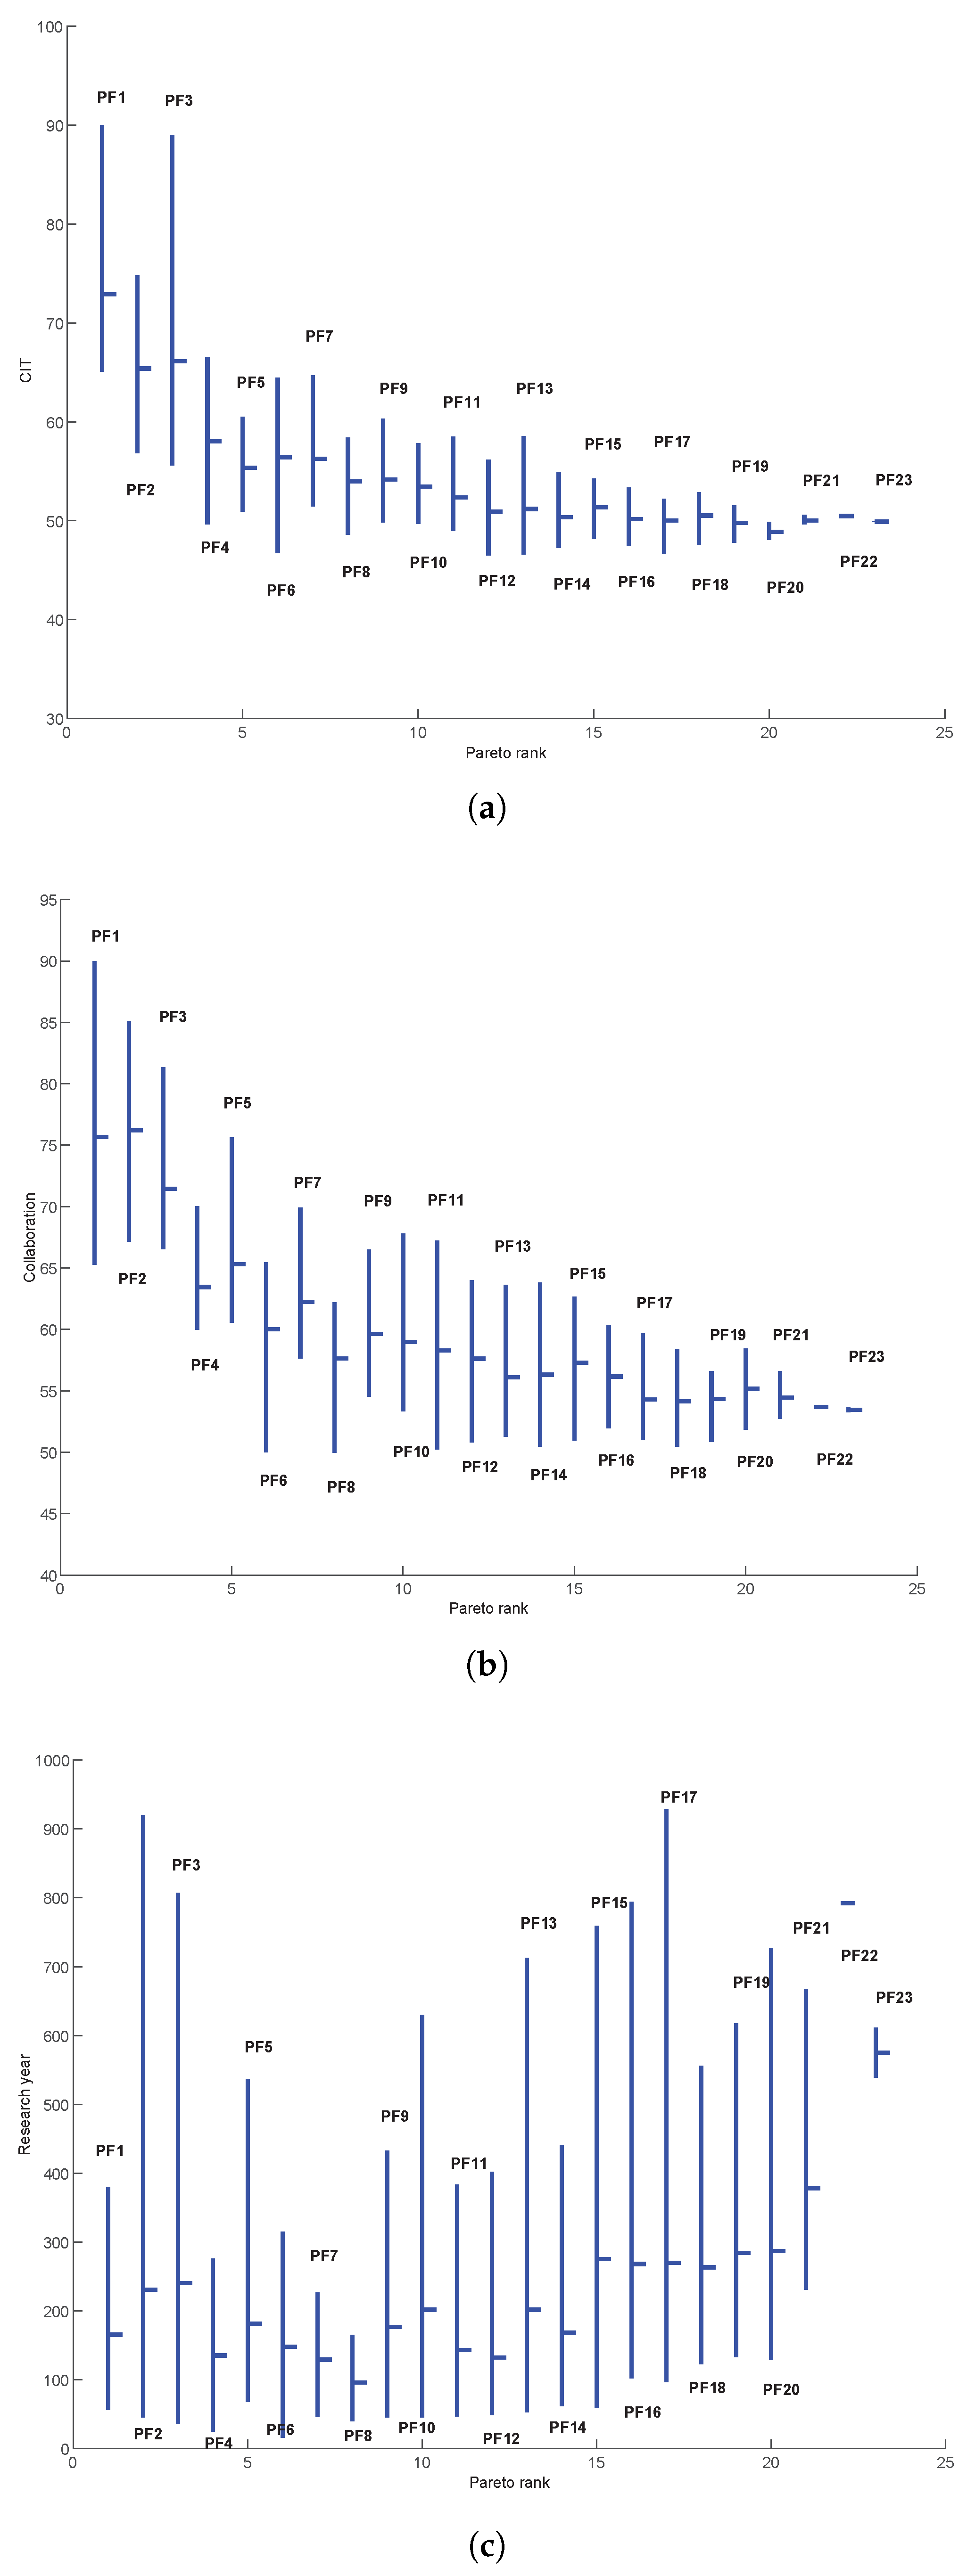
Six indicators of university dataset and their ranks obtained by modified Pareto dominance ranking are summarized in Table A2. As mentioned in Section 3, for fair comparison, we add the time period of academic research (the research period (RP)) mentioned in Table A2 as an indicator in the data which is calculated as the length of the university established year to present. Based on the proposed method, the first Pareto front has six universities, including top universities; for example, Harvard University, University of Toronto, and Stanford University. In the basic Pareto dominance ranking, the first Pareto front has twenty universities. Additionally, the proposed ranking clusters this data into twenty three Pareto fronts but the Pareto dominance ranking has only eight Pareto fronts. As was mentioned in the Section 3, the proposed method can assign more ranks to the criterion vectors even by increasing the number of criteria (many-metric cases).
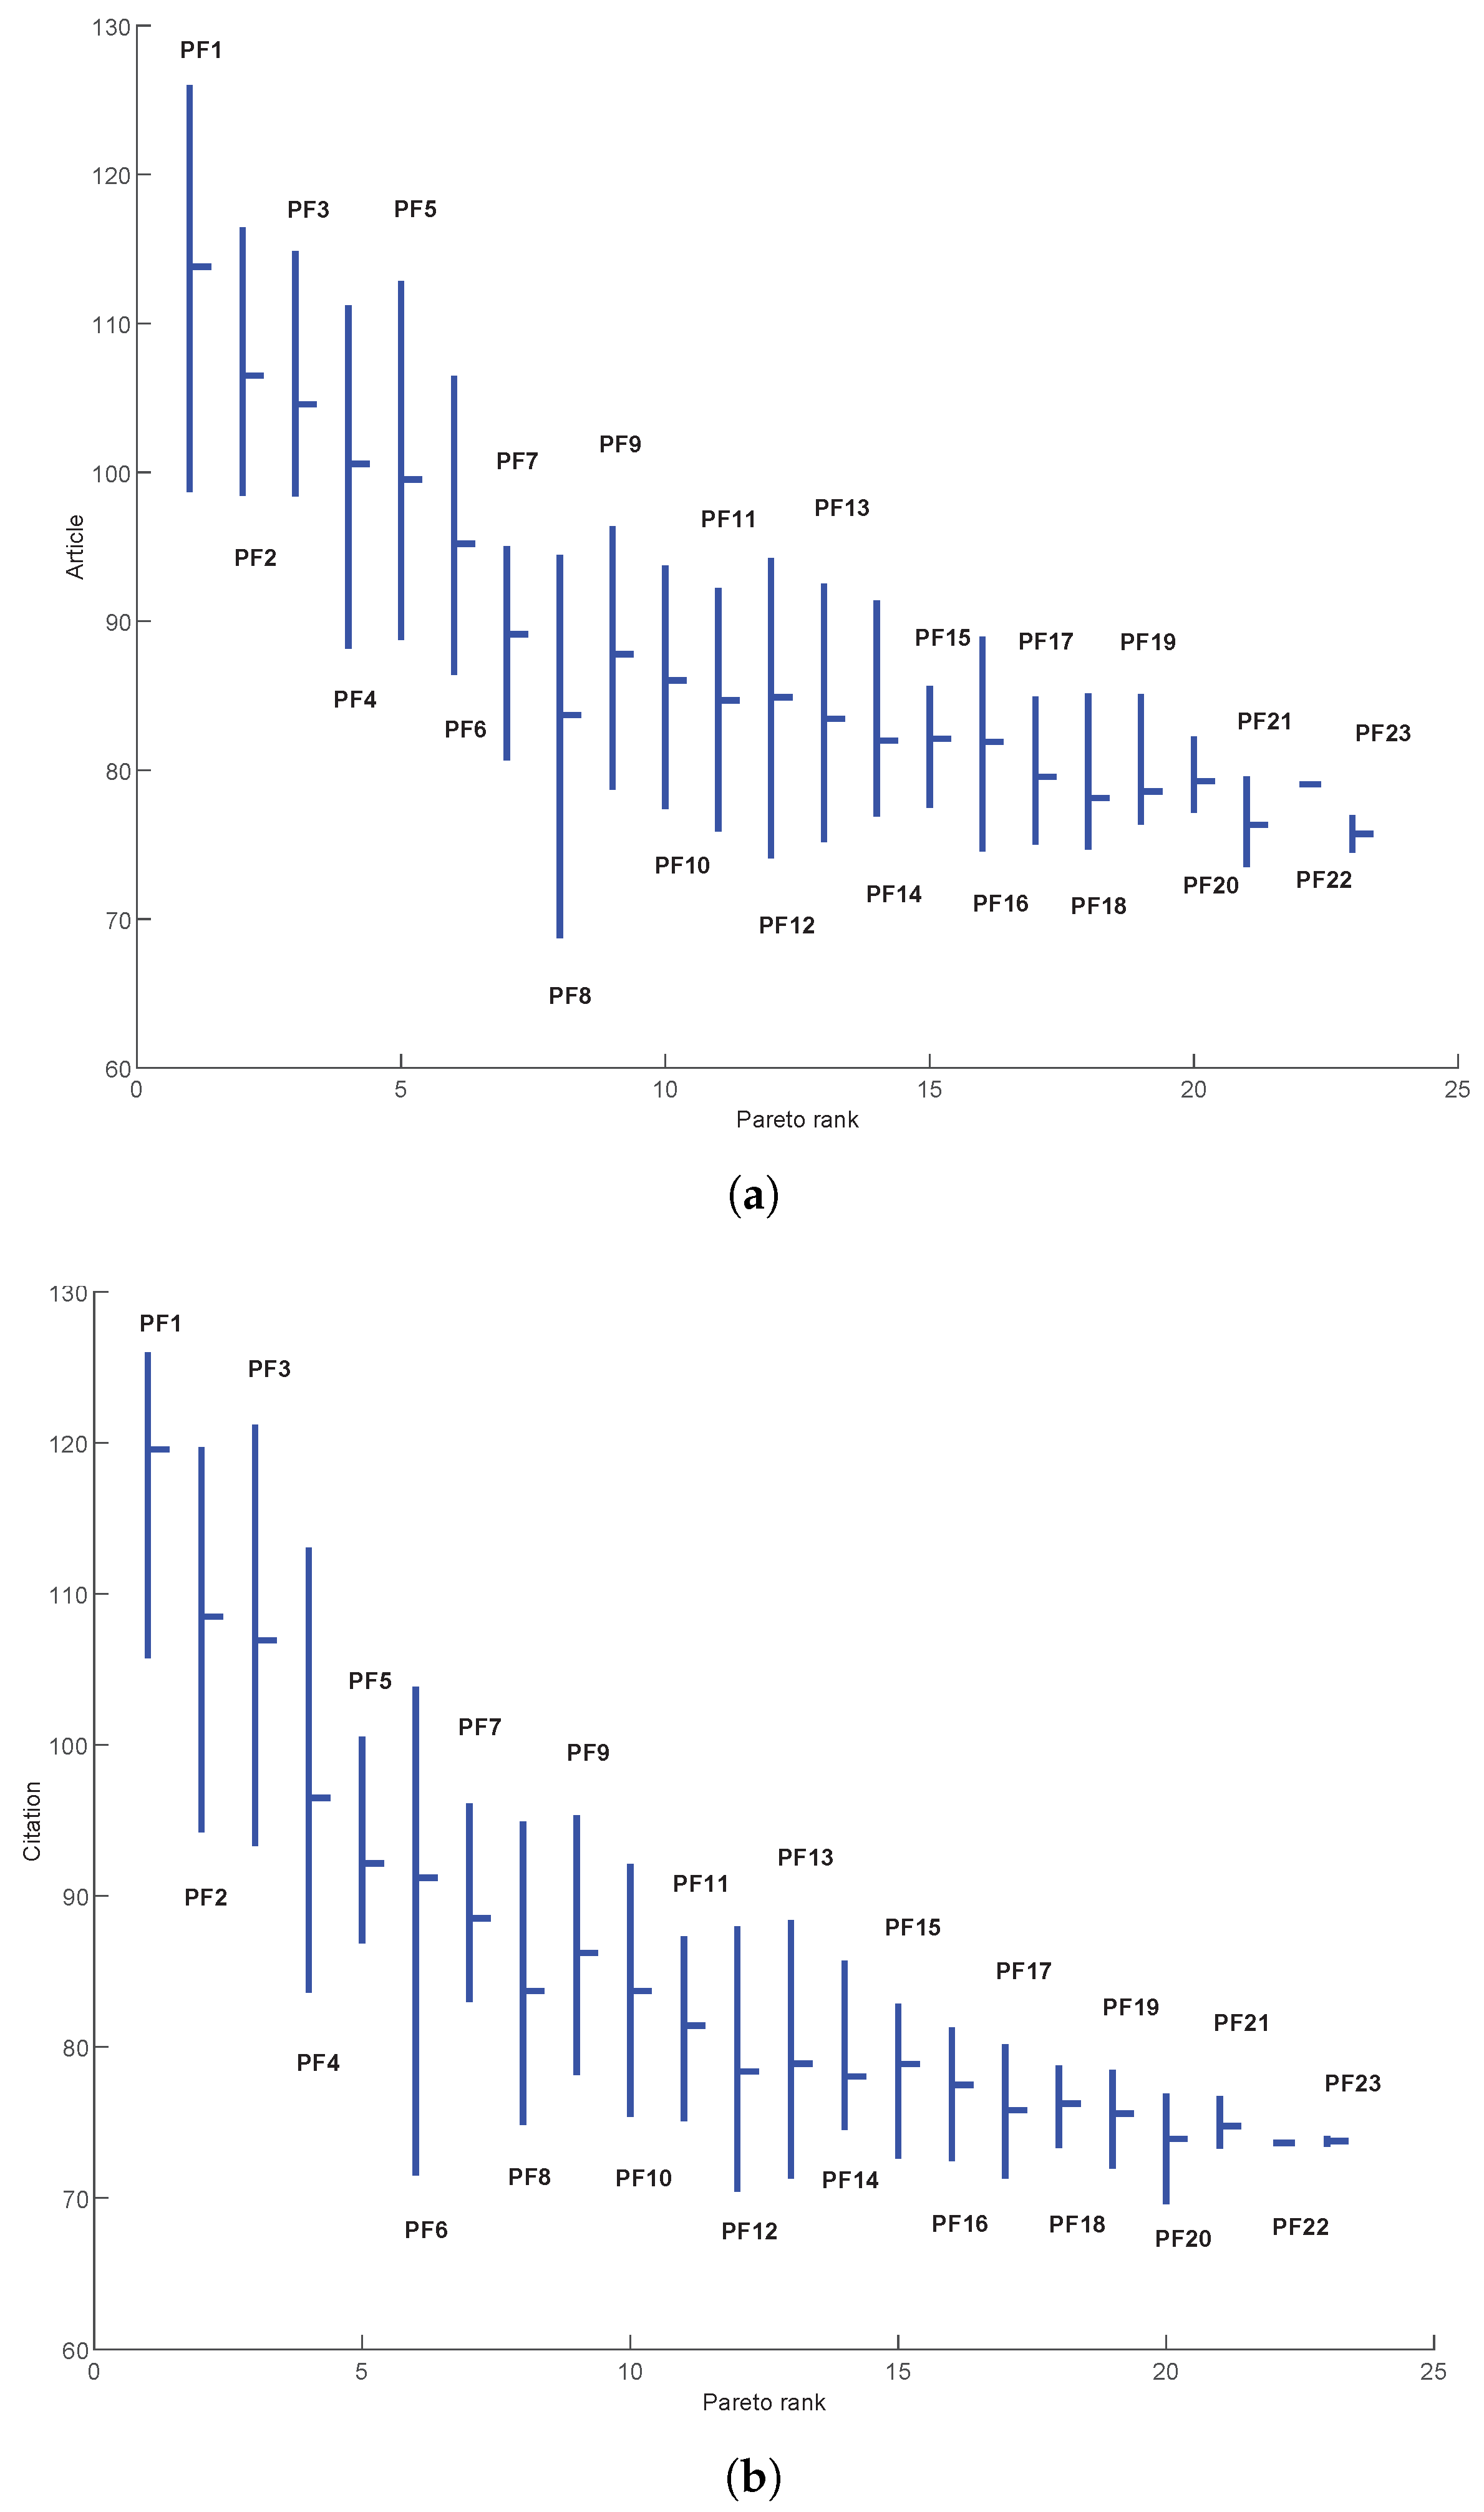
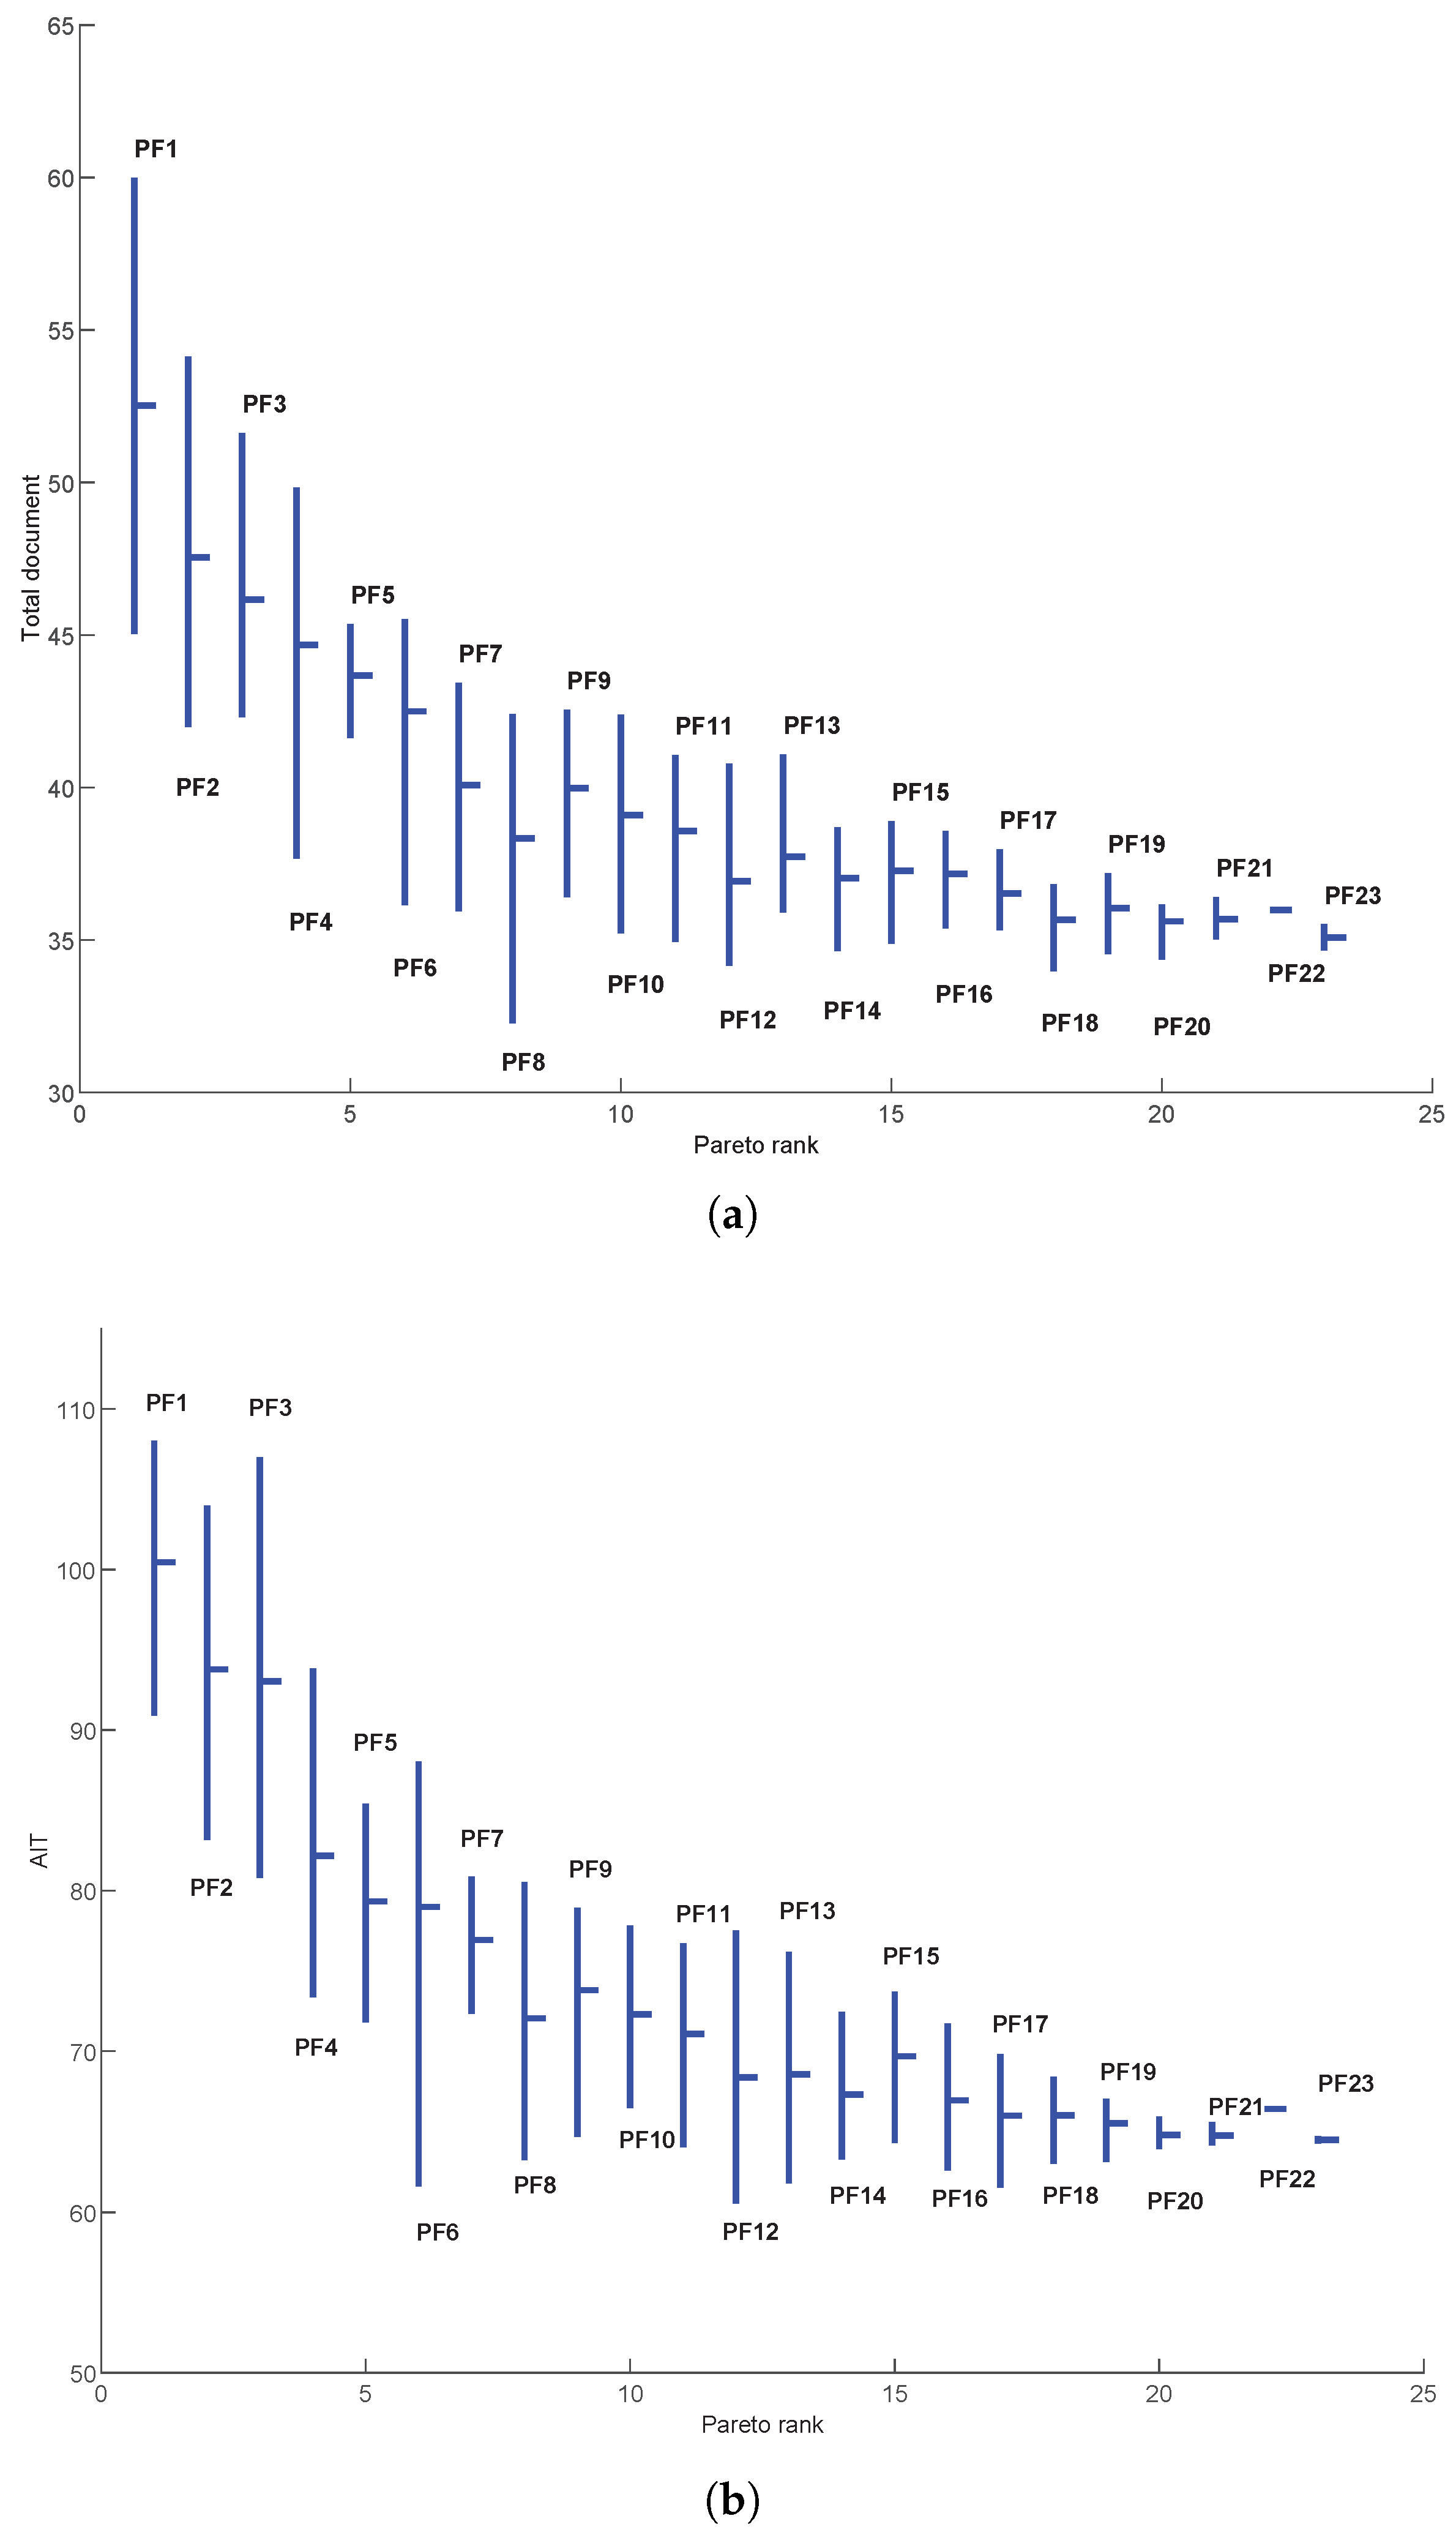
In order to deep understand the behavior of the obtained Pareto ranks and indicators, we plot the maximum, minimum, and average of values for all indicators versus Pareto ranks in Figure 6, Figure 7 and Figure 8 as mentioned before. It can be seen from these figures—all plots for six indicators—that there is a decreasing behavior in terms of the maximum, minimum, and average values, observable from the first Pareto front to the last Pareto front. In addition, Figure 9 visualizes universities in the four top ranked Pareto fronts. Each line illustrates one university (a five dimensional vector) in which the values of five indicators are presented using vertical axes; i.e., coordinate’s value.

4.3. The Third Case Study: Ranking of Countries

Table A3 shows countries, the values of five indicators (documents, CI-DO, citations, CPD, and h-index), and the obtained Pareto ranks from the proposed method (Pareto ranking). The United States is located in the first Pareto front because it has the maximum values of four indicators: documents, CI-DO, citations, CPD, and h-index. The United States is assigned to the rank 1 and in the second Pareto front, Switzerland and the United Kingdom are placed. The proposed method ranks these countries into forty six ranks while in the Pareto dominance ranking, it has thirty Pareto fronts.
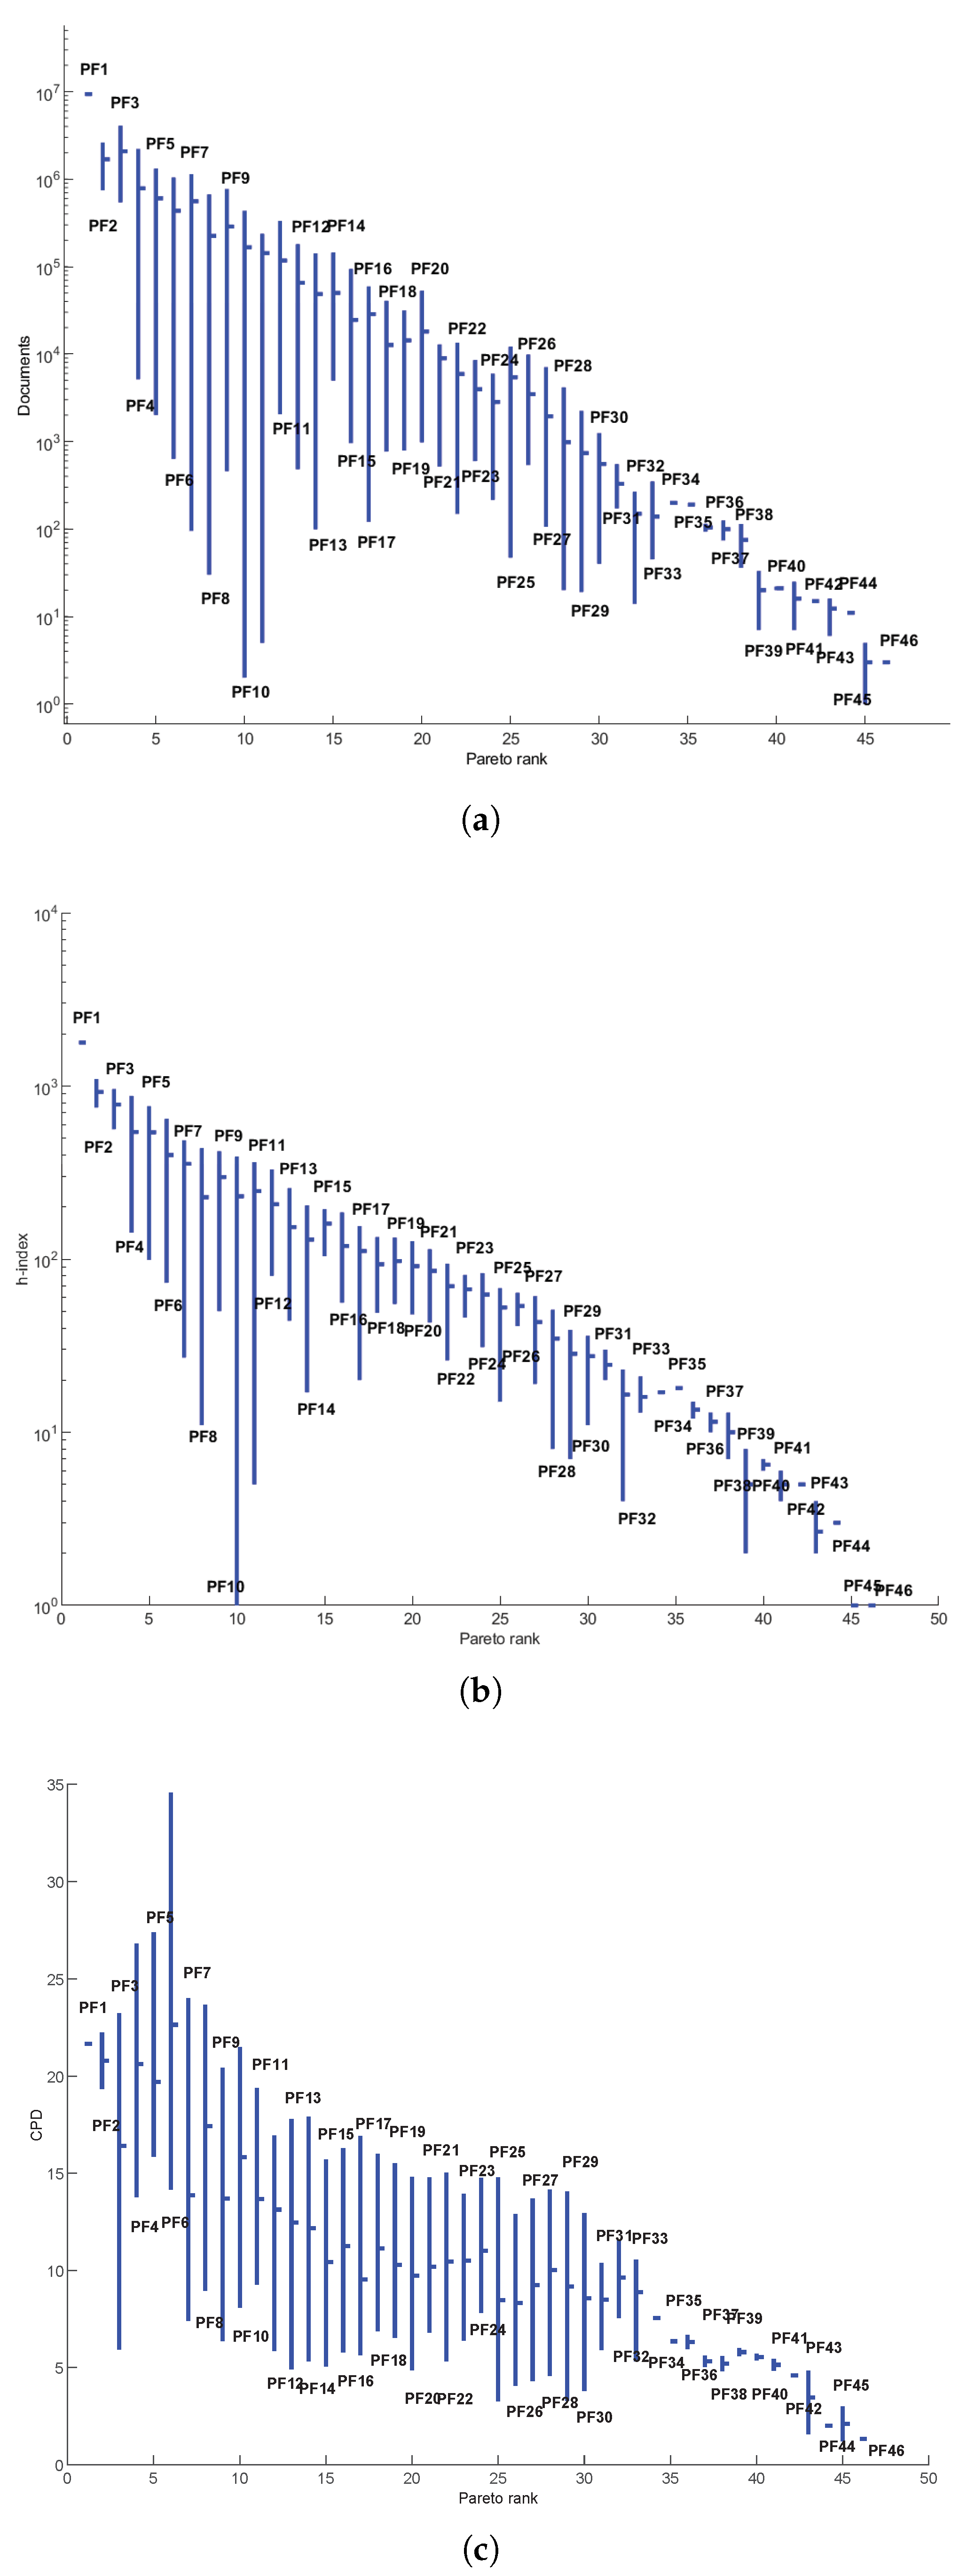
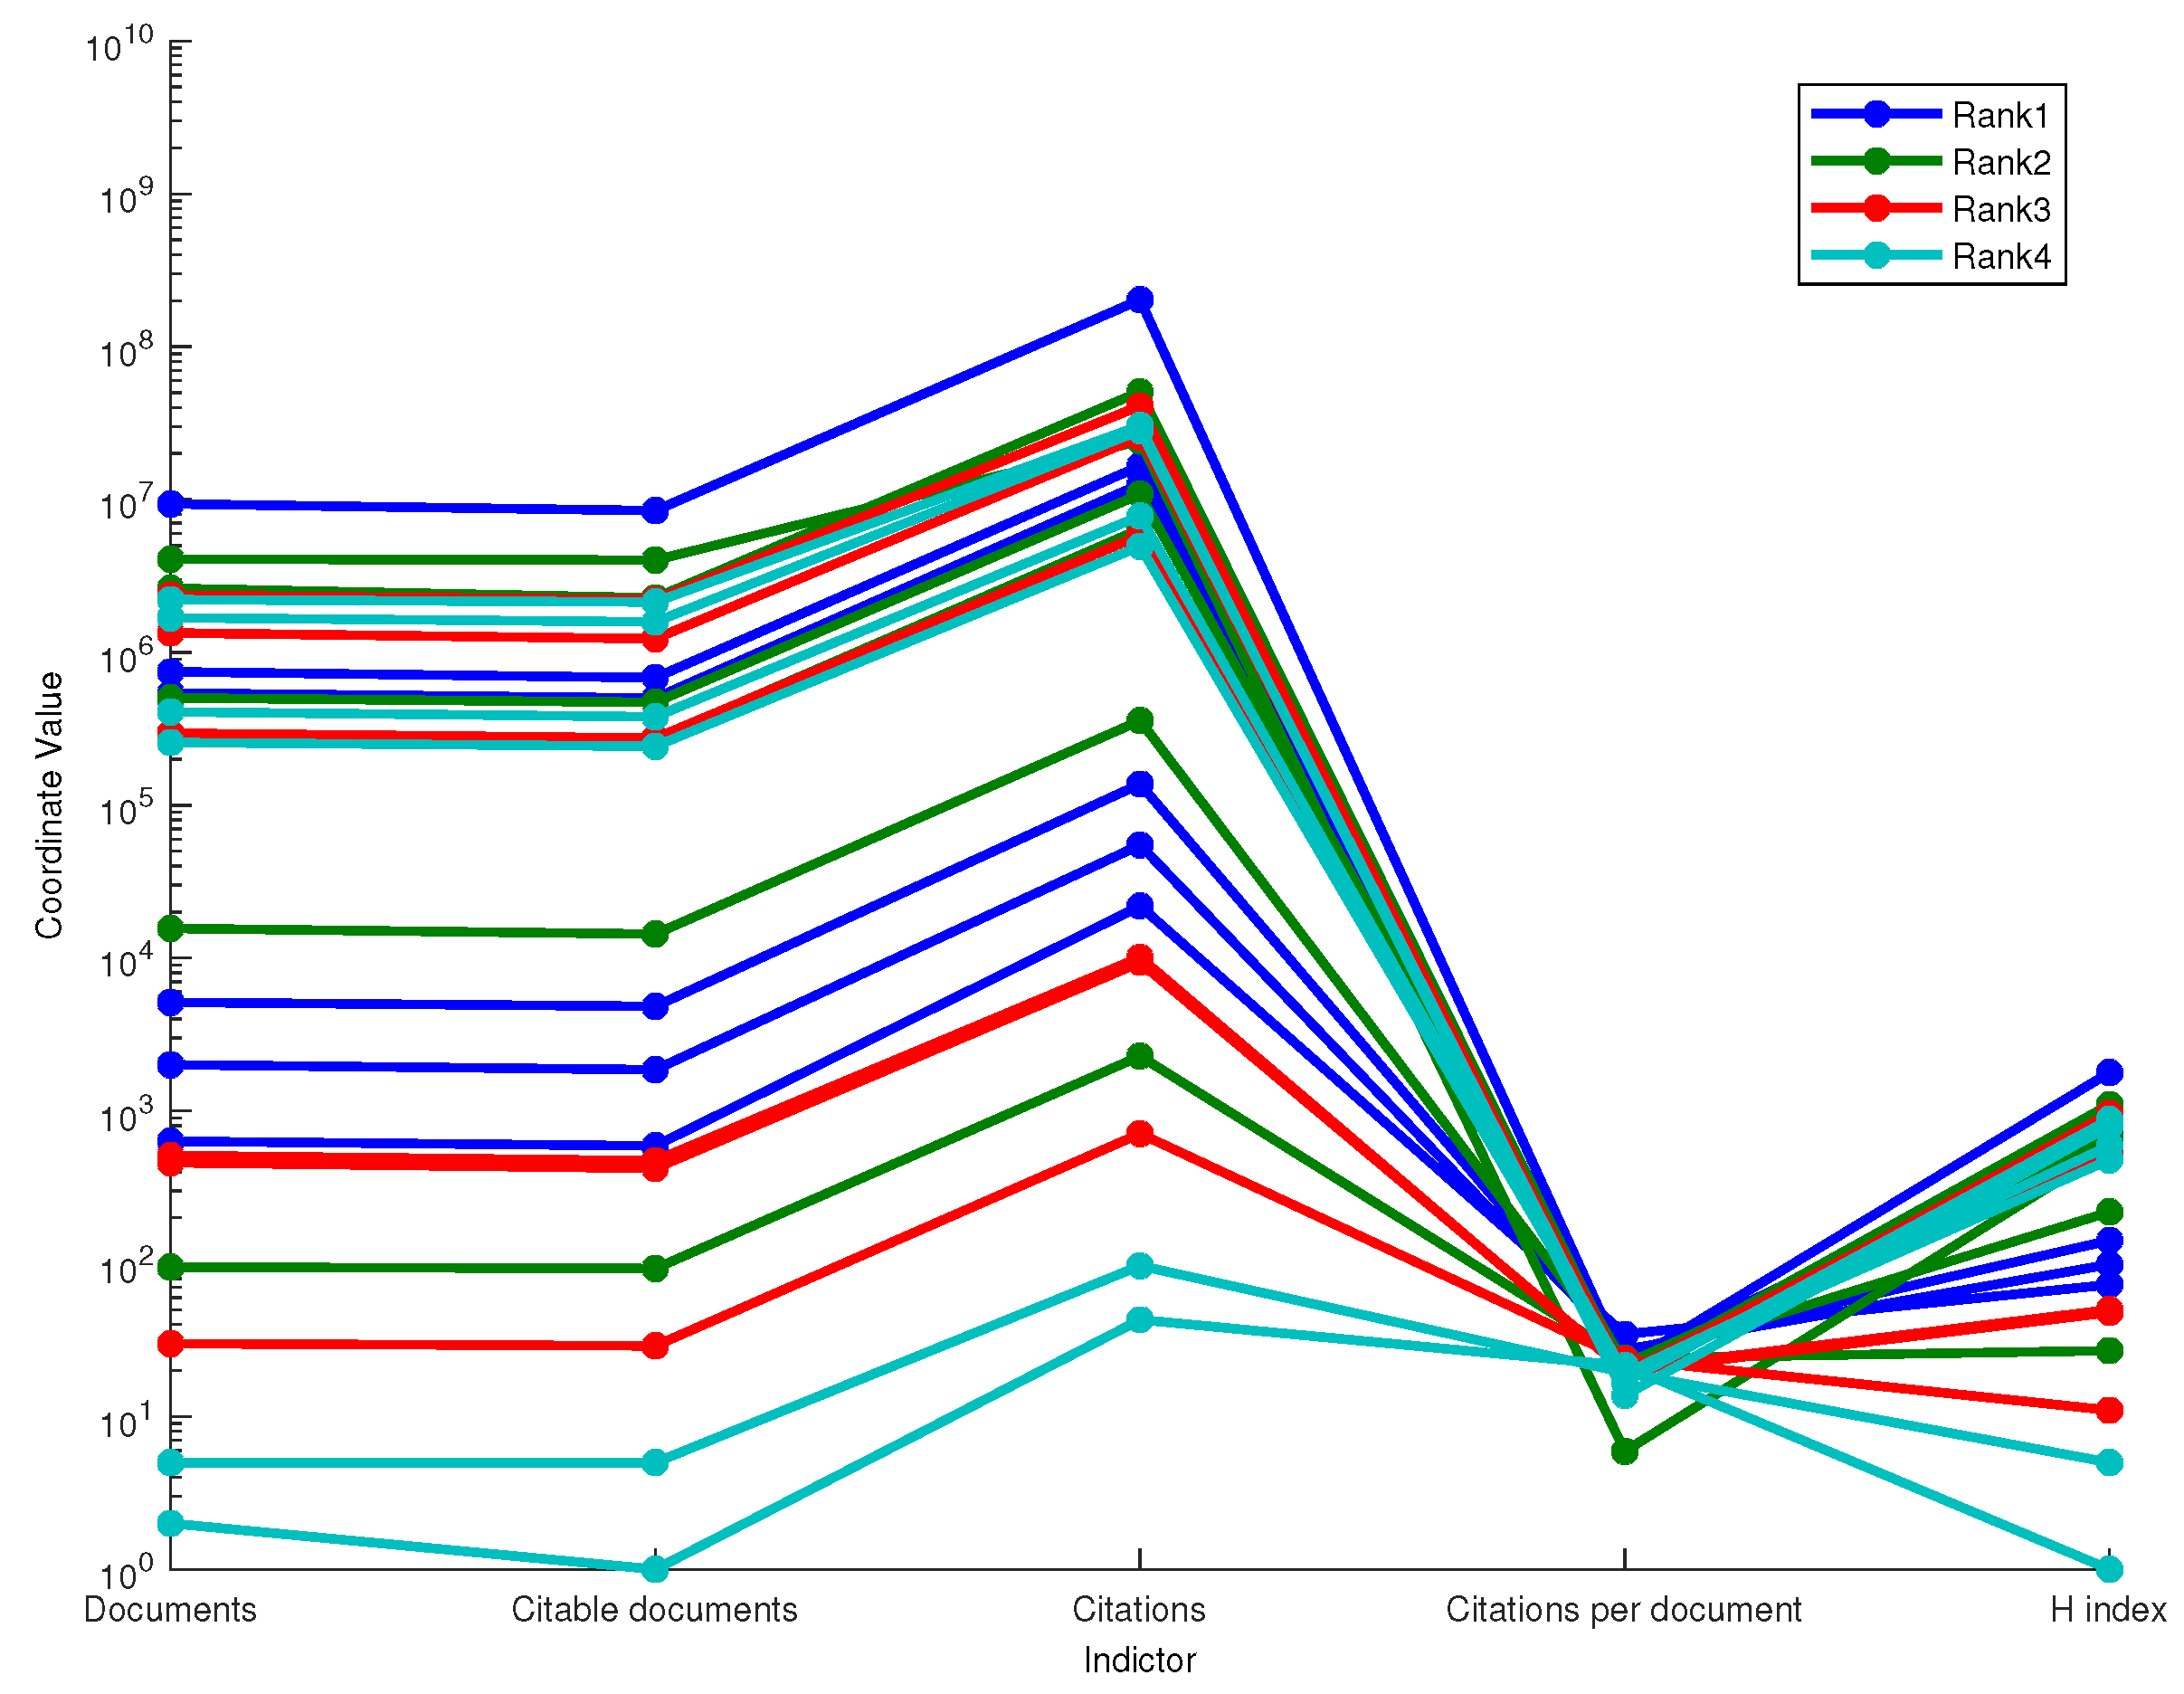
Additionally, for this data, we plot the maximum, minimum, and average of values for all indicators versus Pareto ranks in Figure 10 and Figure 11. Figures show a falling tendency of the average values from the first Pareto front to the last Pareto front. Additionally, we compute the percentage of the number of countries from the different continents (Asia, Europe, Latin America, Middle East, North America, and Pacific region) for each Pareto front. Figure 12 shows the percentage number for each continent. In Figure 12, the first largest and second largest percentages of the first Pareto front are North America and Europe. In addition, Figure 13 visualizes the values of indicators for countries in the four top ranked Pareto fronts by the parallel coordinates visualization technique. Each line illustrates one country (a five dimensional vector) in which the values of five indicators are presented using vertical axes; i.e., coordinate’s value. For instance, the value of CI-DO indicator is in interval [ 1 , 10 7 ] for countries on the four first Pareto fronts.

4.4. The Forth Case Study: Resolution for Multi-Rankings of Universities

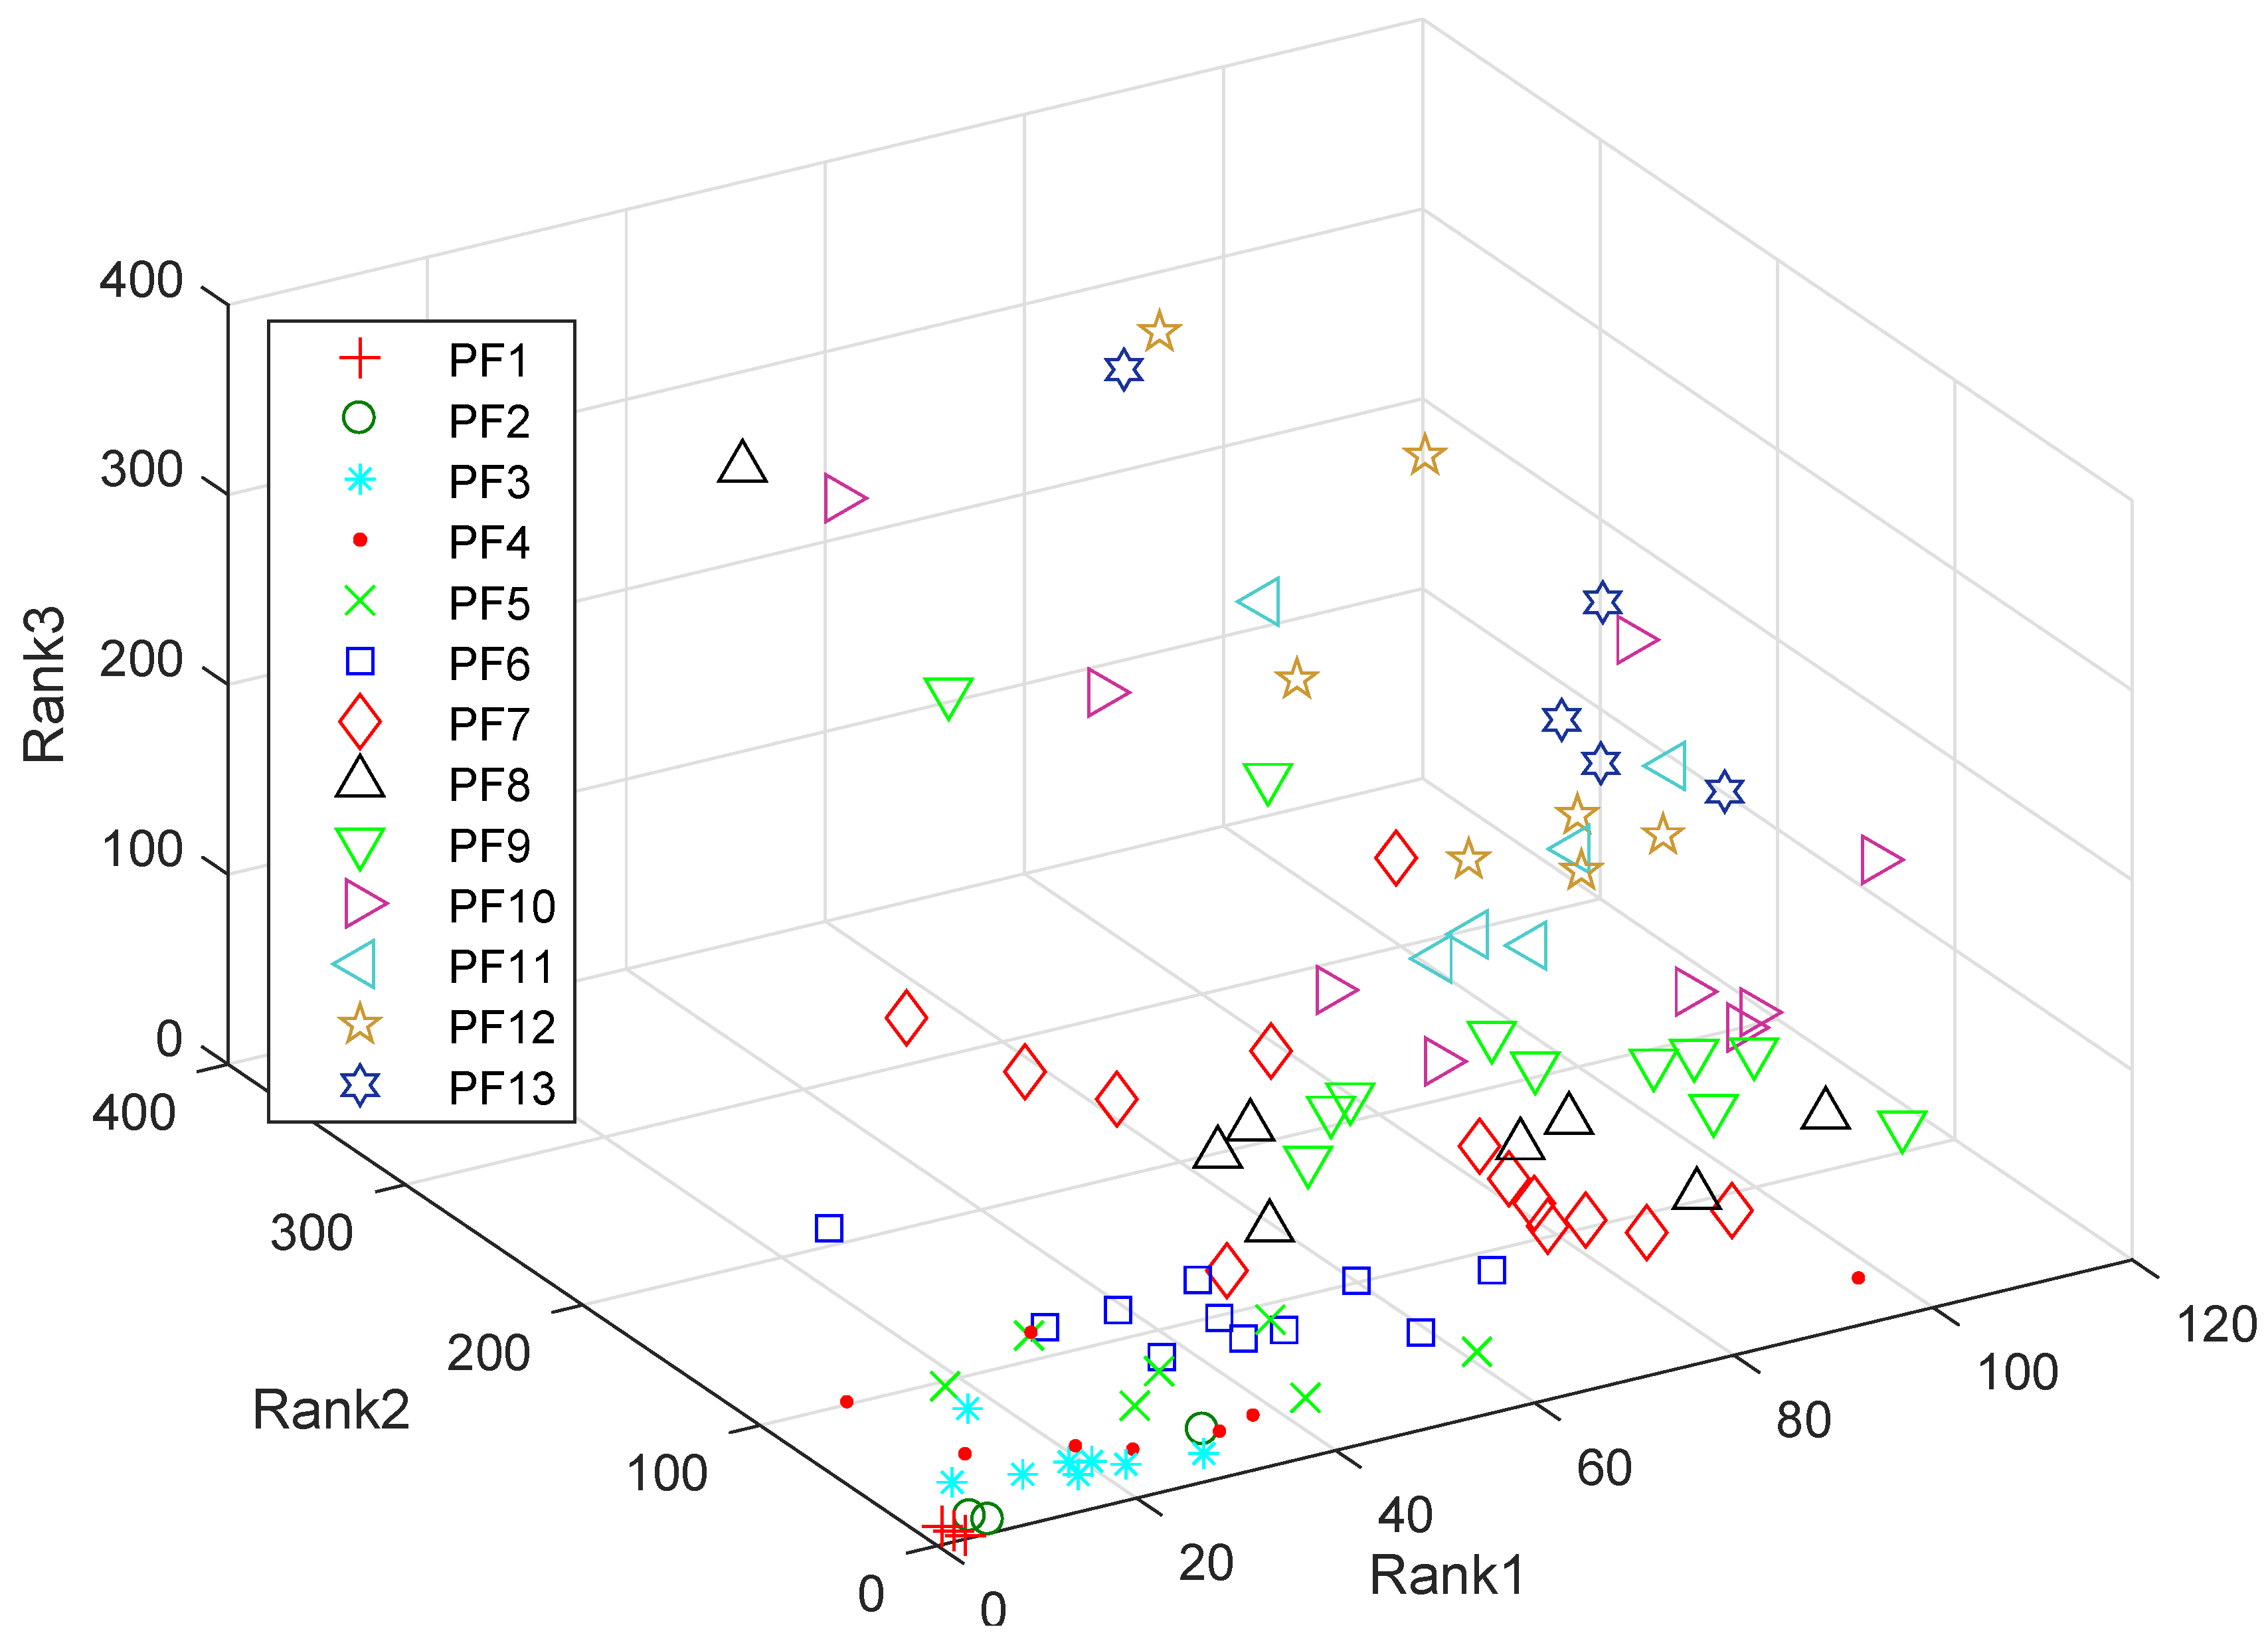
This case study collects the three ranks of 100 top common universities collected from the three mentioned resources, from which it is supposed that the criterion vectors with the lesser values for all three ranks are better vectors (i.e., Min-Min-Min). Table A4 shows universities, the values of three ranks, and the obtained Pareto ranks from Pareto dominance ranking (Pareto ranking). As we can see, three universities, “Massachusetts Institute of Technology,” “Stanford University,” and “Harvard University” are located in the first Pareto front, which has elements with the values 1 and 2 as the obtained ranks from other ranking resources. Figure 14 shows the numbers of Pareto fronts for all data. Additionally, the maximum, minimum, and average of values for three rankings versus Pareto ranks are plotted in Figure 15. It can be seen from Figure 15 that the average values of three ranks increase from the first Pareto front to 13th Pareto front.
At the end of this section, several points regarding the performance of the method and its differences with other ranking strategies are mentioned. First of all, a multi-criteria indicator is proposed for ranking the researchers, universities, and countries. Considering two or more objectives simultaneously can provide a fairer ranking. For instance, using research period along with other important criteria provides a fair comparison for senior and junior researchers to discover more-talented researchers. Secondly, since the considered criteria to assess the entities are different from indicators in other ranking strategies, the resultant rankings are completely different. In fact, they evaluate the universities in terms of different metrics. As a result, the comparison between the results of ranking strategies does not lead to a precise and meaningful conclusion. On the other hand, the proposed method clusters the entities based on multiple criteria into different levels. Accordingly, all universities in the same Pareto are ranked equally; for instance, based on this perspective, all universities in the first Pareto are the top ranked universities. Finally, this method does not actually define an evaluation measure; it gives a strategy to rank not only the case studies in the paper, but also any multi-criteria data entities. In addition, using this general platform provides the chance to utilize any metric to assess the related entities without modification to other parts of the algorithm.

5. Conclusions and Future Directions

In this paper, a modified Pareto-front based ranking was suggested as a new ranking method for measuring the scientific achievements, or in general multi and many- metric rankings. By using some dominance metrics obtained from the basic Pareto dominance depth ranking and some statistical metrics sorting compared criteria, the proposed method is able to find some different groups (clubs) for entities of a dataset having a large number of the criteria. It provides simultaneously multiple comparisons, considering the time period of academic research, and the use of other ranking methods. We selected different kinds of the scientific datasets; namely, computer science researchers, top universities, countries, and multiple rankings of universities to rank by using Pareto ranking. In future, we are planning to develop ranking strategies based on other dominance-based rankings; for example, dominance rank [61,63] which is related to the number of data entries in the set which dominates the considered point. Finally, we are interested in considering the use of other types of domination definition, such as the concepts of weak dominance, strict dominance, and ϵ -dominance. Additionally, many (more than three) metrics and various resources will be studied in the future.

Author Contributions

Data curation, S.M.; Formal analysis, S.R. and S.M.; Methodology, S.R.; Project administration, S.R.; Software, S.M. and A.A.B.; Supervision, S.R. and K.D.; Validation, S.R. and K.D.; Visualization, S.M. and A.A.B.; Writing—original draft, S.M.; Writing—review & editing, S.R. and A.A.B. All authors have read and agreed to the published version of the manuscript.

Funding

This research received no external funding.

Conflicts of Interest

The authors declare no conflict of interest.

Appendix A

Table A1. Indicators and Pareto ranks for the author data. Indicators are h-index and the research period (RP).
AuthorRankRPH-IndexAuthorRankRPh-Index
A.Herbert140162Burgard Wolfram61989
K.Anil125153MllerKlaus Robert61886
Han Jiawei121136Horrocks Ian61886
van Wil118124Liu Bing61768
Buyya Rajkumar11698Harman Mark61659
Perrig Adrian11582Dongarra Jack732114
ZhouZhi-Hua11471A.John729107
Shenker Scott223133Nayar Shree723102
Foster Ian221117SeidelHans-Peter72288
Salzberg Steven220116Rexford Jennifer71986
Schölkopf Bernhard218105Govindan Ramesh71881
Schmid Cordelia21783Gao Wen71766
Abraham Ajith21571Grossberg Stephen835114
Xiao Yang21459Dubois Didier832112
Sejnowski Terrence330132H.Randy831106
Haussler David327129Horowitz Mark829104
I.Michael325128Osher Stanley828101
Zisserman Andrew324121Szeliski Richard82598
Estrin Deborah322114H.Vincent82496
Koller Daphne321110Malik Jitendra82395
Herrera Francisco320107B.Mani82086
Balakrishnan Hari318100Baraniuk Richard82086
Staab Steffen31780Fox Dieter81985
Tan Tieniu31669HubauxJean-Pierre81872
Wattenhofer Roger31568Lee Wenke81872
Kanade Takeo430131Blaauw David81872
S.Philip425126Sahai Amit81763
Giannakis Georgios424117Prade Henri932111
Zhang Hong Jiang422110Vetterli Martin92796
F.Ian41896Kumar Vipin92495
WuJie41773Deb Kalyanmoy92393
Sukhatme Gaurav41773Benini Luca92085
Vasilakos Athanasios41667McCallum Andrew91984
Cao Guohong41561Kumar Ravi91869
Garcia-MolinaHector529125LiXiang-Yang91757
Towsley Don527117Demaine Erik91757
Culler David524113H.Christos1034110
Jennings Nick522107Yager Ronald1033101
Halevy Alon52194Sangiovanni-VincentelliAlberto103299
Horvitz Eric52092Agrawal Rakesh102595
J.Alexander51890A.Thomas102493
Abdelzaher Tarek51772Bellare Mihir102390
Fedkiw Ronald51660Dorigo Marco102185
Poggio Tomaso634121Karger David102084
E.Geoffrey631117Friedman Nir101979
Pentland Alex628112A.Carlos101867
VanLuc622104D.Jeffrey1140104
ChangShih-Fu62191Shneiderman Ben1135103
Szalay Alex112695Mitzenmacher Michael141966
Sheth Amit112590Reichert Manfred141860
Shah Mubarak112386Davis Larry153693
Jiang Tao112285Ayache Nicholas152990
Wooldridge Michael112181Finin Tim152886
Gross Markus112077Bertino Elisa152783
Domingos Pedro111975Joaquin Jose152480
H.Jason111866Mukher jee Biswanath152379
Suri Subhash111866Vahdat Amin152274
Zadeh Lotfi1240100J.Michael152274
H.Gene123899Joshi Anupam152171
E.David122795K. Sajal152069
Widom Jennifer122691Vaidya Nitin152069
ZhangLixia122588Thiele Lothar152069
Dumais Susan122384Pappas George151965
Schulzrinne Henning122281Kraut Robert162988
Freeman William122281Pedrycz Witold162883
Bengio Yoshua122176Abadi Martin162781
Ray LiuK.J.122075Hendler James162580
Wagner David121972Roy Kaushik162376
Lu Songwu121863Rus Daniela162170
W.Bruce133093Handley Mark162170
Jajodia Sushil132792Qiao Chunming162066
Anderson Thomas132686Pollefeys Marc161963
Unser Michael132483Y.Moshe173388
Manocha Dinesh132381Doyle John173187
Perona Pietro132381S.Kishor173187
Darrell Trevor132381Alon Noga172985
Tsudik Gene132276L.Ronald172985
Pevzner Pavel132276Sontag Eduardo172882
Karypis George132276C.Lee172679
Nahrstedt Klara132175Taylor Chris172474
Yao Xin132175S.Theodore172373
Diot Christophe132074Reiter Michael172169
Goble Carole131969Herrera Enrique172065
Liu Huan131969Belongie Serge171962
Tse David131969von John184087
Alouini Mohamed-Slim131861Yannakakis Mihalis183586
M.John143393A.David183084
Faugeras Olivier143091Hebert Martial183084
Chellappa Rama142890Dally William182980
De Giovanni142787Blake Andrew182879
Sycara Katia142583Baldi Pierre182677
Franklin Michael142481Greenberg Saul182677
Rost Burkhard142380S.Daniel182677
Crowcroft Jon142275Alur Rajeev182574
McKeown Nick142073B.Andrew182473
Suciu Dan142073Fua Pascal182473
Varghese George182370Rothermel Gregg212160
Yao Yiyu182370Gray Jim223979
LeJean-Yves182370Y.Joseph223278
PedramMassoud182370BezdekJames223176
Savage Stefan182269Kiesler Sara223176
Sandholm Tuomas182269Terzopoulos Demetri222974
D.Gregory182269Lenzerini Maurizio222770
Leymann Frank182165J.Haim222770
Jha Somesh182165Peterson Larry222669
Rogaway Philip182165Shasha Dennis222669
R.John182165Agrawal Divyakant222669
Shenoy Prashant182063Baeza-YatesRicardo222568
Canetti Ran182063C.JayC222467
Gunopulos Dimitrios181961Stolcke Andreas222365
Pearl Judea193083L.Michael222365
Ramakrishnan Raghu192978Alonso Gustavo222262
Waibel Alex192877S.B.222262
Li Kai192776V.S.Laks222159
EtzioniOren192675S.David233778
Cohen-OrDaniel192573Magnenat-ThalmannNadia233275
Metaxas Dimitris192470Kaufman Arie232972
Veloso Manuela192470Devadas Srinivas232769
Smyth Padhraic192268Cipolla Roberto232567
Kacprzyk Janusz192164Salesin David232465
Schaffer Alejandro192164Kotz David232363
Voelker Geoffrey192062Druschel Peter232261
Decker Stefan191959L.Olvi244078
Norman Don204083C.Fernando243374
Bertsekas Dimitri203182S.Andrew243071
Abiteboul Serge202977Kautz Henry242869
Hanrahan Pat202876Dill David242768
A.Edward202775H.Mostafa242667
Cong Jason202570Gropp William242565
Campbell Andrew202368Ostrovsky Rafail242462
C.Ming202267Altman Eitan242462
Zorzi Michele202161Smyth Barry242259
Mylopoulos John213380Crovella Mark242259
Thalmann Daniel213279Newell Allen254075
Adeli Hojjat213076Samet Hanan253673
Myers Brad213076Harel David253372
Smith Barry212874Mitchell Tom253271
Witten Ian212670Yuille Alan253070
K.Sankar212569D. Hill Mark253070
Sandhu Ravi212569Stolfo Salvatore253070
J.Ingemar212468G.Kim252968
Stojmenovic Ivan212367Gottlob Georg252867
Cootes Tim212367Haralick Robert252766
Anderson Ross212266Nisan Noam252664
van Frank252562Shadbolt Nigel282559
W.William252461Ishibuchi Hisao282458
Rogers Yvonne252258Rastogi Rajeev282458
Fagin Ronald263873Gelenbe Erol293966
W.Thomas263470H.Russell293365
Vitter Jeffrey263069Reif John293365
Mooney Raymond263069Salton Gerard293264
Cohen Michael262967Dietterich Thomas293063
Canny John262967Kramer Jeff292961
Burns Alan262866Bajaj Chandrajit292961
Deriche Rachid262765Aiken Alex292760
W.Wen-Mei262662Wiederhold Gio292659
Keutzer Kurt262662Dasgupta Dipankar292452
Pazzani Michael262662Wilks Yorick304066
Blum Avrim262561Turner Jonathan303163
Nejdl Wolfgang262460Elmagarmid Ahmed302859
de Maarten262257Motta Enrico302658
Ceri Stefano273268Herman Gabor314065
Levy Henry273067F.James313262
Tambe Milind272865Larus James312958
K.Pankaj272763ChenMing-Syan312757
Knoblock Craig272763LeeDer-Tsai312653
Fogel David272459Reddy Sudhakar323562
Baruah Sanjoy272356Beth Mary323058
Bobrow Daniel284067I.Norman333762
Hennessy John283066Dolev Danny333560
Ni Lionel282965Padua David333358
Wadler Philip282864Nicolau Alex333156
Peleg David282864V. Aho Alfred344062
P.Michael282762Sifakis Joseph343256
Malik Sharad282559A.Edward353255
Table A2. Indicators and Pareto ranks for the university data. Indicators are article, citation, Total Document (TD), Article Impact Total (AIT), Citation Impact Total (CIT), International Collaboration (IC), and the research period (RP).
UniversityRankArticleCitationTDAITCITICRP
Harvard University1126126601089090380
University of Toronto112512559105.2169.3289189
Stanford University1112.36124.3649.4102.9475.0470.32131
Johns Hopkins University1113.67122.2352.6399.6170.6571.43140
University of California Los Angeles1107.16114.0349.0996.0867.1768.0697
University of California San Diego198.67105.7345.0390.8965.0765.2956
University of California Berkeley2105.06117.5144.83103.274.8171.13148
Imperial College London2102.43103.3547.0388.1161.8376.89109
KU Leuven298.4394.2244.483.1656.8576.4248
Pierre & Marie Curie University - Paris 6299.2494.8441.9883.258.172.3645
University of Oxford2115.22119.7251.44103.9672.4985.11920
University College London2116.44113.5554.1397.665.3484.34190
University of Washington Seattle2108.58116.2148.9597.1968.2867.17155
Massachusetts Institute of Technology (MIT)398.63121.1942.31078967.57155
University of British Columbia399.6797.3245.2285.1459.2471.99108
National University of Singapore398.3793.3142.6280.855.5772.9336
University of Cambridge3107.79114.2448.4299.8370.4581.35807
University of Michigan3114.84113.7451.6297.4564.6468.39199
University of Tokyo3108.06101.746.8387.9257.866.55139
Zhejiang University4111.1989.2644.3977.6151.5260.98119
Tsinghua University4107.9489.0641.9179.4153.0760.46105
Universidade de Sao Paulo4109.8583.647.4573.4449.6367.1882
Seoul National University4102.7689.1744.1875.3951.3859.9870
Nanyang Technological University488.1886.4437.6775.8454.5764.0825
University of Pennsylvania4105.54113.0549.8393.8366.5563.03276
University of Chicago494.78103.1843.2289.7865.9562.39126
University of California San Francisco493.26107.7245.485.0265.3860.39143
Cornell University497.05100.4944.6785.360.863.24151
University of Sydney4101.3593.5746.9981.1455.7770.05166
Monash University495.2586.5842.473.3551.7864.3258
Columbia University4103.52109.5647.3793.1266.2866.84262
Duke University496.65102.5845.3285.0861.4661.91178
Shanghai Jiao Tong University5112.8587.8143.9375.7450.960.55120
University of Melbourne599.4892.844.2380.455.8667.58163
University of Queensland598.5390.0642.987753.4467.19107
University of California Davis593.0690.5642.4280.2956.6361.71111
Free University of Berlin588.7486.8741.6271.852.3162.5868
University of Copenhagen5103.59100.5345.3585.4260.575.63537
University of Minnesota Twin Cities5100.3596.3445.284.6757.8962165
Central South University686.4271.4836.1561.646.7350.0116
Peking University6106.4890.8842.8779.0453.5263118
University of Colorado Boulder695.3995.5942.5181.8759.0859.03140
Ohio State University697.4691.5143.9782.157.8460.06146
University of Florida693.5588.342.9277.7254.4960.9111
Aarhus University69085.2140.0372.4852.0565.4888
University of Wisconsin Madison696.4695.4443.586.3460.6260.17168
University of Pittsburgh694.2798.6245.5181.758.9758.91229
Yale University696.84103.834588.0264.4462.73315
Swiss Federal Institute of Technology Zurich791.590.1439.4380.8657.269.92162
California Institute of Technology780.6491.0135.9480.8464.6958.91125
University of Paris Diderot - Paris VII782.4384.9237.0373.3356.1760.3146
Radboud University Nijmegen783.9882.9838.772.3153.8261.2693
McGill University795.0291.3143.2179.856.367.91195
Kyoto University794.9287.6442.2275.752.3158.98119
University of New South Wales791.2183.9340.6672.6151.4563.0267
University of North Carolina Chapel Hill793.3596.1343.4279.9358.0857.65227
Erasmus University Rotterdam882.8485.6739.4871.3353.8659.63103
University of Calgary880.4777.1237.766548.8756.6950
Maastricht University877.3574.8235.9963.2648.5855.9840
University of California Santa Cruz868.7176.132.2766.595749.9851
Northwestern University892.5494.942.4180.5358.4157.42165
Penn State University894.4691.7542.0379.655.6760.55161
University of Texas Austin888.688.439.1578.4557.0257.21135
University of Alberta889.9282.6240.8772.1351.3862.21108
Ecole Polytechnique Federale de Lausanne878.4581.863571.4754.975951
University of Bristol981.6179.9737.3871.352.9657.9485
University of Paris Descartes - Paris V978.778.1436.464.6849.8155.6545
University of Manchester992.8288.7642.5578.1855.665.72192
Washington University (WUSTL)985.8195.3240.7777.3960.354.55163
Fudan University996.3684.6739.8571.2751.0456.62111
University of Southern California986.4586.5739.7573.8654.6656.58136
VU University Amsterdam986.4984.6539.8272.0152.6262.11136
University of Utrecht992.392.5142.2178.6156.0566.52380
University of Edinburgh987.1190.1740.5878.9458.3763.87433
National Taiwan University990.2581.4640.3971.7850.2656.7288
University of California Irvine1079.582.5937.0772.3954.6454.56109
University of Claude Bernard - Lyon 11077.3975.3635.2166.4650.3755.5945
Kings College London1088.5687.842.2875.555.6463.08187
University of Zurich1086.586.1739.2775.2456.0265.28183
Vanderbilt University1084.948839.8574.7356.0254.13143
University of Arizona1083.2882.3838.2273.3253.956.68131
Sun Yat Sen University1093.7579.5938.9368.8549.6953.6192
University of Science & Technology of China1087.0379.6436.2970.3150.9153.3458
University of Hamburg1080.7677.6136.969.0252.6757.0397
Tel Aviv University1083.457738.0567.7649.9757.4160
University of Barcelona1093.3392.1142.397755.0966.57566
Ruprecht Karl University Heidelberg1088.2691.0241.1677.8257.8163.37630
Karolinska Institutet1090.4590.4541.4273.5354.3867.8206
University of Munich1088.489.2440.7376.6756.664.03544
Osaka University1087.8981.4739.5369.850.1854.7285
University of Milan1082.8478.738.1868.2951.1956.6692
University of Illinois Urbana-Champaign1188.6183.8139.3475.8653.957.68149
Nanjing University1192.1679.8637.7470.450.3653.5101
University of Geneva1178.3180.6736.5371.0154.9659.55140
University of Birmingham1179.778.2138.0569.0252.1156.73116
Autonomous University of Barcelona1180.9876.7936.5467.8750.5257.1448
Universite Toulouse III - Paul Sabatier1177.4275.9434.9465.1249.6456.8247
University of Alabama Birmingham1175.8878.1936.8664.0249.950.2447
Ghent University1192.2483.3140.5874.8252.2967.23199
New York University1188.5786.8441.0276.0655.3456.61185
Humboldt University of Berlin1187.7986.4541.0673.2953.6961.82205
Boston University1182.0686.7838.3976.758.555.3177
University of Montreal1184.9981.5239.5770.8551.5860.52138
Tohoku University1186.8880.1139.2968.5349.1456.83105
Universidade de Lisboa1184.9675.0937.7567.5248.9960.59105
University of Amsterdam1189.687.3240.7875.0554.4763.83384
King Abdulaziz University1283.1371.2634.262.3947.7261.5549
University of Maryland College Park1285.5385.2437.877.556.0357.62160
Huazhong University of Science & Technology1294.2276.7838.1367.7548.5152.97109
University of California Santa Barbara1274.0779.2434.1570.9256.1752.51125
King Saud University1281.6170.4235.1760.5546.496159
Technical University of Munich1285.4182.8338.0270.7652.0760.24148
Australian National University1280.8676.0936.2466.7949.5357.8870
Jilin University1290.475.4637.7764.5947.7750.870
University of Groningen1288.887.9740.7774.1153.7163.99402
University of Helsinki1385.9884.4638.7973.9654.4563.63376
Emory University1385.3188.3941.0971.9154.0154.36180
University of Oslo1384.5681.8638.471.6153.1861.9205
Princeton University1379.6284.1935.9176.1858.5355.73270
Shandong University1392.5375.4837.966.6148.4551.74115
University of Leeds1379.3876.9837.3466.1949.7756.86112
Newcastle University - UK1375.1874.0836.1563.0548.6253.7453
Sapienza University Rome1390.0581.2140.474.6753.6660.14713
University of Hong Kong1381.7277.636.8366.3749.2454.98105
Harbin Institute of Technology1388.7873.4737.1465.5947.6951.9296
Universidad Nacional Autonoma de Mexico1382.9371.2936.5561.7946.5656.98106
University of Miami1375.3577.5736.2964.5650.151.2891
Purdue University1484.4378.8637.571.851.7955.03140
McMaster University1480.9879.6238.0567.2850.4657.26129
Sichuan University1491.3774.8938.263.7947.2550.46120
Nagoya University1479.9974.536.465.0248.751.8777
University of Gothenburg1477.1974.7635.2463.3148.5455.4162
Leiden University1483.9585.7138.772.4554.9360.88441
Lund University1485.5882.7738.5772.1152.9363.82350
Hebrew University of Jerusalem1477.3575.9935.9164.7649.2355.3798
Wageningen University & Research Center1476.8975.234.6365.2349.3456.7498
Georgia Institute of Technology1580.7878.9935.8969.0951.1154.8131
University of Waterloo1578.0872.6134.8864.2848.1754.9659
Rutgers State University1582.9282.3938.8973.0253.1756.11250
Texas A & M University College Station1585.2178.8137.870.5950.8357.22163
University of Southampton1582.6478.1137.5669.5751.2759.62147
Michigan State University1583.4979.537.7370.7251.5255.15161
University of Sheffield1578.5575.5636.8967.2750.3955.73111
University of Illinois Chicago1577.4974.2136.7665.5349.5750.96103
University of Paris Sud - Paris XI1583.2982.8637.3173.754.2461.5759
Uppsala University1584.9682.7637.9570.9752.4962.68539
University of Aix-Marseille1585.6481.7738.1971.7452.2161.44607
University of Utah1682.8381.2438.2968.151.1953.08166
University of Nottingham1680.1578.0537.9767.0150.1256.48135
University of Bonn1677.9378.1536.0268.1952.0457.07198
Yonsei University1687.7976.238.4865.2747.8552.65131
Xian Jiaotong University1688.9572.4336.5663.8447.5251.96120
Universidade do Porto1679.2172.63662.6147.4256.16105
Goethe University Frankfurt1674.5675.6335.3763.949.554.17102
University of Padua1685.1881.2738.5871.7353.3659.63794
University of Western Australia1684.5780.238.3367.6550.1360.08457
Universite Grenoble Alpes (UGA)1677.7979.0936.1371.0652.3960.35474
University of Bern1779.3376.336.1767.1751.558.97182
University of Virginia1778.1578.236.7268.5552.2352.2197
Arizona State University1780.277.5636.1867.6350.6452.32131
University of Iowa1778.6876.1536.9868.1951.9351.01169
Korea University1782.7474.1836.7265.6948.4352.28111
Cardiff University177576.0435.965.2250.7654.59133
University of Cologne1776.773.9235.3162.7748.4954.4597
Charite Medical University of Berlin1778.4680.1737.9765.550.4855.65306
University of Liverpool1777.4974.9236.0965.565056.24135
Kyushu University1780.4673.6936.663.7247.8251.47105
Tongji University1784.9271.2835.9461.5546.6551.38109
Hokkaido University1779.6173.2436.1862.3947.251.5398
University of Bologna1781.8176.237.4769.8351.9956.52928
Universite de Toulouse1781.9777.8536.567.449.9759.67787
University of Glasgow1777.6177.373768.4451.9856.16565
Stockholm University1875.6474.1133.9765.5750.7655.41138
Brown University1877.6878.4436.2868.3952.8751.02252
Dresden University of Technology1878.3476.0235.8566.6650.4355.25188
RWTH Aachen University1877.4474.7435.3765.9650.254.39146
University of Rochester1874.6676.7535.6466.5751.3151.18166
Wuhan University1885.1673.335.5463.0147.5650.48123
Eberhard Karls University of Tubingen1878.9778.7436.8366.2450.2857.19539
University of Basel1877.0877.7735.8665.6550.7558.36556
Technical University of Denmark1978.0275.9134.5466.650.2456.59187
University of Gottingen1977.2475.7535.566.6950.5755.63282
University of Ottawa1979.5975.5537.1964.4848.6154.72168
Case Western Reserve University1976.7478.4736.3965.7451.0950.86190
Western University (University of Western Ontario)1978.897436.7963.1547.7754.05138
University of Auckland1976.5371.9535.0163.9448.9354.97133
Sungkyunkwan University1985.0976.393766.3749.5451.96618
University of Freiburg1976.3576.6135.9167.0451.5555.89559
University of Erlangen Nuremberg2079.1976.9236.1665.1549.3655.93273
University of Adelaide2079.4173.5435.763.948.6254.39142
Lomonosov Moscow State University2082.2669.6236.0564.5648.1854.81261
North Carolina State University2079.1373.435.3764.1748.0551.84129
Universite de Montpellier2078.3476.4236.0265.0549.0758.46727
Karlsruhe Institute of Technology2077.1573.4934.3665.9149.8855.64191
University of Munster2175.9476.7535.6164.5149.8254.1236
Queen Mary University London2173.4974.235.0264.1250.5852.71231
Charles University Prague2179.5573.2836.465.5749.6456.59668
University of Naples Federico II2279.0473.6335.9966.450.4753.7792
University of Turin2376.9774.1135.5164.749.9453.26612
Johannes Gutenberg University of Mainz2374.4773.3934.6664.2649.8653.68539
Table A3. Indicators and Pareto ranks for the country data. Indicators are documents, Citable Documents (CI-DO), citations, Citations Per Document (CPD), and h-index.
CountryRankDocumentsCI-DOCitationsCPD h -Index
United States19,360,2338,456,050202,750,56521.661783
Netherlands2746,289682,62716,594,52822.24752
United Kingdom22,624,5302,272,67550,790,50819.351099
Switzerland3541,846501,91712,592,00323.24744
China34,076,4144,017,12324,175,0675.93563
Germany32,365,1082,207,76540,951,61617.31961
Canada31,339,4711,227,62225,677,20519.17862
Panama451294830137,58526.82142
Sweden4503,889471,03610,832,33621.5666
Denmark4290,994269,3646,405,07622.01558
Iceland415,62514,353357,67822.89218
Japan42,212,6362,133,32630,436,11413.76797
France41,684,4791,582,19728,329,81516.82878
Gambia52004185954,92527.4199
Israel5295,747274,7485,826,87819.7536
Belgium5407,993378,8077,801,07719.12593
Italy51,318,4661,217,80420,893,65515.85766
Australia5995,114894,31516,321,65016.4709
Bermuda663359021,88434.5773
Finland6257,159242,8534,940,15319.21479
Spain61,045,796966,71014,811,90214.16648
Montserrat79593228224.0227
Austria7295,668273,4675,052,81017.09487
India71,140,7171,072,9278,458,3737.41426
South Korea7824,839801,0778,482,51510.28476
Taiwan7532,534516,1715,622,74410.56363
Faroe Islands851047210,10519.8148
United States Minor Outlying Islands8302971023.6711
Norway8229,276209,2593,951,66117.24439
Brazil8669,280639,5275,998,8988.96412
Guinea-Bissau9458421935720.4350
Puerto Rico913,84113,293248,88817.98166
Hong Kong9219,177206,0113,494,24415.94392
Greece9246,202226,9143,186,31312.94354
Russian Federation9770,491755,1864,907,1096.37421
Poland9475,693460,9794,083,6318.58401
Tokelau10214321.51
Monaco101586144929,70518.7376
New Zealand10180,340162,7202,940,05116.3387
Singapore10215,553202,0893,135,52414.55392
Turkey10434,806407,0643,509,4248.07296
French Southern Territories11559719.45
Bolivia113569338761,07617.1188
Ireland11150,552135,5232,382,07715.82364
Czech Republic11237,910230,0482,204,9229.27322
Mexico11232,828221,6112,305,5549.9316
Portugal11214,838201,5622,544,57711.84334
Argentina11159,172150,9271,965,62412.35300
Costa Rica1291778612148,47516.18137
Gabon122048193634,70416.9580
Hungary12147,901140,9101,914,82012.95329
Kenya1224,45822,347379,56015.52179
South Africa12188,104172,4242,125,92711.3320
Iran12333,474323,2991,954,3245.86199
Seychelles13482453857917.844
North Korea132384232938,62216.280
New Caledonia132122204134,75316.3873
Estonia1328,66027,323381,20613.3185
Chile13101,84197,2501,203,30811.82257
Uganda1311,52810,599171,36714.87128
Thailand13123,410117,5651,182,6869.58236
Egypt13137,350133,1471,009,9547.35184
Malaysia13181,251175,146888,2774.9190
Saint Lucia149985177417.9217
Netherlands Antilles14435397766217.6144
Martinique1465359810,73716.4439
Philippines1420,32618,658265,73713.07163
Tanzania1411,96411,140170,14414.22122
Slovenia1471,40868,494725,49810.16204
Saudi Arabia14111,117106,187748,0696.73195
Slovakia1480,76578,484653,5268.09195
Romania14141,731138,041752,2195.31187
Malawi154952452077,82915.72104
Peru1514,43413,201192,44313.33154
Uruguay1513,70212,971186,79313.63132
Bulgaria1559,38457,590523,8448.82184
Venezuela1533,78032,445321,0069.5166
Ukraine15145,332142,812732,4295.04188
Croatia1579,15476,097548,6876.93194
French Guiana1695689815,57316.2956
Mozambique162382219337,43315.7173
Ecuador167942744096,11912.1111
Zimbabwe167243669194,53313.0599
Zambia163992362356,48114.1592
Cyprus1617,07215,552172,11710.08127
Pakistan1694,28590,034546,2105.79166
Colombia1660,40257,407468,1357.75186
Viet Nam1629,23827,989253,6618.68142
Lebanon1620,81519,040186,5588.96138
Virgin Islands (British)17121111204716.9220
Mali172490235336,25414.5675
Armenia1712,85212,496130,58410.16135
Nigeria1759,37256,630334,0595.63131
Tunisia1758,76955,904342,4295.83123
Indonesia1739,71937,729282,7887.12155
Lithuania1736,13635,205271,6667.52144
Kuwait1718,46817,687157,8888.55108
Hati1876568312,23115.9949
French Polynesia181272120719,52315.3558
Senegal187220675275,37310.4495
Cambodia182558229234,65413.5572
Sri Lanka1812,55711,532121,6969.69120
Morocco1840,73738,371279,7316.87129
Ethiopia1813,36312,625118,6568.88101
Bangladesh1830,61229,157227,4477.43134
Guam1978872712,22215.5155
Cte dIvoire194842462152,44610.8389
Madagascar193207305939,21712.2374
Papua New Guinea192258213331,11913.7871
Luxembourg1912,56211,567120,5709.6114
United Arab Emirates1931,36629,259210,8736.72130
Belarus1930,94430,439202,0886.53133
Jordan1928,23427,369201,4007.13112
Nicaragua201301123318,26914.0462
Greenland2097794114,48414.8248
Namibia202303212528,98512.5972
Guatemala202281208529,03412.7369
Ghana2011,54310,578111,2059.63105
Serbia2053,11650,436258,7324.87118
Algeria2042,45641,544215,9225.09106
Cuba2031,69030,382202,5036.39127
Latvia2016,35015,851119,6277.32112
Cameroon2111,12810,513108,6499.7694
Democratic Republic Congo21517481764114.7843
Georgia2111,19610,305105,0369.38114
Oman2112,84611,91987,3336.891
Palau22149143223815.0226
Botswana225107454552,19510.2279
Barbados221690141620,87912.3564
Nepal229133819685,1749.3394
Qatar2213,43812,52471,3825.3186
Congo233304306934,55910.4672
Honduras2399595013,15713.2251
Guinea23597552832013.9446
Jamaica234750422048,22610.1575
Niger231623155319,83512.2259
Sudan236099579250,7848.3370
Syrian Arab Republic235744545953,6019.3381
Macedonia238522816754,4096.3881
Laos241802167020,02811.1159
Belize24330299473414.3538
Virgin Islands (U.S.)24215204317314.7631
Mongolia243319316433,1199.9872
Paraguay241454137317,71712.1960
Moldova245948582846,5227.8280
Malta244500398040,6689.0483
Trinidad and Tobago245037456144,1468.7676
Sao Tome and Principe25474569514.7915
Chad25382363512213.4133
Guadeloupe251435134517,07511.952
Benin253851368135,4709.2165
Kazakhstan2512,12411,80939,7003.2768
Iraq2511,60511,04239,1453.3759
Uzbekistan259259899746,9005.0768
Palestine254506422430,3386.7360
Central African Republic26538500694012.941
Fiji262400218822,8369.5256
Liechtenstein261272117214,33911.2755
Dominican Republic261101102912,96511.7851
Azerbaijan269848962040,0704.0764
Yemen262776269818,9516.8350
Macao265157490325,2984.9157
Bahrain264657422524,7695.3255
Falkland Islands (Malvinas)27358341462812.9334
American Samoa27162150212713.1322
Gibraltar2710694145113.6919
Mauritius272206203517,6297.9954
Rwanda271759155415,3568.7354
Myanmar271543145813,7648.9251
Reunion27581544660511.3738
Bosnia and Herzegovina277054675230,3004.361
Brunei Darussalam272440213616,2246.6552
Albania273172302814,7594.6548
Solomon Islands28324296412512.7333
Svalbard and Jan Mayen28201828314.158
Tonga28108105140813.0421
Sierra Leone2859052955519.4131
Kyrgyzstan281486140299186.6745
El Salvador281149106199948.744
Swaziland28109198896188.8243
Eritrea28488468526010.7835
Bahamas28399365453511.3736
Libya284160402018,9714.5651
San Marino29191181236512.3823
British Indian Ocean Territory29191626714.057
Guyana2953048548989.2432
Togo291470136788506.0239
Angola2971568054227.5835
Mauritania2948245647629.8832
Samoa29249231273410.9827
Montenegro292232215373463.2932
Saint Vincent and the Grenadines30403851812.9511
Federated States of Micronesia30188175214411.424
Grenada3096582462866.5133
Afghanistan3079167458007.3336
Vanuatu3031729531429.9127
Tajikistan301244120947283.829
Lesotho3045942535247.6828
Burundi3042139237618.9332
Suriname3129327629219.9730
Bhutan3155149932495.927
Andorra31172151178610.3821
Turkmenistan3129628622917.7420
Cocos (Keeling) Islands32141416211.574
Tuvalu32252428411.368
Dominica3226623420077.5523
Cayman Islands3223121018578.0423
Maldives3220619418338.921
Equatorial Guinea32153147158710.3720
Turks and Caicos Islands33454547510.5613
Saint Kitts and Nevis3335024018665.3321
Liberia3326321619347.3521
Comoros3396898398.7413
Marshall Islands3384778279.8516
Northern Mariana Islands3368666801014
Cook Islands33646165810.2814
Cape Verde3419919415017.5417
Djibouti3519017812066.3518
Aruba3693746216.6812
Somalia36115976855.9615
Timor-Leste371251026285.0213
Mayotte3774724165.6210
Antigua and Barbuda381141035504.8213
Anguilla3836332015.587
South Georgia and the South Sandwich Islands39754262
Kiribati3933281845.588
Norfolk Island4020201145.77
Nauru4022211185.366
Vatican City State4125161214.846
Christmas Island4177385.434
Saint Helena421515694.65
Niue431613251.562
Bouvet Island4364294.832
Wallis and Futuna4315136044
Western Sahara441192223
Heard Island and McDonald Islands4511331
Saint Pierre and Miquelon455461.21
Pitcairn463141.331
Table A4. Pareto ranks and ranks from three sites.
UniversityRank1Rank2Rank3Pareto Rank
Massachusetts Institute of Technology1371
Stanford University2241
Harvard University3111
University of Cambridge4482
University of Oxford6532
University of Toronto323022
California Institute of Technology511593
University College London73153
University of Chicago108203
Yale University1510193
Johns Hopkins University171663
University of Pennsylvania1814133
Columbia University206143
University of California, Berkeley (UCB)28793
Swiss Federal Institute of Technology89654
Imperial College London935154
Princeton University119934
Cornell University1612254
University of Michigan2319104
University of California, Los Angeles (UCLA)3115124
University of Tokyo3413184
Pennsylvania State University9514134
National University of Singapore (NUS)1263295
The University of Edinburgh1955525
Duke University2529245
Northwestern University2621465
Kyoto University3720605
University of California, San Diego (UCSD)4017175
University of Washington5927115
Nanyang Technological University13134666
Tsinghua University2474386
The University of Manchester2961496
McGill University3042356
Seoul National University3524506
Peking University3960336
The University of Melbourne4289316
University of British Columbia4557216
New York University4622686
University of Wisconsin-Madison5325306
University of Copenhagen6869166
The University of Hong Kong271691377
University of Bristol411291027
Fudan University43192747
University of Sydney4695277
Brown University49871447
Carnegie Mellon University58672477
Osaka University63481017
University of Illinois at Urbana-Champaign6634767
University of Texas at Austin6732647
Ruprecht Karl University Heidelberg7282517
University of North Carolina, Chapel Hill7838437
Katholieke Universiteit Leuven7978237
The Ohio State University8846377
The Hong Kong University of Science and Technology363123258
The University of New South Wales (UNSW Australia)49117718
University of Queensland5199418
Shanghai Jiao Tong University61166398
National Taiwan University (NTU)6853928
University of Zurich8093658
University of California, Davis8549478
Utrecht University10483448
University of Warwick512802089
Tokyo Institute of Technology561282539
University of Amsterdam57111619
Technical University of Munich60104959
Monash University65143579
Georgia Institute of Technology71861259
Tohoku University75841059
Boston University8962799
University of Helsinki91107729
Purdue University92561099
University of Alberta94101779
Washington University (WUSTL)10651569
City University of Hong Kong5536425210
Delft University of Technology6225521010
University of Glasgow6313213010
Lund University731278310
Rice University9011429210
University of Geneva958010310
Uppsala University981268910
Leiden University1021128210
Lomonosov Moscow State University1087717710
Durham University7423125811
The University of Nottingham7513912711
University of Birmingham8215811911
University of Southampton8715311011
Royal Institute of Technology9713120611
The University of Western Australia10221310411
University of St Andrews7730734812
The University of Auckland8125219512
Pohang University of Science And Technology (POSTECH)8319134912
The University of Sheffield8417214712
University of Leeds9315913812
Korea University9814116212
University of Science and Technology of China10422311312
Universidad de Buenos Aires (UBA)8537227713
Trinity College Dublin9817526313
Karlsruhe Institute of Technology10121517213
Sungkyunkwan University (SKKU)10622113913
Technical University of Denmark10916815413

References

  1. Khan, N.R.; Thompson, C.J.; Taylor, D.R.; Gabrick, K.S.; Choudhri, A.F.; Boop, F.R.; Klimo, P. Part II: Should the h-index be modified? An analysis of the m-quotient, contemporary h-index, authorship value, and impact factor. World Neurosurg. 2013, 80, 766–774. [Google Scholar] [CrossRef] [PubMed]
  2. Baldock, C.; Ma, R.; Orton, C.G. The h index is the best measure of a scientist’s research productivity. Med. Phys. 2009, 36, 1043–1045. [Google Scholar] [CrossRef]
  3. Rezek, I.; McDonald, R.J.; Kallmes, D.F. Is the h-index predictive of greater NIH funding success among academic radiologists? Acad. Radiol. 2011, 18, 1337–1340. [Google Scholar] [CrossRef] [PubMed]
  4. Waltman, L.; Calero-Medina, C.; Kosten, J.; Noyons, E.; Tijssen, R.J.; Eck, N.J.; Leeuwen, T.N.; Raan, A.F.; Visser, M.S.; Wouters, P. The Leiden Ranking 2011/2012: Data collection, indicators, and interpretation. J. Am. Soc. Inf. Sci. Technol. 2012, 63, 2419–2432. [Google Scholar] [CrossRef] [Green Version]
  5. Patel, V.M.; Ashrafian, H.; Ahmed, K.; Arora, S.; Jiwan, S.; Nicholson, J.K.; Darzi, A.; Athanasiou, T. How has healthcare research performance been assessed? A systematic review. J. R. Soc. Med. 2011, 104, 251–261. [Google Scholar] [CrossRef]
  6. Hirsch, J.E. An index to quantify an individual’s scientific research output. Proc. Natl. Acad. Sci. USA 2005, 102, 16569–16572. [Google Scholar] [CrossRef] [Green Version]
  7. Schubert, A. Successive h-indices. Scientometrics 2007, 70, 201–205. [Google Scholar] [CrossRef]
  8. Wang, G.G.; Deb, S.; Cui, Z. Monarch butterfly optimization. Neural Comput. Appl. 2019, 31, 1995–2014. [Google Scholar] [CrossRef] [Green Version]
  9. Wang, G.G. Moth search algorithm: A bio-inspired metaheuristic algorithm for global optimization problems. Memetic Comput. 2018, 10, 151–164. [Google Scholar] [CrossRef]
  10. Yi, J.H.; Xing, L.N.; Wang, G.G.; Dong, J.; Vasilakos, A.V.; Alavi, A.H.; Wang, L. Behavior of crossover operators in NSGA-III for large-scale optimization problems. Inf. Sci. 2020, 509, 470–487. [Google Scholar] [CrossRef]
  11. Yi, J.H.; Deb, S.; Dong, J.; Alavi, A.H.; Wang, G.G. An improved NSGA-III algorithm with adaptive mutation operator for Big Data optimization problems. Future Gen. Comput. Syst. 2018, 88, 571–585. [Google Scholar] [CrossRef]
  12. Deb, K. Multi-Objective Optimization Using Evolutionary Algorithms; John-Wiley: Chichester, UK, 2001. [Google Scholar]
  13. Deb, K.; Agrawal, S.; Pratap, A.; Meyarivan, T. A fast elitist non-dominated sorting genetic algorithm for multi-objective optimization: NSGA-II. In Proceedings of the International Conference on Parallel Problem Solving From Nature, Paris, France, 18–20 December 2000; Springer: Cham, Switzerland, 2000; pp. 849–858. [Google Scholar]
  14. Srinivas, N.; Deb, K. Muiltiobjective optimization using nondominated sorting in genetic algorithms. Evol. Comput. 1994, 2, 221–248. [Google Scholar] [CrossRef]
  15. Wang, G.G.; Tan, Y. Improving metaheuristic algorithms with information feedback models. IEEE Trans. Cybern. 2017, 49, 542–555. [Google Scholar] [CrossRef]
  16. Wang, G.G.; Guo, L.; Gandomi, A.H.; Hao, G.S.; Wang, H. Chaotic krill herd algorithm. Inf. Sci. 2014, 274, 17–34. [Google Scholar] [CrossRef]
  17. Sidiropoulos, A.; Gogoglou, A.; Katsaros, D.; Manolopoulos, Y. Gazing at the skyline for star scientists. J. Informetr. 2016, 10, 789–813. [Google Scholar] [CrossRef]
  18. Van Leeuwen, T.; Visser, M.; Moed, H.; Nederhof, T.; Van Raan, A. The Holy Grail of science policy: Exploring and combining bibliometric tools in search of scientific excellence. Scientometrics 2003, 57, 257–280. [Google Scholar] [CrossRef]
  19. Martin, B. The use of multiple indicators in the assessment of basic research. Scientometrics 1996, 36, 343–362. [Google Scholar] [CrossRef]
  20. Alonso, S.; Cabrerizo, F.J.; Herrera-Viedma, E.; Herrera, F. hg-index: A new index to characterize the scientific output of researchers based on the h-and g-indices. Scientometrics 2010, 82, 391–400. [Google Scholar] [CrossRef] [Green Version]
  21. Alonso, S.; Cabrerizo, F.J.; Herrera-Viedma, E.; Herrera, F. h-Index: A review focused in its variants, computation and standardization for different scientific fields. J. Informetr. 2009, 3, 273–289. [Google Scholar] [CrossRef] [Green Version]
  22. Van Raan, A.F. Comparison of the Hirsch-index with standard bibliometric indicators and with peer judgment for 147 chemistry research groups. Scientometrics 2006, 67, 491–502. [Google Scholar] [CrossRef]
  23. Liang, L. H-index sequence and h-index matrix: Constructions and applications. Scientometrics 2006, 69, 153–159. [Google Scholar] [CrossRef]
  24. Costas, R.; Bordons, M. The h-index: Advantages, limitations and its relation with other bibliometric indicators at the micro level. J. Informetr. 2007, 1, 193–203. [Google Scholar] [CrossRef] [Green Version]
  25. Hirsch, J.E. Does the h index have predictive power? Proc. Natl. Acad. Sci. USA 2007, 104, 19193–19198. [Google Scholar] [CrossRef] [Green Version]
  26. Jin, B.; Liang, L.; Rousseau, R.; Egghe, L. The R-and AR-indices: Complementing the h-index. Chin. Sci. Bull. 2007, 52, 855–863. [Google Scholar] [CrossRef]
  27. Bornmann, L.; Daniel, H.D. The state of h index research. EMBO Rep. 2009, 10, 2–6. [Google Scholar] [CrossRef] [Green Version]
  28. Egghe, L. Theory and practise of the g-index. Scientometrics 2006, 69, 131–152. [Google Scholar] [CrossRef]
  29. Batista, P.D.; Campiteli, M.G.; Kinouchi, O. Is it possible to compare researchers with different scientific interests? Scientometrics 2006, 68, 179–189. [Google Scholar] [CrossRef]
  30. Jin, B. H-index: An evaluation indicator proposed by scientist. Sci. Focus 2006, 1, 8–9. [Google Scholar]
  31. Jin, B. The AR-index: Complementing the h-index. ISSI Newsl. 2007, 3, 6. [Google Scholar]
  32. Egghe, L.; Rousseau, R. An h-index weighted by citation impact. Inf. Process. Manag. 2008, 44, 770–780. [Google Scholar] [CrossRef]
  33. Aguillo, I.F.; Bar-Ilan, J.; Levene, M.; Ortega, J.L. Comparing university rankings. Scientometrics 2010, 85, 243–256. [Google Scholar] [CrossRef]
  34. Olcay, G.A.; Bulu, M. Is measuring the knowledge creation of universities possible? A review of university rankings. Technol. Forecast. Soc. Chang. 2016, 123, 153–160. [Google Scholar] [CrossRef] [Green Version]
  35. Moed, H.F. A critical comparative analysis of five world university rankings. Scientometrics 2016, 110, 967–990. [Google Scholar] [CrossRef] [Green Version]
  36. Avralev, N. Comparative Analysis of the Role of the University Ranking Positions under Conditions of Globalization in the Motivation of Prospective Students in 2011–2014. Glob. Media J. 2016, 10, 1–7. [Google Scholar]
  37. Kapur, N.; Lytkin, N.; Chen, B.C.; Agarwal, D.; Perisic, I. Ranking Universities Based on Career Outcomes of Graduates. In Proceedings of the 22nd ACM SIGKDD International Conference on Knowledge Discovery and Data Mining, San Francisco, CA, USA, 13–17 August 2016; ACM: New York, NY, USA, 2016; pp. 137–144. [Google Scholar]
  38. Aguillo, I.F. University rankings: The web ranking. High. Learn. Res. Commun. 2012, 2, 3–22. [Google Scholar] [CrossRef]
  39. Çakır, M.P.; Acartürk, C.; Alaşehir, O.; Çilingir, C. A comparative analysis of global and national university ranking systems. Scientometrics 2015, 103, 813–848. [Google Scholar] [CrossRef]
  40. Lukman, R.; Krajnc, D.; Glavič, P. University ranking using research, educational and environmental indicators. J. Clean. Prod. 2010, 18, 619–628. [Google Scholar] [CrossRef]
  41. Baty, P. Global Rankings: Change for the better. In The World University Rankings, Times Higher Education; Routlege: London, UK, 2011; Volume 6. [Google Scholar]
  42. Lazaridis, T. Ranking university departments using the mean h-index. Scientometrics 2010, 82, 211–216. [Google Scholar] [CrossRef]
  43. Liu, N.C.; Cheng, Y. The academic ranking of world universities. High. Educ. Europe 2005, 30, 127–136. [Google Scholar] [CrossRef]
  44. Dehon, C.; McCathie, A.; Verardi, V. Uncovering excellence in academic rankings: A closer look at the Shanghai ranking. Scientometrics 2010, 83, 515–524. [Google Scholar] [CrossRef]
  45. The Scimago Institutions Rankings. Available online: http://www.scimagoir.com/methodology.php (accessed on 20 March 2019).
  46. Aguillo, I.F.; Granadino, B.; Ortega, J.L.; Prieto, J.A. Scientific research activity and communication measured with cybermetrics indicators. J. Am. Soc. Inf. Sci. Technol. 2006, 57, 1296–1302. [Google Scholar] [CrossRef]
  47. Aguillo, I.F.; Ortega, J.L.; Fernández, M. Webometric ranking of world universities: Introduction, methodology, and future developments. High. Educ. Eur. 2008, 33, 233–244. [Google Scholar] [CrossRef]
  48. Huang, M.H. Performance ranking of scientific papers for world universities. In Proceedings of the International Symposium: Ranking in Higher Education on the Global and National stages, Taibei, Taiwan, 30–31 May 2008. [Google Scholar]
  49. Radojicic, Z.; Jeremic, V. Quantity or quality: What matters more in ranking higher education institutions. Curr. Sci. 2012, 103, 158–162. [Google Scholar]
  50. Jeremic, V.; Bulajic, M.; Martic, M.; Radojicic, Z. A fresh approach to evaluating the academic ranking of world universities. Scientometrics 2011, 87, 587–596. [Google Scholar] [CrossRef]
  51. Ivanovic, B. Classification Theory; Institute for Industrial Economics: Belgrade, Serbia, 1977. [Google Scholar]
  52. Leiden Ranking Website. Available online: http://www.leidenranking.com/information/indicators (accessed on 20 May 2019).
  53. Van Vught, F.A.; Westerheijden, D.F. Multidimensional Ranking; Springer: Cham, Switzerland, 2012; pp. 11–23. [Google Scholar]
  54. Van Vught, F.; Westerheijden, D.F. Multidimensional ranking. High. Educ. Manag. Policy 2010, 22, 1–26. [Google Scholar] [CrossRef] [Green Version]
  55. Parris, T.M.; Kates, R.W. Characterizing and measuring sustainable development. Annu. Rev. Environ. Resour. 2003, 28, 559–586. [Google Scholar] [CrossRef]
  56. Mayer, A.L. Strengths and weaknesses of common sustainability indices for multidimensional systems. Environ. Int. 2008, 34, 277–291. [Google Scholar] [CrossRef]
  57. Afgan, N.H.; Carvalho, M.G. Sustainability assessment of hydrogen energy systems. Int. J. Hydrog. Energy 2004, 29, 1327–1342. [Google Scholar] [CrossRef]
  58. Pareto, V. Cours d’Économie Politique; Librairie Droz: Geneva, Switzerland, 1964; Volume 1. [Google Scholar]
  59. Chinchuluun, A.; Pardalos, P.M. A survey of recent developments in multiobjective optimization. Ann. Oper. Res. 2007, 154, 29–50. [Google Scholar] [CrossRef]
  60. Gu, Z.M.; Wang, G.G. Improving NSGA-III algorithms with information feedback models for large-scale many-objective optimization. Future Gen. Comput. Syst. 2020, 107, 49–69. [Google Scholar] [CrossRef]
  61. Talbi, E.G. Metaheuristics: From Design to Implementation; John Wiley & Sons: New York, NY, USA, 2009; Volume 74. [Google Scholar]
  62. Kukkonen, S.; Lampinen, J. Ranking-dominance and many-objective optimization. In Proceedings of the IEEE Congress on Evolutionary Computation, CEC IEEE, Singapore, 25–28 September 2007; pp. 3983–3990. [Google Scholar]
  63. Fonseca, C.M.; Fleming, P.J. Genetic Algorithms for Multiobjective Optimization: Formulation Discussion and Generalization. In Icga; Citeseer: Pennsylvania, PA, USA, 1993; Volume 93, pp. 416–423. [Google Scholar]
Figure 1. Pareto optimal set (non-dominated solutions) and dominated solutions for a two dimensional space.
Mathematics 08 00956 g001
Figure 2. Pareto front for a two dimensional space.
Mathematics 08 00956 g002
Figure 3. An example of a dominance depth ranking method.
Mathematics 08 00956 g003
Figure 4. Pareto fronts for the researcher dataset. Different colors and symbols are used to distinguish thirty five Pareto fronts with two research period (the horizontal axis) and h-index (the vertical axis) indicators.
Mathematics 08 00956 g004
Figure 5. The rank of h-index and research period values for Pareto fronts in the researcher data. (a) Research period; (b) h-index.
Mathematics 08 00956 g005
Figure 6. The rank of article and citation indicators for universities based on each Pareto front in the university data. (a) Article; (b) citation.
Mathematics 08 00956 g006
Figure 7. The rank of total document and article indicators for universities based on each Pareto front in the university data. (a) Total document; (b) article impact total (AIT).
Mathematics 08 00956 g007
Figure 8. The rankk of each indicator for universities based on each Pareto front for the university data. (a) Citation impact total (CIT); (b) collaboration; (c) research period.
Mathematics 08 00956 g008
Figure 9. The Parallel coordinates for Pareto fronts one to four for the university data.
Mathematics 08 00956 g009
Figure 10. The rank of each indicator for countries based on each Pareto front for the country data. (a) Citable documents (CI-DO); (b) citations.
Mathematics 08 00956 g010
Figure 11. The rank of each indicator for countries based on each Pareto front for the country dataset. (a) Document; (b) h-index; (c) citations per document (CPD).
Mathematics 08 00956 g011
Figure 12. The number of countries in each continent for all Pareto fronts in the third case study.
Mathematics 08 00956 g012
Figure 13. The parallel coordinates for Pareto fronts one to four for the country dataset.
Mathematics 08 00956 g013
Figure 14. Pareto fronts obtained by using three ranks.
Mathematics 08 00956 g014
Figure 15. The rank of ranks based on each Pareto front for the ranks of universities data. (a) Rank1; (b) Rank2; (c) Rank3.
Mathematics 08 00956 g015
Table 1. A summary of advantages and disadvantages for some commonly used indicators.
IndicatorAdvantageDisadvantage
The total number of published papersIt is a proper measure to quantify the productivity.It does not consider the impact of their publications.
The total number of received citationsIt can measure the total impact.It may be inflated by a small number of “big hits” when a paper has many co-authors. It gives a Excess weight to highly cited survey papers.
Average number of citations per publication, without counting self-citationsIt can be applied to compare junior and senior scientists (not in a complete way, because the senior researchers had more time for better building up of this metric).It is hard to find and rewards low productivity and penalizes high productivity.
Number of “significant papers” (as the number of papers with having more than y citations)It eliminates disadvantages of the previous mentioned indicators; the total number of published papers, the total number of citations, and average number of citations per publication.The value of “y” should be adjusted.
The number of citations to each of the q most cited papersSimilar to Number of “significant papers,” it can overcomes many of the mentioned disadvantages above.q” has not a single value so it is difficult to compute and compare.
Table 2. A numerical example of computed new metrics for eight points shown in Figure 3. Four new statistical metrics are mean-ranks, median-ranks, dominated number, and nn-dominated number. Ranks-F1 and Ranks-F2 are ranks (two columns Ranks-F1 and Ranks-F2) for two criterion vectors F1 and F2.
PointF1F2Ranks-F1Ranks-F2Mean-RanksMedian-RanksNon-Dominated NumberDominated Number
10.220.78153303
20.560.52333303
30.70.28624401
40.80.2714401
50.460.86264412
60.630.62544.54.511
80.90.89877.57.530
70.620.94486660
Table 3. Indicators and the Pareto fronts from one to three by the non-dominated sorting on the country data.
CountryRankDocumentsCI-DOCitationsCPDh-Index
United States19,360,2338,456,050202,750,56521.661783
Netherlands1746,289682,62716,594,52822.24752
Switzerland1541,846501,91712,592,00323.24744
Panama151294830137,58526.82142
Gambia12004185954,92527.4199
Bermuda163359021,88434.5773
China24,076,4144,017,12324,175,0675.93563
United Kingdom22,624,5302,272,67550,790,50819.351099
Sweden2503,889471,03610,832,33621.5666
Denmark2290,994269,3646,405,07622.01558
Iceland215,62514,353357,67822.89218
Montserrat29593228224.0227
Germany32,365,1082,207,76540,951,61617.31961
Canada31,339,4711,227,62225,677,20519.17862
Israel3295,747274,7485,826,87819.7536
Faroe Islands351047210,10519.8148
Guinea-Bissau3458421935720.4350
Table 4. The Pareto fronts from one to forth by the proposed method on the country data.
CountryRankDocumentsCI-DOCitationsCPDh-Index
United States19,360,2338,456,050202,750,56521.661783
Netherlands2746,289682,62716,594,52822.24752
United Kingdom22,624,5302,272,67550,790,50819.351099
Switzerland3541,846501,91712,592,00323.247444
China34,076,4144,017,12324,175,0675.93563
Germany32,365,1082,207,76540,951,61617.31961
Canada31,339,4711,227,62225,677,20519.17862
Panama451294830137,58526.82142
Sweden4503,889471,03610,832,33621.5666
Denmark4290,994269,3646,405,07622.01558
Iceland415,62514,353357,67822.89218
Japan42,212,6362,133,32630,436,11413.76797
France41,684,4791,582,19728,329,81516.82878