Malmquist Productivity Analysis of Top Global Automobile Manufacturers


Abstract
1. Introduction
2. Literature Review
3. Materials and Methods
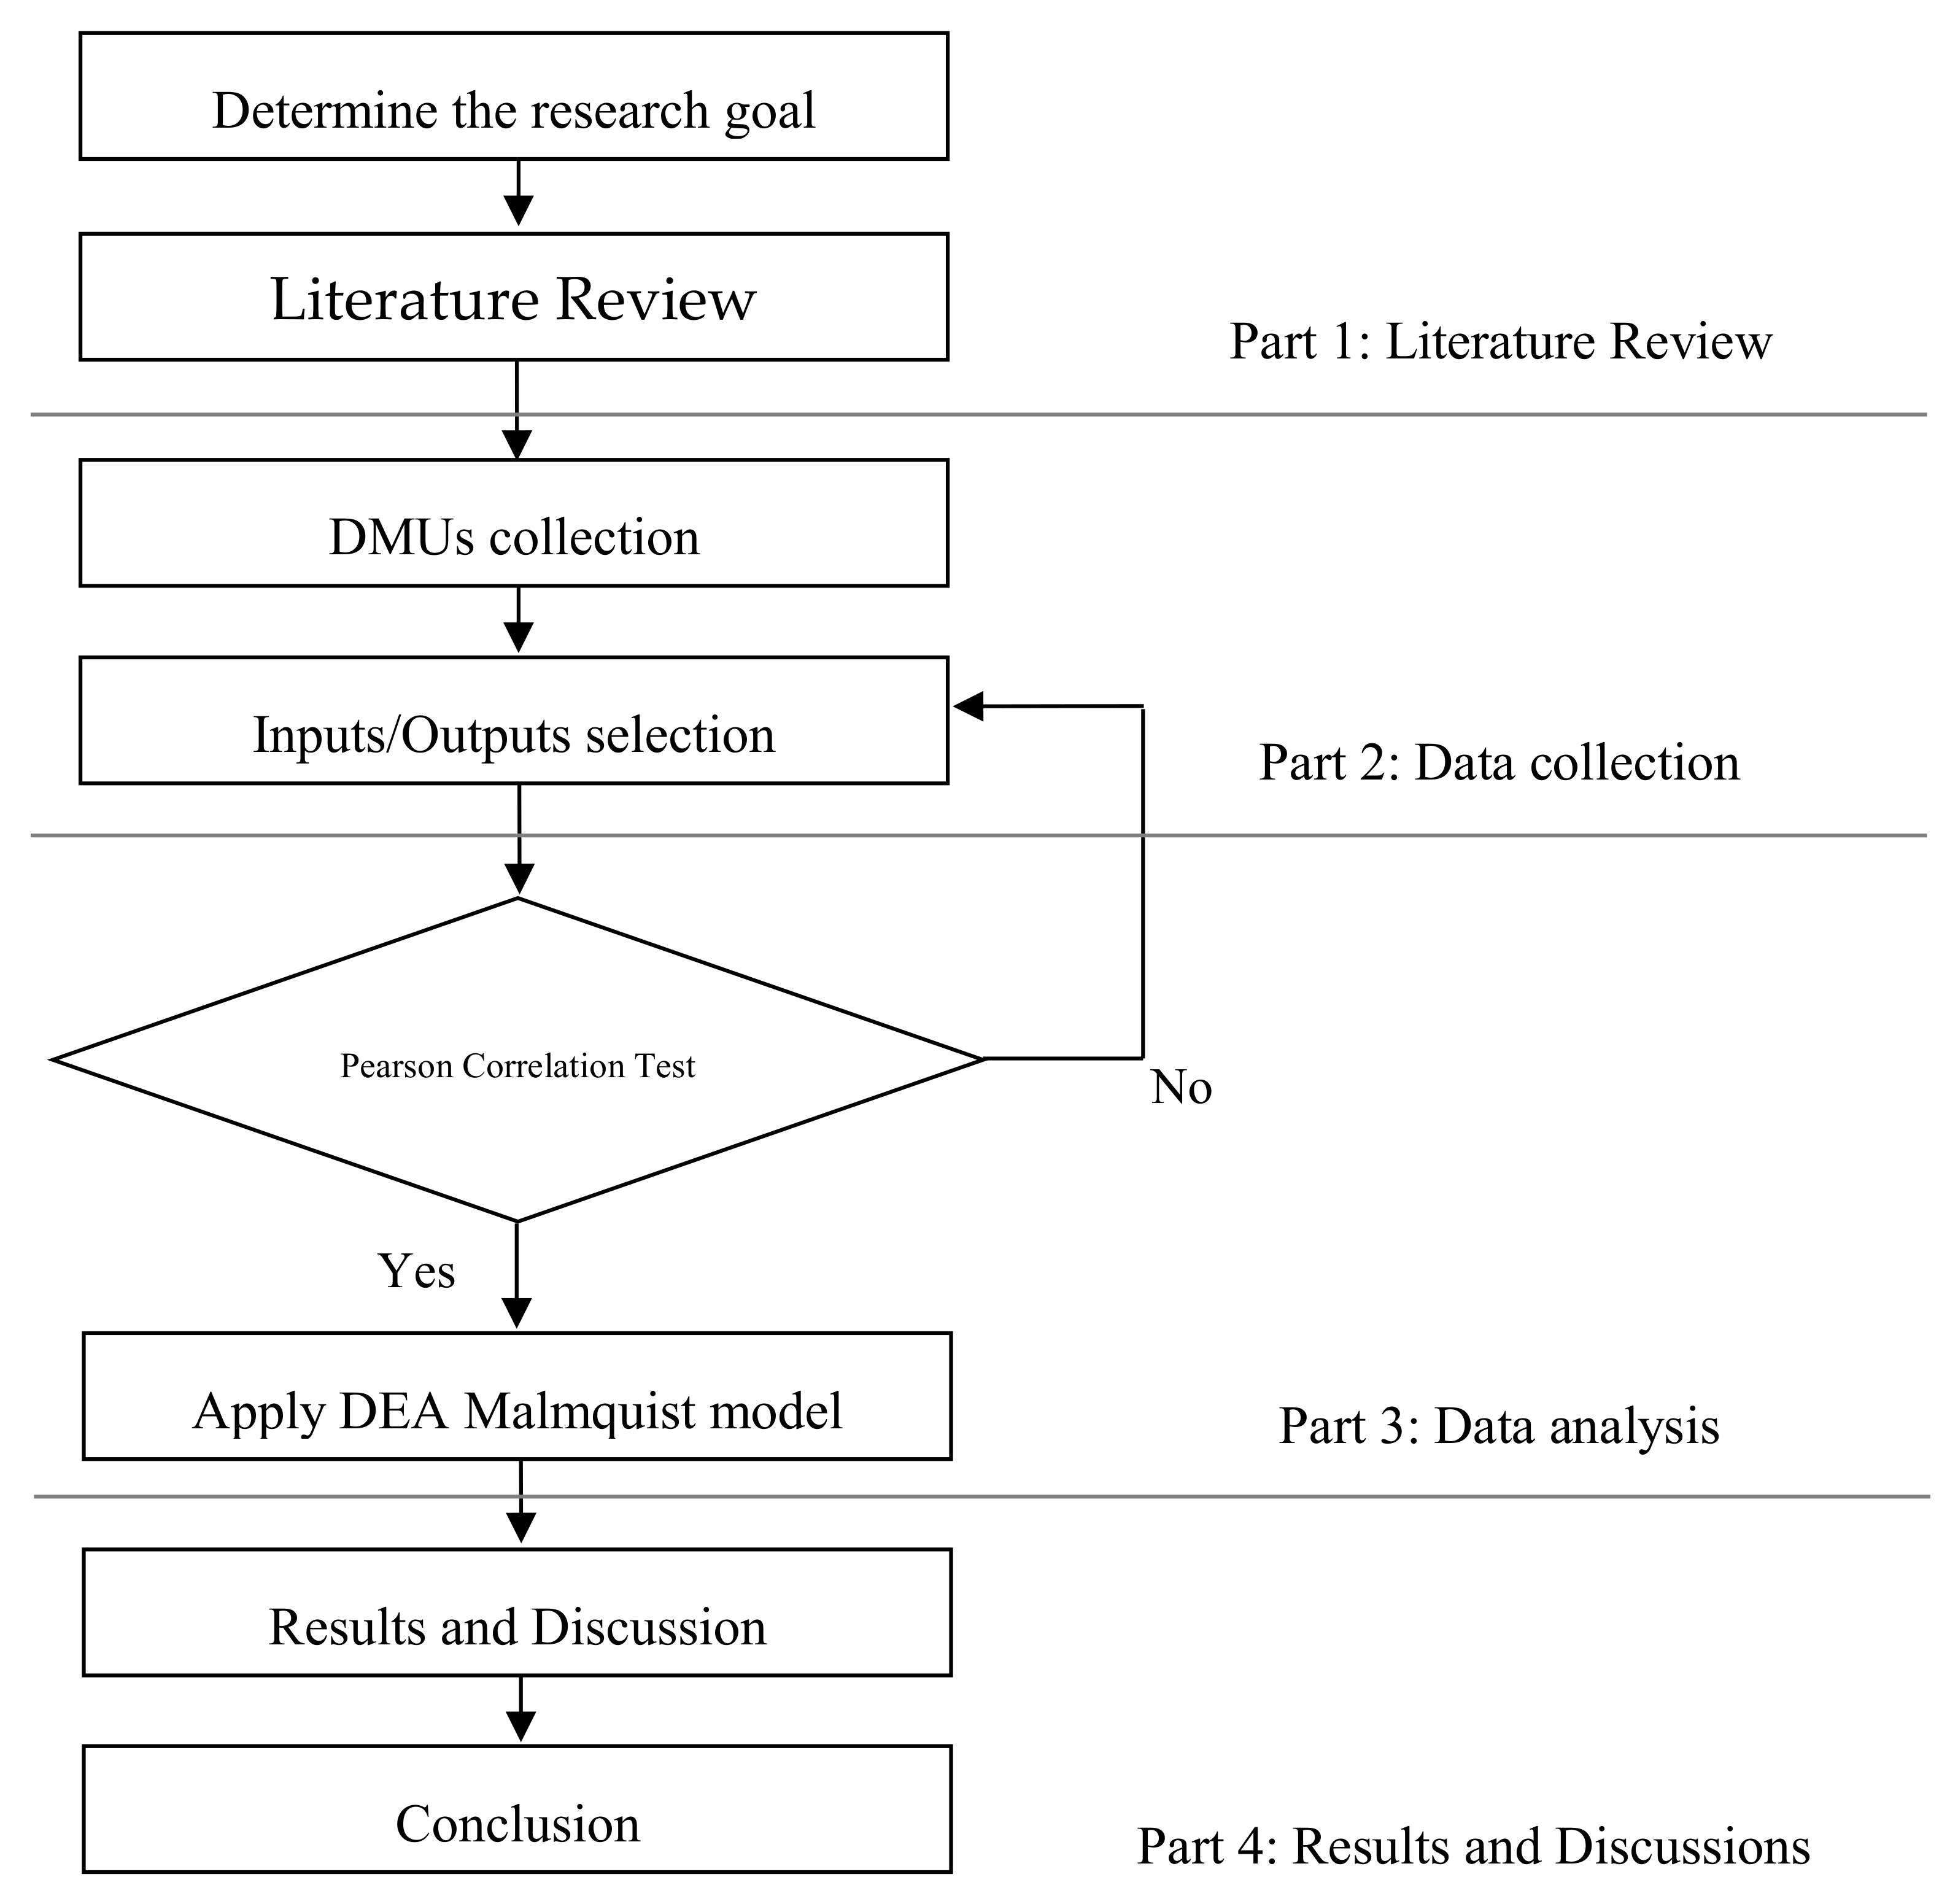
3.1. Research Process
3.2. Malmquist Productivity Index
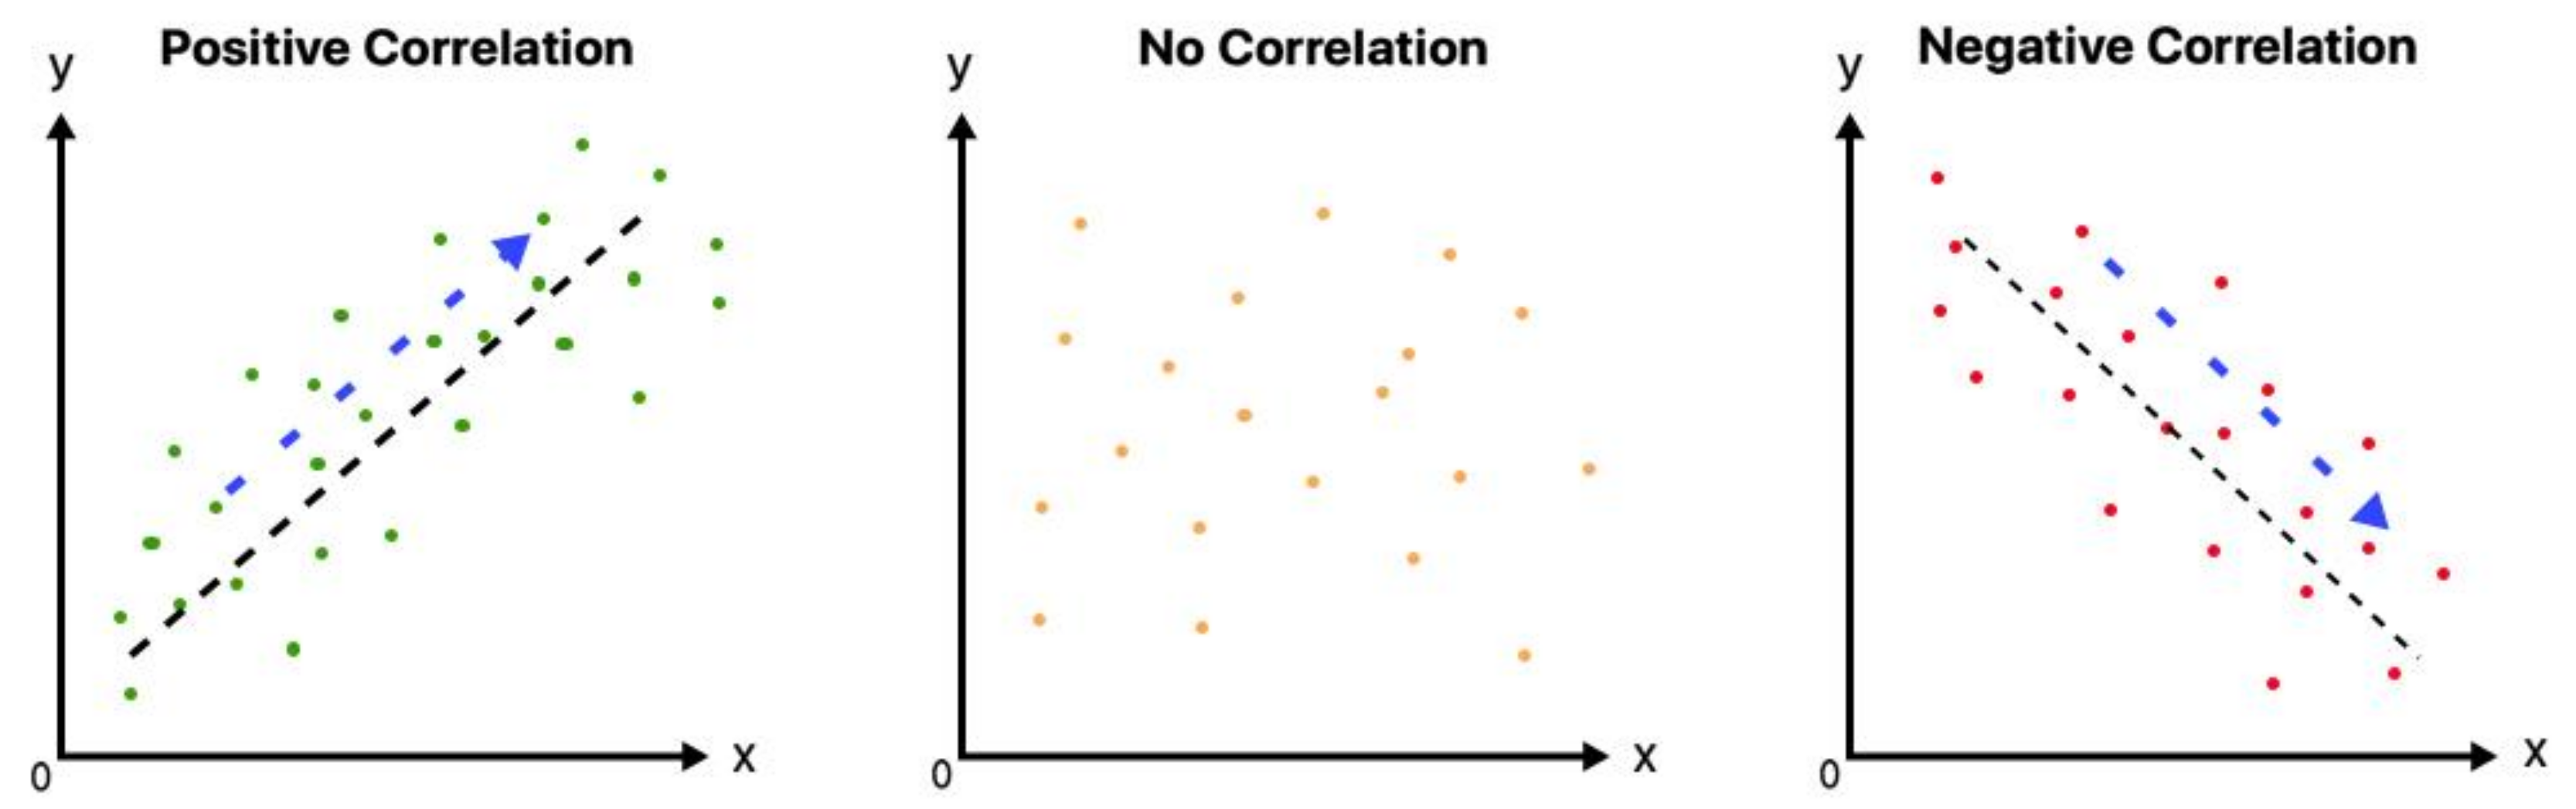
3.3. Pearson Correlation Coefficient
3.4. Data Collection
3.4.1. Selection of Decision-Making Units (DMUs)
3.4.2. Selection of Input/Output Variables
- Total Assets (TA): the total amount of assets owned by the automaker second item.
- Equity (EQ): the higher the equity level of a company, the better access to many debt-based funding. If most assets come from equity, the financial leverage is low, and then equity can be a proxy for financial debt-based assets for companies.
- Cost of Revenue (CR): the total costs that are directly connected with producing and distributing goods and services to customers of the automaker.
- Operating Expenses (OE): expenditures incurred in carrying out automaker’s day-to-day activities but not directly associated with production, including selling, administrative and general expenses.
- Revenue (RE): the total receipts that the automaker obtains from selling goods or services.
- Net Income (NI): the actual profit of the automaker after accounting for all costs, and taxes.
3.4.3. Research Data
4. Results and Discussion
4.1. Correlation Results
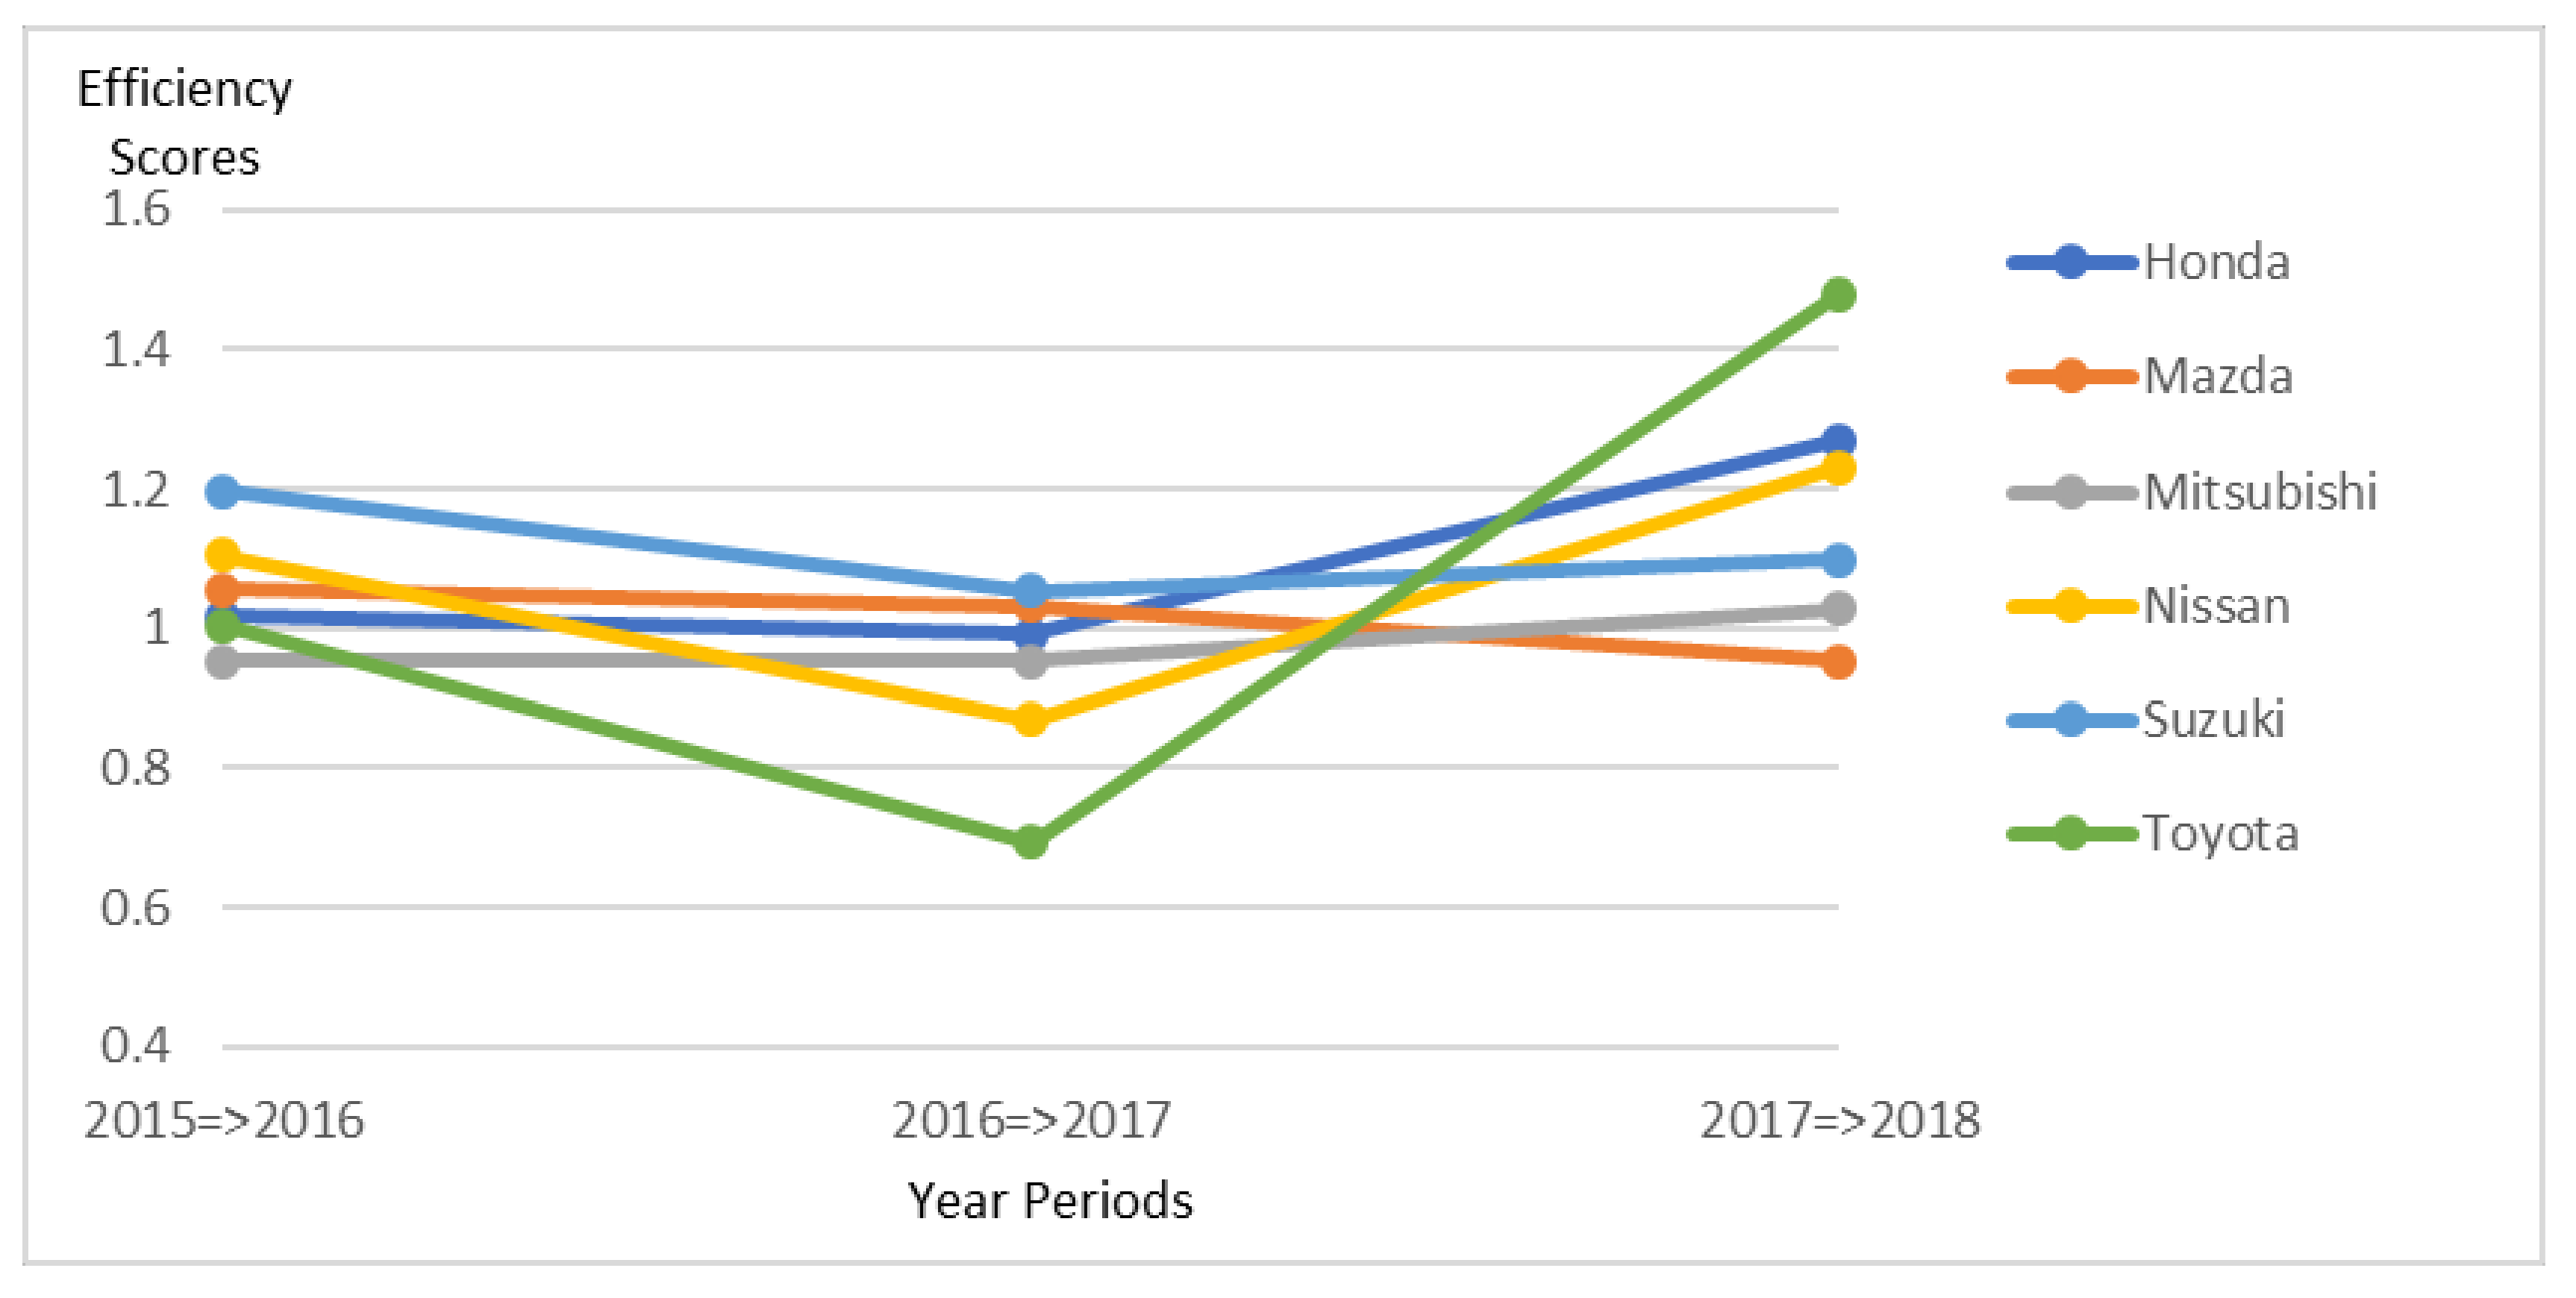
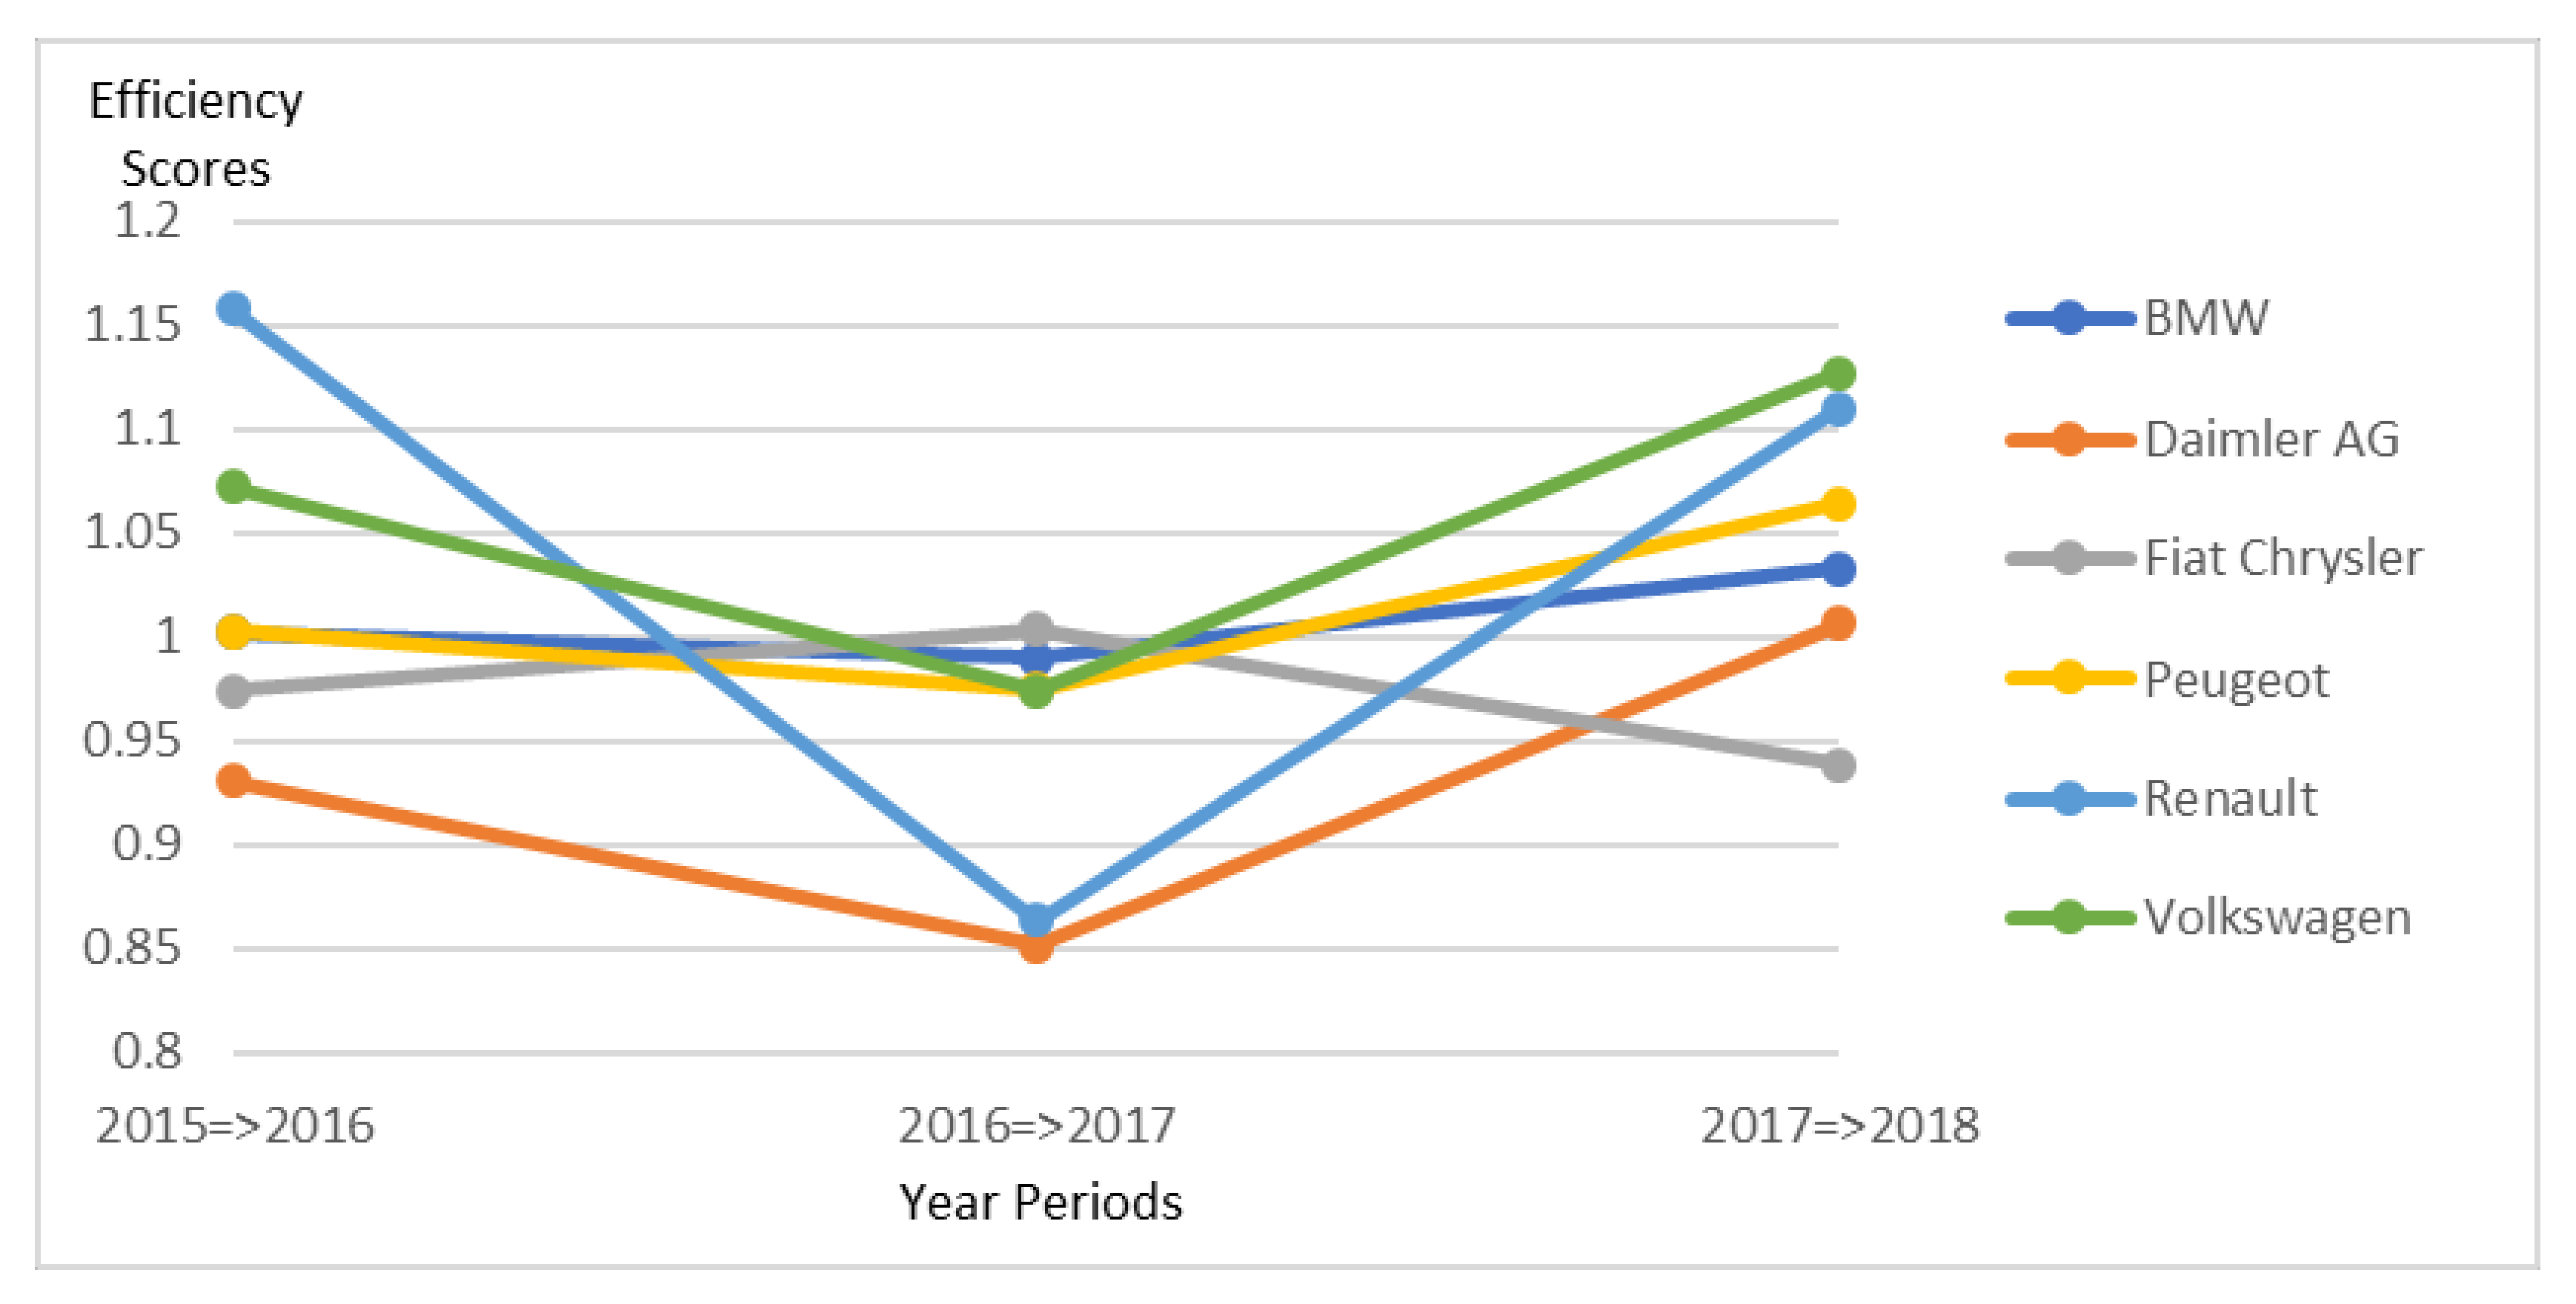
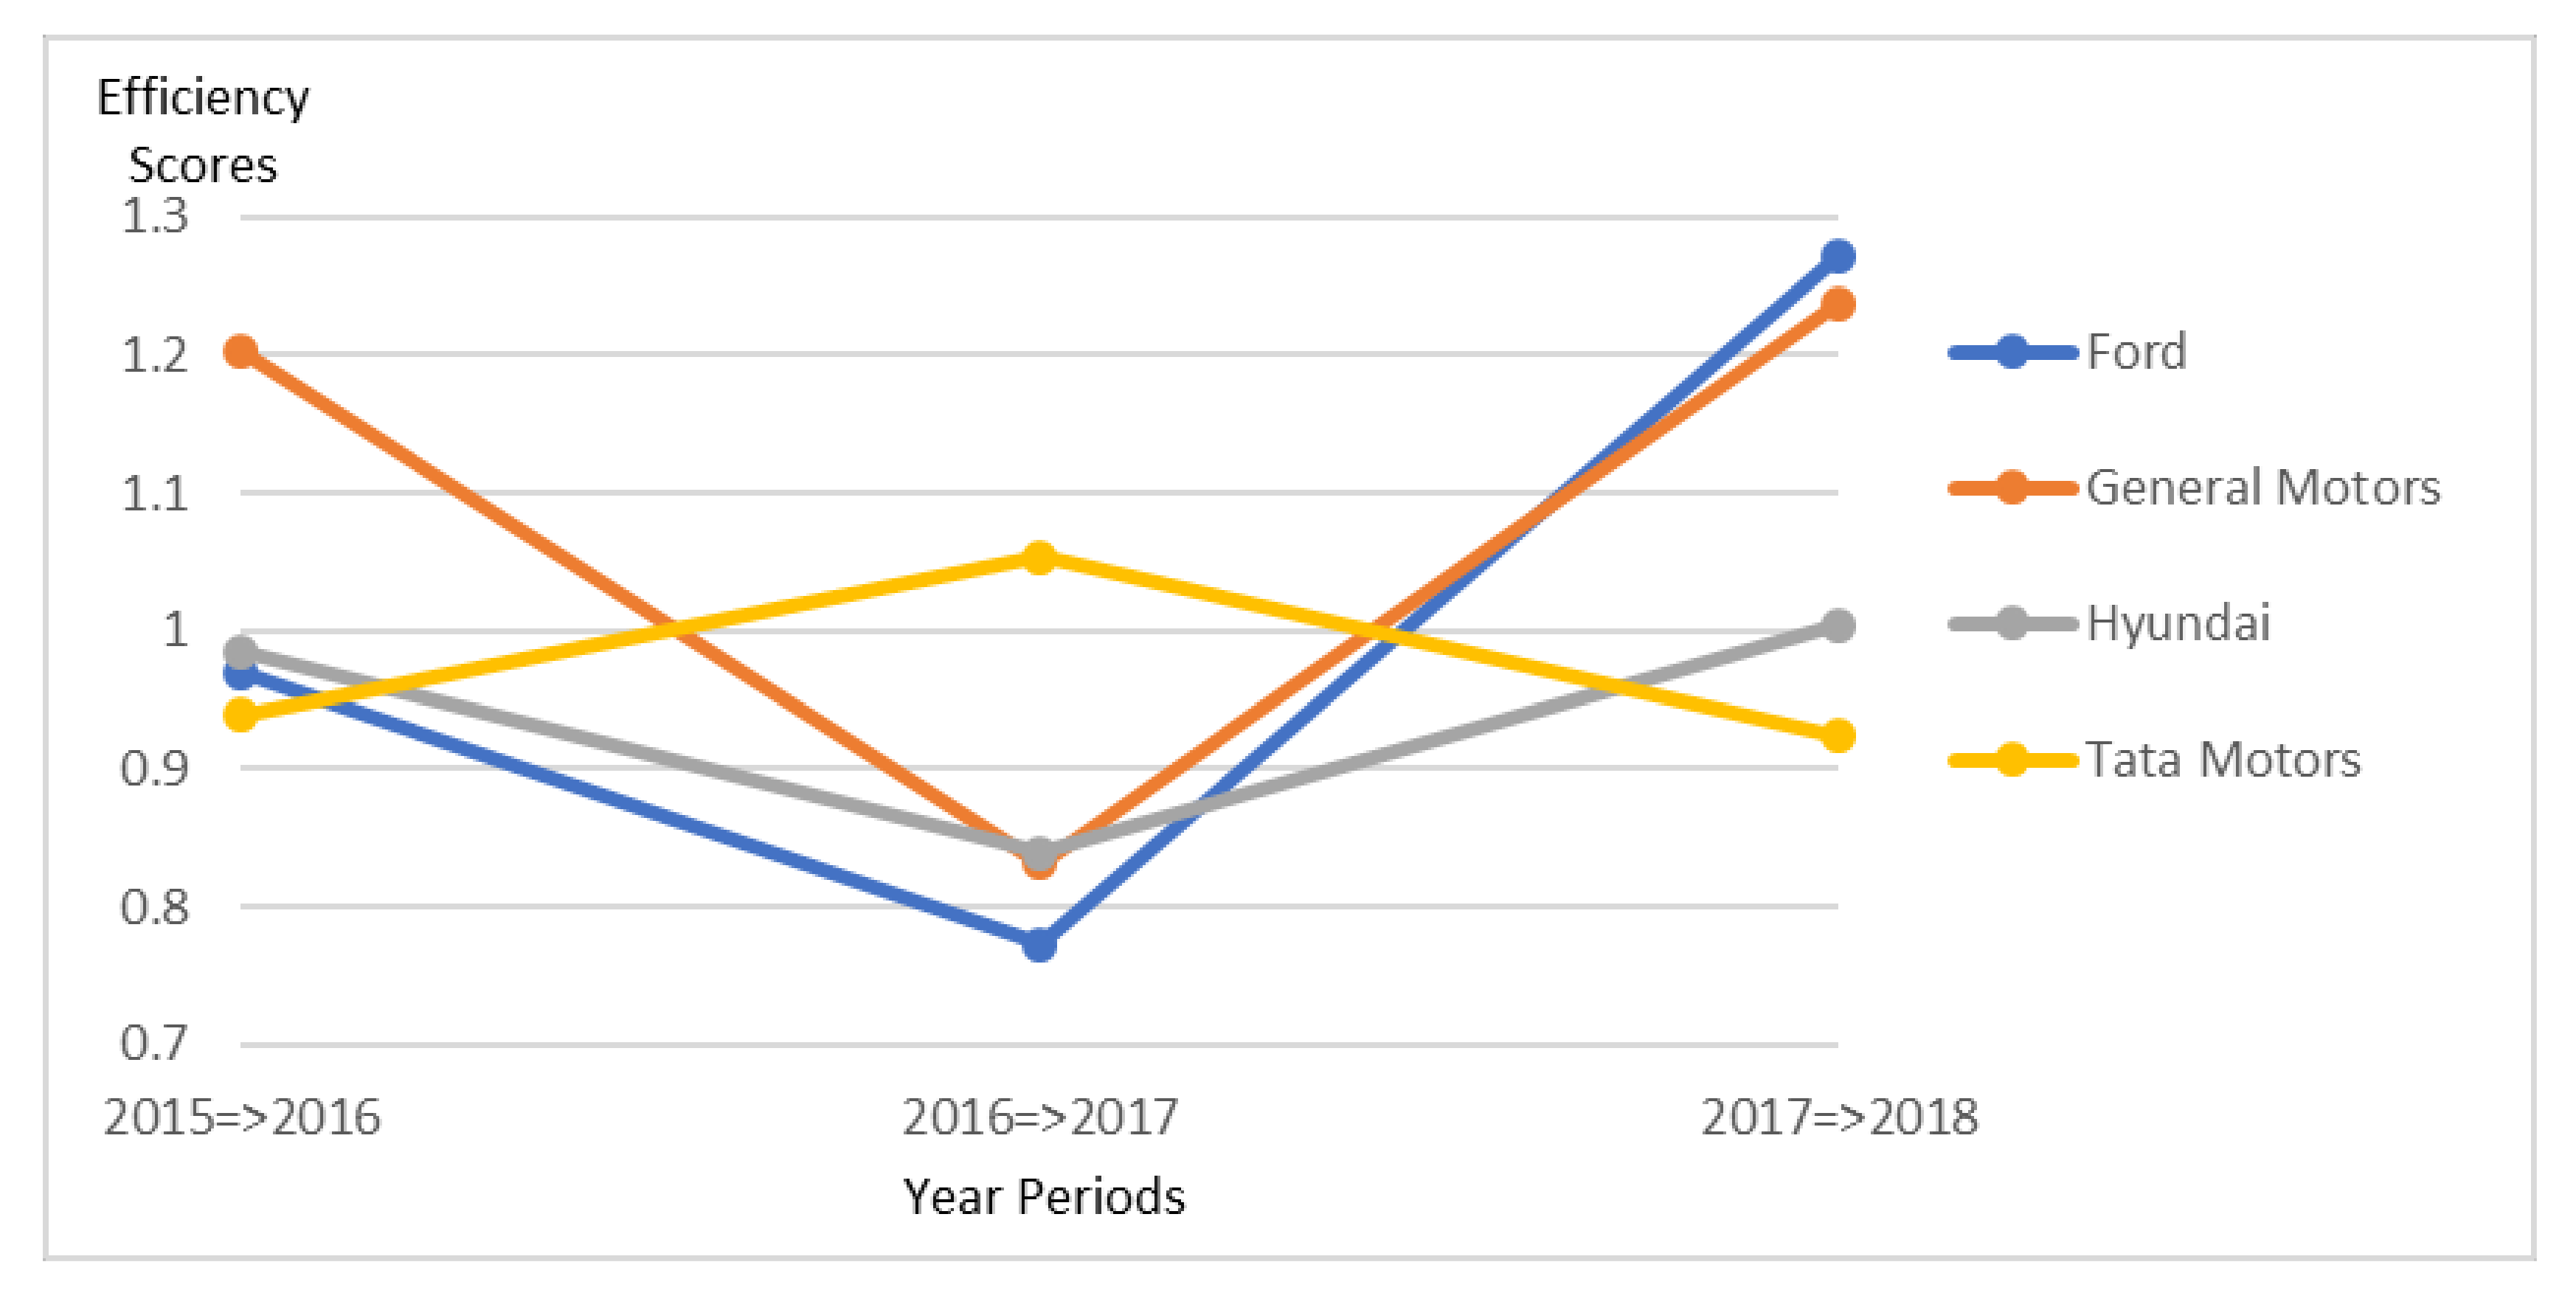
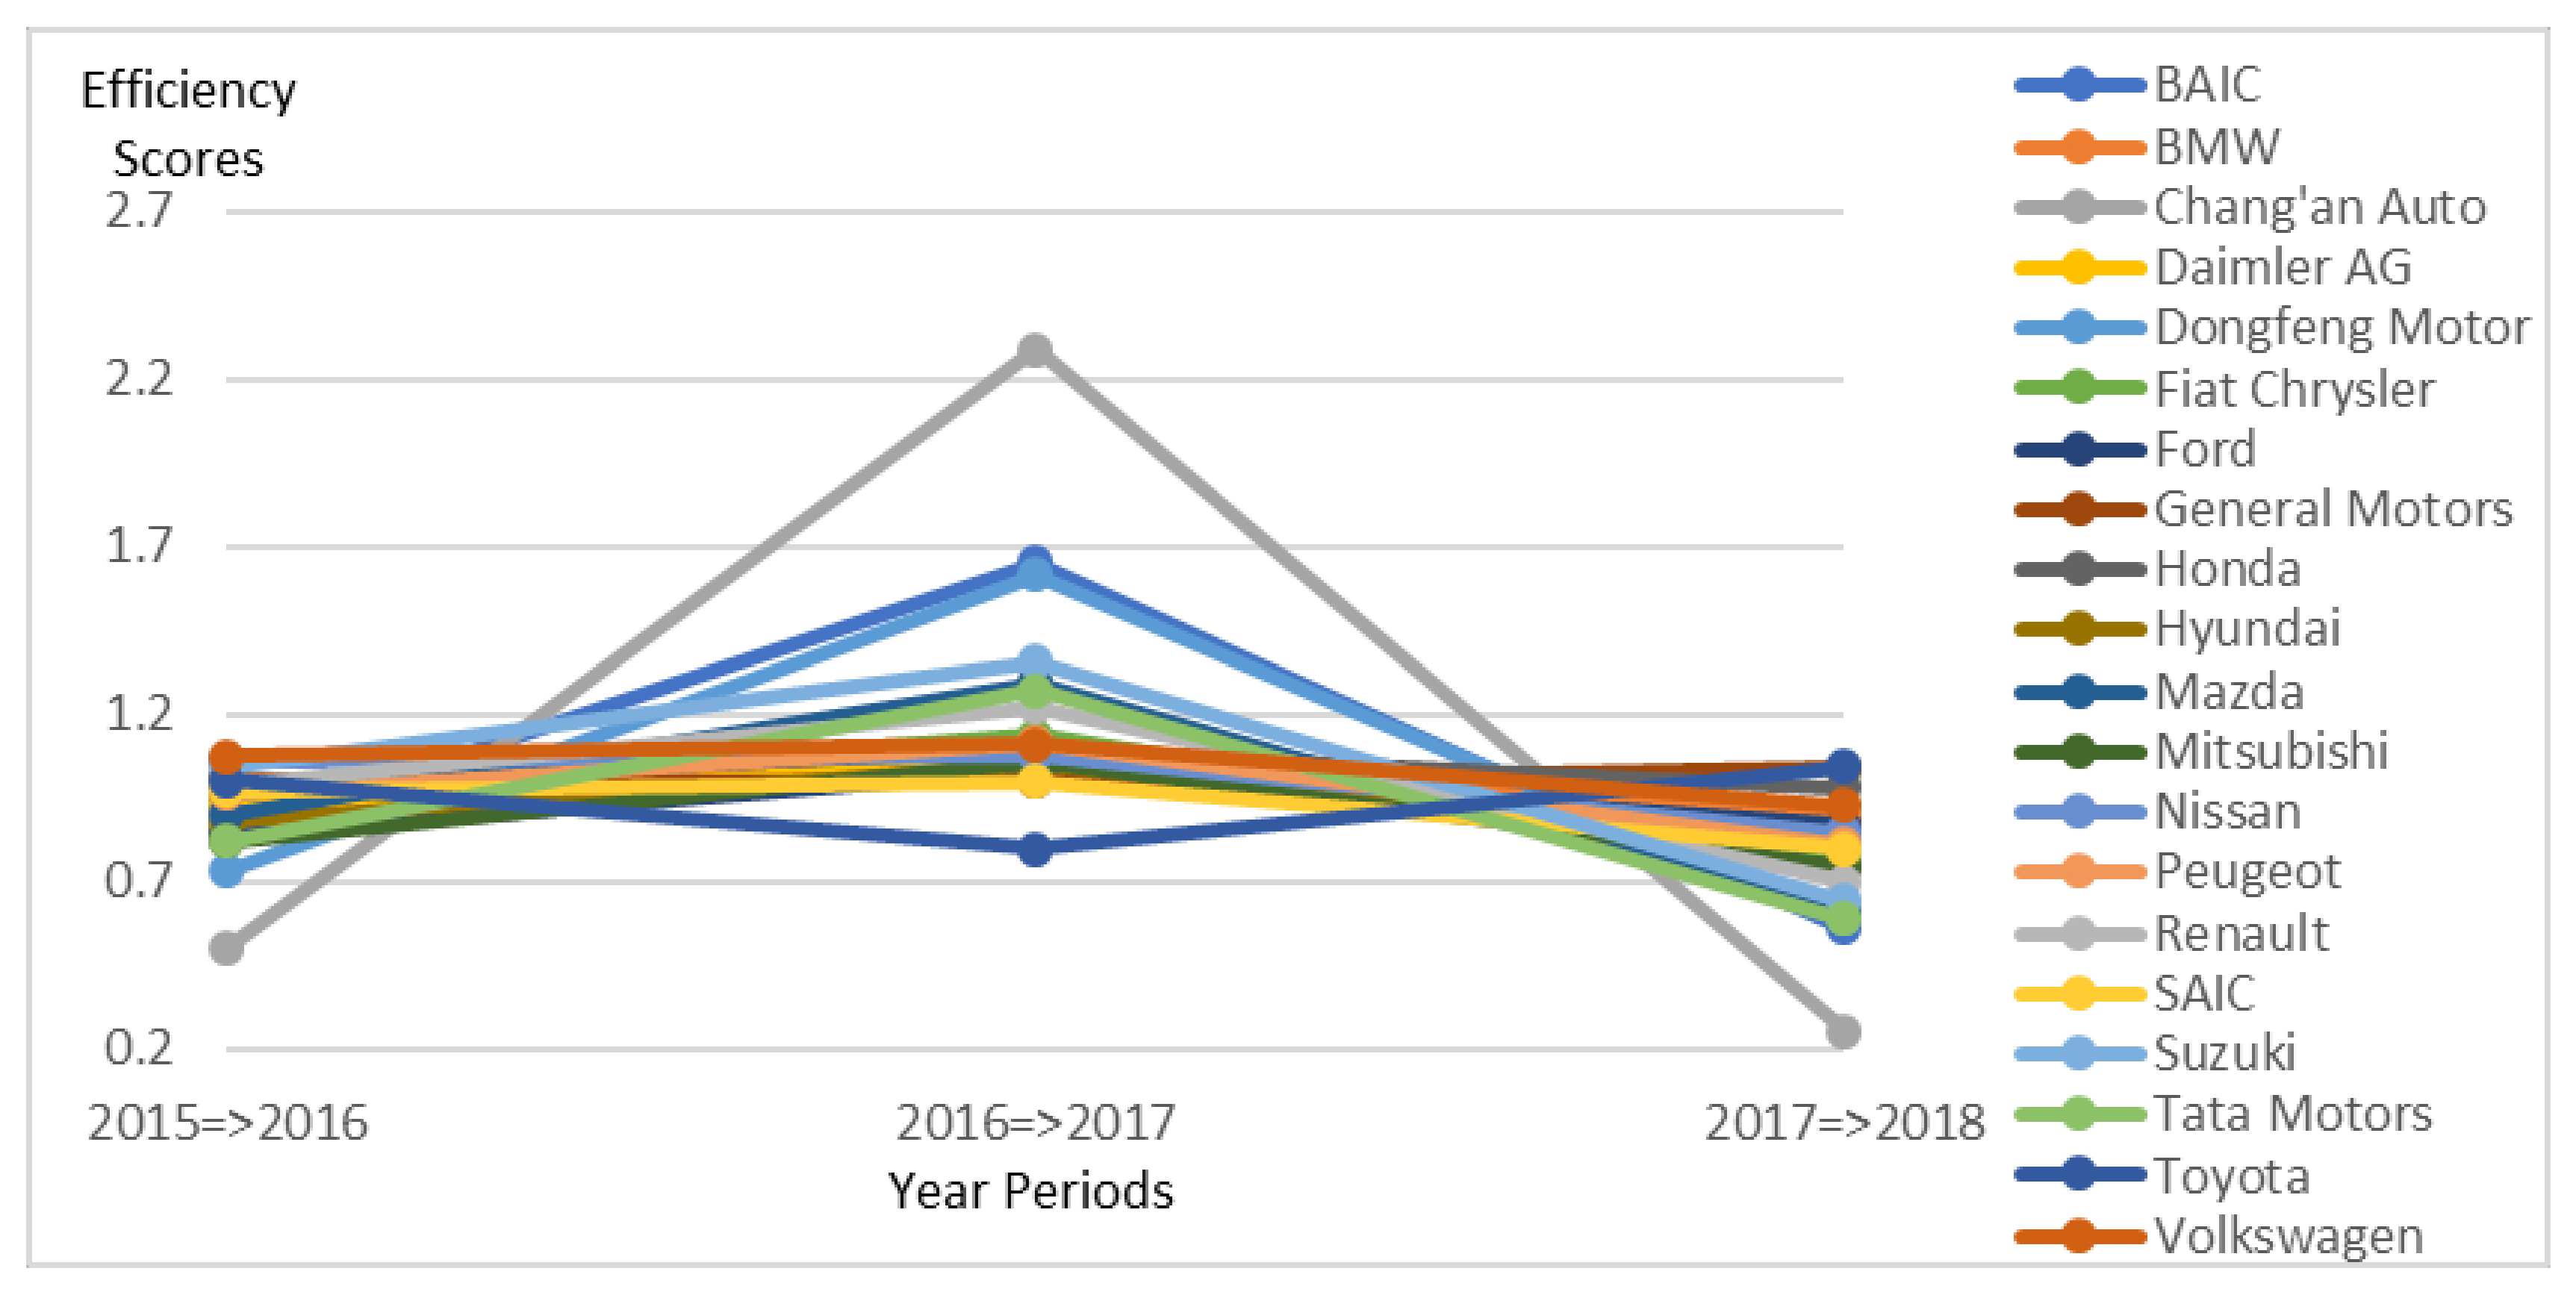
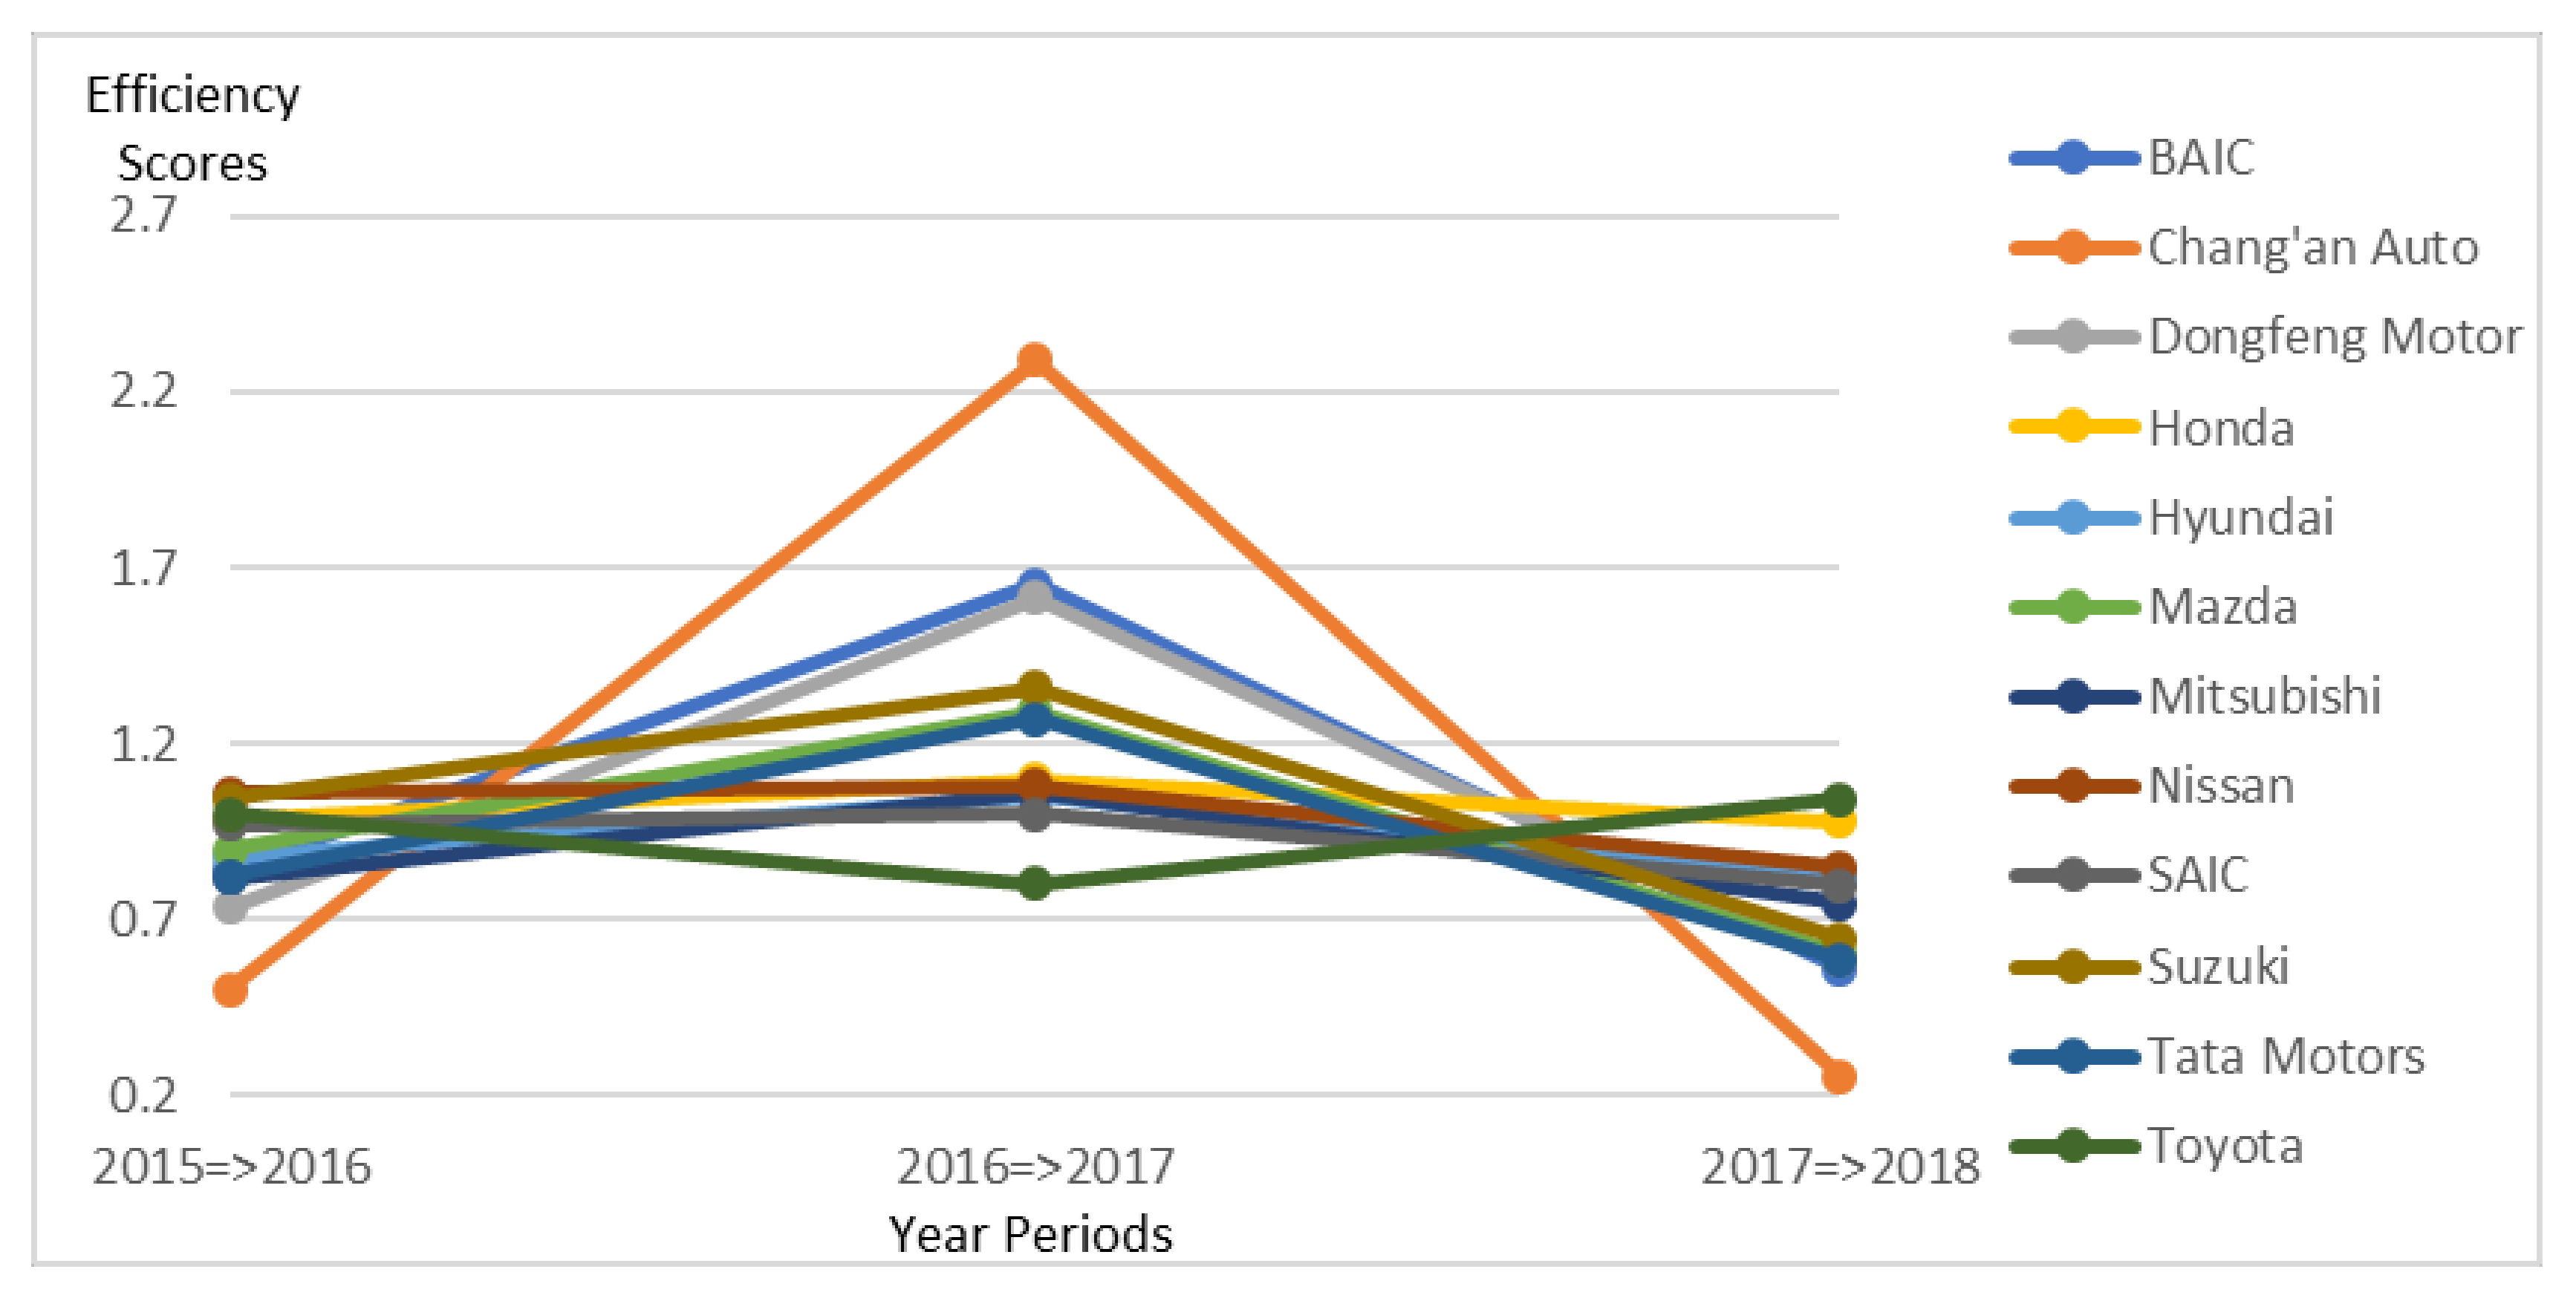
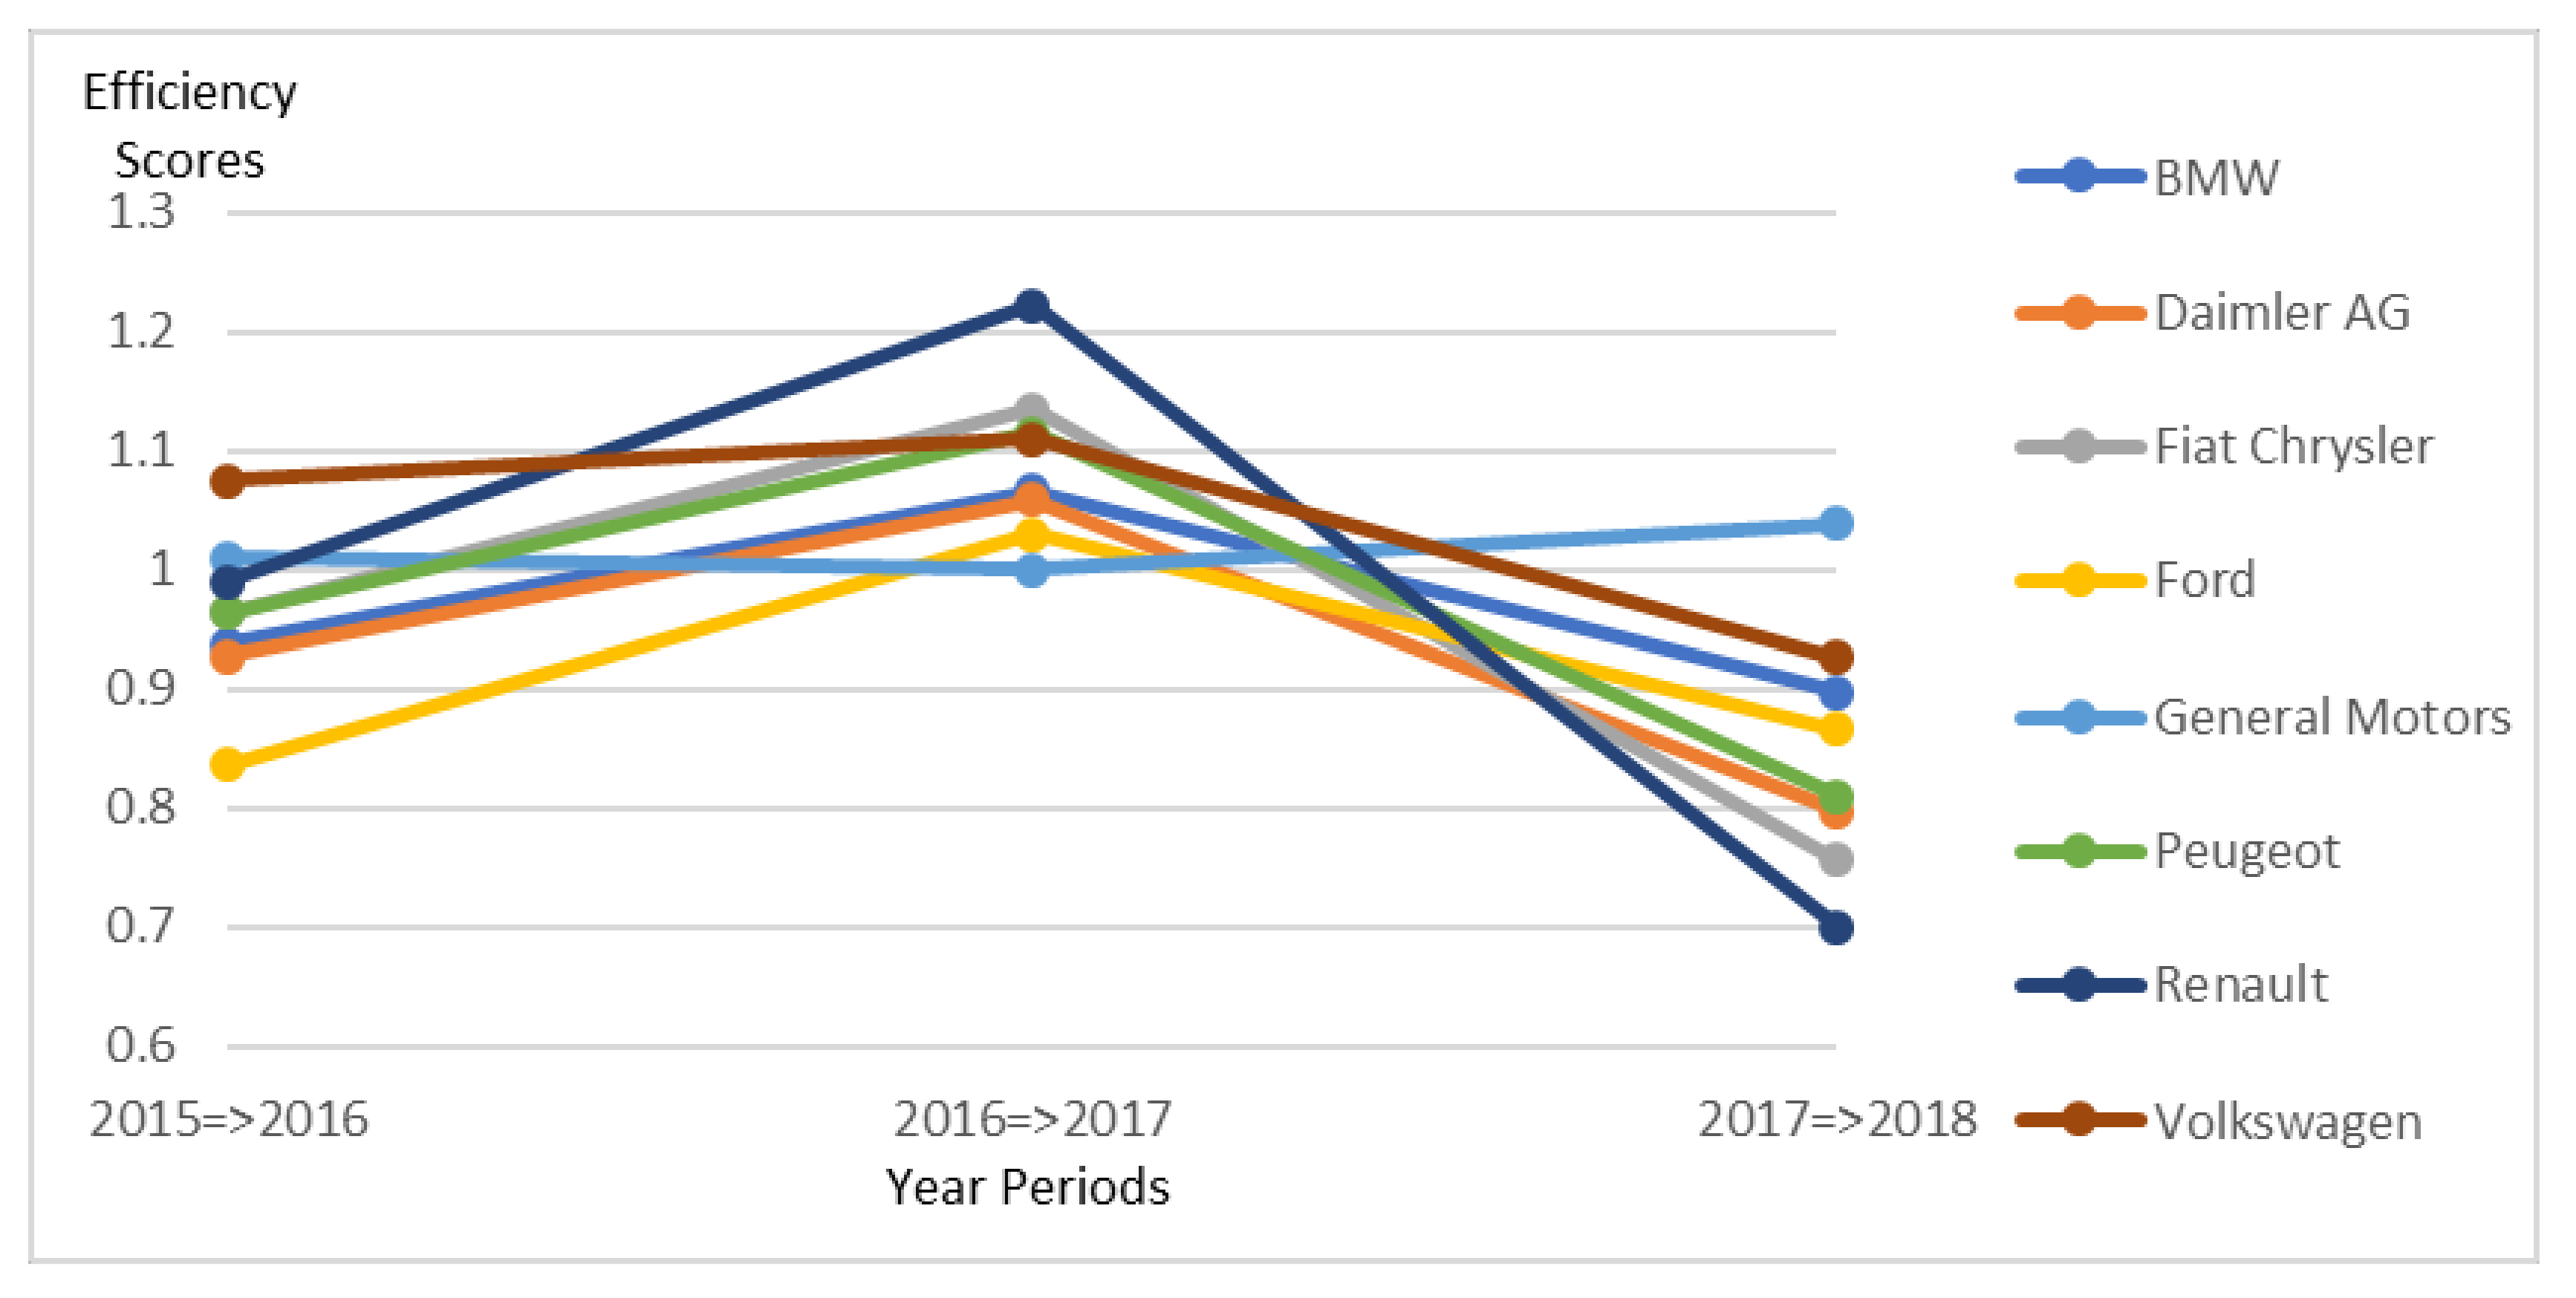
4.2. Catch-Up Index (Technical Efficiency)
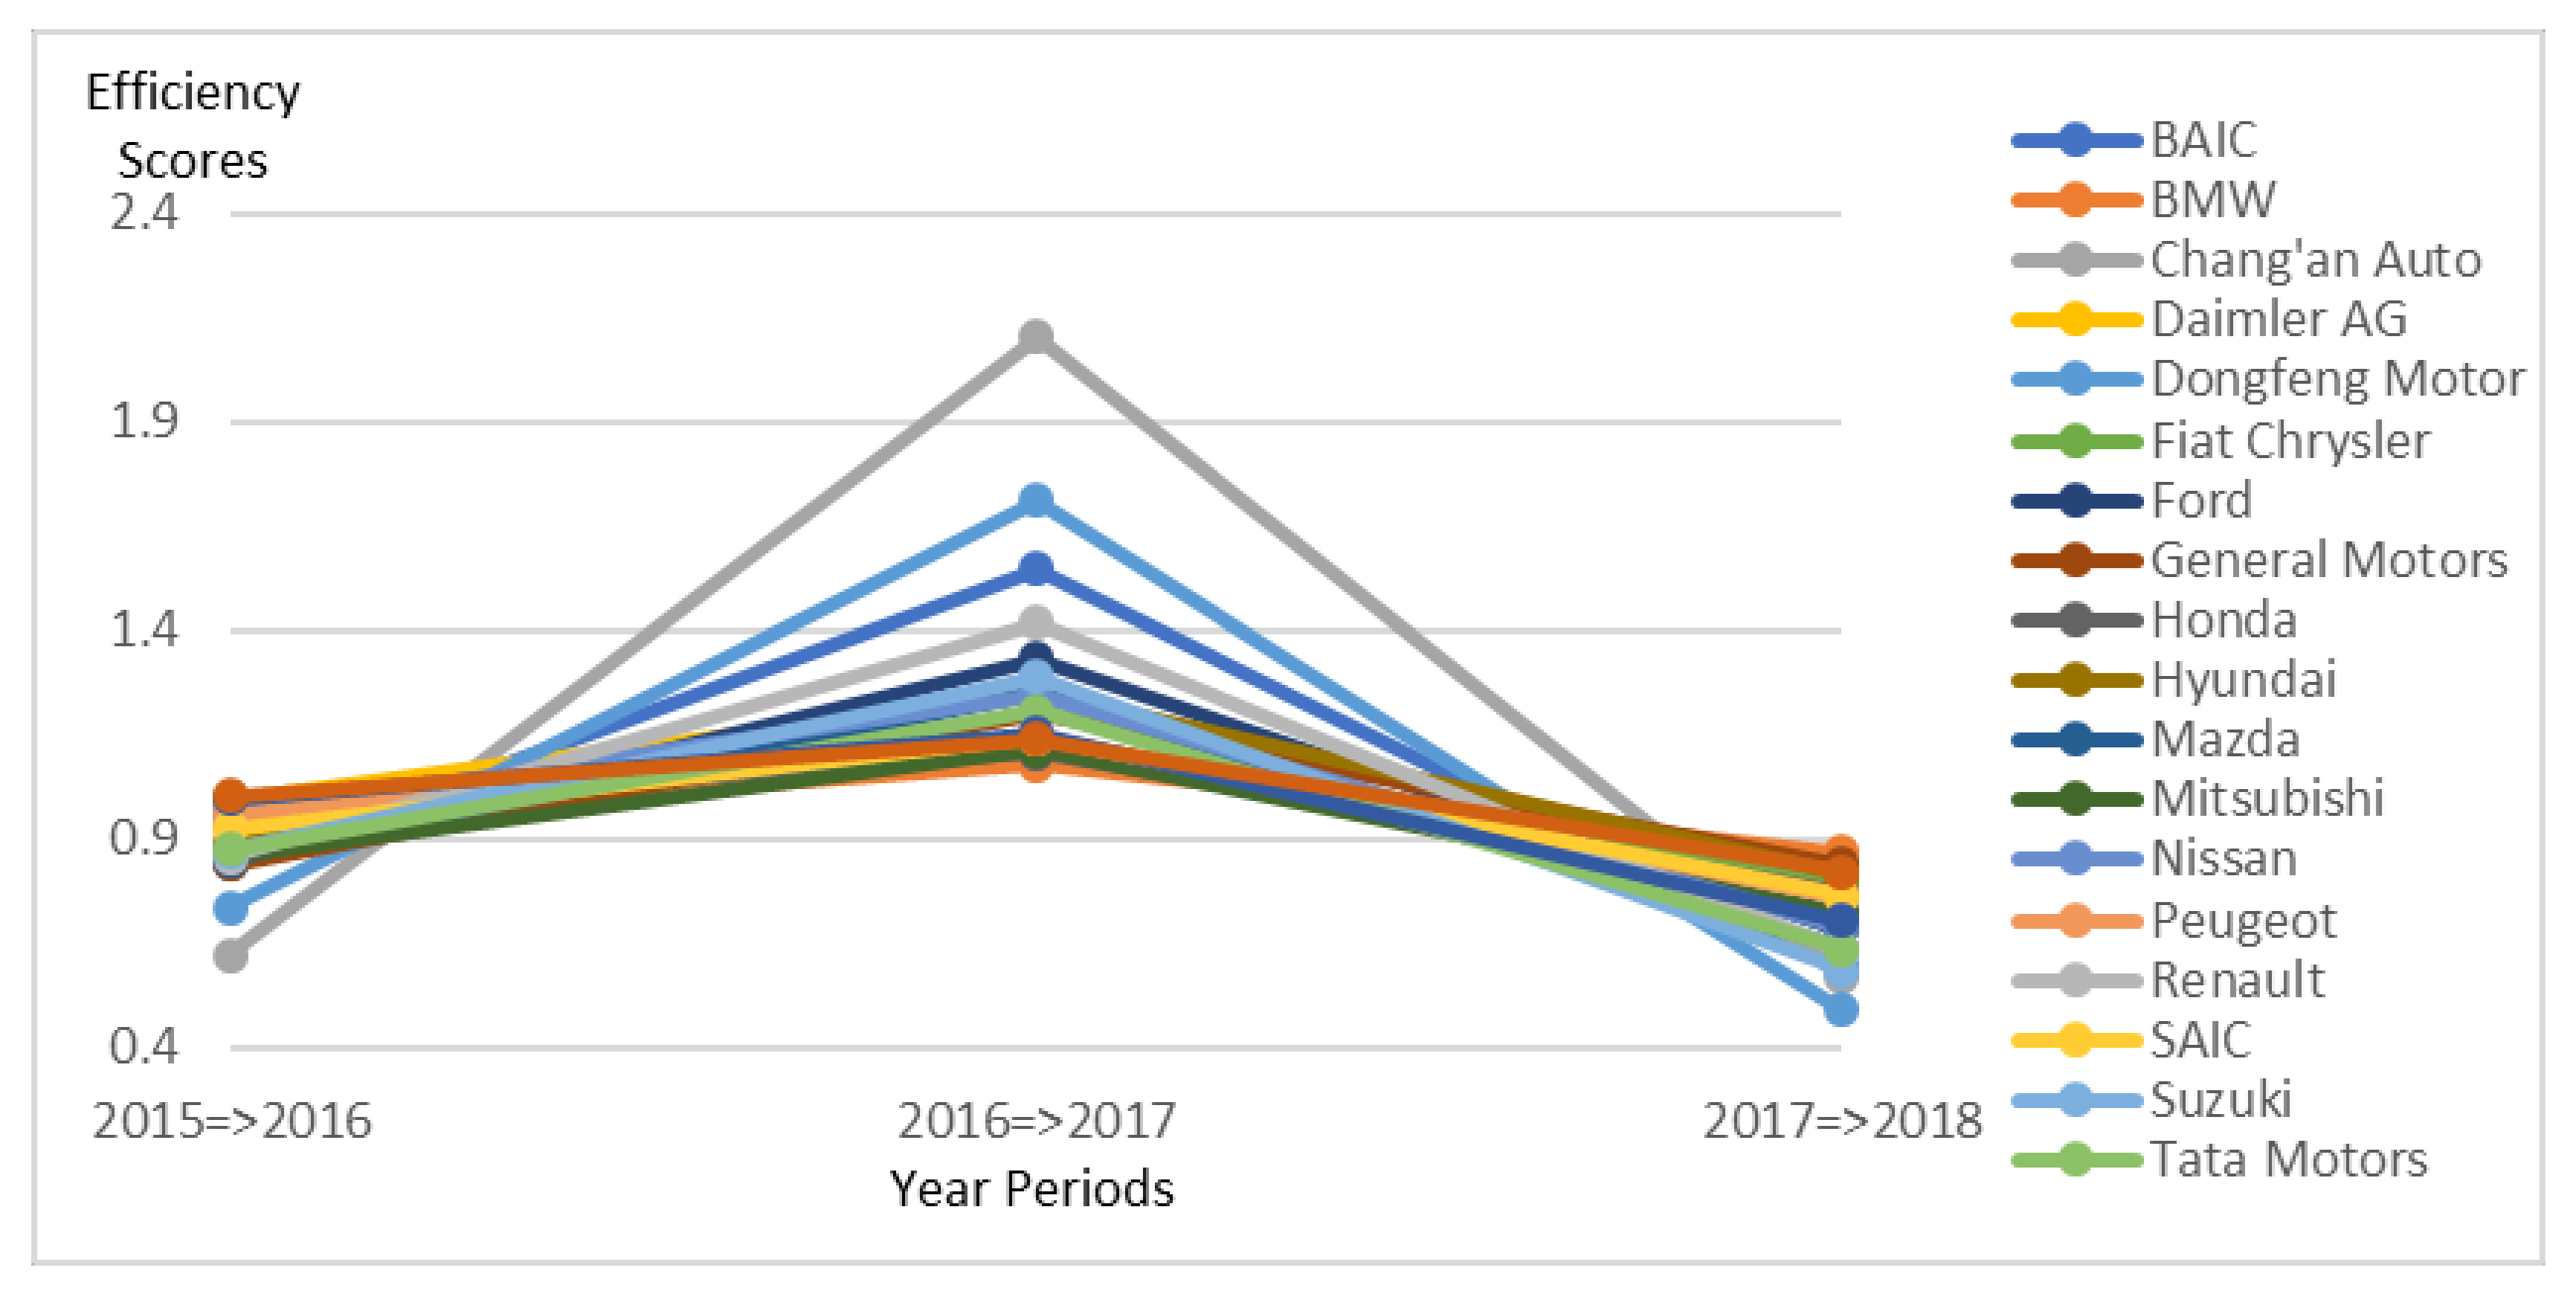
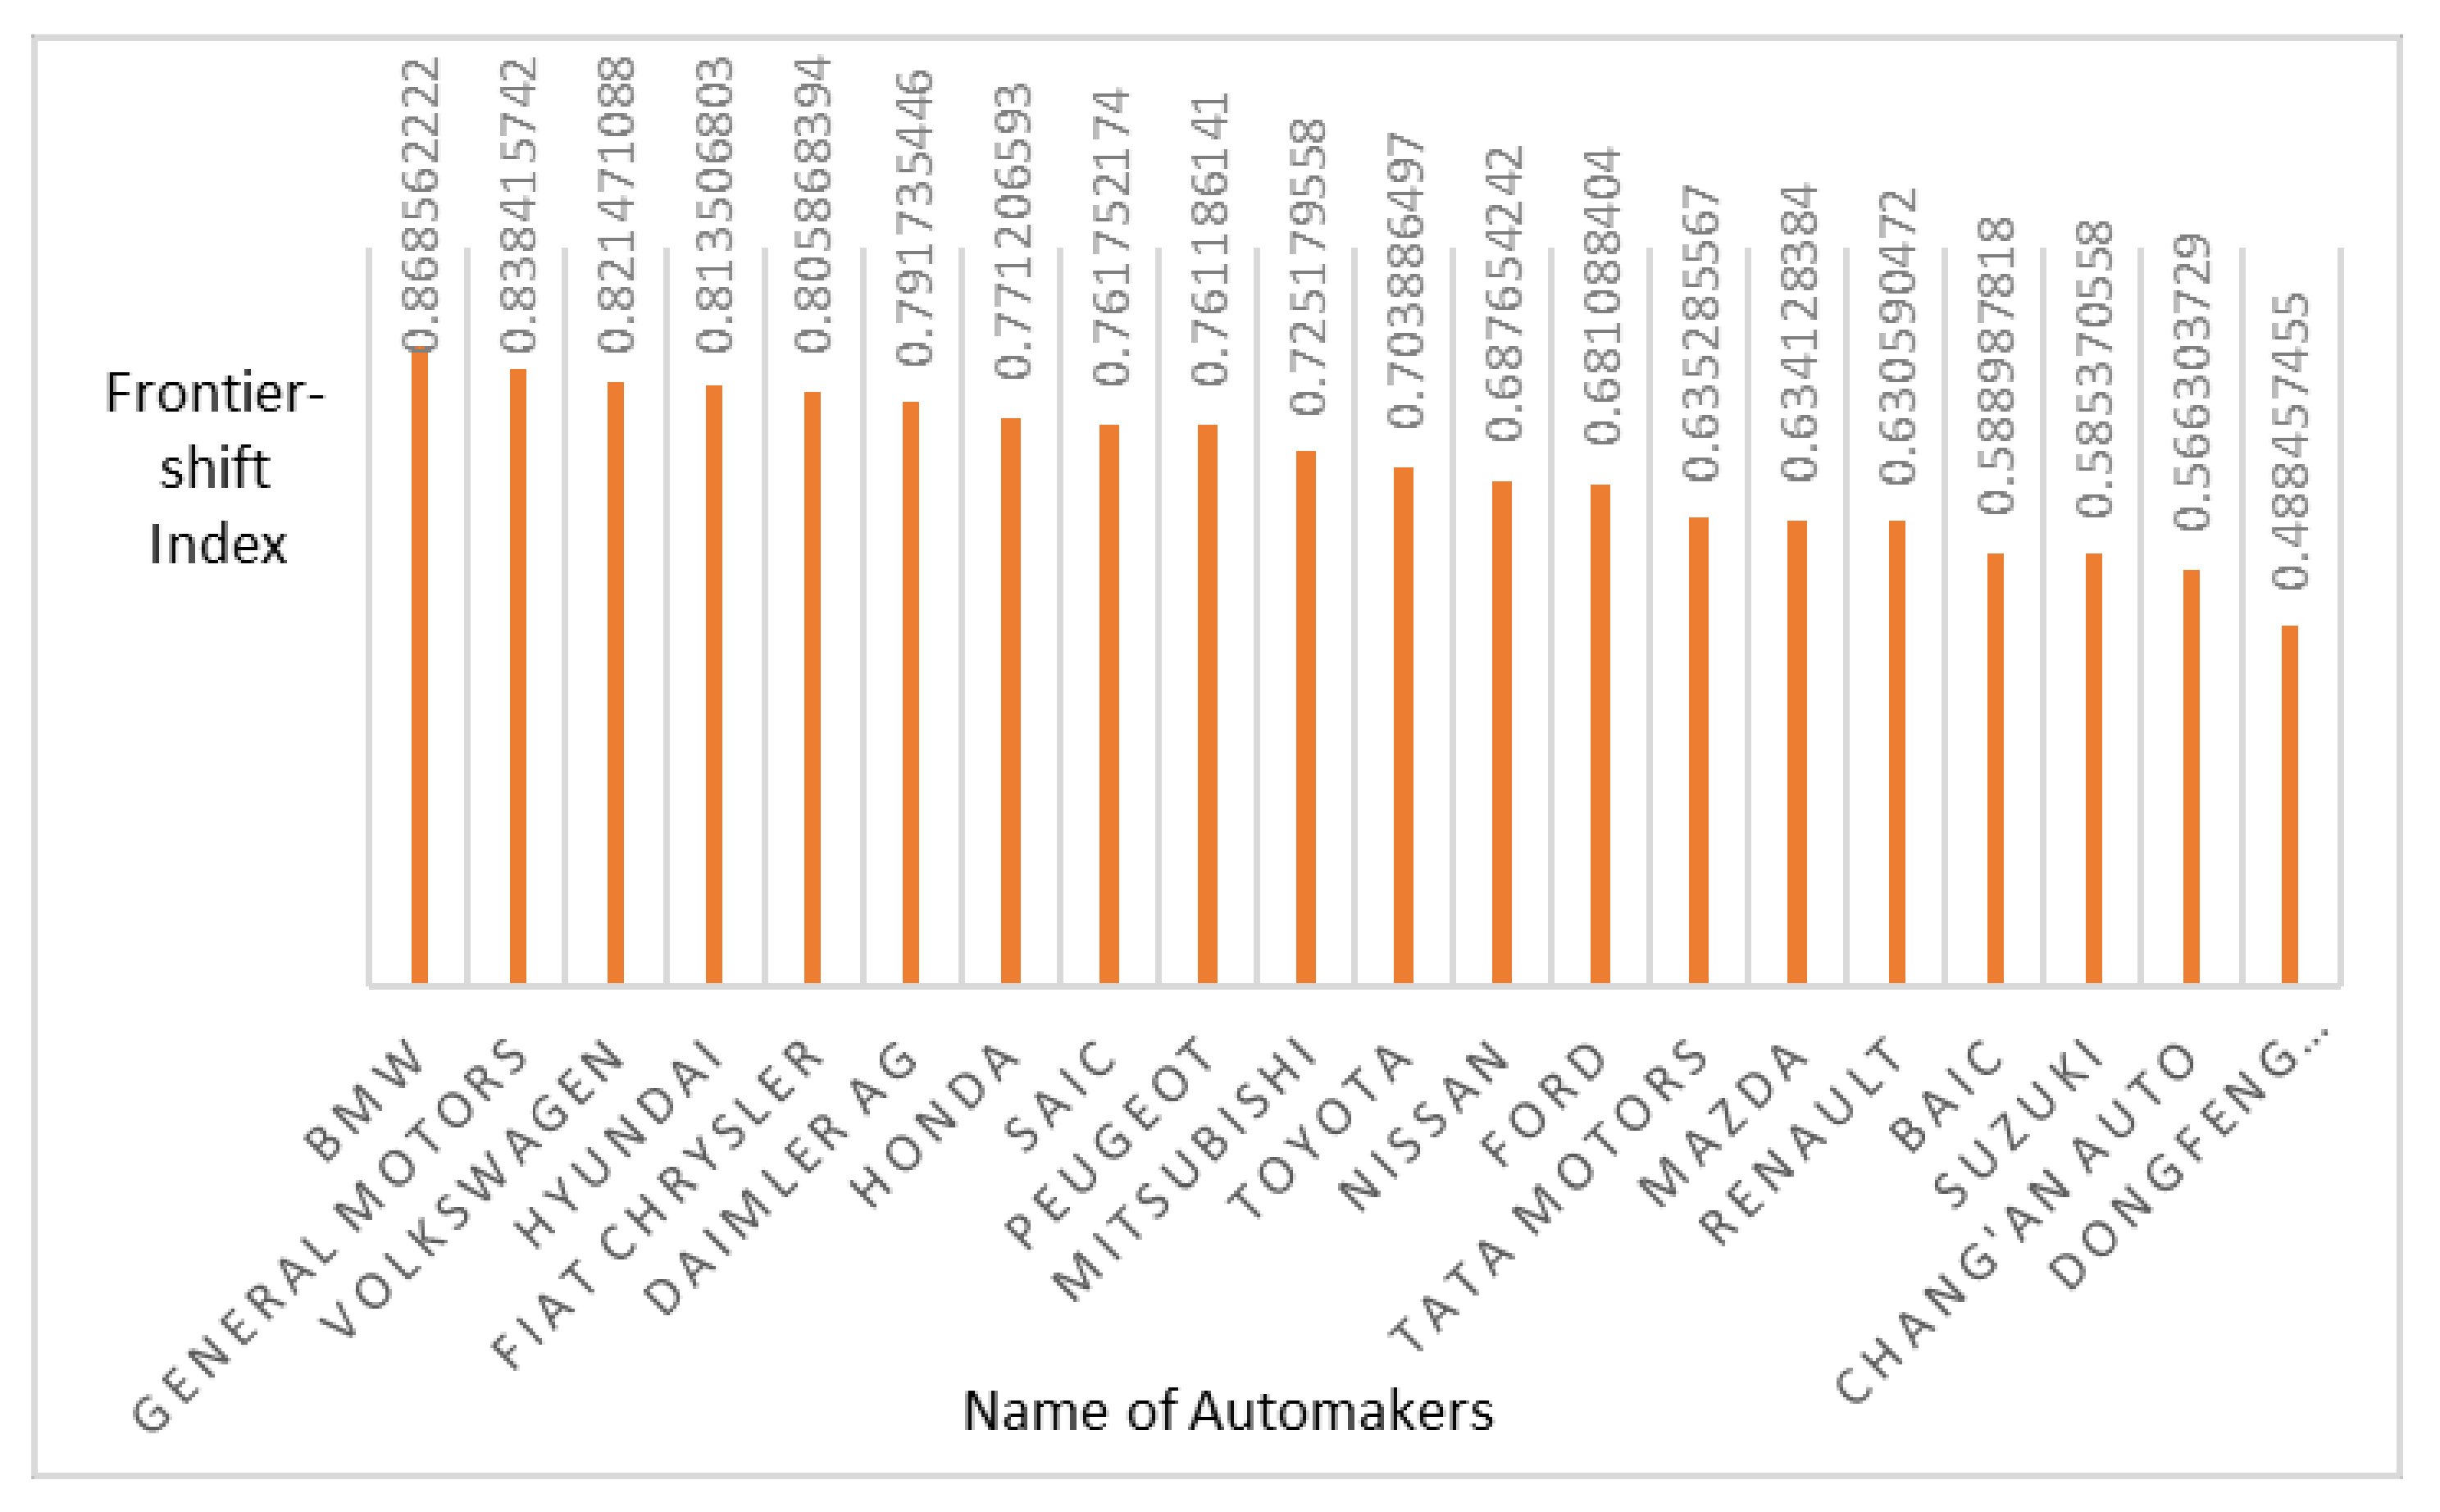
4.3. Frontier-Shift Index (Technological Change)
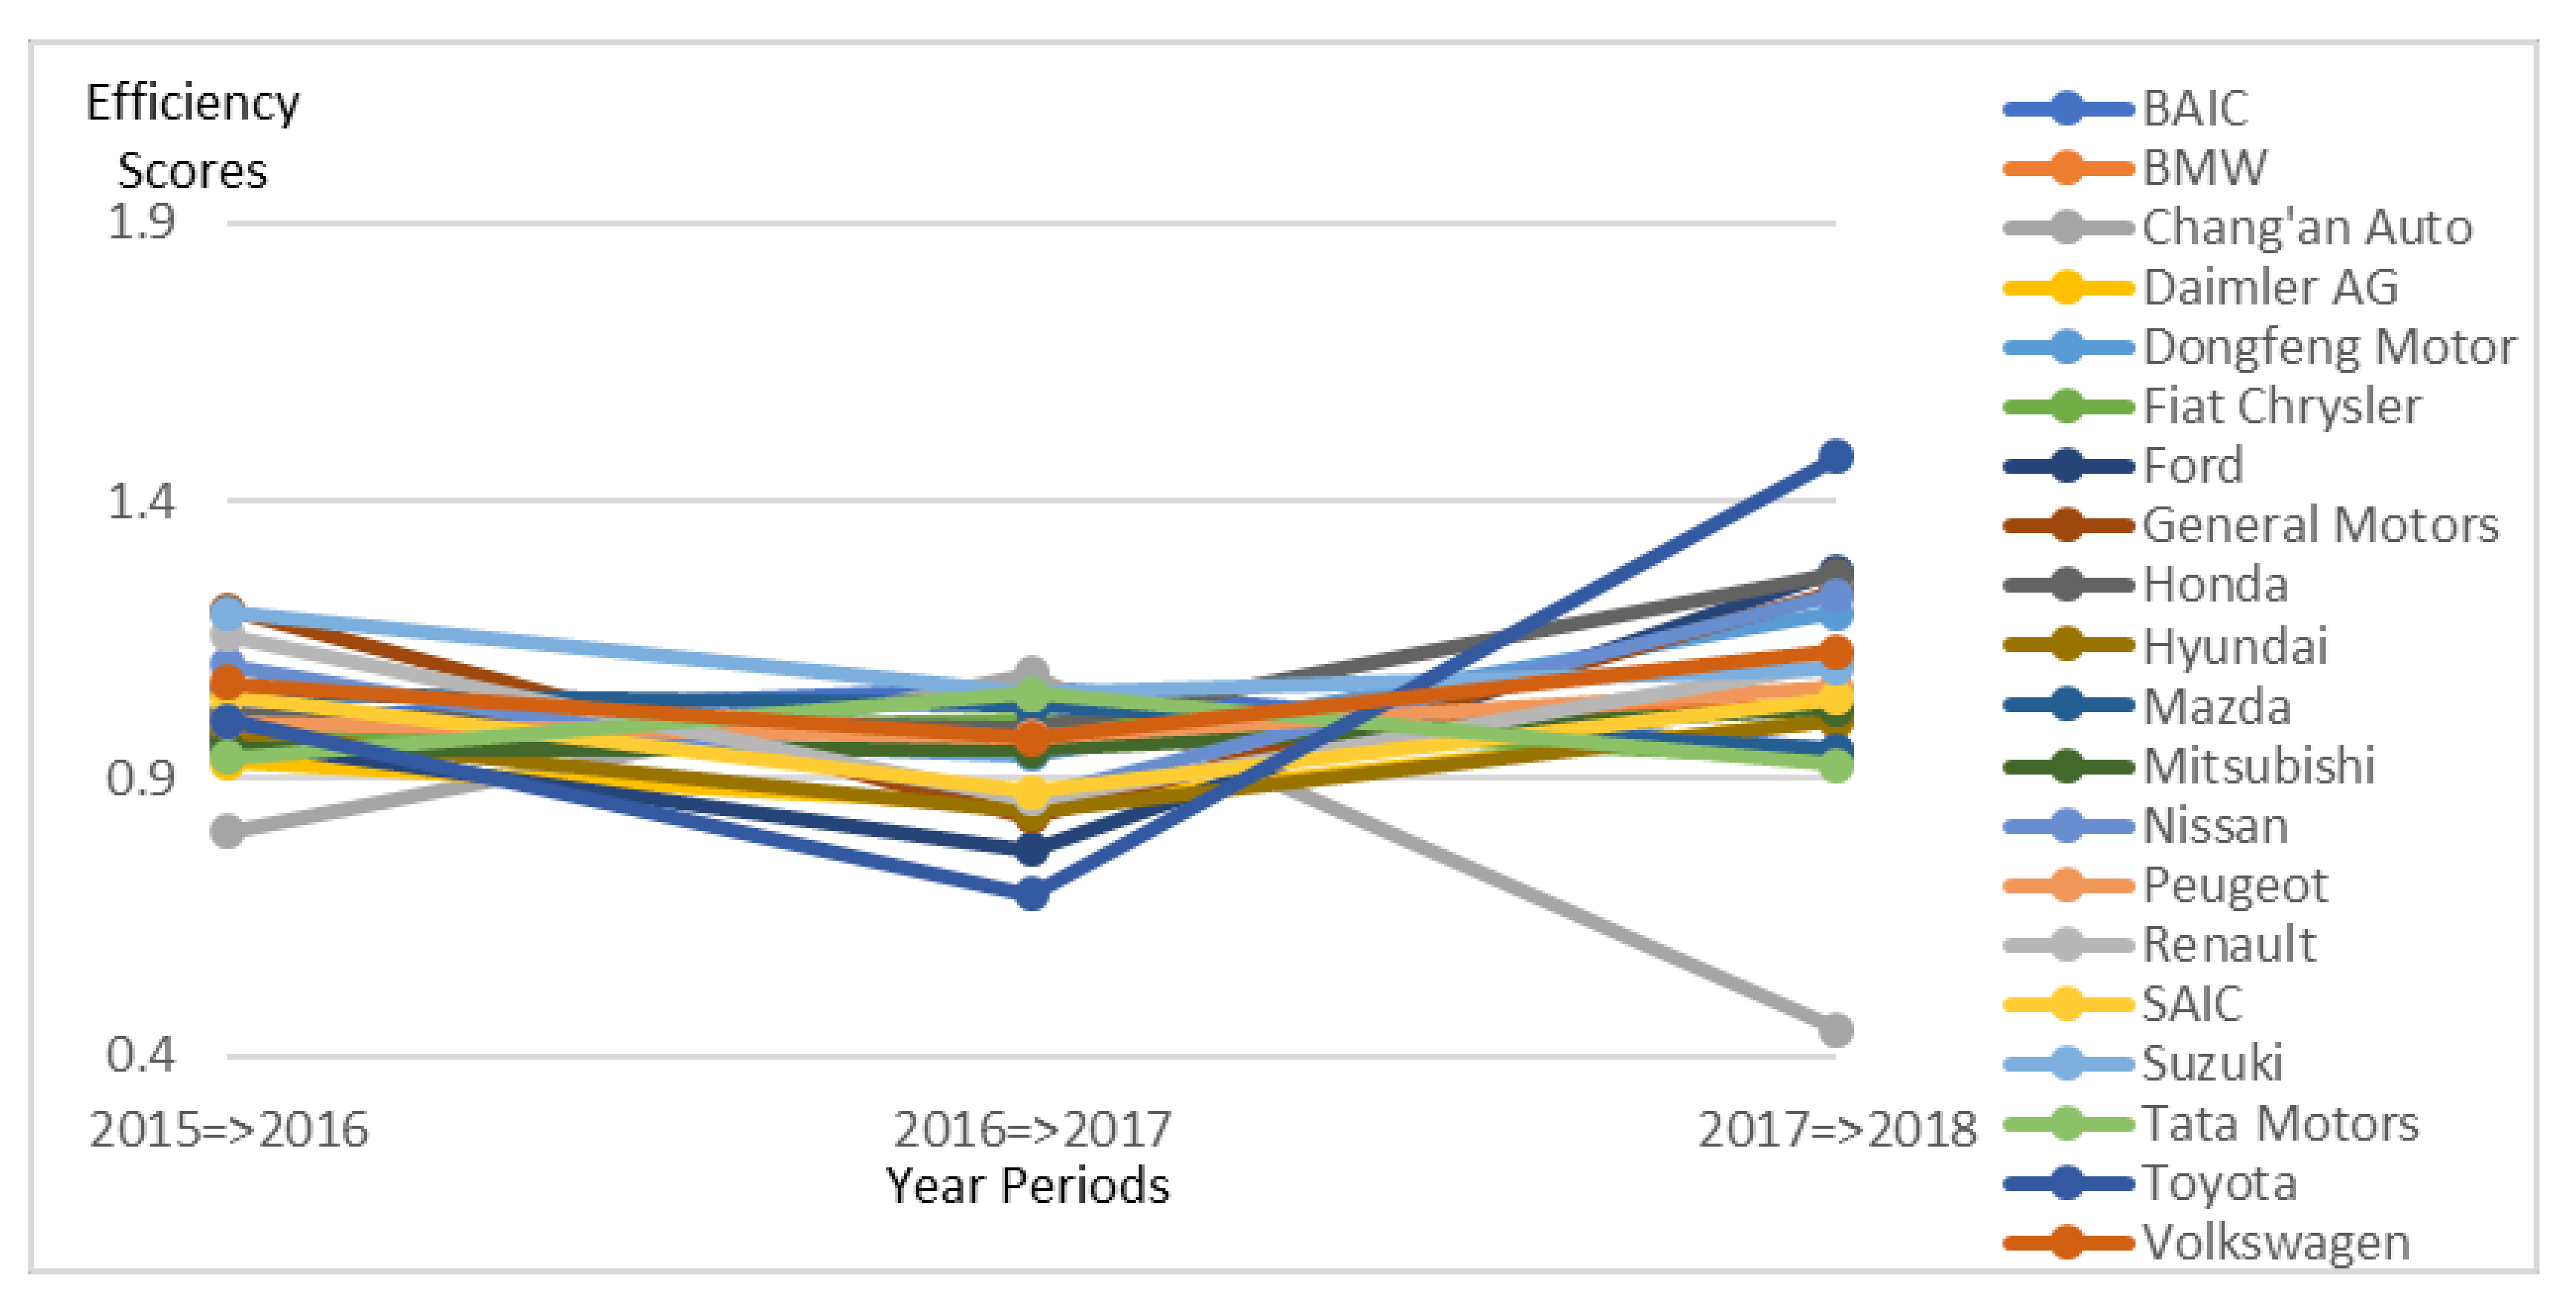
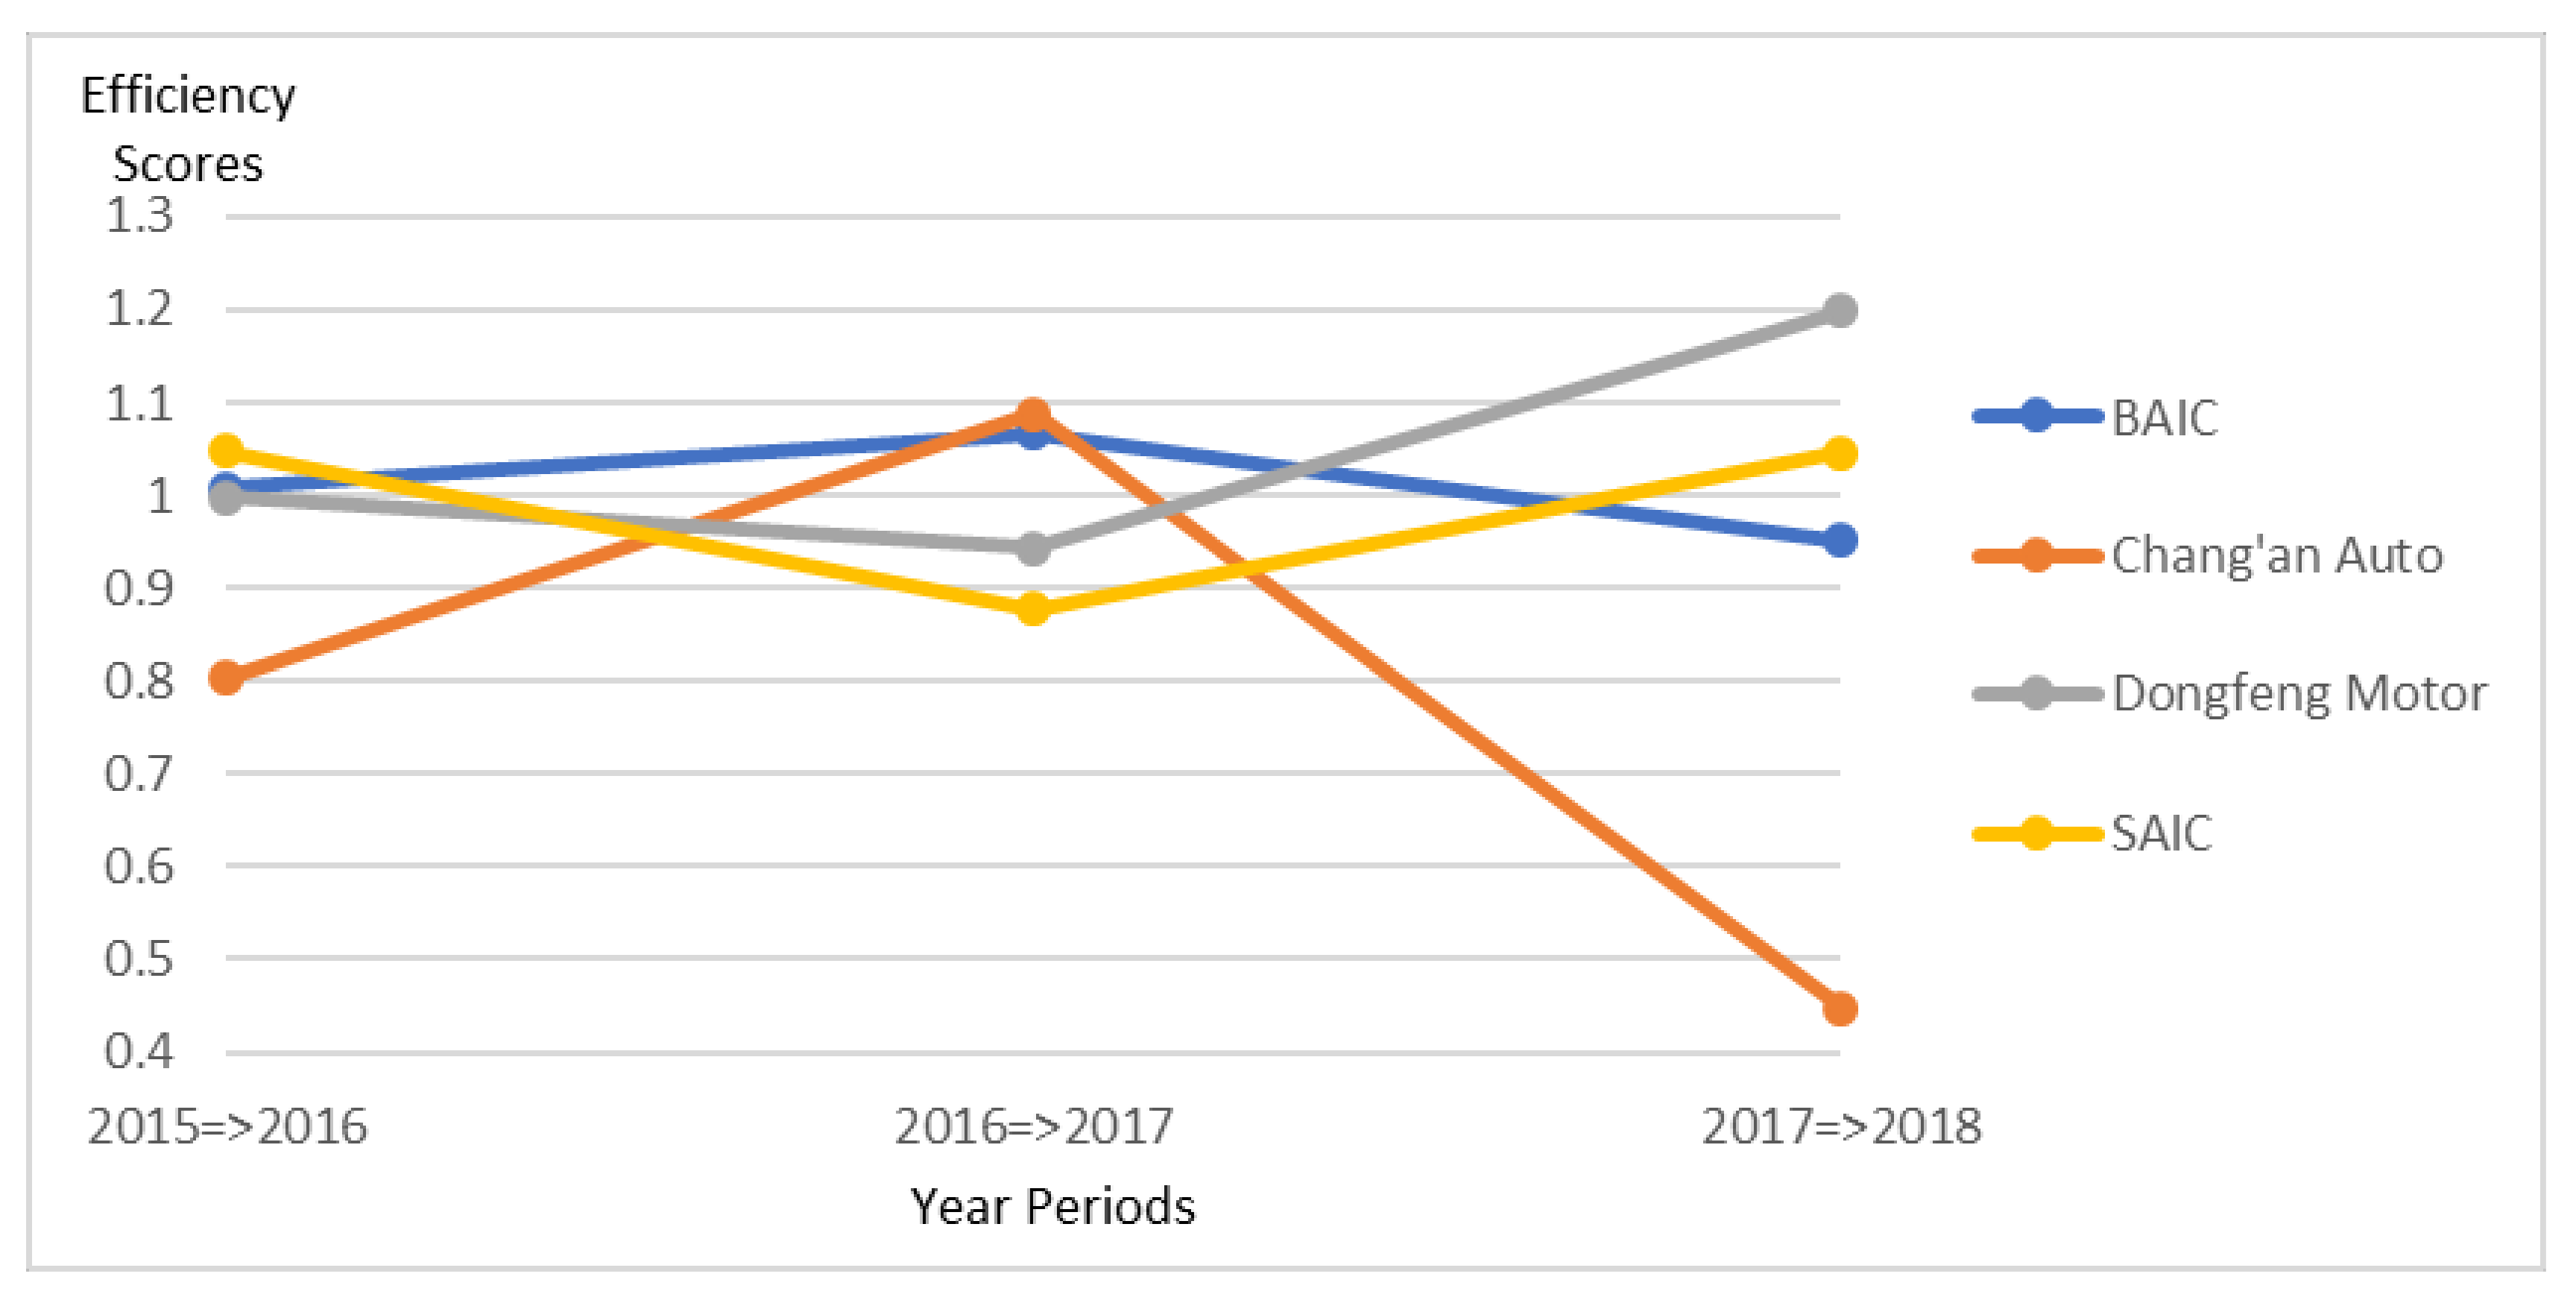
4.4. Malmquist Productivity Index (MPI)
5. Conclusions
Author Contributions
Funding
Acknowledgments
Conflicts of Interest
References
- Humphrey, J.; Memedovic, O. The global automotive industry value chain: What prospects for upgrading by developing countries. In UNIDO Sectorial Studies Series Working Paper; UNIDO: Vienna, Austria, 2003. [Google Scholar]
- Kallstrom, H. “Why the automotive industry generates employment”. Market Realist. 5 February 2015. Available online: https://marketrealist.com/2015/02/automotive-industry-generates-employment/ (accessed on 11 September 2019).
- Charnes, A.; Cooper, W.W.; Rhodes, E. Measuring the efficiency of decision making units. Eur. J. Oper. Res. 1978, 2, 429–444. [Google Scholar] [CrossRef]
- Martín, J.C.; Roman, C. An application of DEA to measure the efficiency of Spanish airports prior to privatization. J. Air Transp. Manag. 2001, 7, 149–157. [Google Scholar] [CrossRef]
- Kulshreshtha, M.; Parikh, J.K. Study of efficiency and productivity growth in opencast and underground coal mining in India: A DEA analysis. Energy Econ. 2002, 24, 439–453. [Google Scholar] [CrossRef]
- Leachman, C.; Pegels, C.C.; Shin, S.K. Manufacturing performance: Evaluation and determinants. Int. J. Oper. Prod. Manag. 2005, 25, 851–874. [Google Scholar] [CrossRef]
- Pilyavsky, A.; Staat, M. Efficiency and productivity change in Ukrainian health care. J. Product. Anal. 2008, 29, 143–154. [Google Scholar] [CrossRef]
- Wang, C.N.; Nguyen, N.T.; Tran, T.T. Integrated DEA models and grey system theory to evaluate past-to-future performance: A case of Indian electricity industry. Sci. World J. 2015, 2015, 638710. [Google Scholar] [CrossRef]
- Chandraprakaikul, W.; Suebpongsakorn, A. Evaluation of logistics companies using data envelopment analysis. In Proceedings of the 2012 4th IEEE International Symposium on Logistics and Industrial Informatics, Smolenice, Slovakia, 5–7 September 2012; pp. 81–86. [Google Scholar]
- Yuan, L.N.; Tian, L.N. A new DEA model on science and technology resources of industrial enterprises. In Proceedings of the 2012 International Conference on Machine Learning and Cybernetics, Xian, China, 15–17 July 2012; Volume 3, pp. 986–990. [Google Scholar]
- Ren, J.; Tan, S.; Dong, L.; Mazzi, A.; Scipioni, A.; Sovacool, B.K. Determining the life cycle energy efficiency of six biofuel systems in China: A Data Envelopment Analysis. Bioresour. Technol. 2014, 162, 1–7. [Google Scholar] [CrossRef]
- Chang, Y.T.; Zhang, N.; Danao, D.; Zhang, N. Environmental efficiency analysis of transportation system in China: A non-radial DEA approach. Energy Policy 2013, 58, 277–283. [Google Scholar] [CrossRef]
- Bjurek, H. The Malmquist total factor productivity index. Scand. J. Econ. 1996, 98, 303–313. [Google Scholar] [CrossRef]
- Fuentes, R.; Lillo-Bañuls, A. Smoothed bootstrap Malmquist index based on DEA model to compute productivity of tax offices. Expert Syst. Appl. 2015, 42, 2442–2450. [Google Scholar] [CrossRef]
- Färe, R.; Grosskopf, S.; Norris, M.; Zhang, Z. Productivity growth, technical progress, and efficiency change in industrialized countries. Am. Econ. Rev. 1994, 84, 66–83. [Google Scholar]
- Fulginiti, L.E.; Perrin, R.K. LDC agriculture: Nonparametric Malmquist productivity indexes. J. Dev. Econ. 1997, 53, 373–390. [Google Scholar] [CrossRef]
- Odeck, J. Assessing the relative efficiency and productivity growth of vehicle inspection services: An application of DEA and Malmquist indices. Eur. J. Oper. Res. 2000, 126, 501–514. [Google Scholar] [CrossRef]
- Chen, Y. A non-radial Malmquist productivity index with an illustrative application to Chinese major industries. Int. J. Prod. Econ. 2003, 83, 27–35. [Google Scholar] [CrossRef]
- Sharma, S. A study on Productivity Performance of Indian Automobile Industry: Growth Accounting Analysis. 2006. Available online: https://pdfs.semanticscholar.org/a5cb/4cc8dd07746b84cc3204551d7741d84f9af8.pdf/ (accessed on 15 September 2019).
- Liu, F.H.F.; Wang, P.H. DEA Malmquist productivity measure: Taiwanese semiconductor companies. Int. J. Prod. Econ. 2008, 112, 367–379. [Google Scholar] [CrossRef]
- Mazumdar, M.; Rajeev, M. A Comparative Analysis of Efficiency and Productivity of the Indian Pharmaceutical Firms: A Malmquist-Meta-Frontier Approach; Institute for Social and Economic Change: Bangalore, India, 2009. [Google Scholar]
- Wang, C.N.; Chang, Y.L.; Huang, Q.H.; Wang, C.H. Assessment on intellectual capital management for Taiwanese pharmaceutical industry: Using GRA and MPI. Afr. J. Bus. Manag. 2011, 5, 2950. [Google Scholar]
- Chang, H.; Choy, H.L.; Cooper, W.W.; Ruefli, T.W. Using Malmquist Indexes to measure changes in the productivity and efficiency of US accounting firms before and after the Sarbanes–Oxley Act. Omega 2009, 37, 951–960. [Google Scholar] [CrossRef]
- OICA. Available online: http://www.oica.net/wp-content/uploads/ranking2015.pdf/ (accessed on 15 September 2019).
- Morningstar. Available online: https://www.morningstar.com/ (accessed on 18 September 2019).
- Wang, J. Pearson correlation coefficient. In Encyclopedia of Systems Biology; Springer: New York, NY, USA, 2013; p. 1671. [Google Scholar]
- Imran, M.; Jian, Z.; Urbański, M.; Nair, S.L.S. Determinants of firm’s export performance in China’s automobile industry. Sustainability 2018, 10, 4078. [Google Scholar] [CrossRef]
- Fathali, A. Examining the impact of competitive strategies on corporate innovation: An empirical study in automobile industry. Int. J. Asian Soc. Sci. 2016, 6, 135–145. [Google Scholar] [CrossRef]
- Wang, C.N.; Nguyen, X.T.; Wang, Y.H. Automobile industry strategic alliance partner selection: The application of a hybrid DEA and grey theory model. Sustainability 2016, 8, 173. [Google Scholar] [CrossRef]
- Eilert, M.; Jayachandran, S.; Kalaignanam, K.; Swartz, T.A. Does it pay to recall your product early? An empirical investigation in the automobile industry. J. Mark. 2017, 81, 111–129. [Google Scholar] [CrossRef]
- Hashmi, A.R.; Biesebroeck, J.V. The relationship between market structure and innovation in industry equilibrium: A case study of the global automobile industry. Rev. Econ. Stat. 2016, 98, 192–208. [Google Scholar] [CrossRef]


| DMUs | Automakers | Headquarters | Production in 2015 (Cars) | Rank by Productions in 2015 |
|---|---|---|---|---|
| D1 | BAIC | Beijing, China | 1,169,894 | 19 |
| D2 | BMW | München, Germany | 2,279,503 | 12 |
| D3 | Chang’an Auto | Chongqing, China | 1,540,133 | 16 |
| D4 | Daimler AG | Stuttgart, Germany | 2,134,645 | 14 |
| D5 | Dongfeng Motor | Wuhan, Hubei, China | 1,209,296 | 18 |
| D6 | Fiat Chrysler | Amsterdam, Netherlands | 4,865,233 | 7 |
| D7 | Ford | Michigan, US | 6,396,369 | 5 |
| D8 | General Motors | Michigan, US | 7,485,587 | 4 |
| D9 | Honda | Tokyo, Japan | 4,543,838 | 8 |
| D10 | Hyundai | Seoul, South Korea | 7,988,479 | 3 |
| D11 | Mazda | Hiroshima, Japan | 1,540,576 | 15 |
| D12 | Mitsubishi | Tokyo, Japan | 1,218,853 | 17 |
| D13 | Nissan | Yokohama, Japan | 5,170,074 | 6 |
| D14 | Peugeot | Sochaux, France | 2,982,035 | 11 |
| D15 | Renault | Boulogne, France | 3,032,652 | 10 |
| D16 | SAIC | Shanghai, China | 2,260,579 | 13 |
| D17 | Suzuki | Hamamatsu, Japan | 3,034,081 | 9 |
| D18 | Tata Motors | Mumbai, India | 1,009,369 | 20 |
| D19 | Toyota | Aichi, Japan | 10,083,831 | 1 |
| D20 | Volkswagen | Wolfsburg, Germany | 9,872,424 | 2 |
| Year | Statistics | TA | EQ | CR | OE | RE | NI |
|---|---|---|---|---|---|---|---|
| 2015 | Max | 433,120 | 152,342 | 201,230 | 39,429 | 247,137 | 21,259 |
| Min | 13,412.1 | 5157.75 | 8011.05 | 1491.45 | 10,015.8 | 1.000 | |
| Ave. | 134,650.3 | 36,800.74 | 75,644.54 | 12,096.33 | 92,420.68 | 5748.965 | |
| SD | 123,220.5 | 36,012.59 | 58,281.8 | 9110.951 | 70,048.78 | 4687.882 | |
| 2016 | Max | 459,637 | 151,968 | 205,131 | 36,648 | 257,741 | 20,986 |
| Min | 13,010 | 6024 | 9673.2 | 1522.8 | 11,781.3 | 658 | |
| Ave. | 142,609.1 | 38,525.88 | 78,302.2 | 13,096.46 | 97,175.87 | 4616.053 | |
| SD | 129,059.5 | 36,322.72 | 58,893.88 | 9264.601 | 72,236.68 | 4603.454 | |
| 2017 | Max | 473,616 | 158,936 | 211,055 | 32,643 | 258,779 | 20,481 |
| Min | 13,470 | 6125.4 | 10,404.45 | 1539.3 | 12,001.8 | 1.000 | |
| Ave. | 148,300.6 | 41,408.17 | 80,085.3 | 12,902.93 | 99,035.85 | 8459.098 | |
| SD | 132,444.6 | 39,474.08 | 60,039.49 | 8548.417 | 72,817.91 | 5008.035 | |
| 2018 | Max | 513,959 | 170,017 | 216,779 | 35,803 | 266,601 | 22,631 |
| Min | 14,023.35 | 6936.75 | 8487.45 | 1302.3 | 9944.7 | 102.15 | |
| Ave. | 156,200.6 | 44,524.12 | 83,214.39 | 13,574.66 | 102,395.2 | 5283.818 | |
| SD | 140,497.7 | 41,682.19 | 61,858.42 | 9347.215 | 75,298.09 | 5322.953 |
| Factors | TA | EQ | CR | OE | RE | NI |
|---|---|---|---|---|---|---|
| 2015 | ||||||
| Total Assets | 1.0000 | 0.9256 | 0.9556 | 0.9017 | 0.9666 | 0.6036 |
| Equity | 0.9256 | 1.0000 | 0.8440 | 0.7933 | 0.8670 | 0.6986 |
| Cost of Revenue | 0.9556 | 0.8440 | 1.0000 | 0.9070 | 0.9972 | 0.5770 |
| Operating Expenses | 0.9017 | 0.7933 | 0.9070 | 1.0000 | 0.9165 | 0.3494 |
| Revenue | 0.9666 | 0.8670 | 0.9972 | 0.9165 | 1.0000 | 0.6034 |
| Net Income | 0.6036 | 0.6986 | 0.5770 | 0.3494 | 0.6034 | 1.0000 |
| 2016 | ||||||
| Total Assets | 1.0000 | 0.9213 | 0.9507 | 0.9063 | 0.9583 | 0.7981 |
| Equity | 0.9213 | 1.0000 | 0.8626 | 0.8061 | 0.8783 | 0.8778 |
| Cost of Revenue | 0.9507 | 0.8626 | 1.0000 | 0.9227 | 0.9984 | 0.7835 |
| Operating Expenses | 0.9063 | 0.8061 | 0.9227 | 1.0000 | 0.9342 | 0.6172 |
| Revenue | 0.9583 | 0.8783 | 0.9984 | 0.9342 | 1.0000 | 0.7952 |
| Net Income | 0.7981 | 0.8778 | 0.7835 | 0.6172 | 0.7952 | 1.0000 |
| 2017 | ||||||
| Total Assets | 1.0000 | 0.9305 | 0.9554 | 0.9185 | 0.9610 | 0.8320 |
| Equity | 0.9305 | 1.0000 | 0.8736 | 0.8142 | 0.8785 | 0.8651 |
| Cost of Revenue | 0.9554 | 0.8736 | 1.0000 | 0.9374 | 0.9987 | 0.7928 |
| Operating Expenses | 0.9185 | 0.8142 | 0.9374 | 1.0000 | 0.9506 | 0.6963 |
| Revenue | 0.9610 | 0.8785 | 0.9987 | 0.9506 | 1.0000 | 0.7915 |
| Net Income | 0.8320 | 0.8651 | 0.7928 | 0.6963 | 0.7915 | 1.0000 |
| 2018 | ||||||
| Total Assets | 1.0000 | 0.9258 | 0.9476 | 0.9059 | 0.9551 | 0.8739 |
| Equity | 0.9258 | 1.0000 | 0.8748 | 0.8093 | 0.8866 | 0.9429 |
| Cost of Revenue | 0.9476 | 0.8748 | 1.0000 | 0.9341 | 0.9985 | 0.8730 |
| Operating Expenses | 0.9059 | 0.8093 | 0.9341 | 1.0000 | 0.9460 | 0.7973 |
| Revenue | 0.9551 | 0.8866 | 0.9985 | 0.9460 | 1.0000 | 0.8841 |
| Net Income | 0.8739 | 0.9429 | 0.8730 | 0.7973 | 0.8841 | 1.0000 |
| DMUs | Automaker | 2015 ≥ 2016 | 2016 ≥ 2017 | 2017 ≥ 2018 | Average |
|---|---|---|---|---|---|
| D1 | BAIC | 1.007906519 | 1.067588827 | 0.951099081 | 1.008864809 |
| D2 | BMW | 1.002200700 | 0.989942896 | 1.032516308 | 1.008219968 |
| D3 | Chang’an Auto | 0.802806822 | 1.088698475 | 0.447817244 | 0.779774180 |
| D4 | Daimler AG | 0.930637488 | 0.851411104 | 1.006351466 | 0.929466686 |
| D5 | Dongfeng Motor | 0.997491449 | 0.942585562 | 1.198699708 | 1.046258907 |
| D6 | Fiat Chrysler | 0.974202762 | 1.003801147 | 0.93822297 | 0.972075626 |
| D7 | Ford | 0.969533267 | 0.772186068 | 1.272174794 | 1.004631376 |
| D8 | General Motors | 1.203162859 | 0.831481843 | 1.238505175 | 1.091049959 |
| D9 | Honda | 1.017930963 | 0.991968224 | 1.268988397 | 1.092962528 |
| D10 | Hyundai | 0.985207492 | 0.839423806 | 1.003855082 | 0.942828794 |
| D11 | Mazda | 1.056287293 | 1.032101748 | 0.951842778 | 1.013410606 |
| D12 | Mitsubishi | 0.952867583 | 0.951779377 | 1.027294947 | 0.977313969 |
| D13 | Nissan | 1.103923082 | 0.869170202 | 1.230991107 | 1.06802813 |
| D14 | Peugeot | 1.002611318 | 0.97492581 | 1.064404376 | 1.013980502 |
| D15 | Renault | 1.157947517 | 0.863096113 | 1.109919469 | 1.043654366 |
| D16 | SAIC | 1.048487305 | 0.876499742 | 1.046332557 | 0.990439868 |
| D17 | Suzuki | 1.197202876 | 1.053332401 | 1.097676298 | 1.116070525 |
| D18 | Tata Motors | 0.939140968 | 1.053801742 | 0.923920449 | 0.972287719 |
| D19 | Toyota | 1.004901805 | 0.692280752 | 1.479811835 | 1.058998131 |
| D20 | Volkswagen | 1.07190144 | 0.974113 | 1.12718749 | 1.057733977 |
| Average | 1.021317575 | 0.936009442 | 1.070880577 | 1.009402531 | |
| Max | 1.203162859 | 1.088698475 | 1.479811835 | 1.116070525 | |
| Min | 0.802806822 | 0.692280752 | 0.447817244 | 0.77977418 |
| DMUs | Automaker | 2015 ≥ 2016 | 2016 ≥ 2017 | 2017 ≥ 2018 | Average |
|---|---|---|---|---|---|
| D1 | BAIC | 0.836805193 | 1.546229001 | 0.588987818 | 0.990674 |
| D2 | BMW | 0.934837626 | 1.076482507 | 0.868562222 | 0.9599608 |
| D3 | Chang’an Auto | 0.620779568 | 2.104430625 | 0.566303729 | 1.0971713 |
| D4 | Daimler AG | 0.996127981 | 1.243645099 | 0.791735446 | 1.0105028 |
| D5 | Dongfeng Motor | 0.733741954 | 1.711266889 | 0.488457455 | 0.9778221 |
| D6 | Fiat Chrysler | 0.98892349 | 1.130289028 | 0.805868394 | 0.975027 |
| D7 | Ford | 0.861670304 | 1.333023477 | 0.681088404 | 0.9585941 |
| D8 | General Motors | 0.838888086 | 1.202999181 | 0.838415742 | 0.960101 |
| D9 | Honda | 0.967083237 | 1.106332753 | 0.771206593 | 0.9482075 |
| D10 | Hyundai | 0.892240838 | 1.249043339 | 0.813506803 | 0.9849303 |
| D11 | Mazda | 0.850399789 | 1.2533984 | 0.634128384 | 0.9126422 |
| D12 | Mitsubishi | 0.859881874 | 1.112169071 | 0.725179558 | 0.8990768 |
| D13 | Nissan | 0.959916617 | 1.241455916 | 0.687654242 | 0.9630089 |
| D14 | Peugeot | 0.961643757 | 1.14347053 | 0.761186141 | 0.9554335 |
| D15 | Renault | 0.855171144 | 1.416545764 | 0.630590472 | 0.9674358 |
| D16 | SAIC | 0.925493158 | 1.141159707 | 0.761752174 | 0.9428017 |
| D17 | Suzuki | 0.87126208 | 1.28910142 | 0.585370558 | 0.9152447 |
| D18 | Tata Motors | 0.873868983 | 1.205930386 | 0.635285567 | 0.9050283 |
| D19 | Toyota | 0.996099676 | 1.154084768 | 0.703886497 | 0.951357 |
| D20 | Volkswagen | 1.003309415 | 1.139756648 | 0.821471088 | 0.9881791 |
| Average | 0.891407239 | 1.290040725 | 0.708031865 | 0.9631599 | |
| Max | 1.003309415 | 2.104430625 | 0.868562222 | 1.0971713 | |
| Min | 0.620779568 | 1.076482507 | 0.488457455 | 0.8990768 |
| DMUs | Automaker | 2015 ≥ 2016 | 2016 ≥ 2017 | 2017 ≥ 2018 | Average |
|---|---|---|---|---|---|
| D1 | BAIC | 0.84342141 | 1.650736804 | 0.560185773 | 1.0181147 |
| D2 | BMW | 0.936894924 | 1.06565621 | 0.896804659 | 0.9664519 |
| D3 | Chang’an Auto | 0.498366072 | 2.291090413 | 0.253600576 | 1.0143524 |
| D4 | Daimler AG | 0.927034042 | 1.058853247 | 0.796764127 | 0.9275505 |
| D5 | Dongfeng Motor | 0.731901325 | 1.613015462 | 0.585513808 | 0.9768102 |
| D6 | Fiat Chrysler | 0.963411995 | 1.134585423 | 0.756084238 | 0.9513606 |
| D7 | Ford | 0.835418025 | 1.029342158 | 0.8664635 | 0.9104079 |
| D8 | General Motors | 1.009318988 | 1.000271976 | 1.038382236 | 1.0159911 |
| D9 | Honda | 0.984423971 | 1.097446936 | 0.978652219 | 1.0201744 |
| D10 | Hyundai | 0.879042358 | 1.048476714 | 0.816642939 | 0.9147207 |
| D11 | Mazda | 0.898266491 | 1.293634679 | 0.603590522 | 0.9318306 |
| D12 | Mitsubishi | 0.819353562 | 1.058539585 | 0.744973296 | 0.8742888 |
| D13 | Nissan | 1.05967411 | 1.079036489 | 0.846496257 | 0.995069 |
| D14 | Peugeot | 0.964154915 | 1.114798933 | 0.81020986 | 0.9630546 |
| D15 | Renault | 0.990243303 | 1.222615142 | 0.699904642 | 0.970921 |
| D16 | SAIC | 0.970367828 | 1.000226189 | 0.797046101 | 0.9225467 |
| D17 | Suzuki | 1.043077467 | 1.357852294 | 0.642547387 | 1.0144924 |
| D18 | Tata Motors | 0.820686163 | 1.270811541 | 0.586953327 | 0.892817 |
| D19 | Toyota | 1.000982362 | 0.798950672 | 1.04161957 | 0.9471842 |
| D20 | Volkswagen | 1.075448807 | 1.110251768 | 0.925951934 | 1.0372175 |
| Average | 0.912574406 | 1.214809632 | 0.762419348 | 0.9632678 | |
| Max | 1.075448807 | 2.291090413 | 1.04161957 | 1.0372175 | |
| Min | 0.498366072 | 0.798950672 | 0.253600576 | 0.8742888 |
© 2020 by the authors. Licensee MDPI, Basel, Switzerland. This article is an open access article distributed under the terms and conditions of the Creative Commons Attribution (CC BY) license (http://creativecommons.org/licenses/by/4.0/).
Share and Cite
Wang, C.-N.; Tibo, H.; Nguyen, H.A. Malmquist Productivity Analysis of Top Global Automobile Manufacturers. Mathematics 2020, 8, 580. https://doi.org/10.3390/math8040580
Wang C-N, Tibo H, Nguyen HA. Malmquist Productivity Analysis of Top Global Automobile Manufacturers. Mathematics. 2020; 8(4):580. https://doi.org/10.3390/math8040580
Chicago/Turabian StyleWang, Chia-Nan, Hector Tibo, and Hong Anh Nguyen. 2020. "Malmquist Productivity Analysis of Top Global Automobile Manufacturers" Mathematics 8, no. 4: 580. https://doi.org/10.3390/math8040580
APA StyleWang, C.-N., Tibo, H., & Nguyen, H. A. (2020). Malmquist Productivity Analysis of Top Global Automobile Manufacturers. Mathematics, 8(4), 580. https://doi.org/10.3390/math8040580