Application of Mixed Sampling to Real Life Data: A Case Study on Socio-Economic Determinants by Using SEM and CFA Techniques

 ,
,  ,
,  ,
, 
 ,
,
Abstract
1. Introduction
1.1. Literature Review
1.2. Research Objectives
- (1)
- Identifying levels of stress among private and public primary school female teachers using the PSS.
- (2)
- Exploring the relationship between factors of stress among public and private primary school female teachers.
- (3)
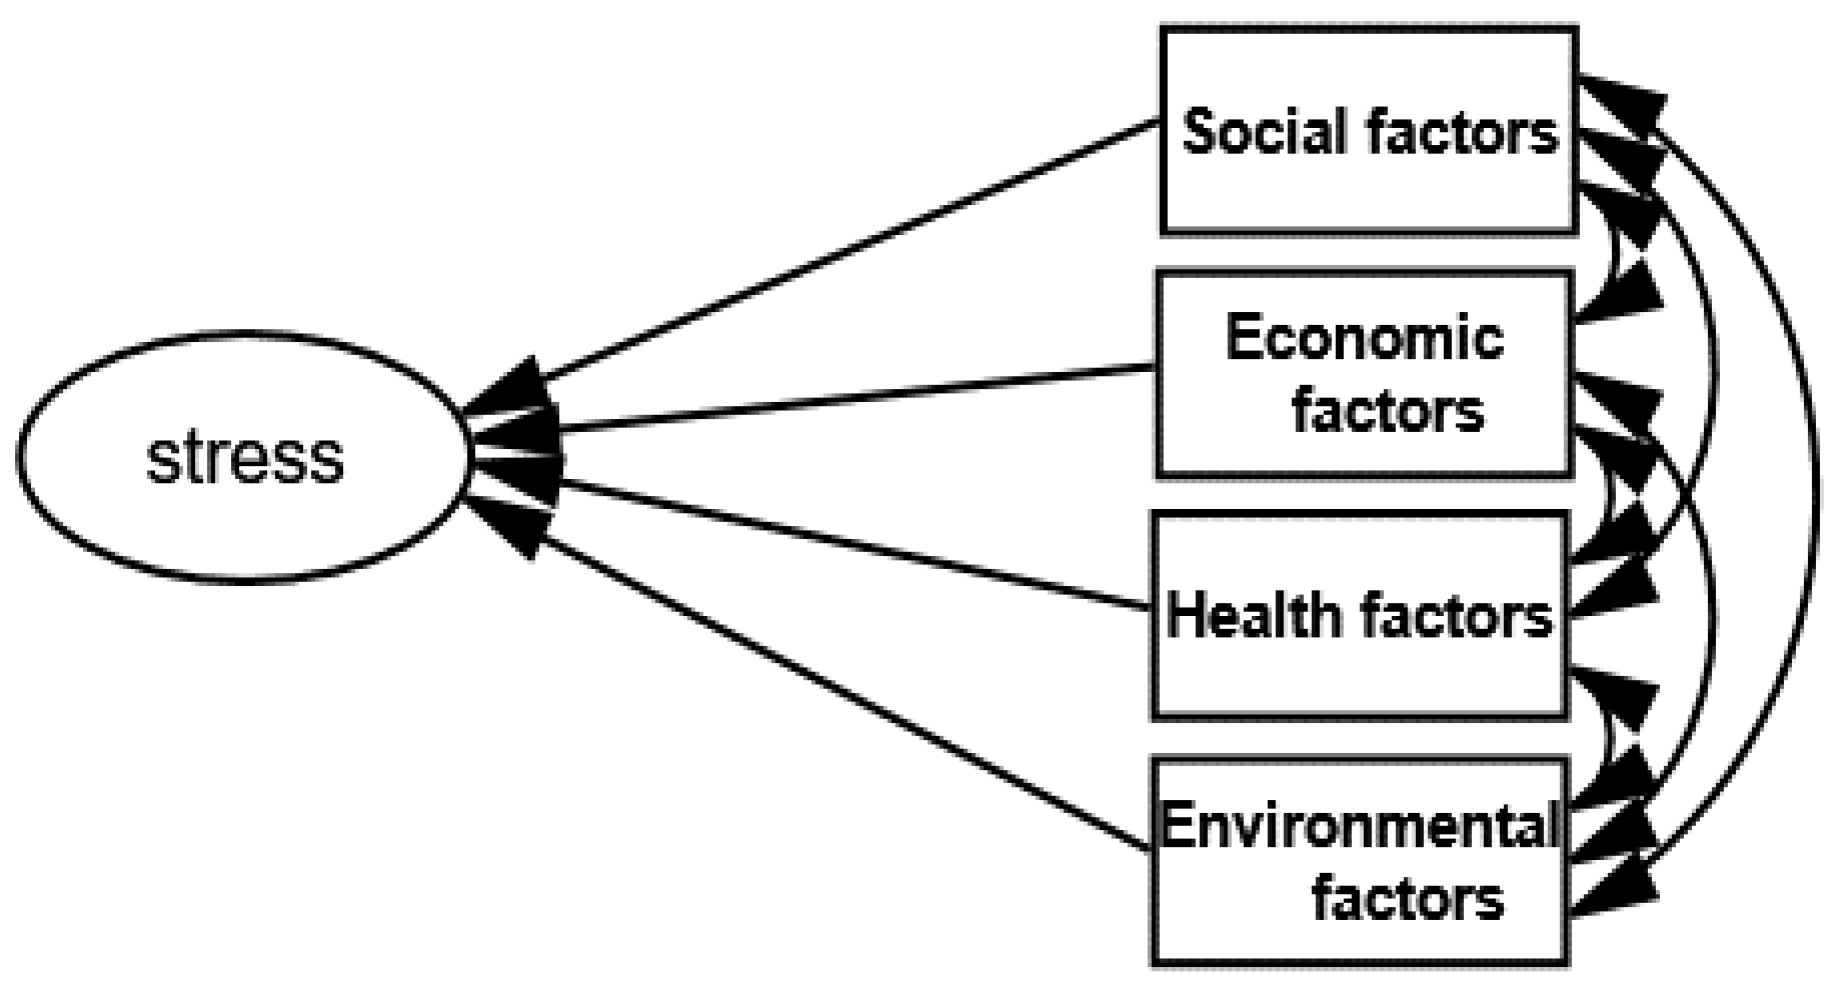
- Examining the relationship between socio-economic factors (Social, Economic, Health and Environment) and stress.
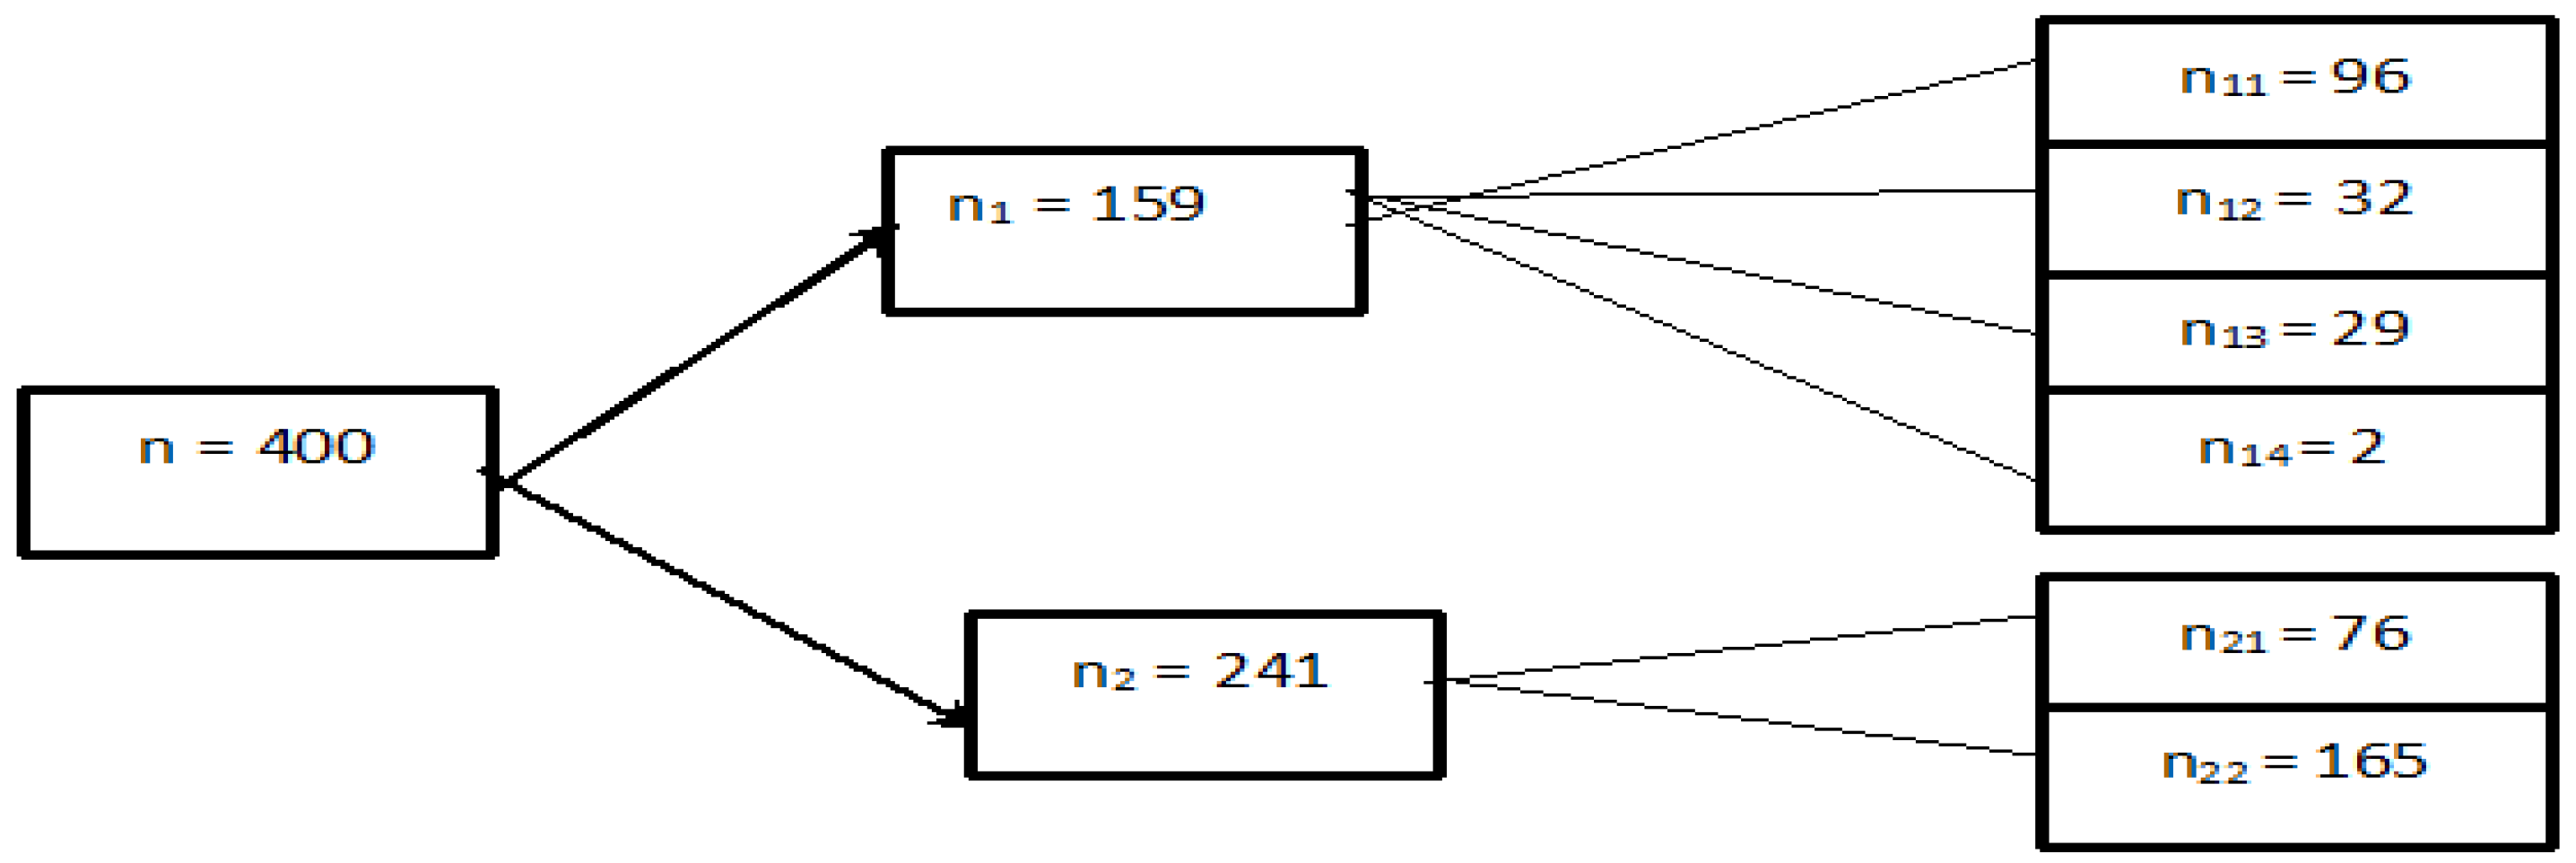
2. Data Collection and Statistical Methodology
Source of Data
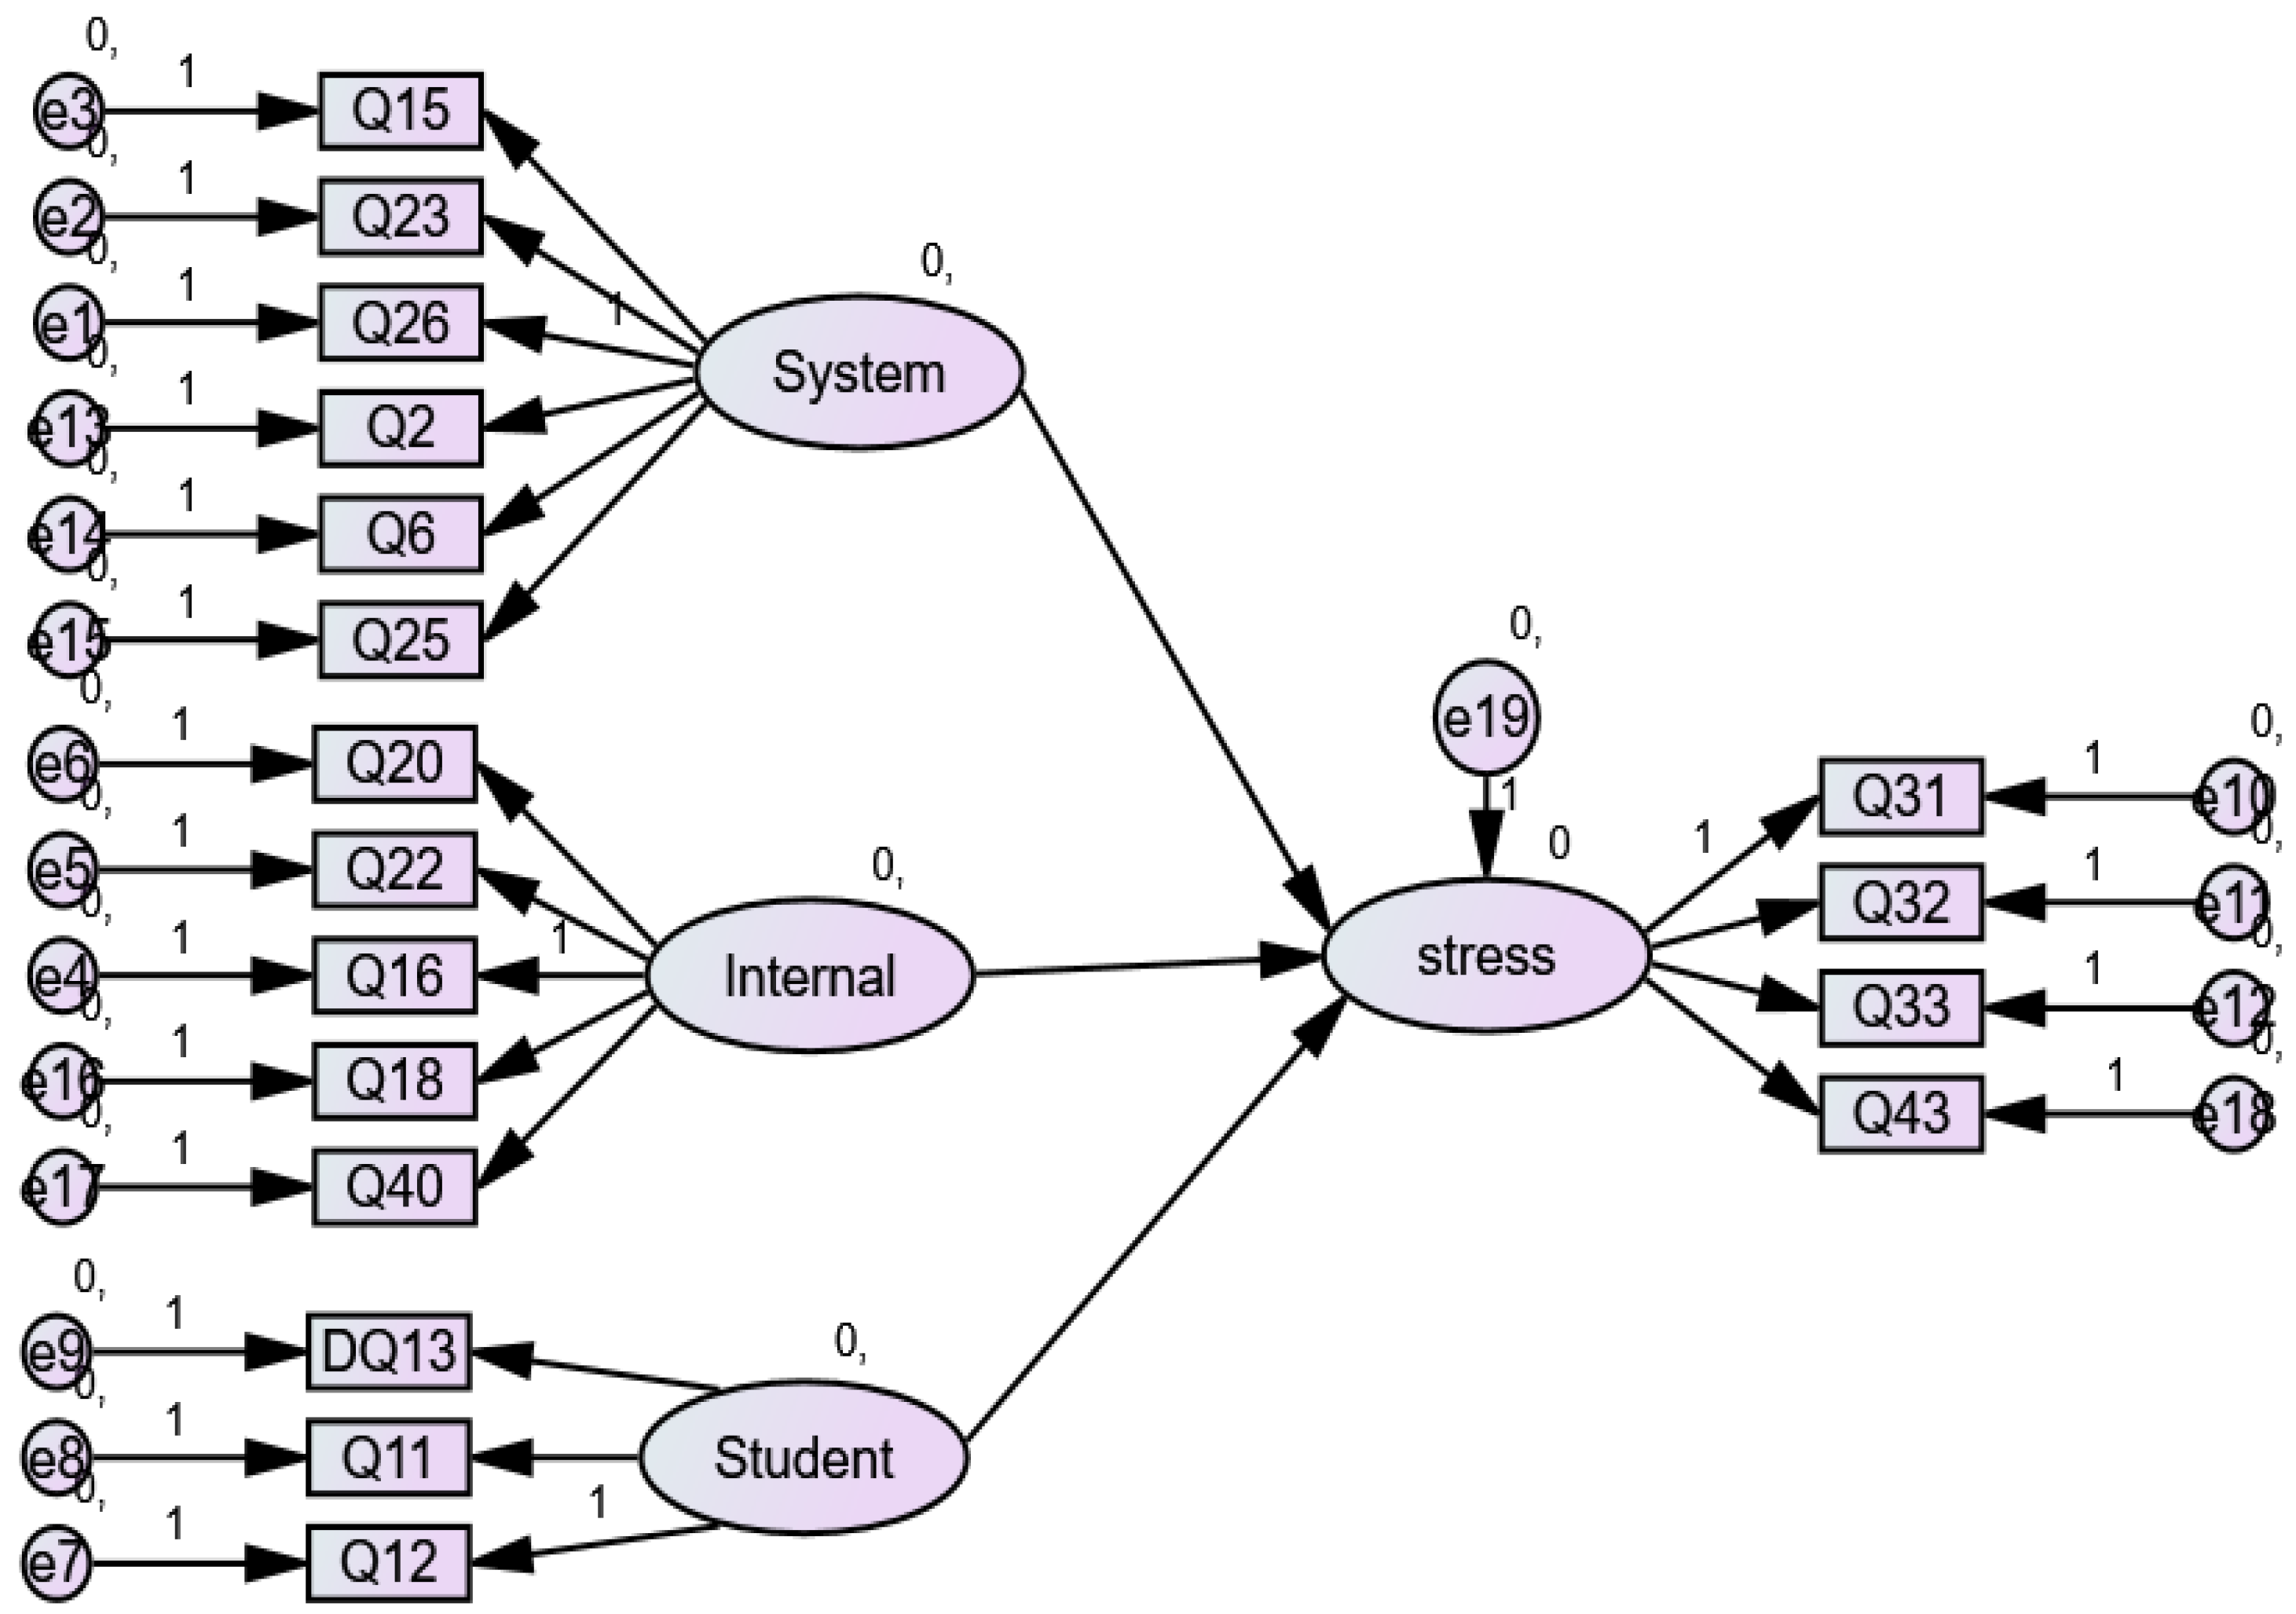
3. Causal Modeling
3.1. Conceptual Framework of the Causation Model
3.2. Structural Equation Modelling
3.3. Perceived Stress Scale
3.4. The Findings of PSS Are Discussed Below
4. Advantages and Disadvantages of the Study
4.1. Advantages
4.2. Disadvantages
5. Conclusions
Author Contributions
Funding
Acknowledgments
Conflicts of Interest
References
- Kyriacou, C. Teacher Stress: Directions for future research. Educ. Res. 2001, 53, 27–35. [Google Scholar] [CrossRef]
- Pervez, S.; Hanif, R. Levels and Sources of Work Stress among Women School Teachers. Pak. J. Psychol. Res. 2003, 18, 97–108. [Google Scholar]
- Kourmousi, N.; Alexopoulos, E.C. Stress Sources and Manifestations in a Nationwide Sample of Pre-Primary, Primary and Secondary Educators in Greece. J. Front. Public Health 2016, 4, 1–9. [Google Scholar] [CrossRef] [PubMed]
- Sadeghi, K.; Adatpourvahid, M.S. EFL teachers’ stress and job satisfaction: What contribution can teacher education make? Iran. J. Lang. Teach. Res. 2016, 4, 75–96. [Google Scholar]
- Faiza, S.; Nasir, M. Exploring the Level of Emotional Burnout among Public School Teachers. Sindh Univ. J. Educ. 2015, 44, 116–135. [Google Scholar]
- Yusuf, F.A.; Olufunke, Y.R.; Valentine, M.D. Causes and impact of Stress on Teacher’s Productivity as Expressed by Primary School Teachers in Nigeria. J. Sci. Res. 2015, 6, 1937–1942. [Google Scholar]
- Hassan, D.A. A Study of Occupational Stress of Primary School Teachers. Educ. Confab 2014, 3, 11–19. [Google Scholar]
- Kumar, I.A.; Wani, Z.A.; Parrey, A.A. Occupational Stress among Male and Female Elementary School Teachers of District Pulwama. Int. J. Sci. Eng. Res. 2013, 4, 934–941. [Google Scholar]
- Sultana, B.; Bano, Y.; Bano, F.; Shafa, M.D. The Nature and Impact of Teacher Stress in the Private Schools of Gilgit-Baltistan, Pakistan. Int. J. Acad. Res. Progress. Educ. Dev. 2012, 1, 64–84. [Google Scholar]
- Hanif, R.; Tariq, S.; Nadeem, M. Personal and Job-Related Predictors of Teacher Stress and Job Performance among School Teachers. Pak. J. Commer. Soc. Sci. 2011, 5, 319–329. [Google Scholar]
- Sass, D.A.; Seal, A.K.; Martin, N.K. Predicting teacher retention using stress and support variables. J. Educ. Adm. 2011, 49, 200–215. [Google Scholar] [CrossRef]
- Gold, E.; Smith, A.; Hopper, I.; Herne, D.; Tansey, G.; Hulland, C. Mindfulness-Based Stress Reduction (MBSR) for Primary School Teachers. J. Child Fam. Stud. 2010, 19, 184–189. [Google Scholar] [CrossRef]
- Chang, M.L. An Appraisal Perspective of Teacher Burnout: Examining the Emotional Work of Teachers. J. Educ. Resour. Inf. Cent. 2009, 21, 193–218. [Google Scholar] [CrossRef]
- Tsai, E.; Fung, L.; Chow, L. Sources and manifestations of stress in female Kindergarten teachers. Int. Educ. J. 2006, 7, 364–370. [Google Scholar]
- Jepson, E.; Forrest, S. Individual contributory factors in teacher stress: The role of achievement striving and occupational commitment. Br. J. Educ. Psychol. 2006, 76, 183–197. [Google Scholar] [CrossRef] [PubMed]
- Johnson, S.; Cooper, C.; Cartwright, S.; Donald, I.; Taylor, P.; Millet, C. The experience of work-related stress across occupations. J. Manag. Psychol. 2005, 20, 178–187. [Google Scholar] [CrossRef]
- Forlin, C. Inclusion: Identifying potential stressors for regular class teachers. Educ. Res. 2001, 43, 235–245. [Google Scholar] [CrossRef]
- Mario, P.G.; Gagliardi, M.; Razzino, S. Occupational stress and wellness among Italian secondary school teachers. Psychol. Health 2003, 18, 523–536. [Google Scholar] [CrossRef]
- Pettegrew, L.S.; Wolf, G.E. Validating Measures of Teacher Stress. Am. Educ. Res. J. 1982, 19, 373–396. [Google Scholar] [CrossRef]
- Hellriegel, D.; Slocum, J.W.; Woodman, R.W. Organizational Behaviour; West Publishing: St Paul, MN, USA, 1986. [Google Scholar]
- Bacharach, S.B.; Bauer, S.C.; Conley, S. Organizational Analysis of Stress: The case of elementary and secondary schools. Work Occup. Int. Sociol. J. 1986, 13, 7–32. [Google Scholar] [CrossRef]


| Variable Name | Variable Descriptions | Variable Description in Elaine (2001) |
|---|---|---|
| Q2 | I have enough resource to accomplish my job responsibility. | Competency to perform a given role [19] |
| Q6 | Classrooms have the sufficient teaching material. | Lack of sufficient resources to perform one’s role adequately [19] |
| Q15 | I feel that my health is being affected by my work. | Self-reported presence of stress-related psychosomatic symptoms. |
| Q23 | I feel motivated when my principal/headmaster appreciates me. | Support obtained from performing supervisory personnel [19] |
| Q25 | My job is secured. | Global measure of one’s own well-being at work [19] |
| Q26 | My physical health is mostly affected by my school work. | Amount of perceived stress experienced within school environment [19] |
| Q18 | I am satisfied with the retirement benefits. | Amount of perceived stress experienced within school environment [19] |
| Q20 | Paid for extra assignments/additional duties. | Amount of perceived stress experienced within school environment [19] |
| Q22 | How often have you felt confident about your ability to handle your personal problem. | Individual’s evaluation of his or her behavior’ abilities self-worth successes and failures [20] |
| Q40 | In the last month, how often have you felt that you were on top of things. | Perceptions of amount of control teachers have over their life events [20] |
| Q13 | Class size | Teacher’s perception of the sizes of their classes |
| Q11 | Students misbehaviour sometimes stressful for me. | Teacher’s perception of students’ classroom behavior [21] |
| Q12 | Sometimes I play the role of parents for my students. | Teacher’s perception of students’ learning [21] |
| Cronbach’s Alpha | No. of Items |
|---|---|
| 0.723 | 42 |
| Variables | Description of Variables | Factor Loading |
|---|---|---|
| Q6 | I am satisfied with the availability of drinking water and sanitary condition. | 0.207 |
| Q3 | I am satisfied with the furniture of classrooms. | 0.006 |
| Q2 | I have enough resource to accomplish my job responsibility. | 0.406 |
| Q1 | The school has sufficient number of classrooms. | 0.269 |
| Q26 | I am satisfied from the annual holidays with pay. | 0.645 |
| Q25 | My job is secured. | 0.789 |
| Q24 | Overall coordination with colleagues is good. | 0.756 |
| Q23 | I feel motivated when my principal/headmaster appreciates me. | 0.359 |
| Q10 | Student’s misbehaviour disturbs me. | −0.089 |
| Q9 | High emphasis on literacy numeracy drive (LND). | −0.060 |
| Q15 | I feel that my health is being affected by my work. | 0.367 |
| Q8 | I feel high degree of association with LND classes. | −0.094 |
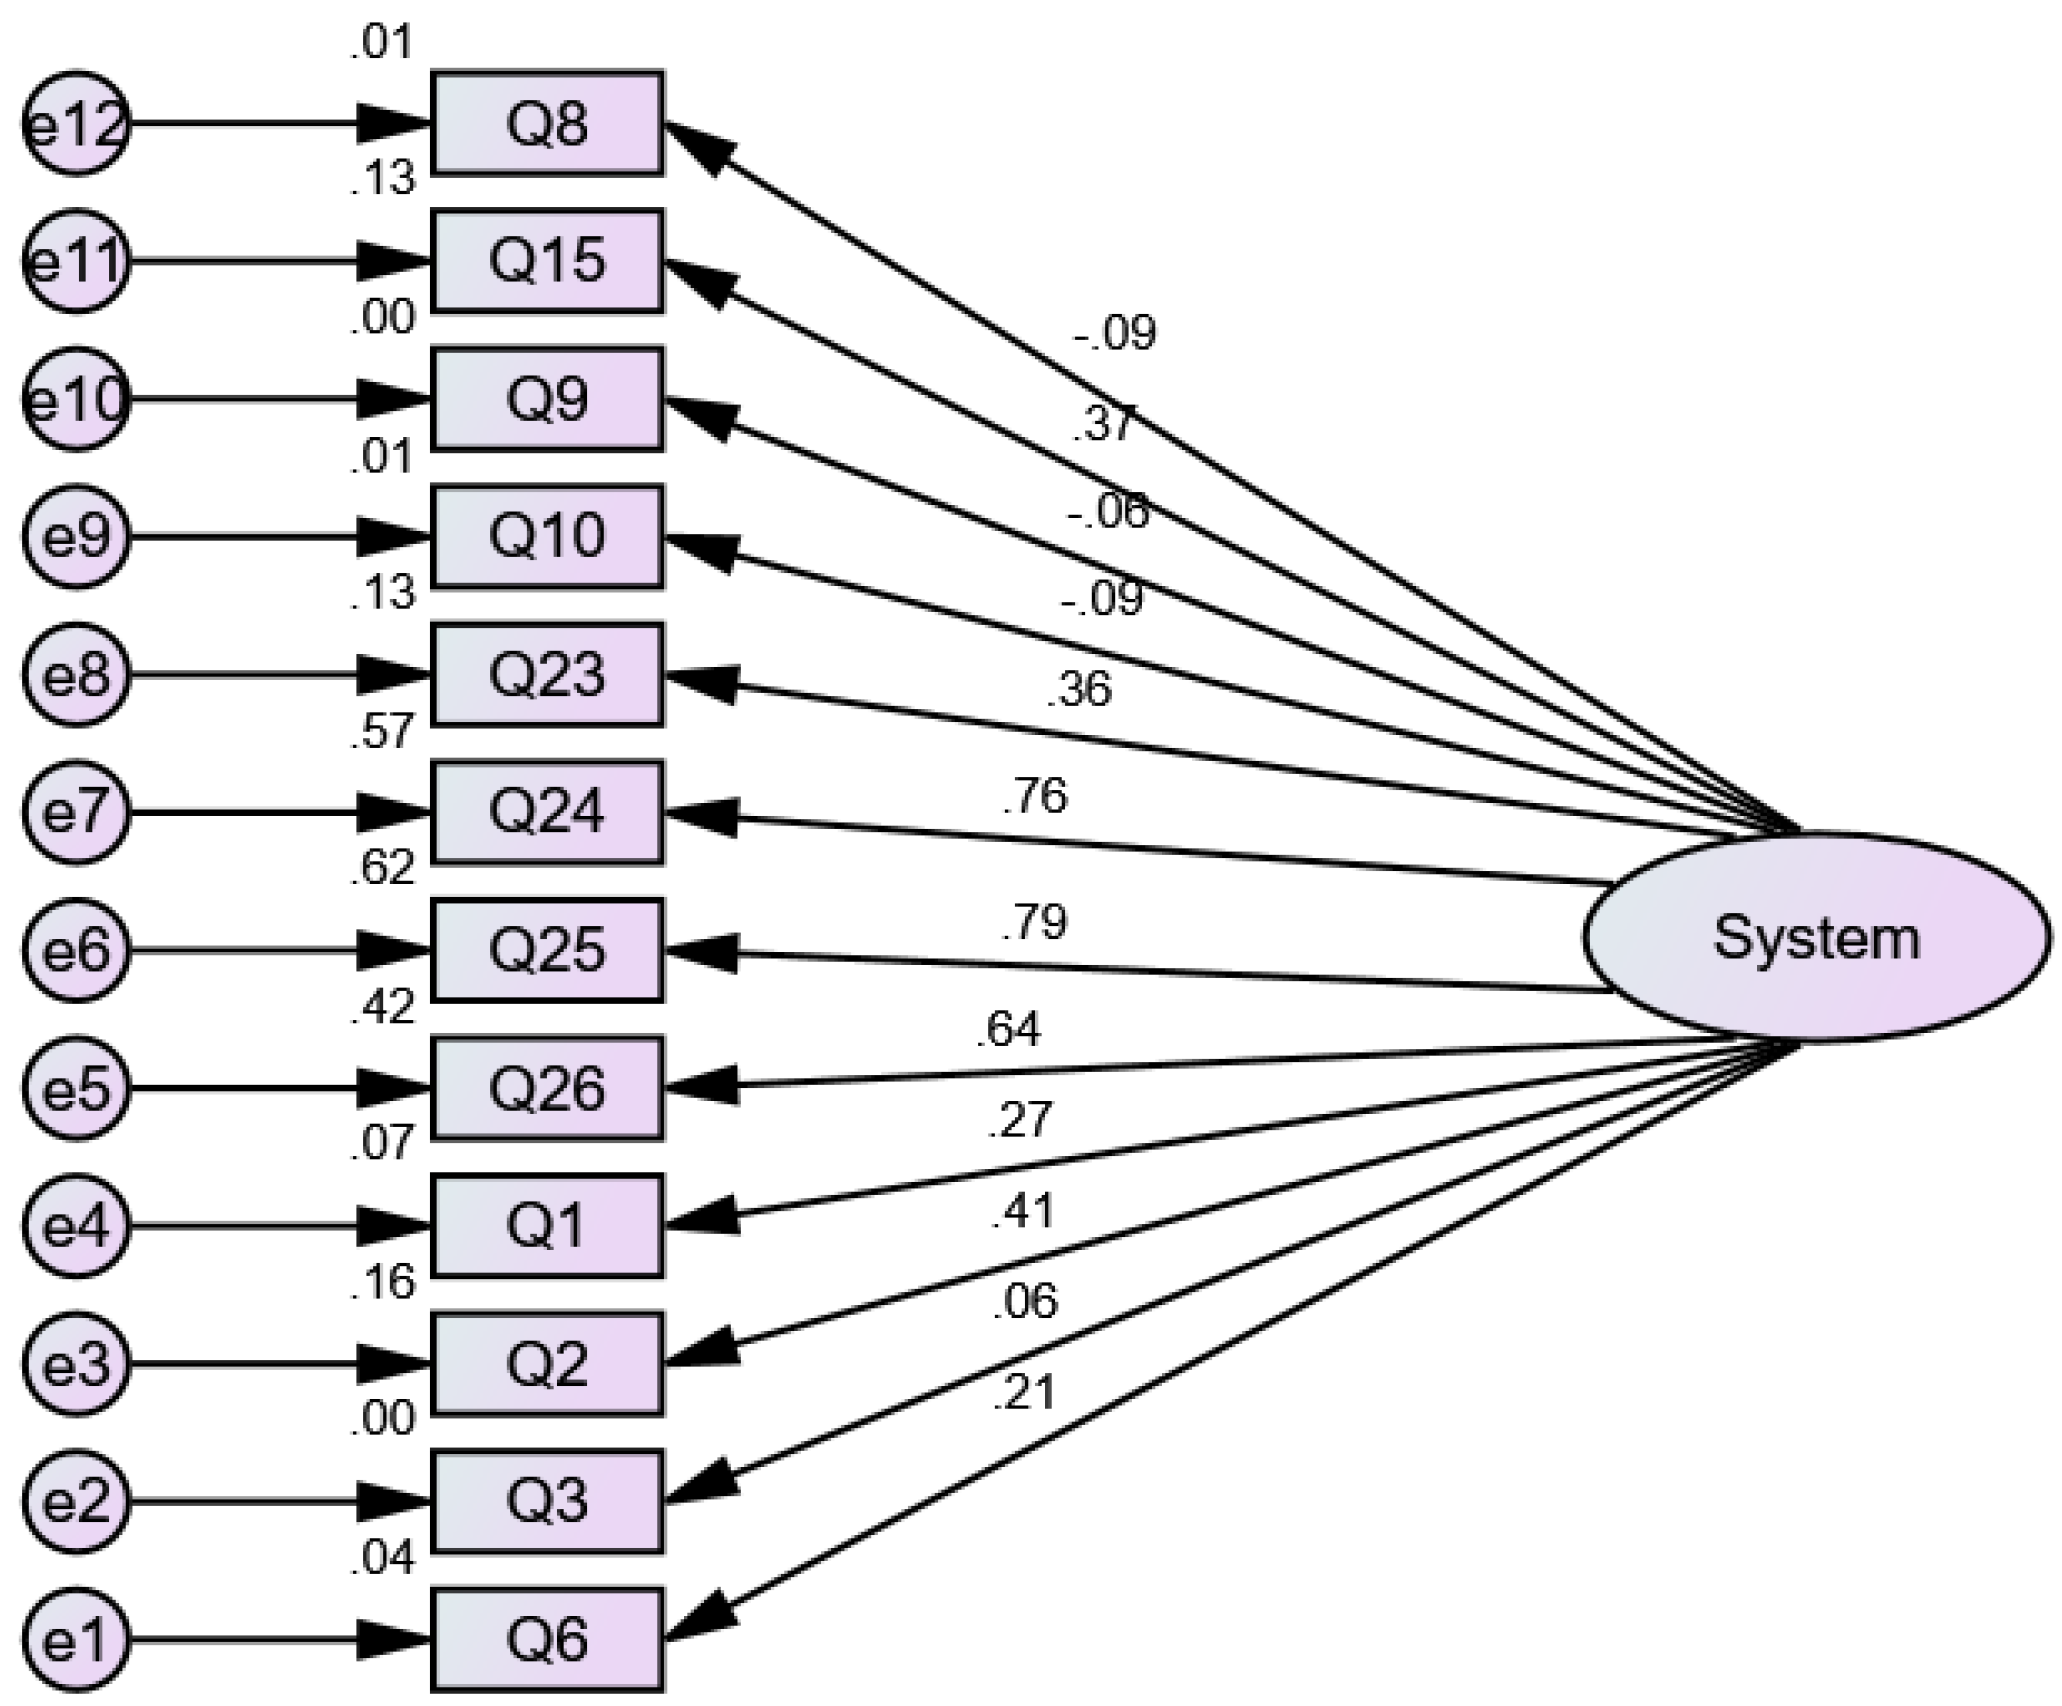
| Variable | Paths of Coefficient | Latent Variable SYSTEM | Estimates | Standard Errors | Critical Region | p-Value |
|---|---|---|---|---|---|---|
| Q6 | F1 | 1.000 | *** | *** | *** | |
| Q3 | F1 | 0.275 | 0.214 | 1.287 | 0.198 | |
| Q2 | F1 | 1.538 | 0.458 | 3.363 | 0.000 | |
| Q1 | F1 | 1.044 | 0.344 | 3.031 | 0.002 | |
| Q26 | F1 | 2.846 | 0.797 | 3.571 | 0.000 | |
| Q25 | F1 | 3.448 | 0.954 | 3.614 | 0.000 | |
| Q24 | F1 | 3.663 | 1.017 | 3.601 | 0.000 | |
| Q23 | F1 | 1.482 | 0.448 | 3.311 | 0.000 | |
| Q10 | F1 | −0.212 | 0.181 | −1.173 | 0.241 | |
| Q9 | F1 | −0.153 | 0.210 | −.730 | 0.465 | |
| Q15 | F1 | 1.341 | 0.399 | 3.362 | 0.000 | |
| Q8 | F1 | −0.464 | 0.308 | −1.509 | 0.131 |
| Variables | Description of Variables | Factor Loading |
|---|---|---|
| Q39 | How often have you been angered because of things that happened that were outside of your control? | −0.055 |
| Q40 | How often have you found yourself thinking about things that are under your control? | 0.037 |
| Q38 | In the last month, how often have you felt that you were on top of things? | −0.055 |
| Q36 | How often have you found that you could not cope with all the things that you had to do? | −0.122 |
| Q18 | I am satisfied with the retirement benefits. | 0.375 |
| Q16 | My physical health is mostly affected by my work. | 0.723 |
| Q22 | I am satisfied from the support of my principal/headmaster. | 0.632 |
| Q21 | My principal/headmaster is unbiased to all employees. | −0.030 |
| Q20 | Paid for extra assignments/additional duties. | 0.447 |
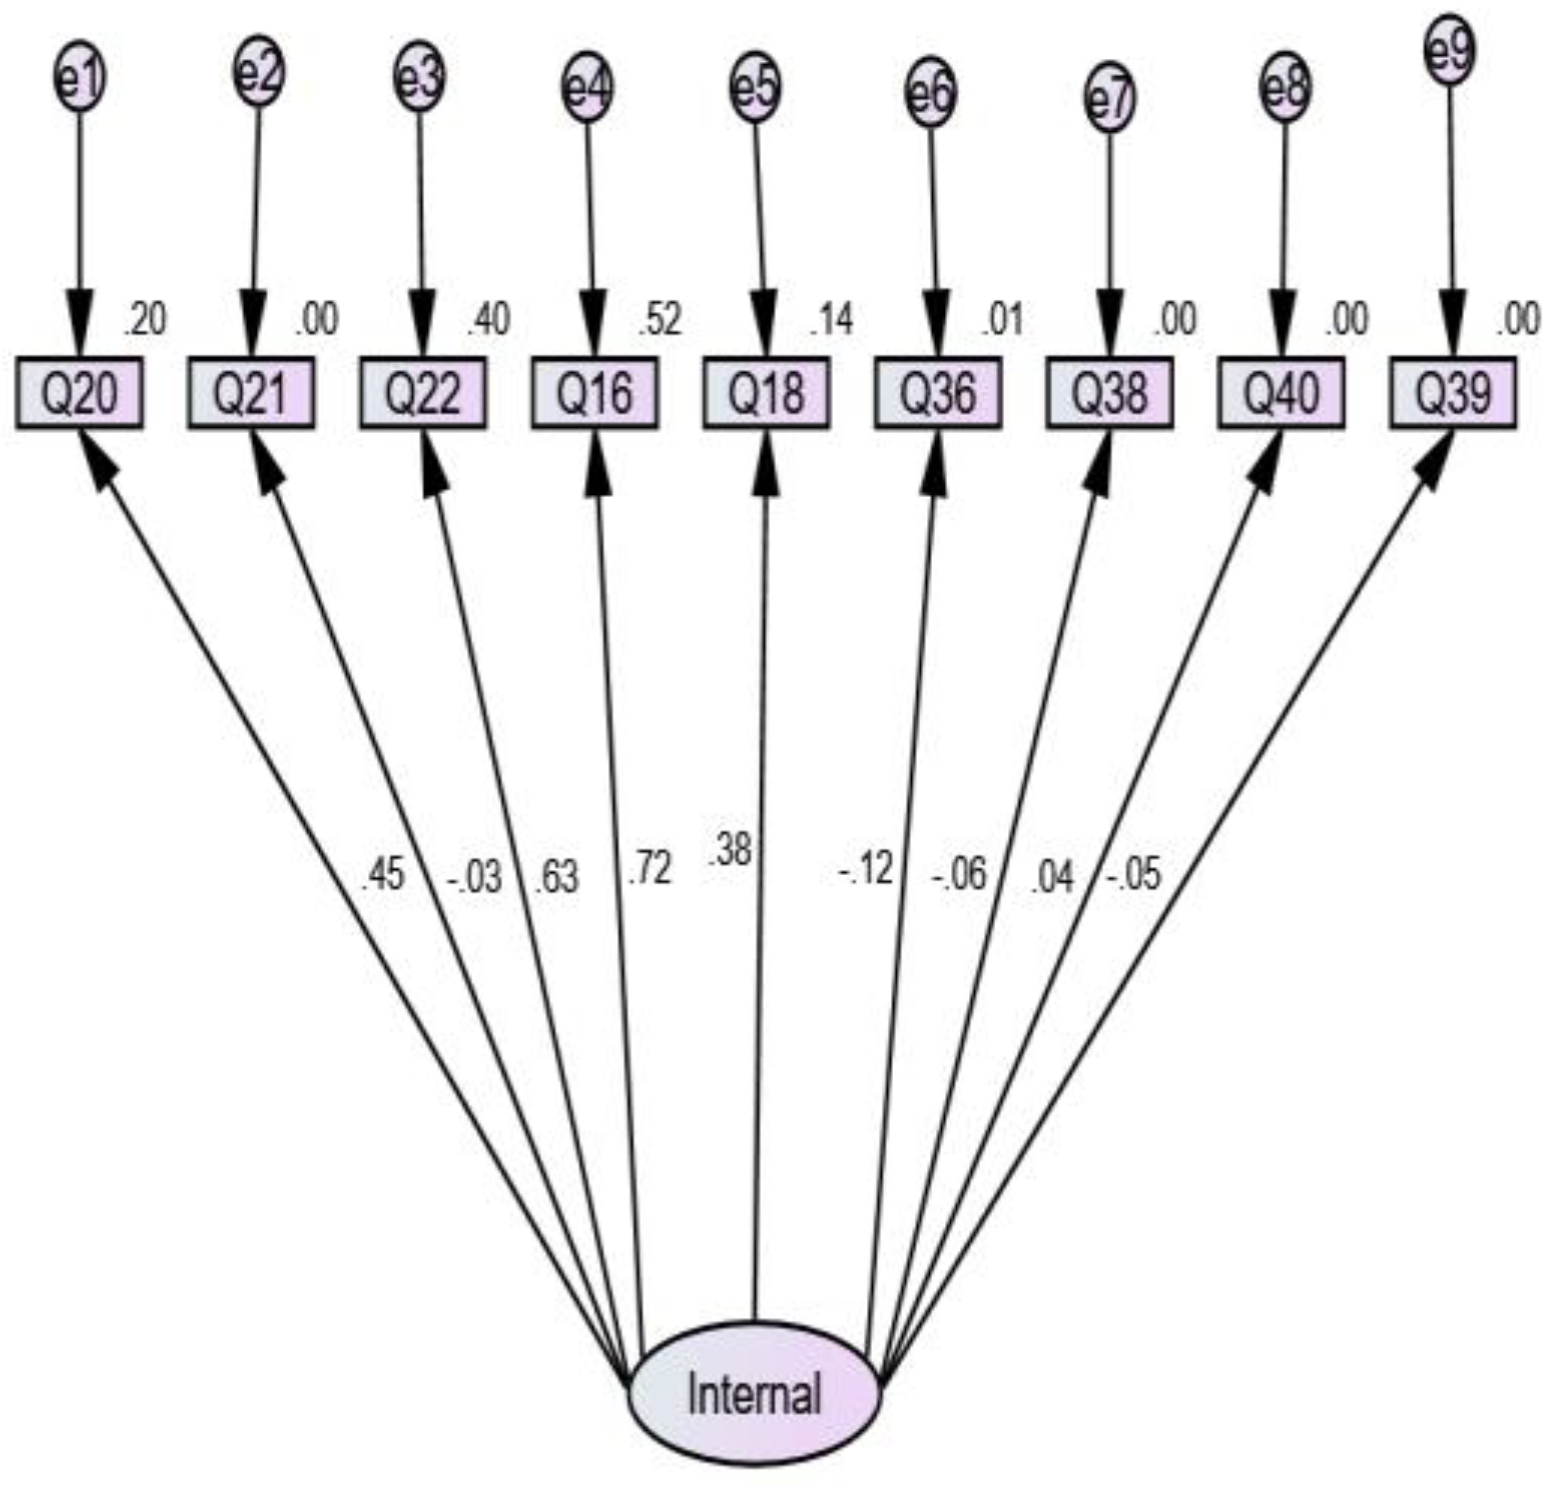
| Variables | Paths of Coefficients | Latent Variable Internal | Parameter Estimate | Standard Error | C.R. | p-Value |
|---|---|---|---|---|---|---|
| Q20 | F1 | 1.000 | *** | *** | *** | |
| Q21 | F1 | −0.078 | 0.155 | −0.502 | 0.615 | |
| Q22 | F1 | 1.473 | 0.228 | 6.450 | 0.000 | |
| Q16 | F1 | 1.458 | 0.231 | 6.323 | 0.000 | |
| Q18 | F1 | 0.732 | 0.145 | 5.039 | 0.000 | |
| Q36 | F1 | −0.277 | 0.140 | −1.975 | 0.048 | |
| Q38 | F1 | −0.147 | 0.162 | −0.910 | 0.363 | |
| Q40 | F1 | 0.093 | 0.153 | 6.09 | 0.031 | |
| Q39 | F1 | −0.158 | 0.174 | −0.903 | 0.366 |
| Variables | Description of Variables | Factor Loading |
|---|---|---|
| DQ13 | Class size | 0.247 |
| Q12 | Sometimes I play the role of parents for my students. | −0.140 |
| Q11 | Students’ diversity sometimes stressful for me. | 0.357 |
| Q13 | Students misbehavior disturb me. | −0.021 |
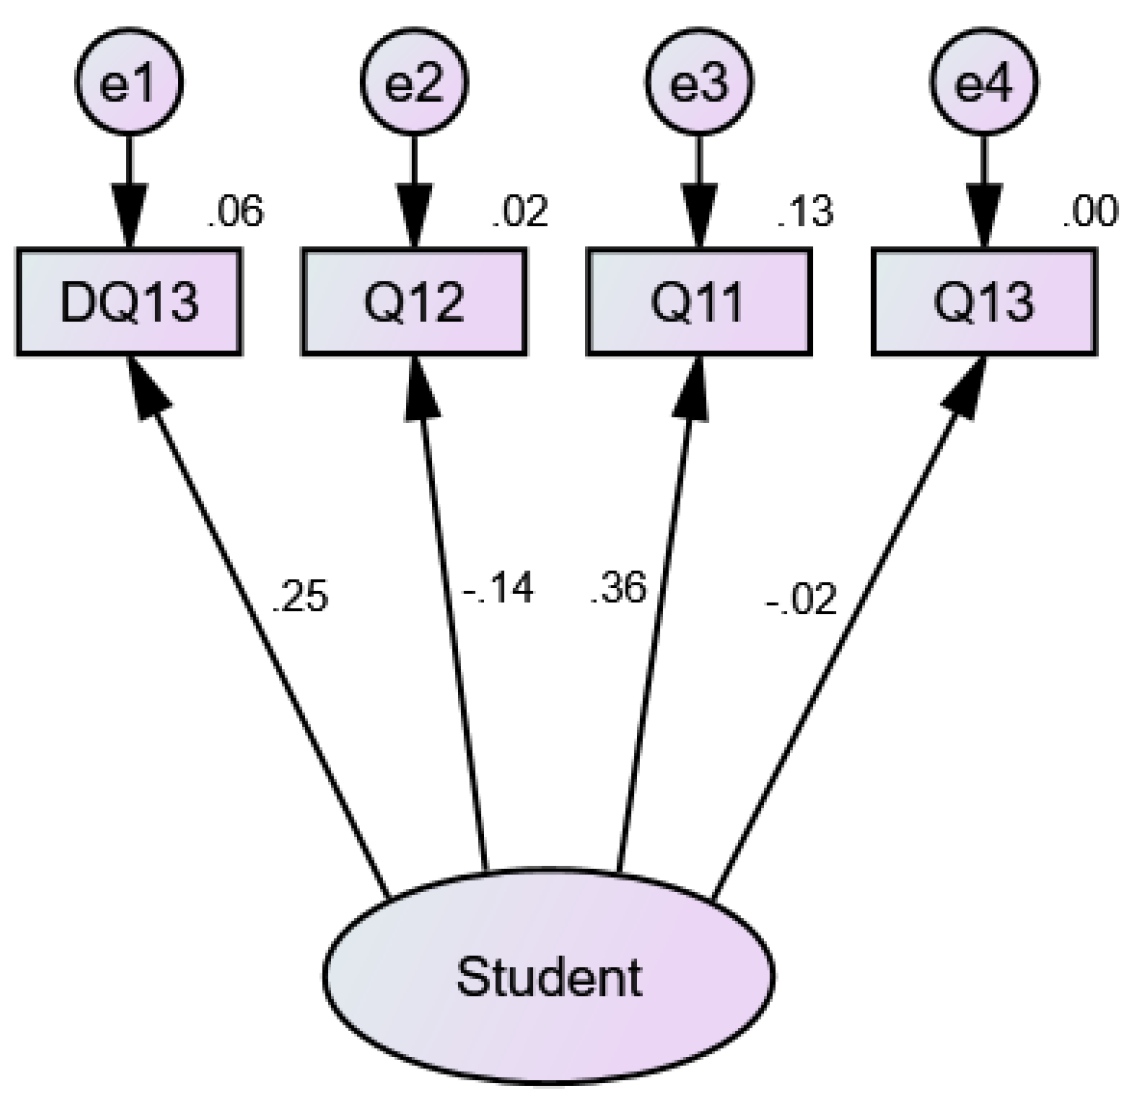
| Variables | Paths of Coefficients | Latent Variable STUDENT | Parameter Estimate | Standard Error | C.R. | p-Value |
|---|---|---|---|---|---|---|
| DQ13 | F1 | 1.000 | *** | *** | *** | |
| Q12 | F1 | −0.045 | 0.051 | 3.884 | 0.037 | |
| Q11 | F1 | 0.231 | 0.384 | 4.601 | 0.000 | |
| Q13 | F1 | −0.006 | 0.035 | −0.183 | 0.855 |
| Variables | Description of Variables | Factor Loading |
|---|---|---|
| Q31 | How often have you been upset because of something that happened unexpectedly? | 0.63 |
| Q32 | How often have you felt that you were unable to control the important things in your life? | 0.60 |
| Q33 | How often have you felt “stressed”? | 0.72 |
| Q34 | How often have you dealt successfully with day to day problems and annoyances? | −0.04 |
| Q35 | How often have you felt that you were effectively coping with important changes that were occurring in your life? | −0.25 |
| Q36 | How often have you felt confident about your ability to handle your personal problems? | −0.31 |
| Q37 | How often have you felt that things were going your way? | −0.07 |
| Q38 | How often have you found that you could not cope with all the things that you had to do? | 0.46 |
| Q39 | How often have you been able to control irritations in your life? | −0.04 |
| Q40 | How often have you felt that you were on top of things? | 0.07 |
| Q41 | How often have you been angered because of things that happened that were outside of your control? | 0.48 |
| Q42 | How often have you found yourself thinking about things that you have to accomplish? | 0.25 |
| Q43 | How often have you been able to control the way you spend your time? | −0.20 |
| Q44 | How often have you felt difficulties were piling up so high that you could not overcome them? | 0.59 |
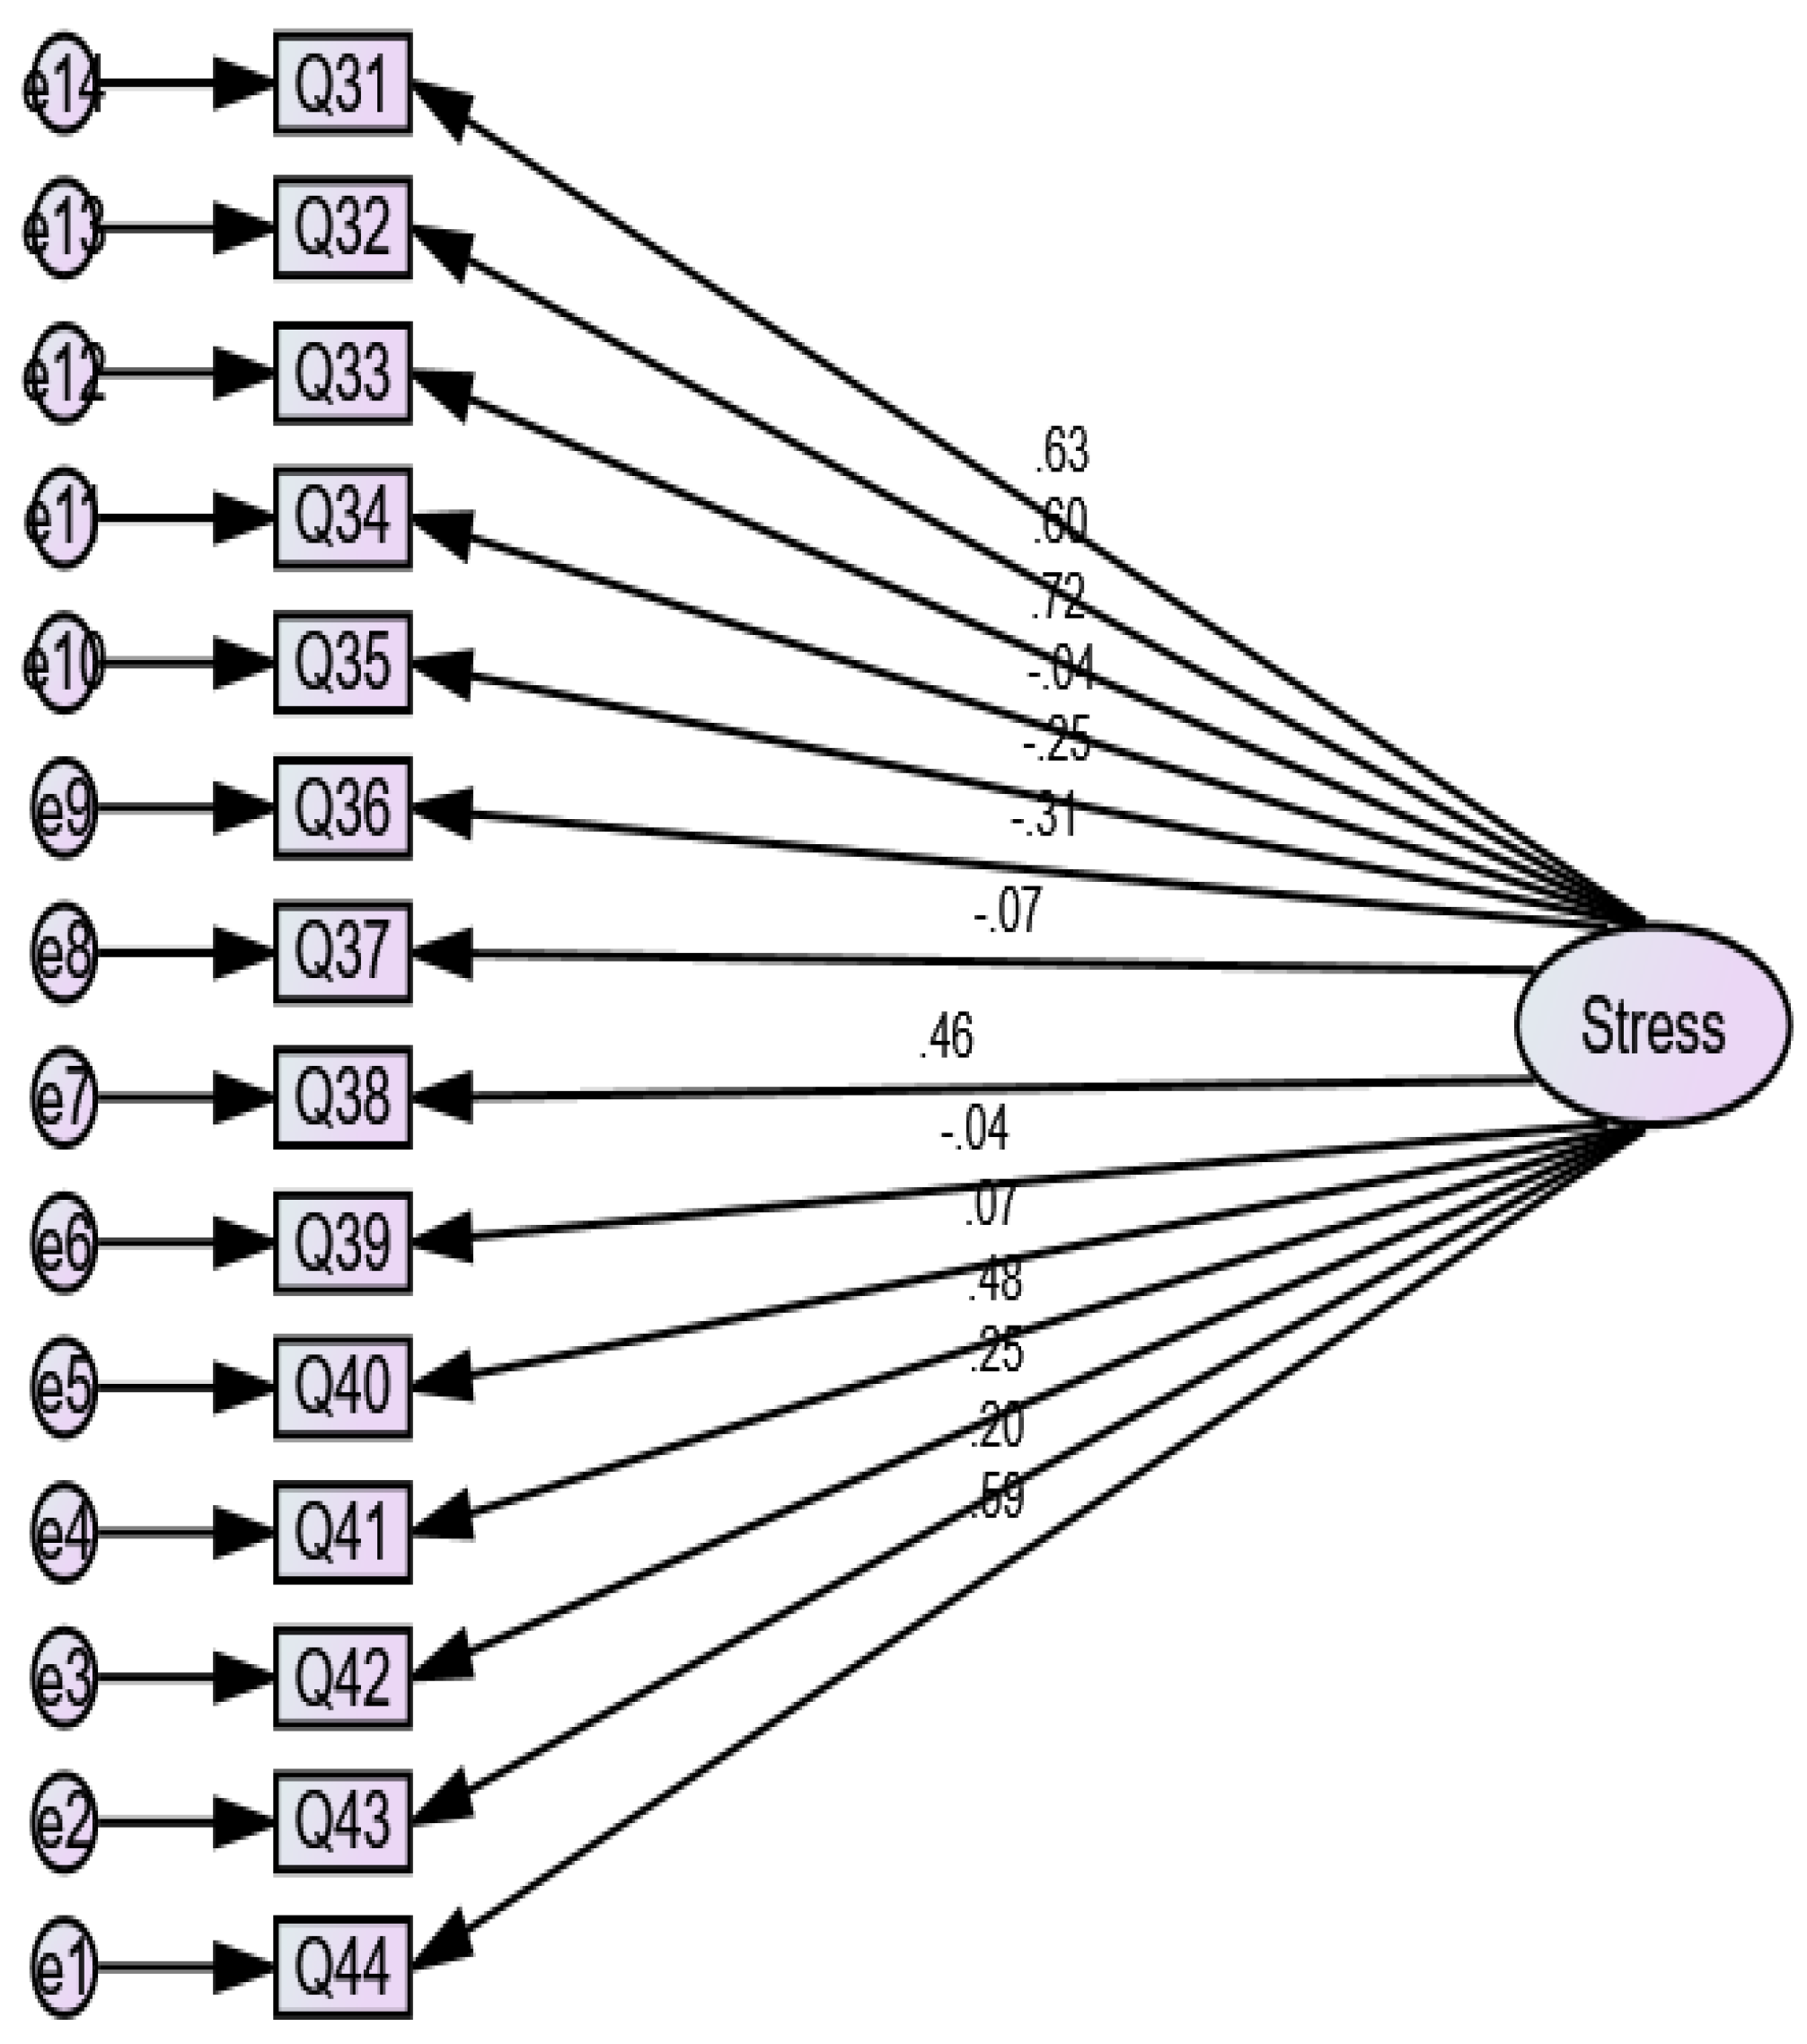
| Variables | Paths of Coefficients | Latent Variable Internal | Parameter Estimate | SE | CR | p-Value |
|---|---|---|---|---|---|---|
| Q44 | F1 | 1.000 | *** | *** | *** | |
| Q43 | F1 | −0.307 | 0.090 | −3.392 | 0.000 | |
| Q42 | F1 | 0.366 | 0.085 | 4.284 | 0.000 | |
| Q41 | F1 | 0.810 | 0.107 | 7.566 | 0.000 | |
| Q40 | F1 | 0.106 | 0.092 | 1.152 | 0.249 | |
| Q39 | F1 | −0.067 | 0.104 | −0.642 | 0.521 | |
| Q38 | F1 | 0.792 | 0.108 | 7.343 | 0.000 | |
| Q37 | F1 | −0.120 | 0.104 | −1.152 | 0.249 | |
| Q36 | F1 | −0.452 | 0.086 | −5.229 | 0.000 | |
| Q35 | F1 | −0.465 | 0.108 | −4.321 | 0.000 | |
| Q34 | F1 | −0.066 | 0.102 | −0.645 | 0.519 | |
| Q33 | F1 | 1.391 | 0.140 | 9.911 | 0.000 | |
| Q32 | F1 | 1.175 | 0.132 | 8.918 | 0.000 | |
| Q31 | F1 | 1.043 | 0.114 | 9.144 | 0.000 |
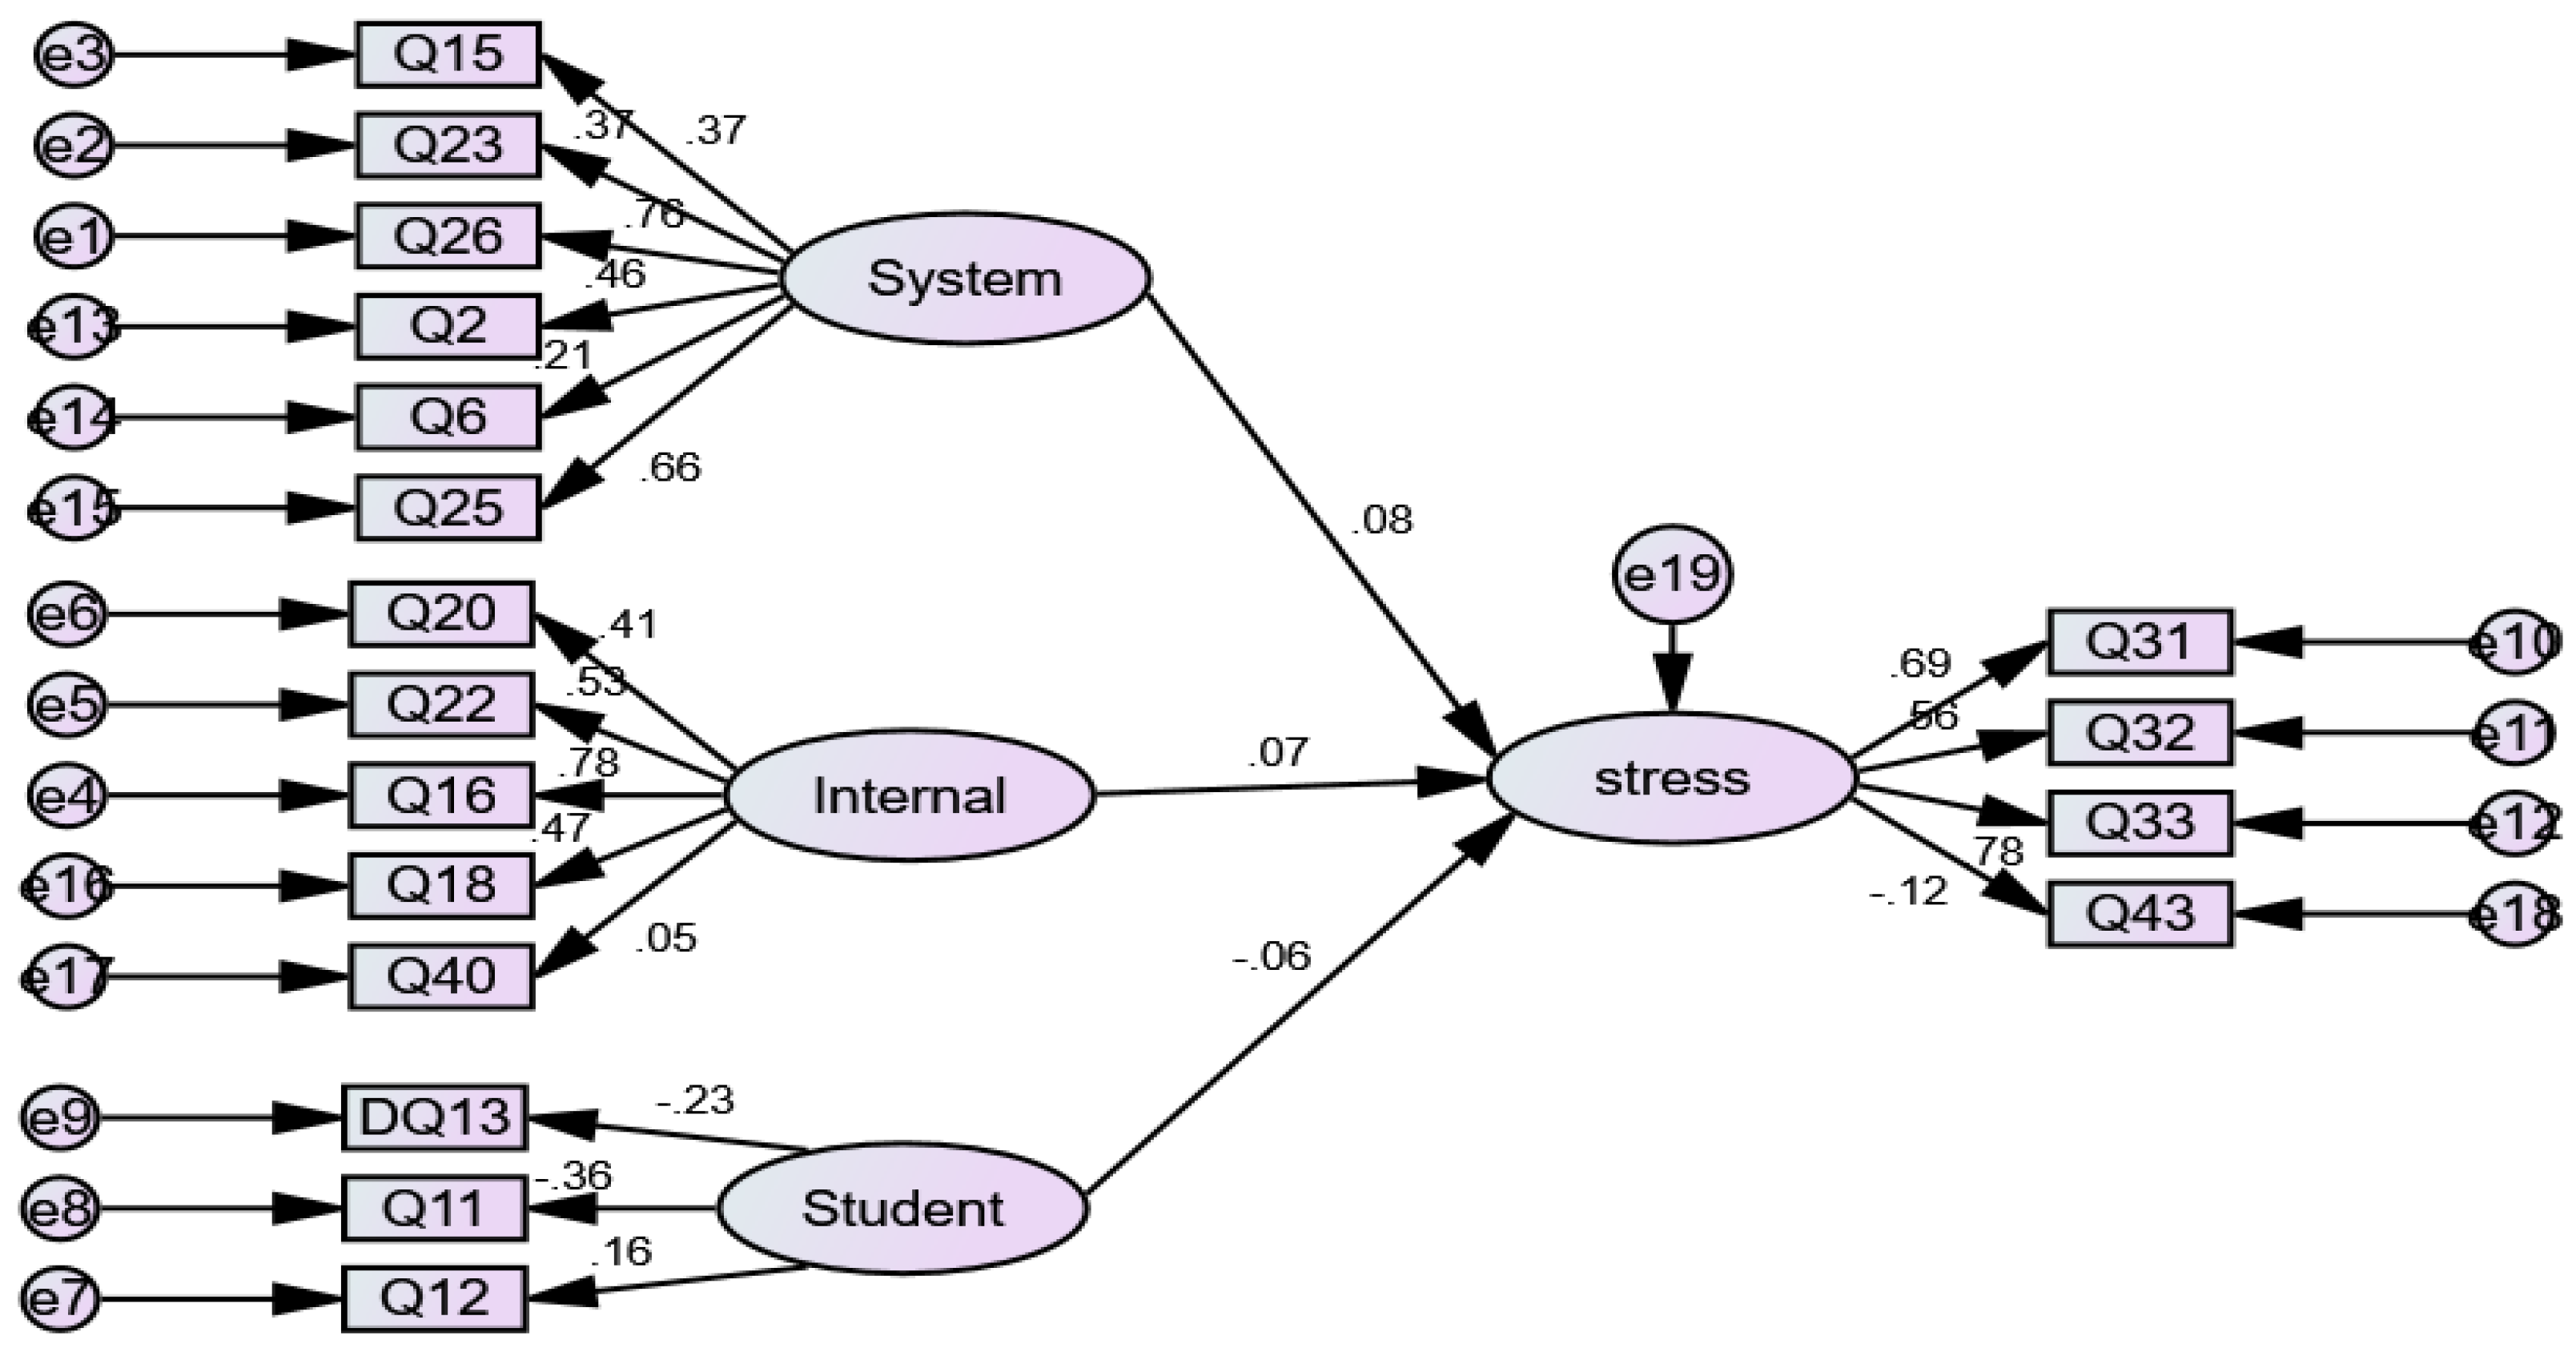
| Path of Coefficient | Estimate | SE | CR | p-Value | Variables | Squared Multiple Correlations | ||
|---|---|---|---|---|---|---|---|---|
| Stress | Internal | 0.074 | 0.075 | 0.984 | 0.325 | STRESS | 0.614 | |
| Stress | Student | −0.330 | 0.802 | −0.412 | 0.681 | Q43 | 0.140 | |
| Stress | System | 0.080 | 0.068 | 1.177 | 0.239 | Q40 | 0.223 | |
| Q26 | System | 1.000 | Q18 | 0.223 | ||||
| Q23 | System | 0.432 | 0.073 | 5.945 | *** | Q25 | 0.438 | |
| Q15 | System | 0.420 | 0.070 | 6.041 | *** | Q6 | 0.543 | |
| Q16 | Internal | 1.000 | Q2 | 0.211 | ||||
| Q22 | Internal | 0.748 | 0.114 | 6.570 | *** | Q33 | 0.605 | |
| Q20 | Internal | 0.566 | 0.098 | 5.749 | *** | Q32 | 0.314 | |
| Q12 | Student | 1.000 | Q31 | 0.474 | ||||
| Q11 | Student | −4.596 | 6.551 | −0.702 | 0.483 | DQ13 | 0.052 | |
| DQ13 | Student | −17.956 | 18.516 | −0.970 | 0.332 | Q11 | 0.132 | |
| Q31 | Stress | 1.000 | Q12 | 0.025 | ||||
| Q32 | Stress | 0.952 | 0.111 | 8.587 | *** | Q20 | 0.365 | |
| Q33 | Stress | 1.305 | 0.152 | 8.570 | *** | Q22 | 0.278 | |
| Q2 | System | 0.511 | 0.071 | 7.195 | *** | Q16 | 0.604 | |
| Q6 | System | 0.315 | 0.091 | 3.470 | *** | Q15 | 0.140 | |
| Q25 | System | 0.880 | 0.100 | 8.807 | *** | Q23 | 0.335 | |
| Q18 | Internal | 0.596 | 0.095 | 6.280 | *** | Q26 | 0.575 | |
| Q40 | Internal | 0.072 | 0.092 | 0.785 | 0.433 | |||
| Q43 | Stress | −0.160 | 0.080 | −2.001 | 0.045 |
| Fit Indices | Suggested | Obtained |
|---|---|---|
| Chi square | - | 424.605 |
| Degrees of freedom | - | 132 |
| Chi-square significance | p-value ≤ 0.05 | 0.000 |
| Chi-square/Degree of freedom | <3 | 3.217 |
| GFI | >0.90 | 0.901 |
| AGFI | >0.90 | 0.872 |
| NFI | >0.90 | 0.625 |
| CFI | >0.90 | 0.701 |
| RMSEA | <0.05 | 0.075 |
| RMR | <0.1 | 0.180 |
| Mean of PSS | 40.29 |
| Standard deviation of PSS | 6.460 |
| Number of observations | 400 |
| PSS Range | Frequency | Percentage of Teachers | Results |
|---|---|---|---|
| 0–18 | 0 | 0% | Low stress |
| 19–37 | 112 | 28% | Moderate stress |
| 38–56 | 288 | 72% | High perceived stress |
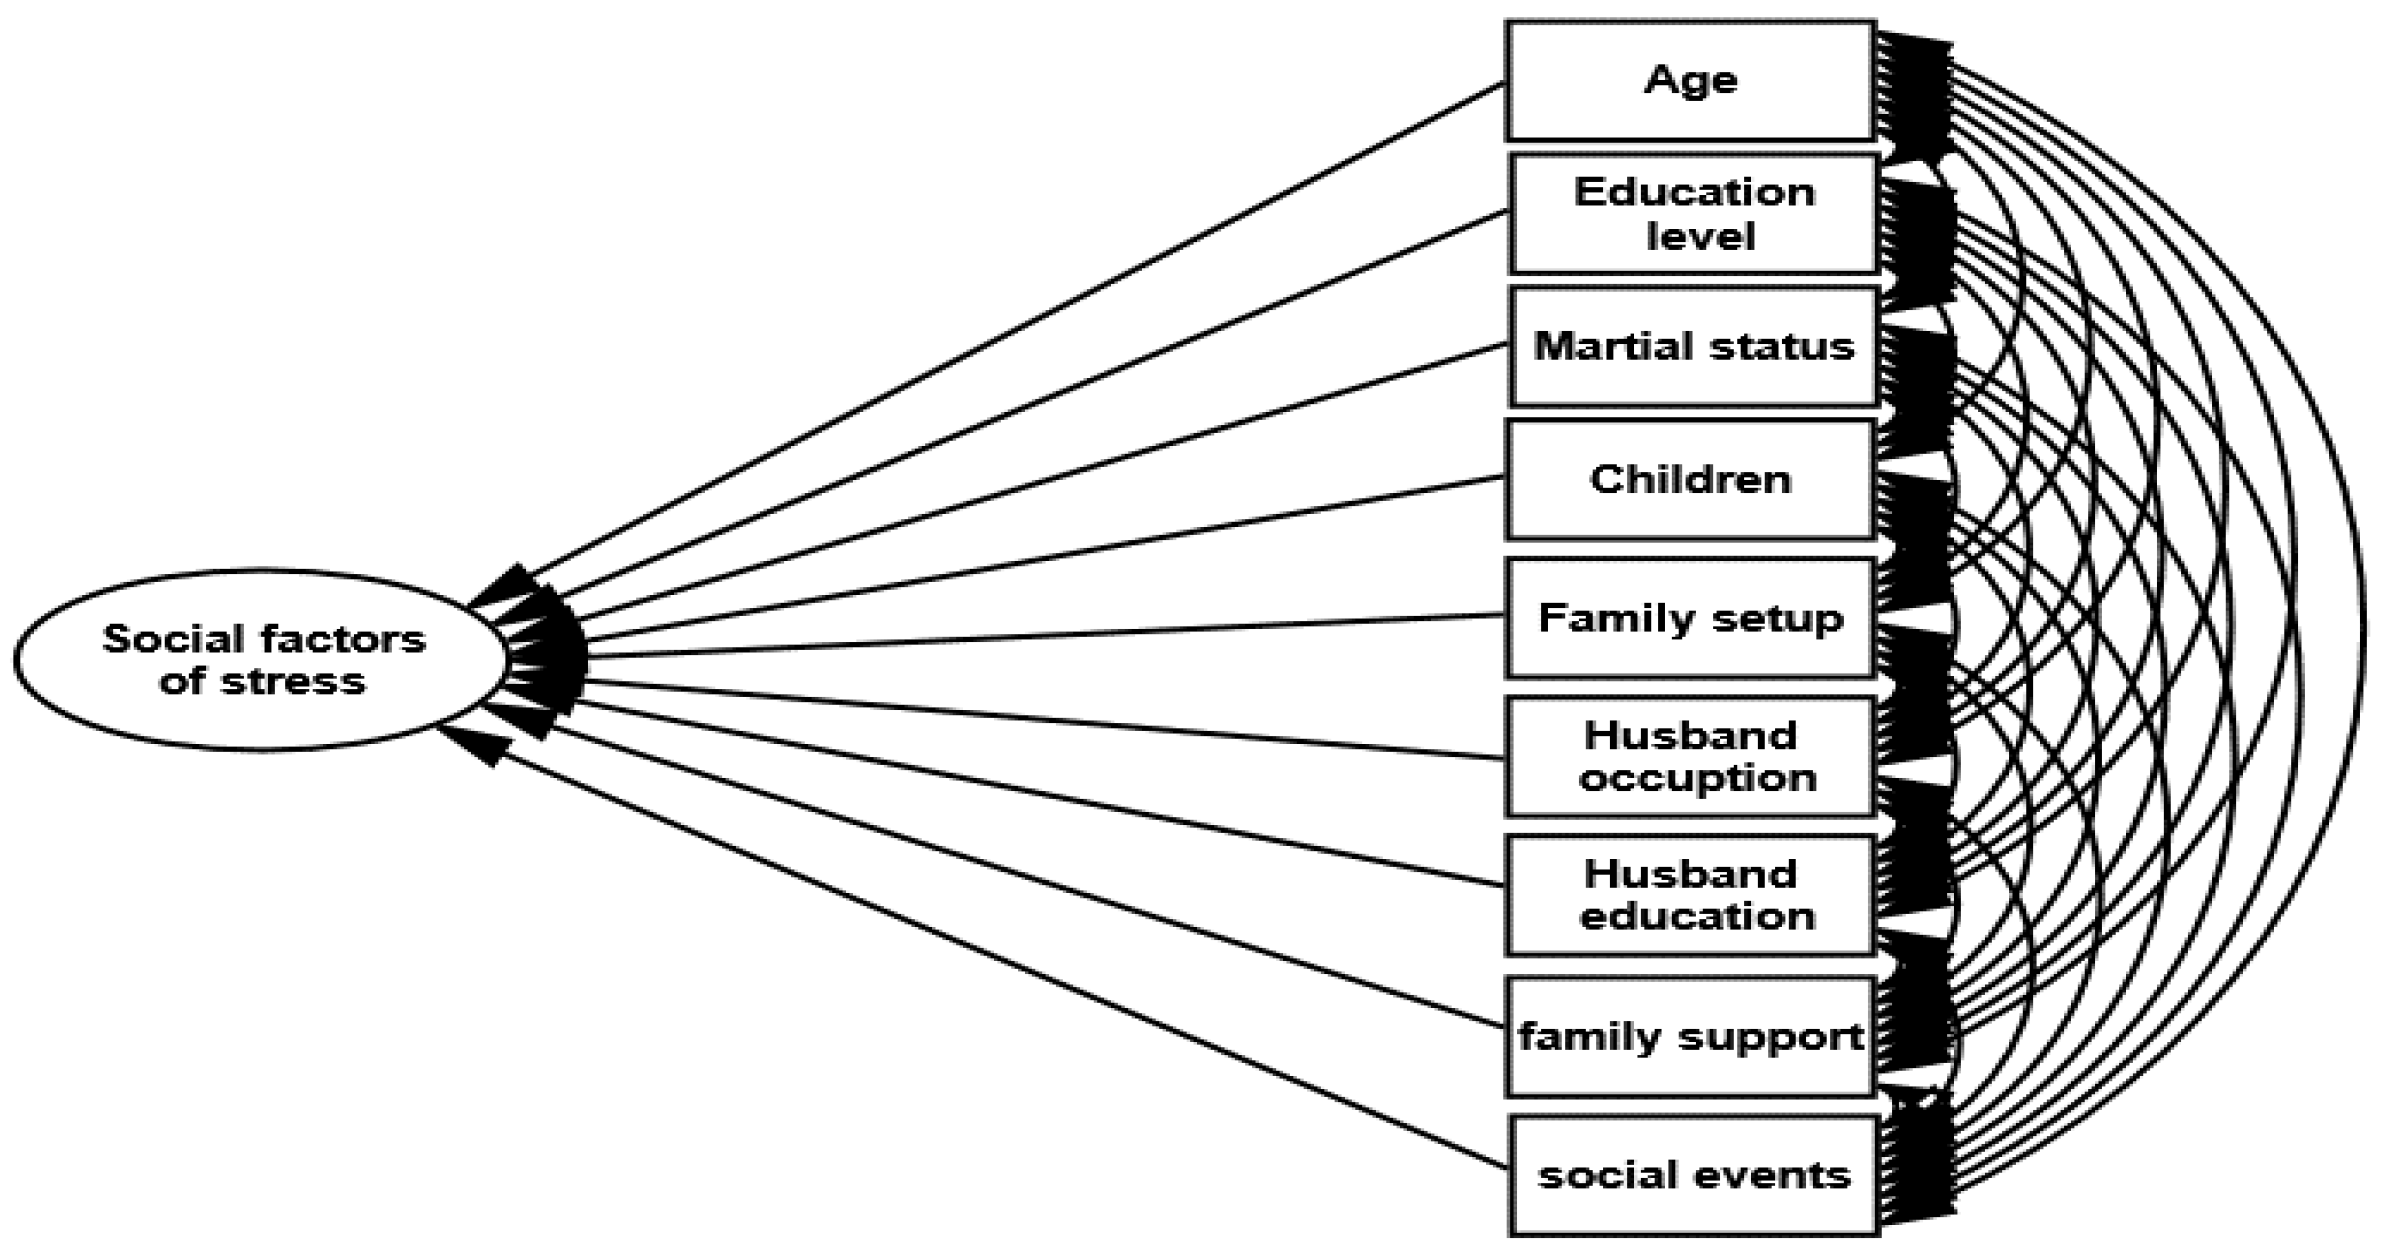
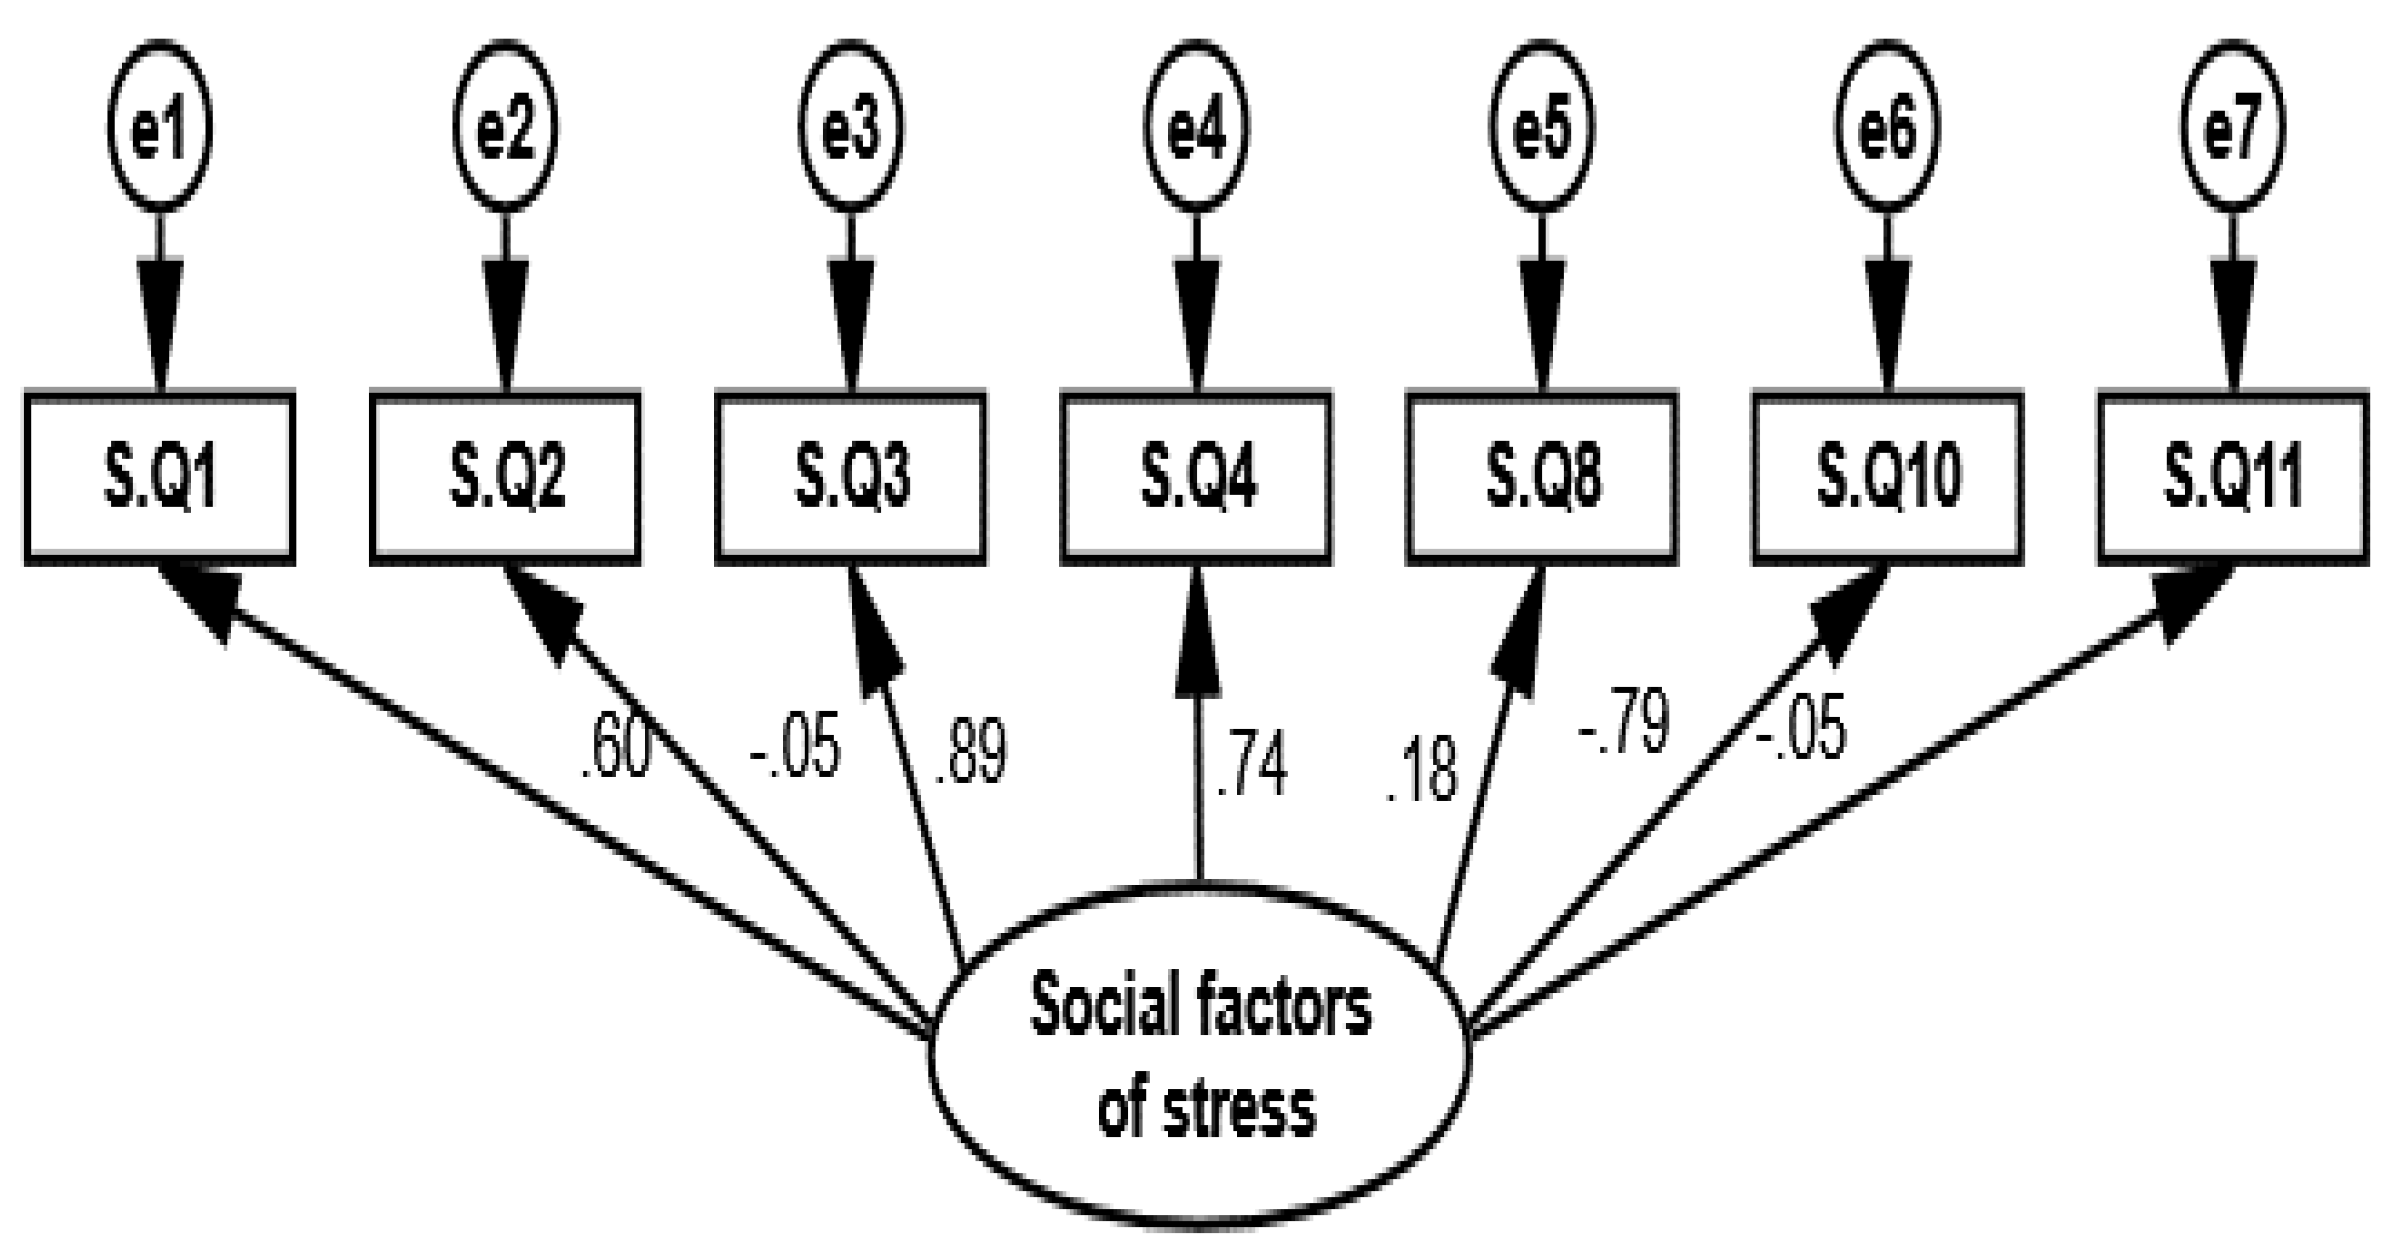
| Items of the Construct of Social Factors of Stress | Questionnaire Item | Correlation Coefficients |
|---|---|---|
| S.Q1 | What is your age? | 0.60 |
| S.Q2 | What is your qualification level? | −0.50 |
| S.Q3 | What is your marital status? | 0.89 |
| S.Q4 | If married number of children? | 0.74 |
| S.Q8 | Family setup | 0.18 |
| S.Q10 | Husband occupation | −0.79 |
| S.Q11 | Do you have family support? | −0.05 |
| Fit Indices | Suggested | Obtained |
|---|---|---|
| Chi square | - | 25.921 |
| Degree of Freedom | - | 14 |
| Chi-square significance | p-value ≤ 0.05 | 0.026 |
| Chi-square/Degree of Freedom | <3 | 1.825 |
| GFI | >0.90 | 0.981 |
| RMSEA | <0.05 | 0.046 |
| RMR | <0.1 | 0.023 |
| AGFI | >0.90 | 0.963 |
| NFI | >0.90 | 0.855 |
| CFI | >0.90 | 0.925 |
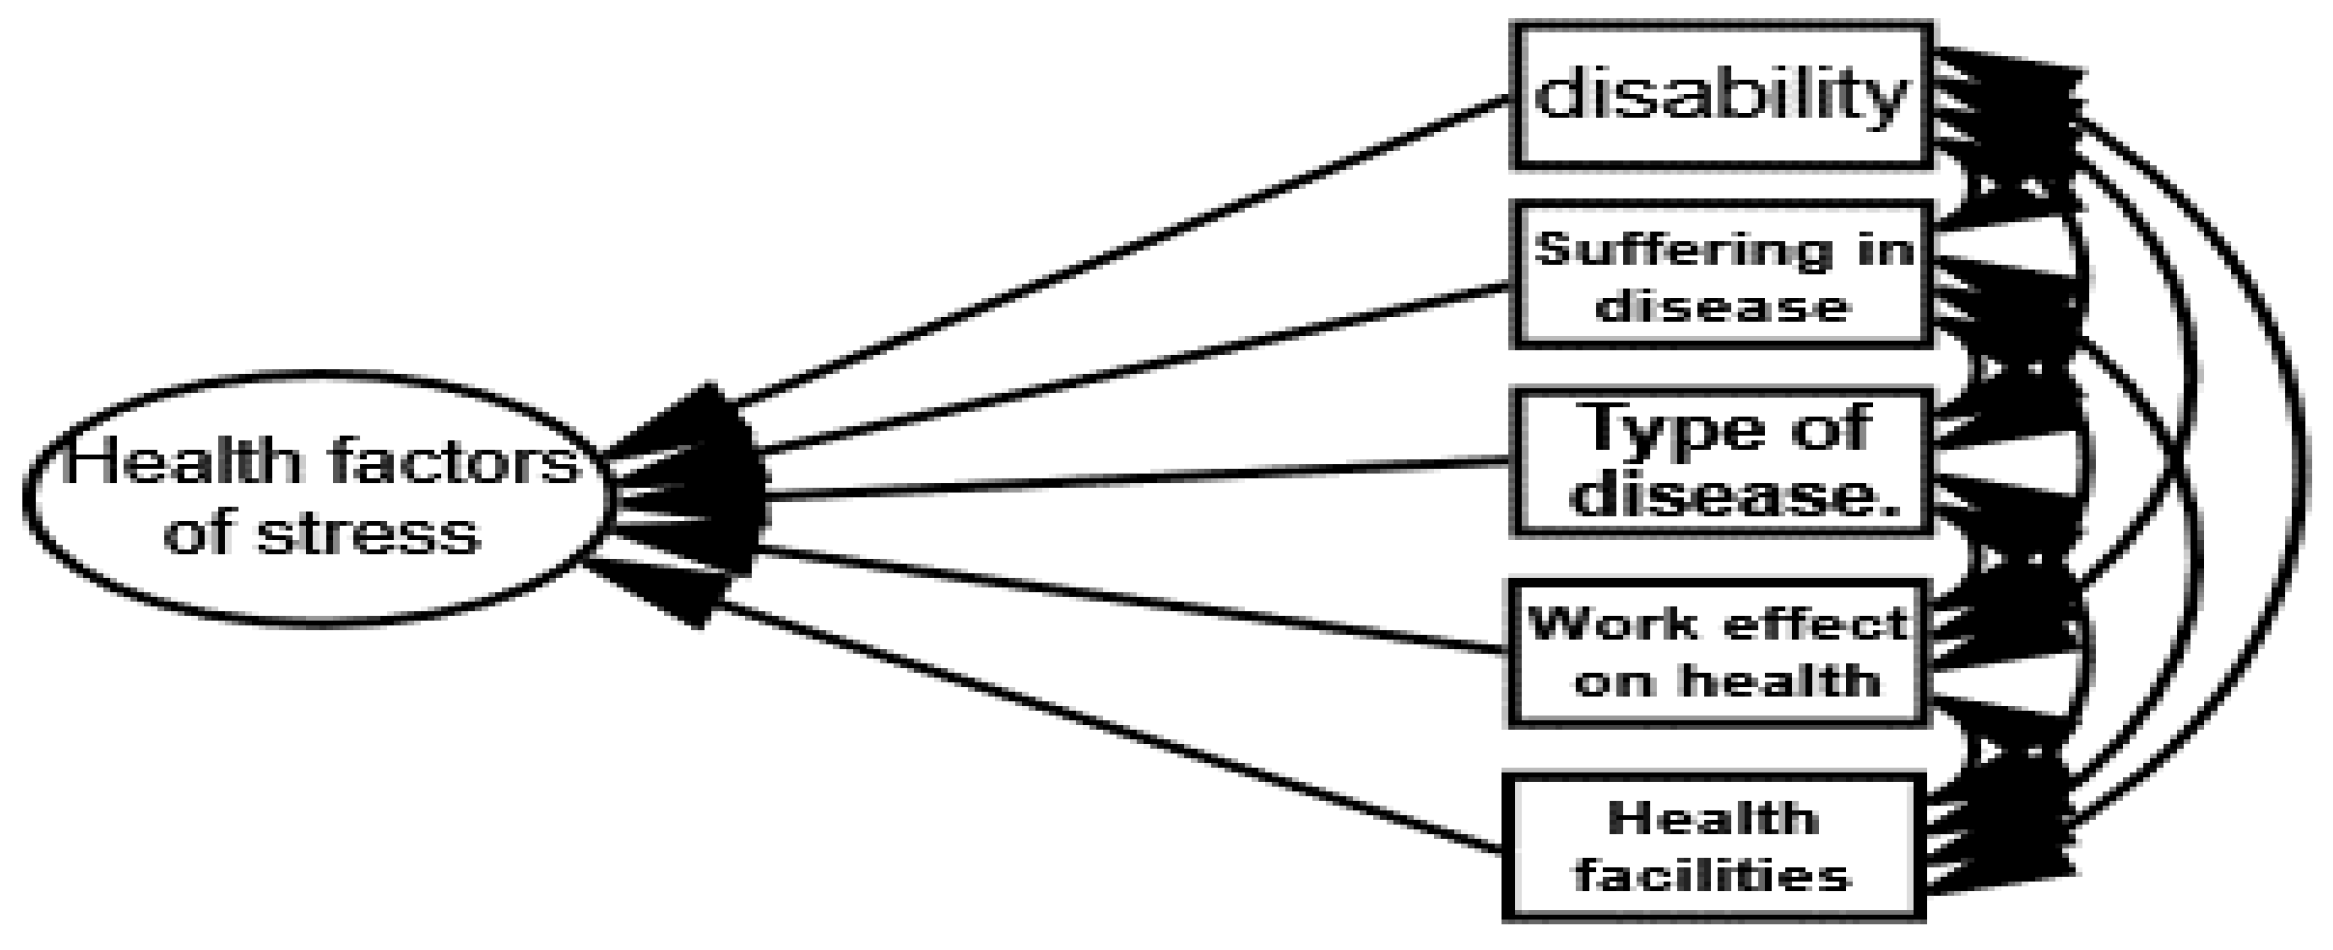
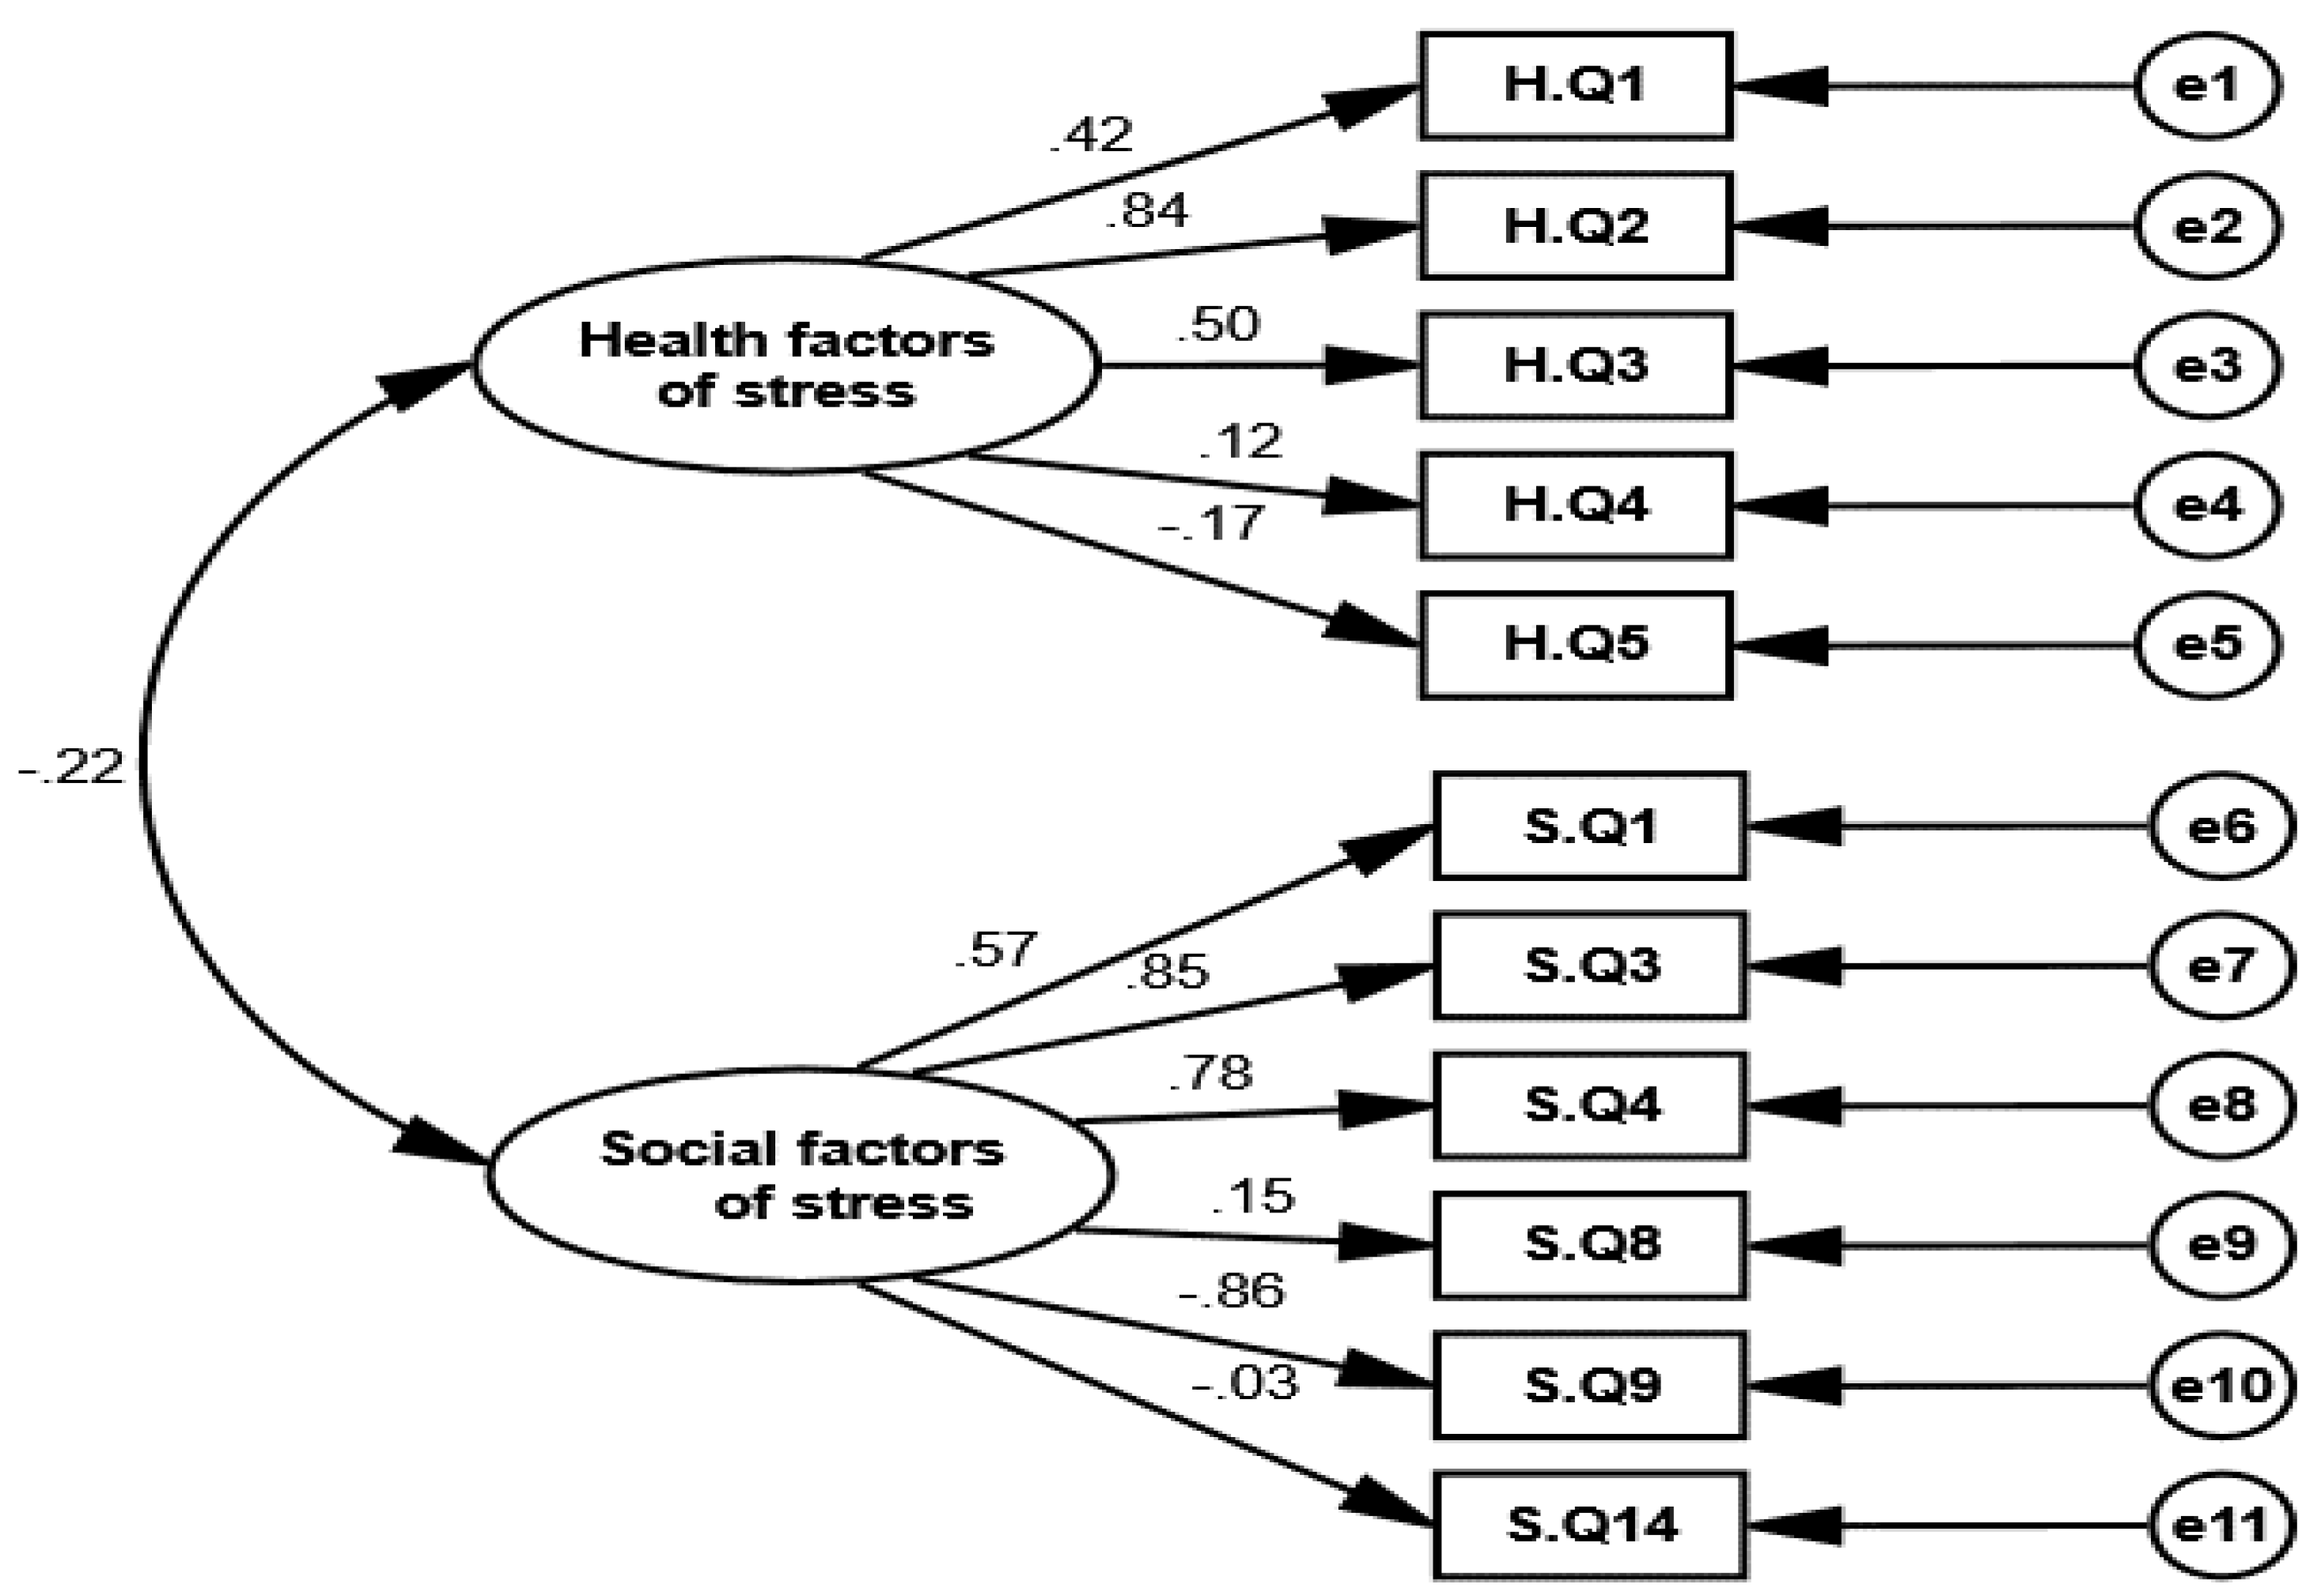
| Items of the Construct of Social and Health Factors of Stress | Questionnaire Item | Correlation Coefficients |
|---|---|---|
| H.Q1 | Do you have any disability? | 0.42 |
| H.Q2 | Do you suffer from any disease? | 0.84 |
| H.Q3 | What type of disease? | 0.50 |
| H.Q4 | Do you feel that your health is being affected by your work? | 0.12 |
| H.Q5 | Health facility provided to teacher. | −0.17 |
| S.Q1 | What is your age? | 0.57 |
| S.Q3 | What is your marital status? | 0.85 |
| S.Q4 | If married No. of children? | 0.18 |
| S.Q8 | Family setup | 0.15 |
| S.Q9 | Husband education | −0.86 |
| S.Q14 | Do you think that your teaching performance affected by the events that happen at home or in social life? | −0.03 |
| Fit Indices | Suggested | Obtained |
|---|---|---|
| Chi square | - | 152.952 |
| Degree of Freedom | - | 43 |
| Chi-square significance | p-value ≤ 0.05 | 0.000 |
| Chi-square/Degree of Freedom | <3 | 3.557 |
| GFI | >0.90 | 0.930 |
| AGFI | >0.90 | 0.893 |
| NFI | >0.90 | 0.590 |
| CFI | >0.90 | 0.654 |
| RMSEA | <0.05 | 0.080 |
| RMR | <0.1 | 0.104 |
| Do You Feel Stress Due to Your Job Requirement? | Total | |||||
|---|---|---|---|---|---|---|
| Very Often | Some Times | Some How | Never | |||
| Marital status | Single | 52 | 54 | 44 | 30 | 180 |
| 13% | 13.5% | 11.0% | 7.5% | 45% | ||
| Married | 72 | 66 | 47 | 35 | 220 | |
| 18.0% | 16.5% | 11.75% | 8.75% | 55% | ||
| Total | 124 | 120 | 91 | 65 | 400 | |
| 31% | 30% | 22.75% | 16.25% | 100.0% | ||
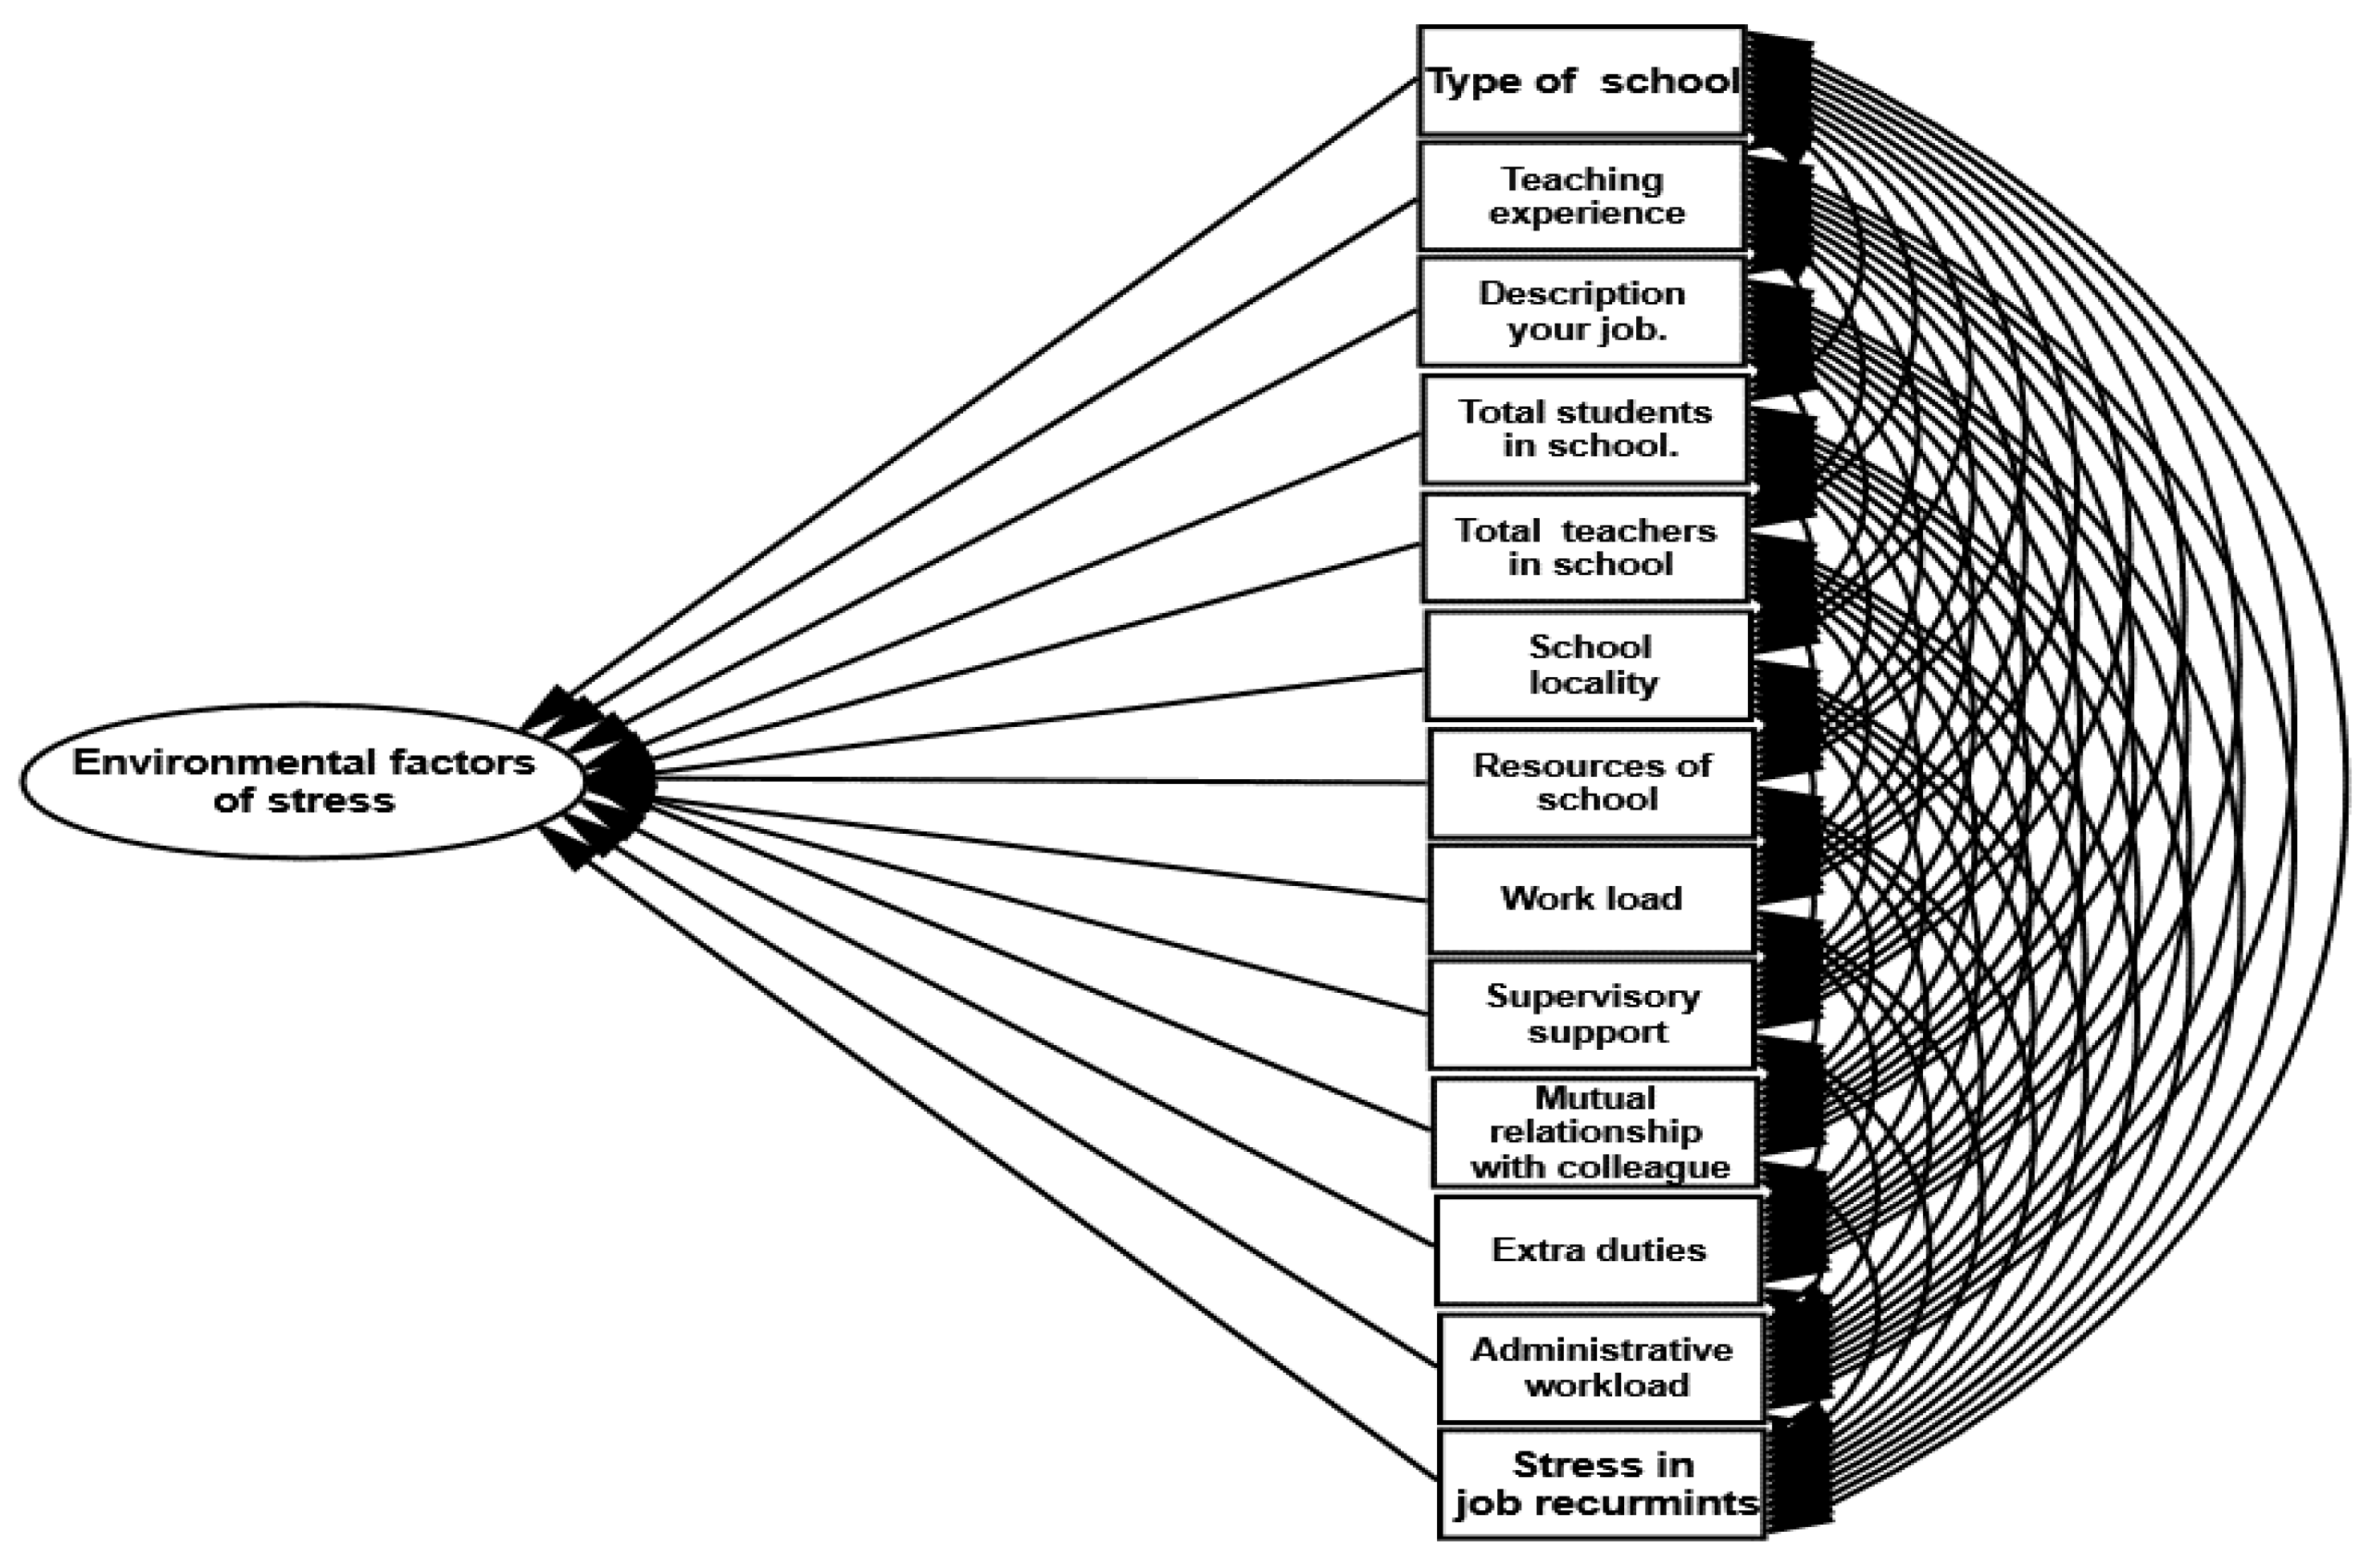
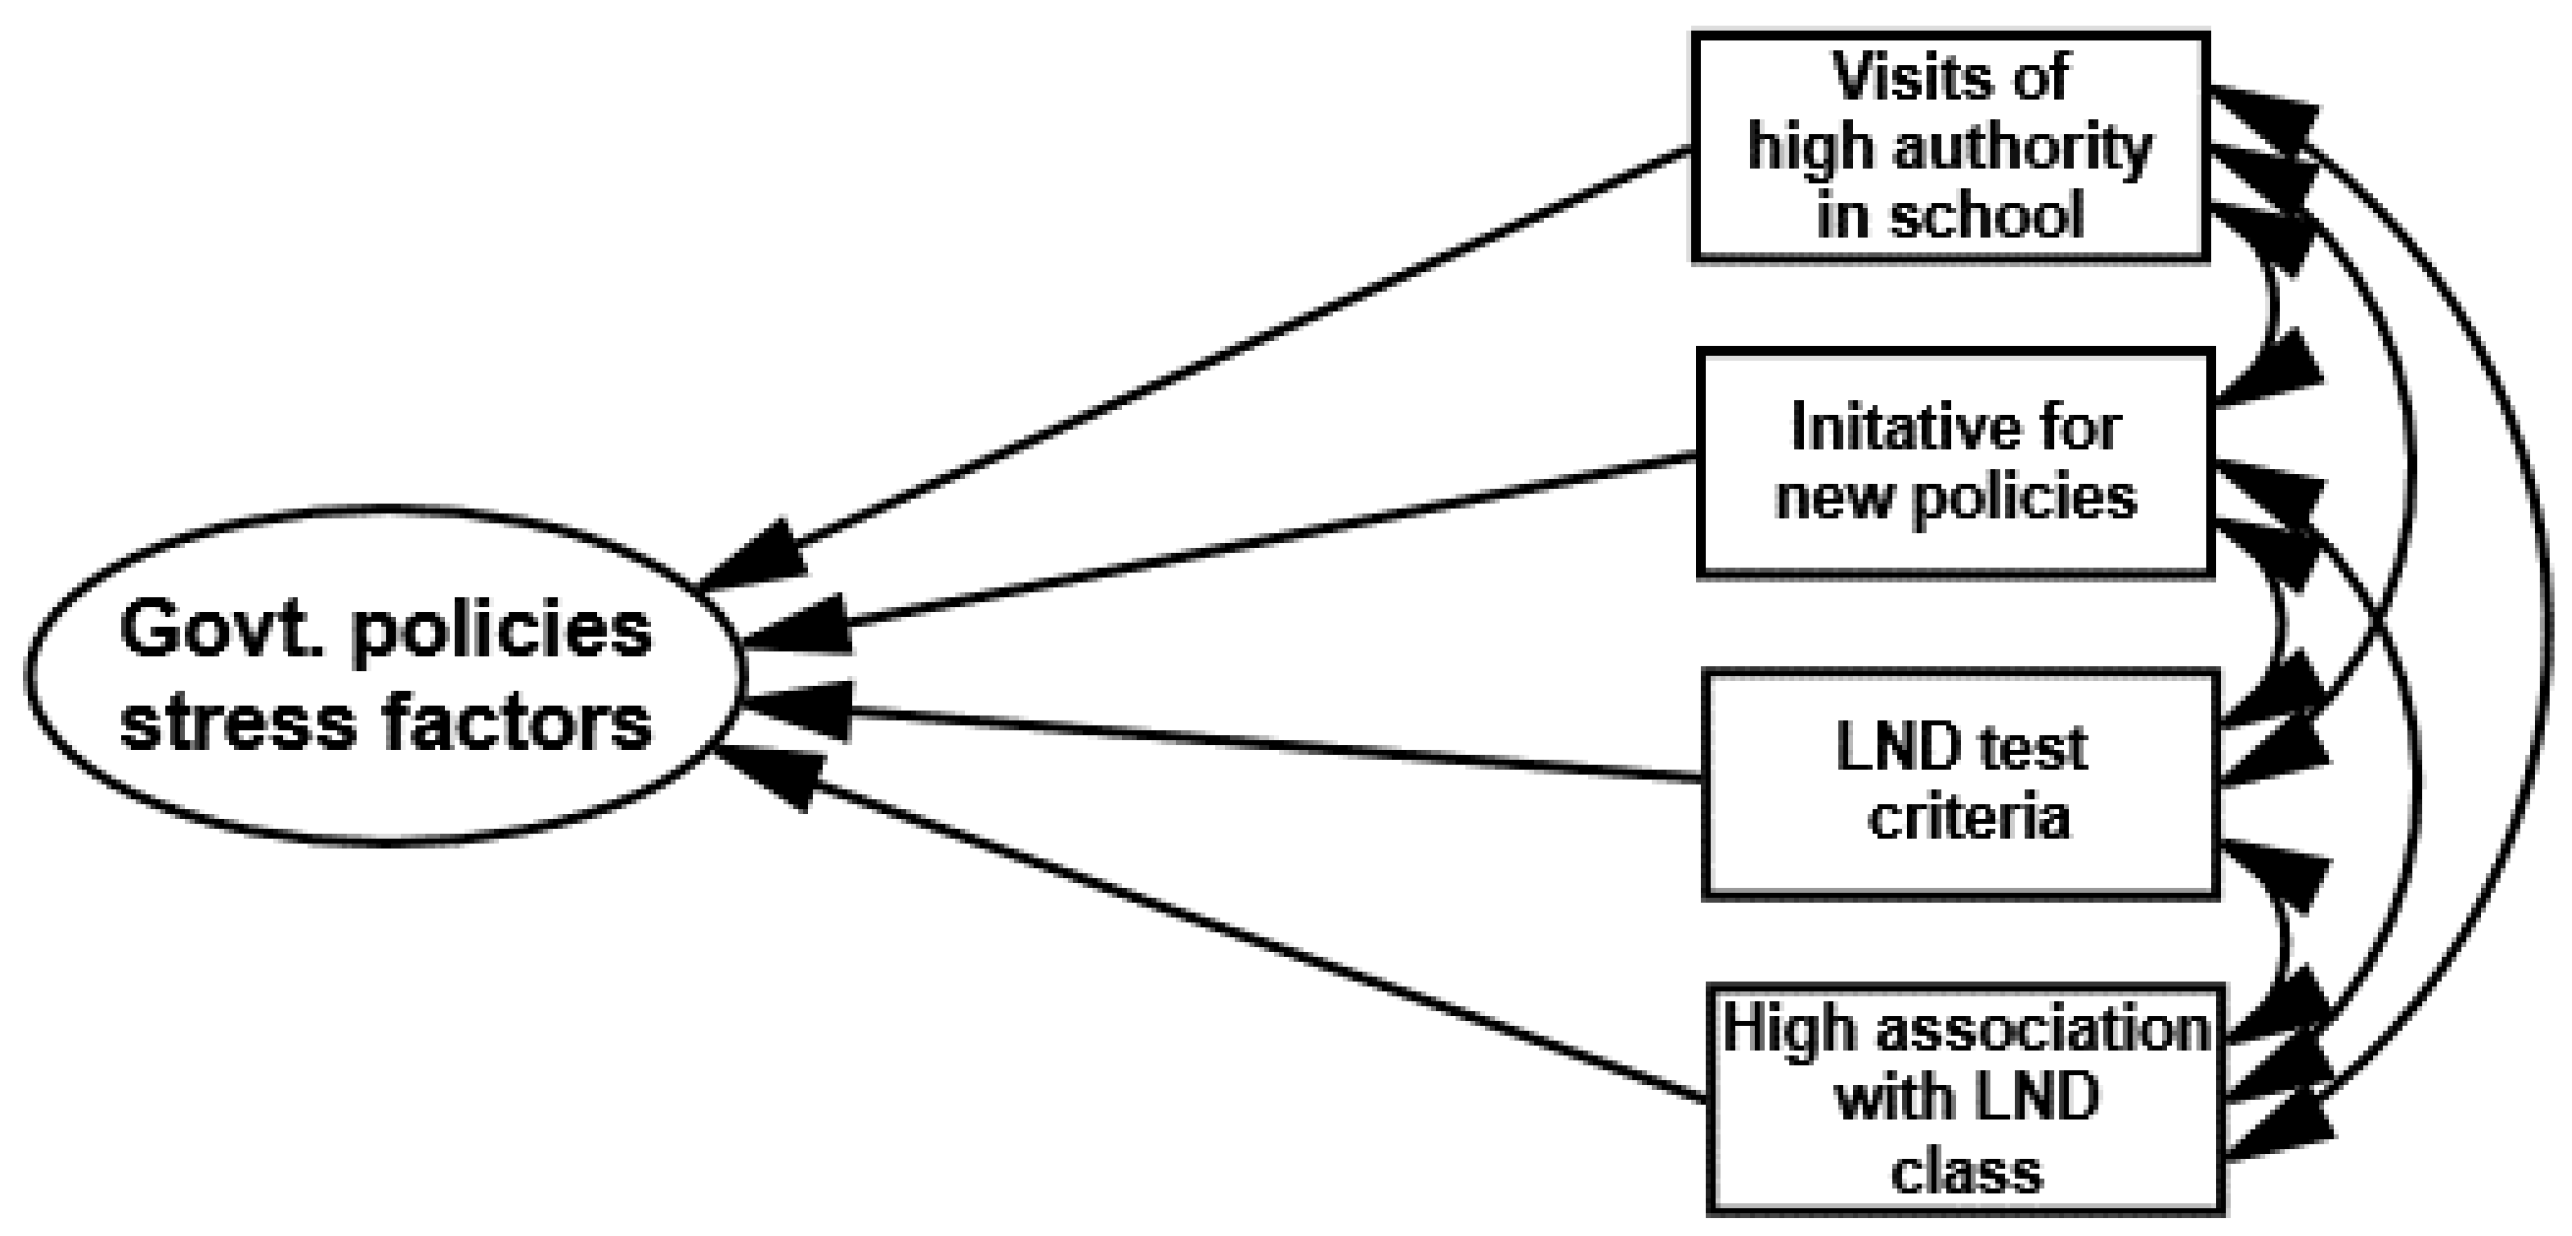
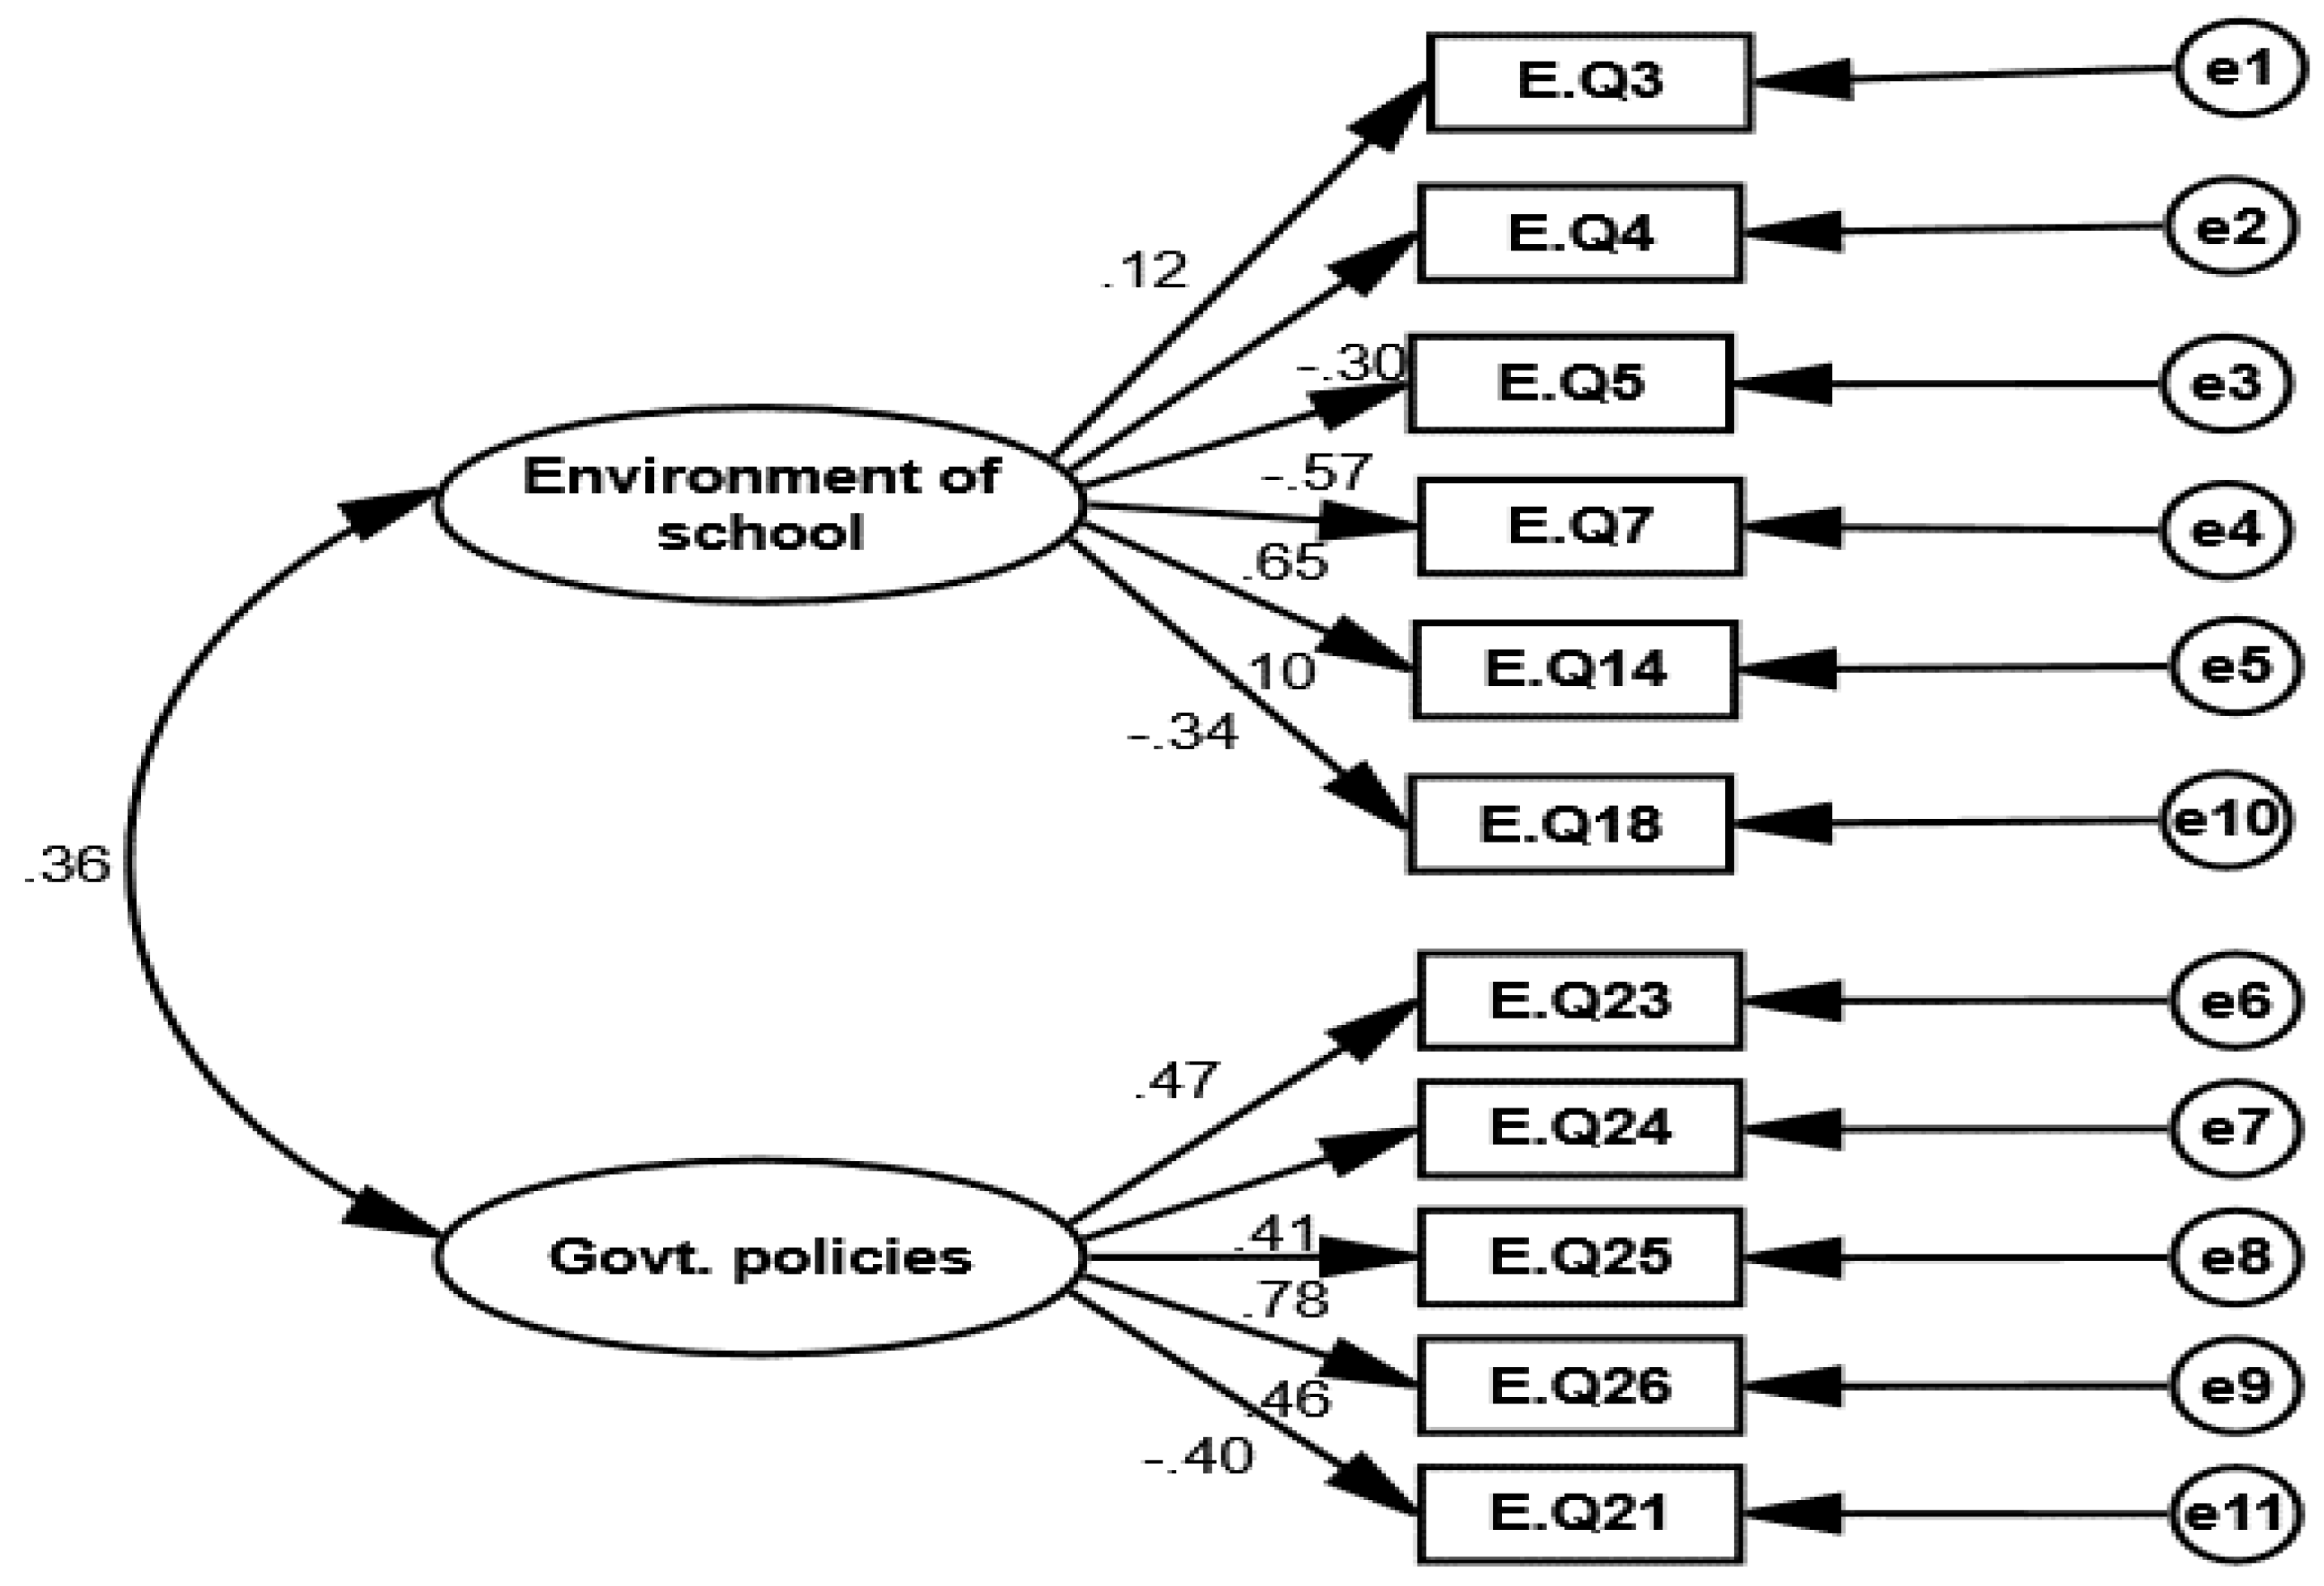
| Items of the Construct of Environmental Factors of Stress | Questionnaire Item | Correlation Coefficients |
|---|---|---|
| E.Q3 | Which title best describe your job? | 0.12 |
| E.Q4 | Total number of students in your school | −0.30 |
| E.Q5 | Total number of teachers in your school | −0.57 |
| E.Q7 | Your school in (urban area, rural area) | 0.65 |
| E.Q14 | Total number of subjects which you teach | 0.10 |
| E.Q18 | Your head behavior with you | −0.34 |
| E.Q21 | Do you perform additional administrative duties or work? | 0.47 |
| E.Q23 | Pressure to engage in CPD (continuing professional development) relevant to initiative required for documentation | 0.41 |
| E.Q24 | New emphasis on literacy and numeracy drive (LND) | 0.78 |
| E.Q25 | High degree of association with LND classes | 0.46 |
| E.Q26 | Student’s misbehavior in classroom causes a stress. | −0.40 |
| Fit Indices | Suggested | Obtained |
|---|---|---|
| Chi square | - | 187.323 |
| Degree of freedom | - | 43 |
| Chi-square significance | p-value ≤ 0.05 | 0.000 |
| Chi-square/Degree of freedom | <3 | 4.356 |
| GFI | >0.90 | 0.915 |
| AGFI | >0.90 | 0.869 |
| NFI | >0.90 | 0.420 |
| CFI | >0.90 | 0.461 |
| RMSEA | <0.05 | 0.092 |
| RMR | <0.1 | 0.096 |
© 2020 by the authors. Licensee MDPI, Basel, Switzerland. This article is an open access article distributed under the terms and conditions of the Creative Commons Attribution (CC BY) license (http://creativecommons.org/licenses/by/4.0/).
Share and Cite
Shah, M.A.A.; Mashwani, W.K.; Kumam, W.; Kumam, P.; Chesneau, C.; Jamal, F.; Ozel, G.; Sleem, H.S.; Khan, H.U. Application of Mixed Sampling to Real Life Data: A Case Study on Socio-Economic Determinants by Using SEM and CFA Techniques. Mathematics 2020, 8, 337. https://doi.org/10.3390/math8030337
Shah MAA, Mashwani WK, Kumam W, Kumam P, Chesneau C, Jamal F, Ozel G, Sleem HS, Khan HU. Application of Mixed Sampling to Real Life Data: A Case Study on Socio-Economic Determinants by Using SEM and CFA Techniques. Mathematics. 2020; 8(3):337. https://doi.org/10.3390/math8030337
Chicago/Turabian StyleShah, Muhammad Akbar Ali, Wali Khan Mashwani, Wiyada Kumam, Poom Kumam, Christophe Chesneau, Farrukh Jamal, Gamze Ozel, Hafiza Shumaila Sleem, and Hidayat Ullah Khan. 2020. "Application of Mixed Sampling to Real Life Data: A Case Study on Socio-Economic Determinants by Using SEM and CFA Techniques" Mathematics 8, no. 3: 337. https://doi.org/10.3390/math8030337
APA StyleShah, M. A. A., Mashwani, W. K., Kumam, W., Kumam, P., Chesneau, C., Jamal, F., Ozel, G., Sleem, H. S., & Khan, H. U. (2020). Application of Mixed Sampling to Real Life Data: A Case Study on Socio-Economic Determinants by Using SEM and CFA Techniques. Mathematics, 8(3), 337. https://doi.org/10.3390/math8030337