A Fuzzy Multi-Criteria Evaluation Framework for Urban Sustainable Development


Abstract
:1. Introduction
2. Urban QOL
2.1. Connotation of QOL
2.2. Composition of Urban QOL
2.3. Implementation of Urban Sustainable Development
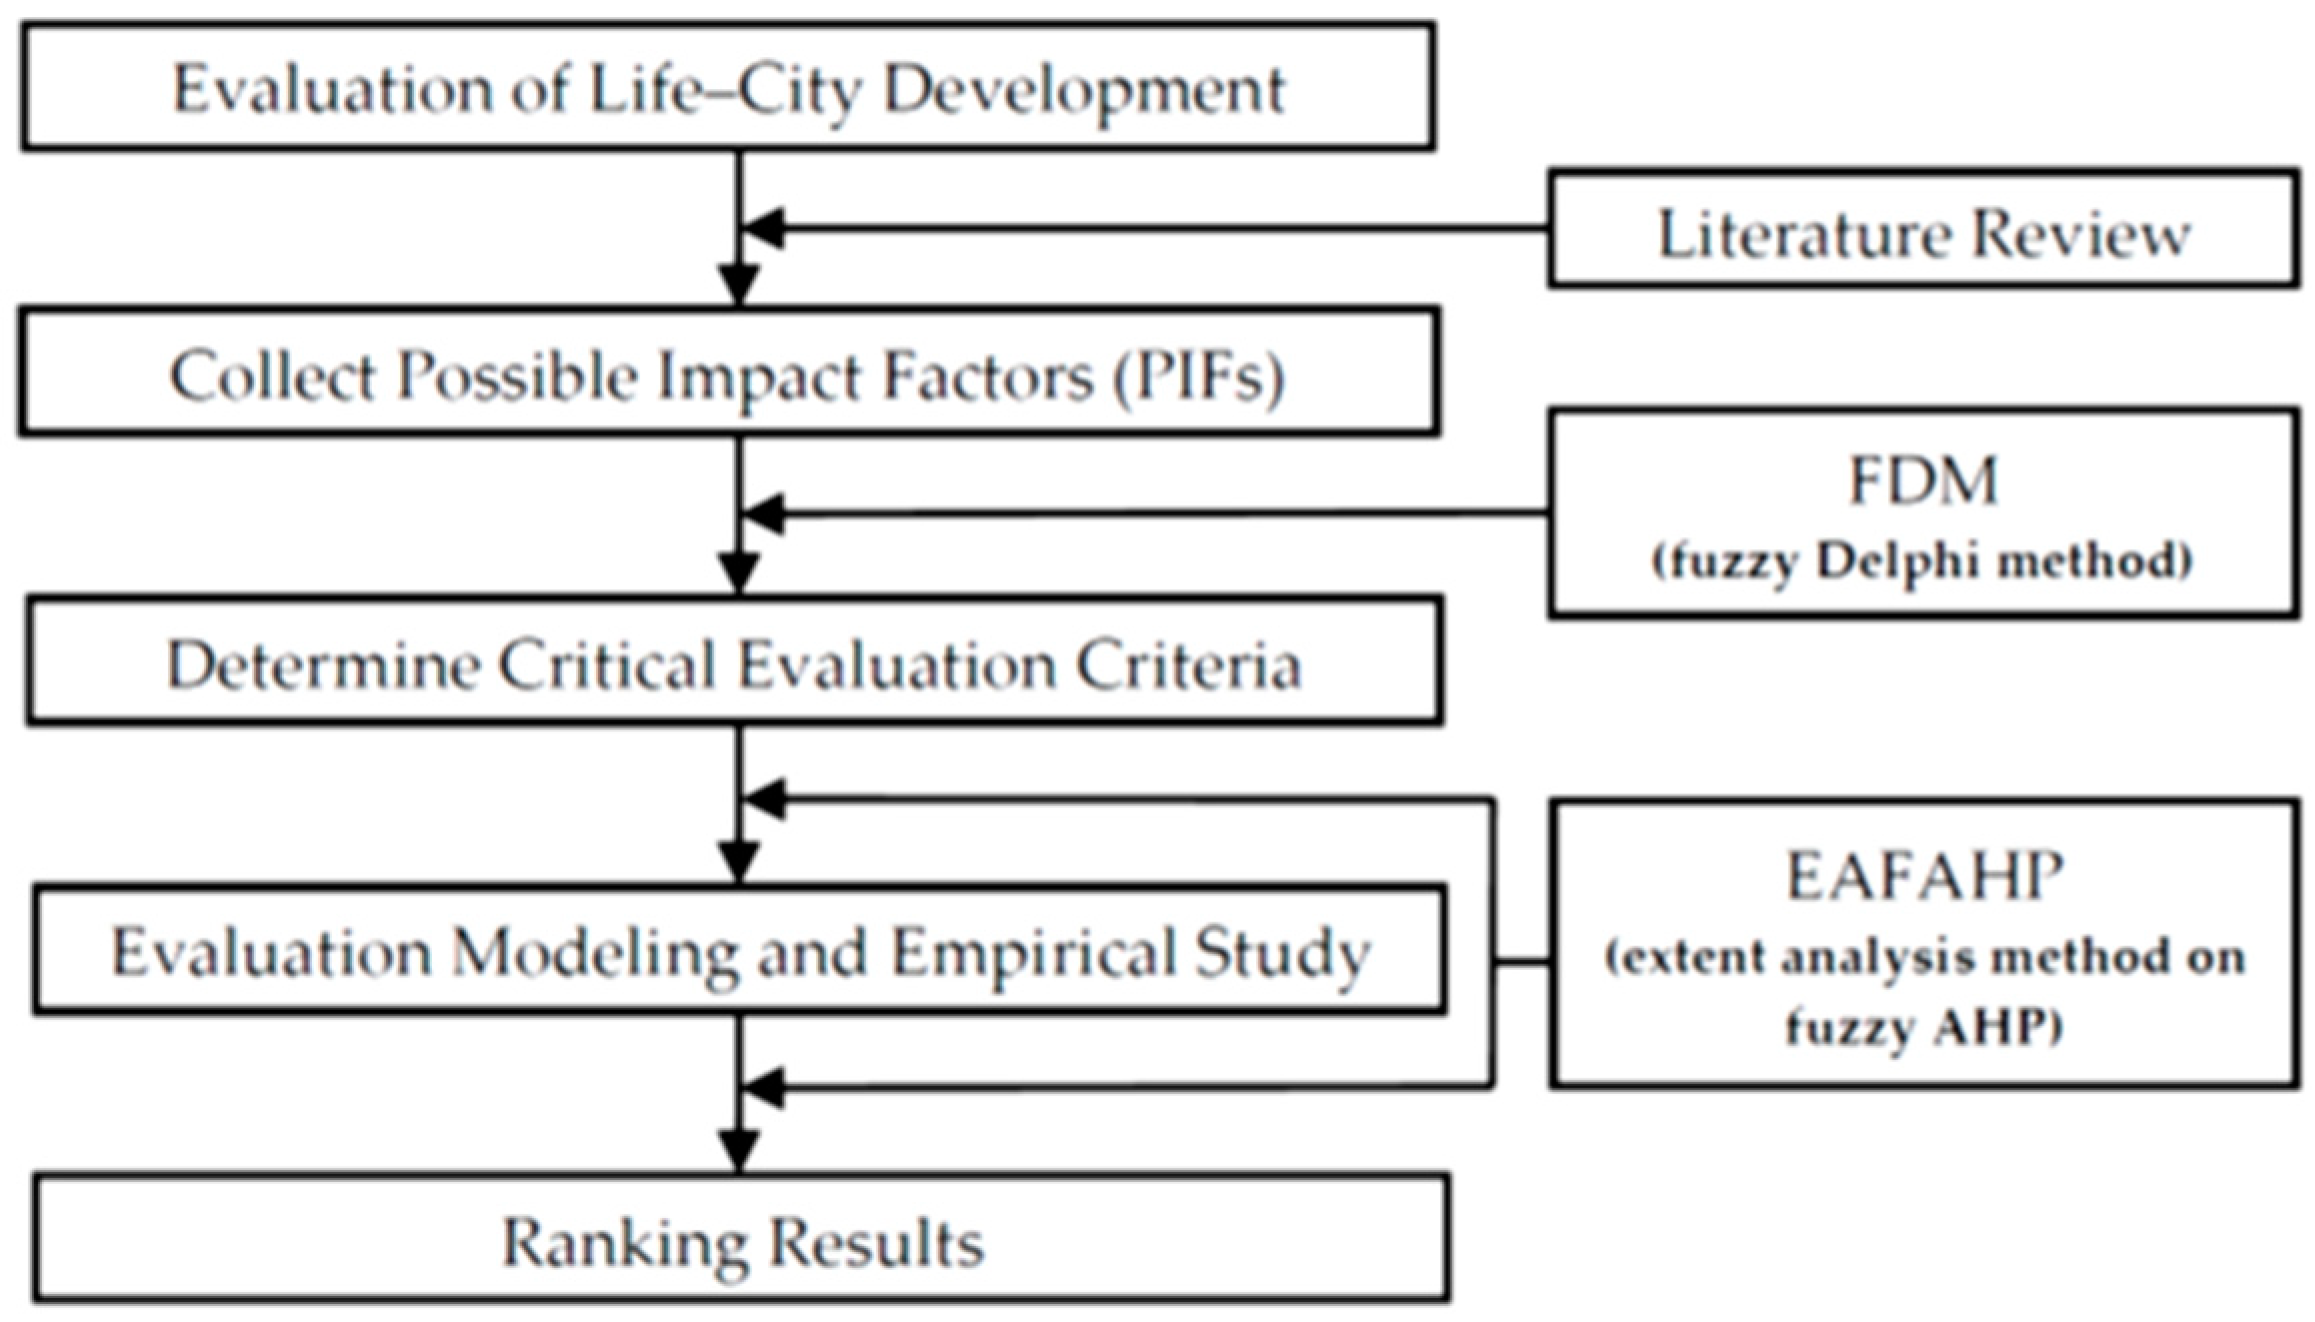
3. A FMCDA Framework for Life–City Evaluation
3.1. Fuzzy Delphi Method (FDM)
- Step 1.
- Collect all PIFs:where is a possible impact factor i.
- Step 2.
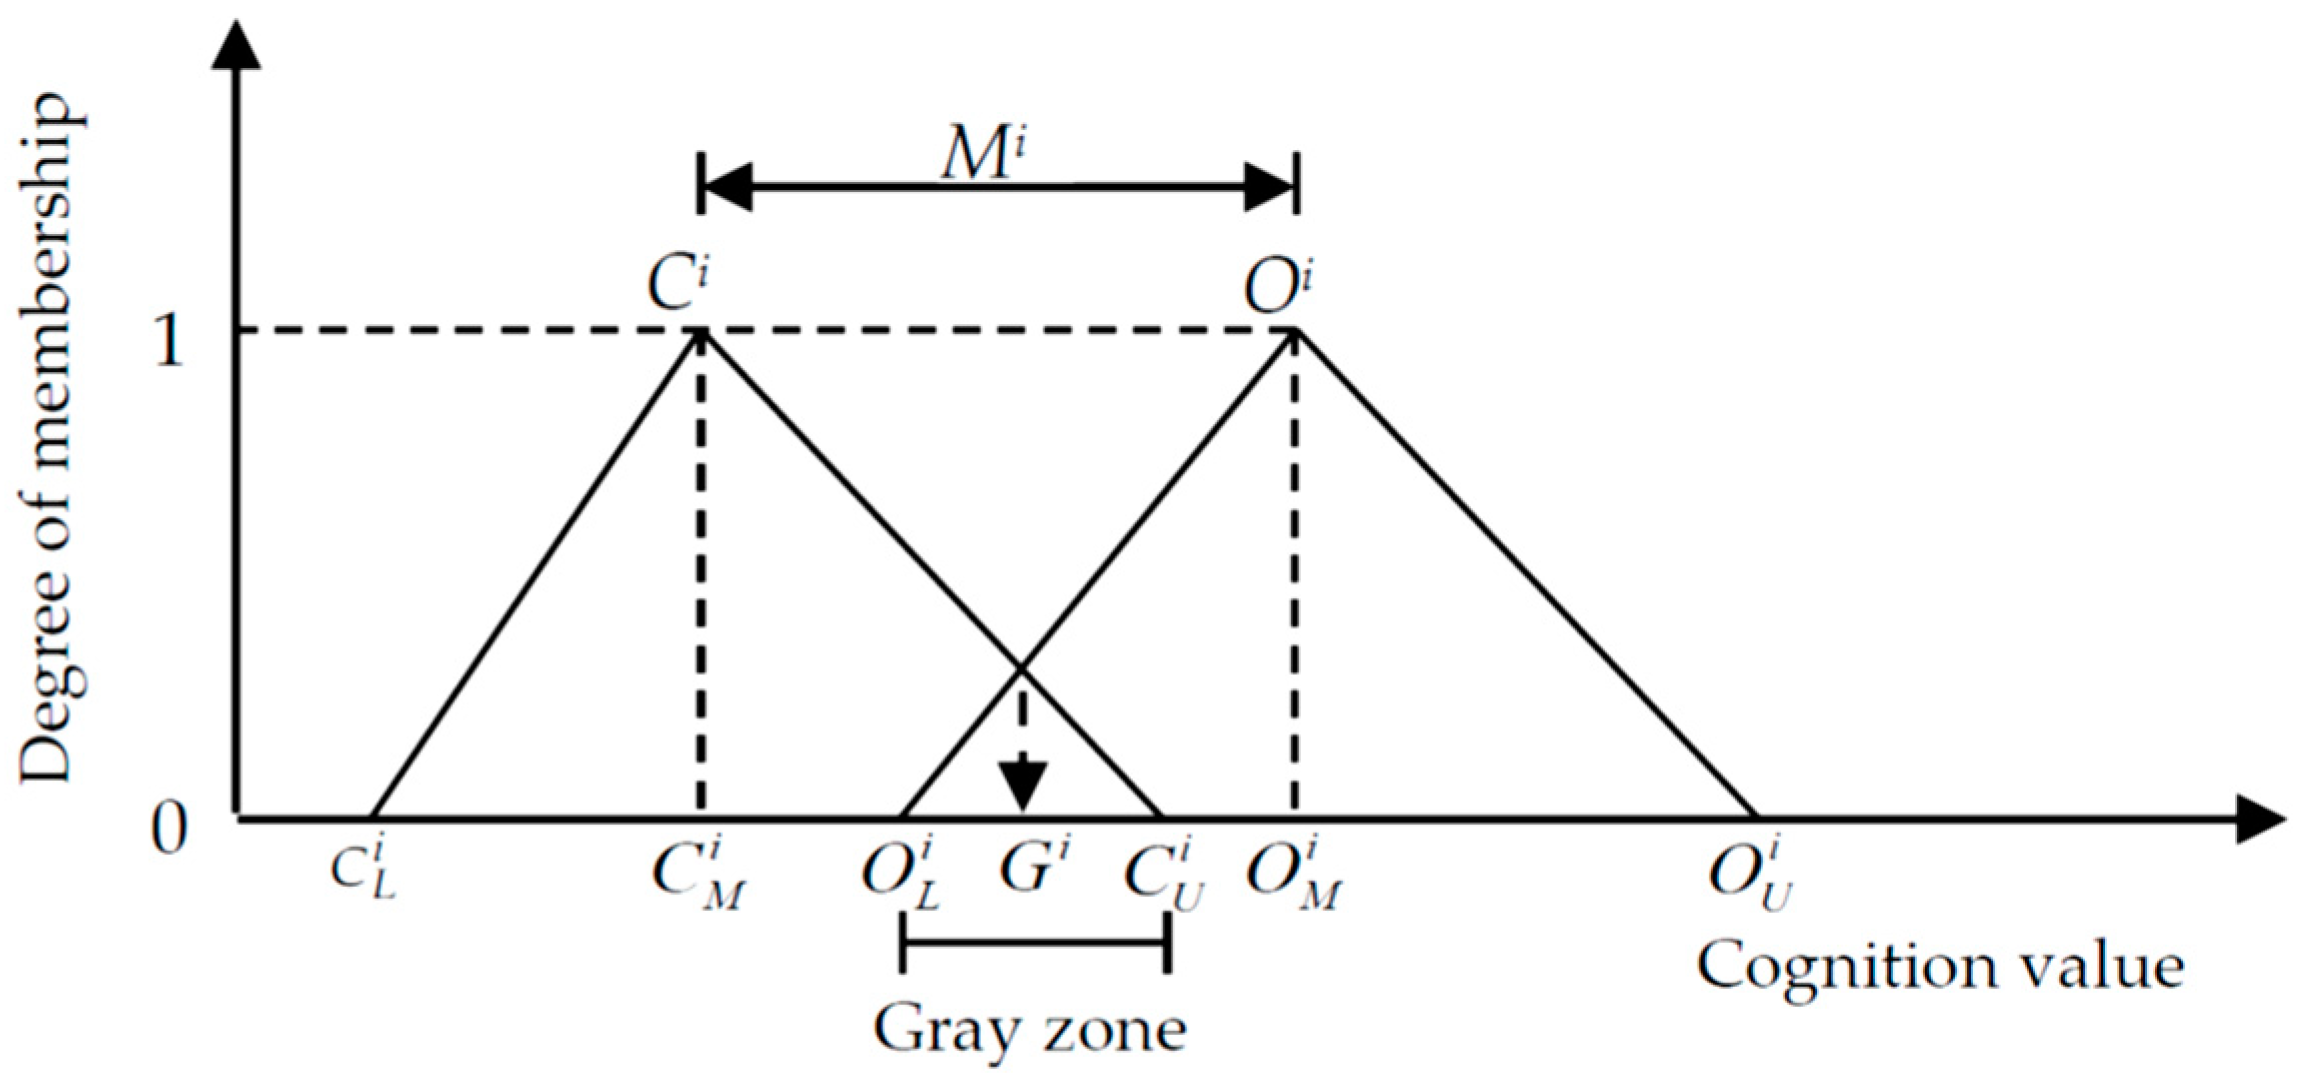
- Collect the estimated score of each factor ui from each expert. The score is denoted as by T experts, . is the lowest score of the tth expert to the ith factor, called “the most conservative cognition value”; is the highest score, called “the most optimistic cognition value,” and both and are in a range from 1 to 10 [73,75].
- Step 3.
- Calculate the minimum values, the geometric mean, and the maximum values of and for each factor. A group average is calculated for both and , and any value outside of two standard deviations is eliminated [74]. Next, calculate the minimum (), the geometric mean (GM) (), and the maximum () of ().
- Step 4.
- Step 5.
- (1)
- (2)
- (a)
- If , where and , is calculated using Equations (2) and (3), where is the membership function of the TFN, which is the intersection of Ci and Oi:
- (b)
- If , there are discrepancies between the experts’ opinions. Repeat Steps 2 to 5 until a convergence is reached.
3.2. Extent Analysis Method on Fuzzy AHP (EAFAHP)
- 1.
- Addition:
- 2.
- Multiplication:
- 3.
- Any real number:
- 4.
- Reciprocal:(l1, m1, u1)−1 ≈ (1/u1, 1/m1, 1/l1)
- Step 1:
- Step 2:
- Construct the fuzzy judgment matrix (A) by fuzzy pairwise comparison from T experts. For some factors of the (k-1)th level, there are m related factors in the kth level. When these m factors are fuzzy pairwise compared, a fuzzy judgment matrix is obtained:
- Step 3:
- Calculate the fuzzy synthetic extent value () of the (k-1)th level by integrating the fuzzy m extent analysis values of the kth level () from T experts:
- Step 4:
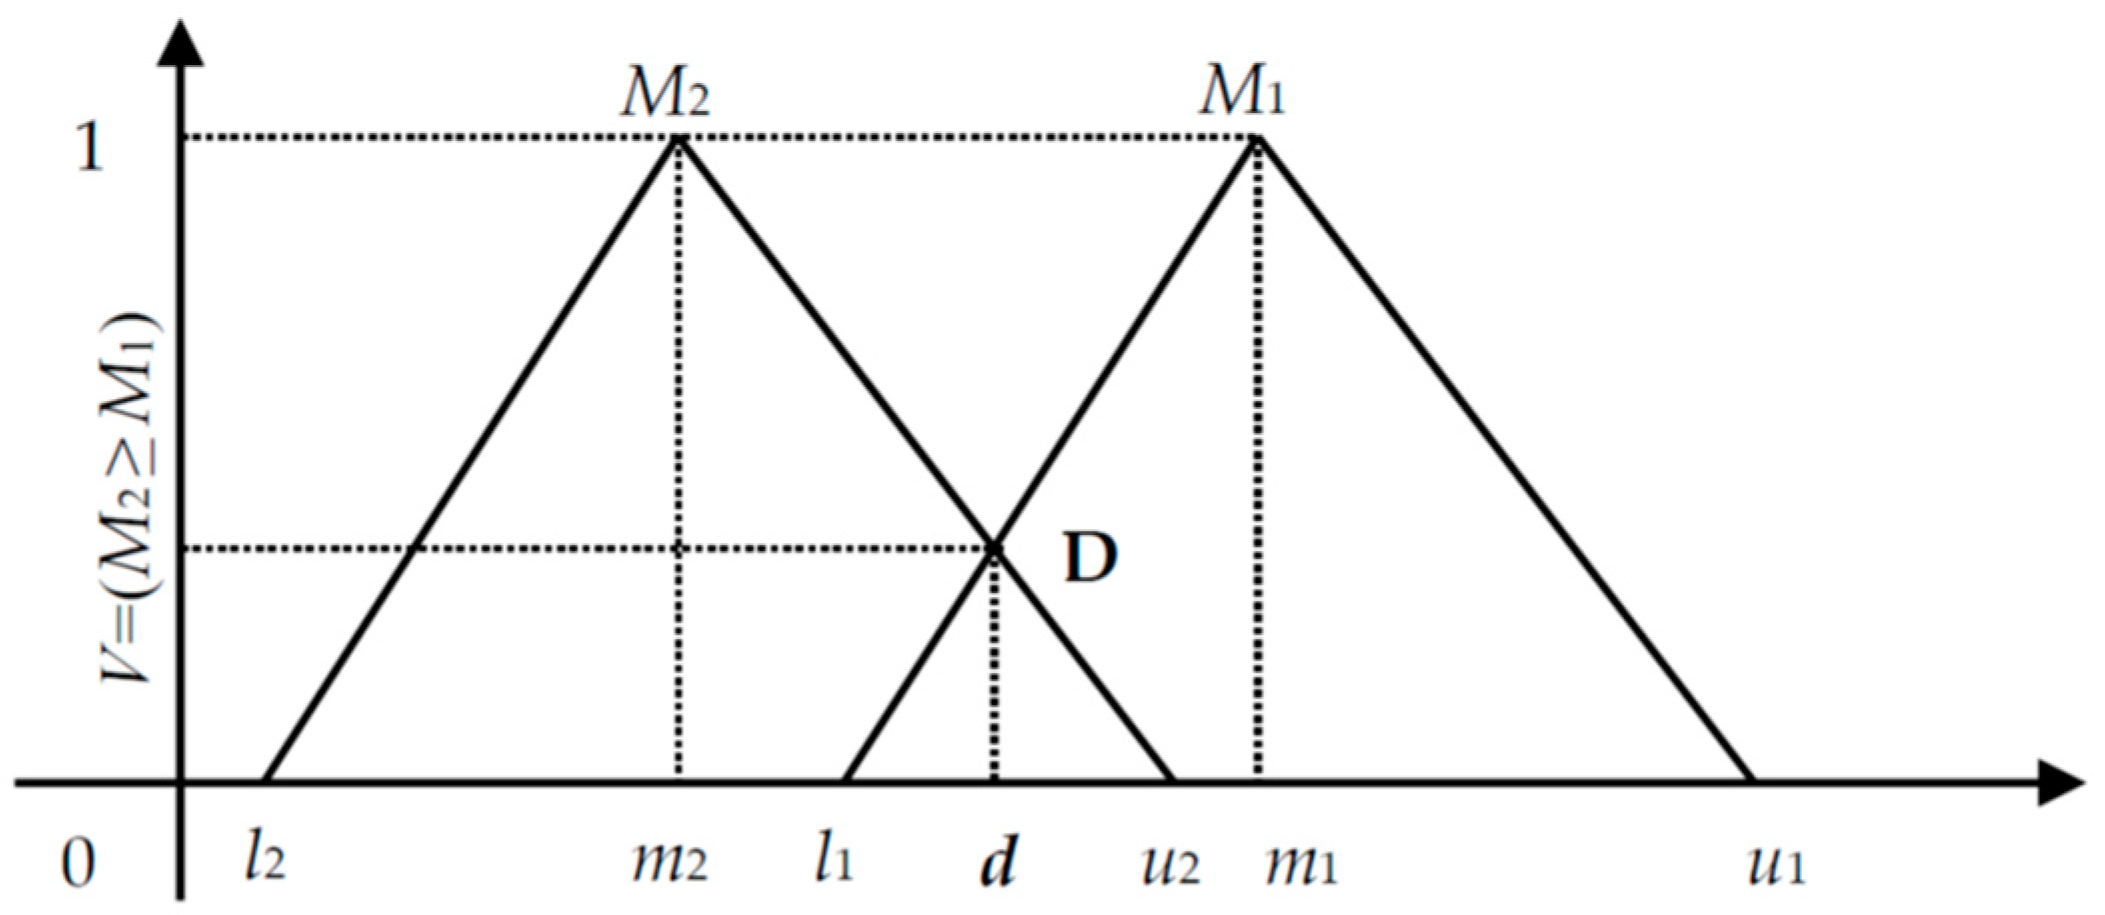
- Calculate the degree of possibility— of . The degree of possibility of M2 = (l2, m2, u2) ≥ M1 = (l1, m1, u1) is defined asand it can be equivalently expressed as follows:where d is the ordinate of the highest intersection point D between (Figure 3).
- Step 5:
- Calculate the weight vector (W) of each evaluation criterion by min V (M ≥ Mi) and normalization. The degree of possibility for a convex fuzzy number to be greater than k convex fuzzy numbers Mi (i = 1, 2, …, k) can be defined byV (M ≥ M1, M2, …, Mk) = V [(M ≥ M1) and (M ≥ M2) and … and (M ≥ Mk)] = min V (M ≥ Mi), i = 1, 2, …, kThere are n evaluation criteria, denoted as Ai (i = 1, 2, …, n). Assume thatd’ (Ai) = min V (Si ≥ Sk) for k = 1, 2, …, n; k ≠ i.Then, the weight vector (W) is given byW’ = (d’ (A1), d’ (A2), …, d’ (An))TThe final weight vector (W) is obtained by normalization:W = (d (A1), d (A2), …, d (An))T
- Step 6:
- Evaluate and rank the performances of the alternatives. The priorities of the alternatives could be derived from repeating Step 2 to Step 5.
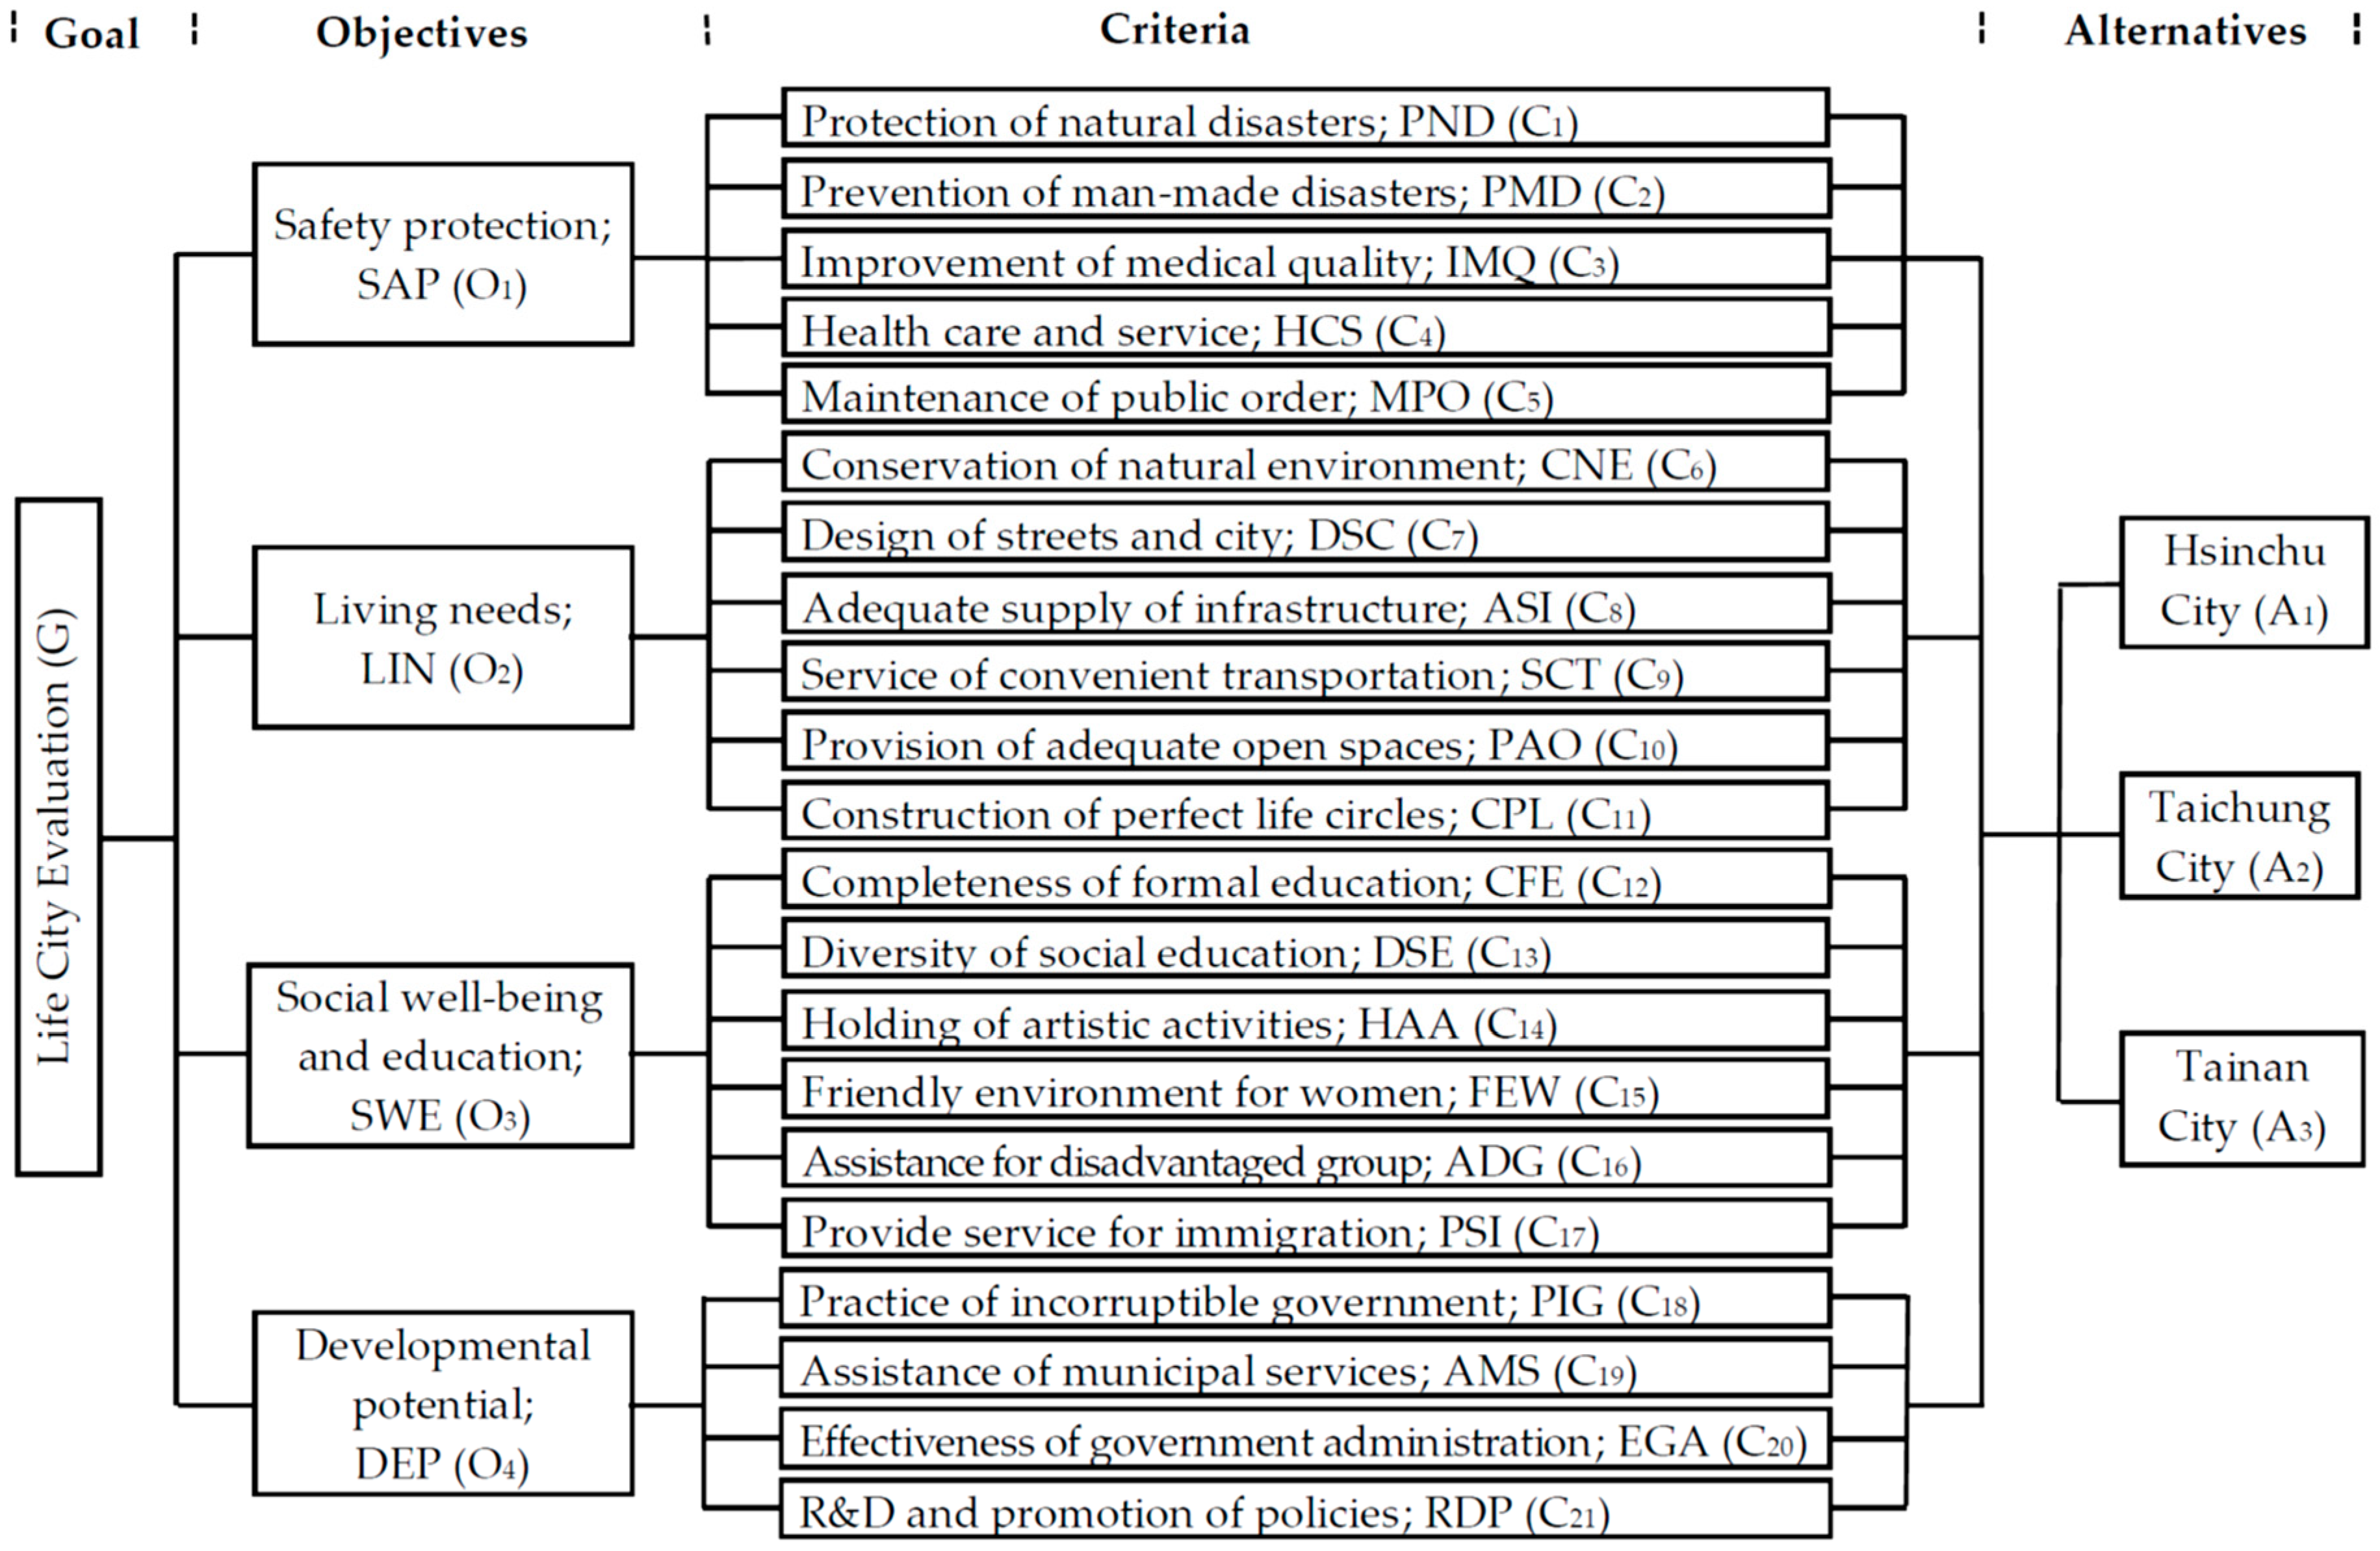
4. Empirical Study and Results
4.1. Materials
4.2. Results and Analysis
5. Conclusions
Author Contributions
Funding
Conflicts of Interest
References
- Marans, R.W. Quality of urban life & environmental sustainability studies: Future linkage opportunities. Habitat Int. 2015, 45, 47–52. [Google Scholar] [CrossRef]
- Bakar, A.H.A.; Cheen, K.S. A framework for assessing the sustainable urban development. Proced. Soc. Behav. Sci. 2013, 85, 484–492. [Google Scholar] [CrossRef] [Green Version]
- Zhang, X.; Hes, D.; Wu, Y.; Hafkamp, W.; Lu, W.; Bayulken, B.; Schnitzer, H.; Li, F. Catalyzing sustainable urban transformations towards smarter, healthier cities through urban ecological infrastructure, regenerative development, eco towns and regional prosperity. J. Clean. Prod. 2016, 122, 2–4. [Google Scholar] [CrossRef] [Green Version]
- Turkoglu, H. Sustainable development and quality of urban life. Proced. Soc. Behav. Sci. 2015, 202, 10–14. [Google Scholar] [CrossRef] [Green Version]
- De Leeuw, E. Global and local (glocal) health: The WHO healthy cities programme. Glob. Chang. Hum. Health 2001, 2, 34–45. [Google Scholar] [CrossRef]
- Roseland, M. Dimensions of the eco-city. Cities 1997, 14, 197–202. [Google Scholar] [CrossRef]
- Flynn, A.; Yu, L.; Feindt, P.; Chen, C. Eco-cities, governance and sustainable lifestyles: The case of the Sino-Singapore Tianjin Eco-City. Habitat Int. 2016, 53, 78–86. [Google Scholar] [CrossRef]
- Latif, S.A.; Bidin, Y.H.; Awang, Z. Towards the realization of green cities: The moderating role of the residents’ education level. Proced. Soc. Behav. Sci. 2013, 85, 646–652. [Google Scholar] [CrossRef] [Green Version]
- Meijering, J.V.; Kern, K.; Tobi, H. Identifying the methodological characteristics of European green city rankings. Ecol. Indic. 2014, 43, 132–142. [Google Scholar] [CrossRef]
- Desouza, K.C.; Flanery, T.H. Designing, planning, and managing resilient cities: A conceptual framework. Cities 2013, 35, 89–99. [Google Scholar] [CrossRef]
- Pickett, S.T.A.; Cadenasso, M.L.; Grove, J.M. Resilient cities: Meaning, models, and metaphor for integrating the ecological, socio-economic, and planning realms. Landsc. Urban Plan. 2004, 69, 369–384. [Google Scholar] [CrossRef]
- Angelidou, M. Smart cities: A conjuncture of four forces. Cities 2015, 47, 95–106. [Google Scholar] [CrossRef]
- Walravens, N. Mobile city applications for Brussels citizens: Smart City trends, challenges and a reality check. Telemat. Inform. 2015, 32, 282–299. [Google Scholar] [CrossRef]
- Alessandria, F. Inclusive city, strategies, experiences and guidelines. Proced. Soc. Behav. Sci. 2016, 223, 6–10. [Google Scholar] [CrossRef] [Green Version]
- Gutberlet, J. More inclusive and cleaner cities with waste management co-production: Insights from participatory epistemologies and methods. Habitat Int. 2015, 46, 234–243. [Google Scholar] [CrossRef]
- Hunt, D.V.L.; Makana, L.O.; Jefferson, I.; Rogers, C.D.F. Liveable cities and urban underground space. Tunn. Undergr. Space Technol. 2016, 55, 8–20. [Google Scholar] [CrossRef]
- Taniguchi, E. Concepts of city logistics for sustainable and liveable cities. Proced. Soc. Behav. Sci. 2014, 151, 310–317. [Google Scholar] [CrossRef] [Green Version]
- Barton, H.; Grant, M. Urban Planning for Healthy Cities: A Review of the Progress of the European Healthy Cities Programme. J. Urban Health Bull. N. Y. Acad. Med. 2011, 90, S129–S141. [Google Scholar] [CrossRef] [Green Version]
- Wei, Y.; Huang, C.; Lam, P.T.I.; Yuan, Z. Sustainable urban development: A review on urban carrying capacity assessment. Habitat Int. 2015, 46, 64–71. [Google Scholar] [CrossRef]
- Ge, J.; Hokao, K. Research on residential lifestyles in Japanese cities from the viewpoints of residential preference, residential choice and residential satisfaction. Landsc. Urban Plan. 2006, 78, 165–178. [Google Scholar] [CrossRef]
- Kahrik, A.; Temelova, J.; Kadarik, K.; Kubes, J. What attracts people to inner city areas? The cases of two post-socialist cities in Estonia and the Czech Republic. Urban Stud. 2016, 53, 355–372. [Google Scholar] [CrossRef]
- Węziak-Białowolska, D. Quality of life in cities—Empirical evidence in comparative European perspective. Cities 2016, 58, 87–96. [Google Scholar] [CrossRef]
- Morais, P.; Camanho, A.S. Evaluation of performance of European cities with the aim to promote quality of life improvements. Omega 2011, 39, 398–409. [Google Scholar] [CrossRef] [Green Version]
- European Commission Expert Group on the Urban Environment. European Sustainable Cities: Report; European Commission: Brussels, Belgium, 1996. [Google Scholar]
- Deakin, M.; Reid, A. Sustainable urban development: Use of the environmental assessment methods. Sustain. Cities Soc. 2014, 10, 39–48. [Google Scholar] [CrossRef]
- De Leeuw, E. Evaluating WHO healthy cities in europe: Issues and perspectives. J. Urban Health Bull. N. Y. Acad. Med. 2012, 90, S14–S22. [Google Scholar] [CrossRef] [Green Version]
- Hogan, M.J.; Leyden, K.M.; Conway, R.; Goldberg, A.; Walsh, D.; McKenna-Plumley, P.E. Happiness and health across the lifespan in five major cities: The impact of place and government performance. Soc. Sci. Med. 2016, 162, 168–176. [Google Scholar] [CrossRef]
- Keles, R. The quality of life and the environment. Proced. Soc. Behav. Sci. 2012, 35, 23–32. [Google Scholar] [CrossRef] [Green Version]
- Khalil, H.A.E.E. Enhancing quality of life through strategic urban planning. Sustain. Cities Soc. 2012, 5, 77–86. [Google Scholar] [CrossRef]
- Van Kamp, I.; Leidelmeijer, K.; Marsman, G.; De Hollander, A. Urban environmental quality and human well-being: Towards a conceptual framework and demarcation of concepts; a literature study. Landsc. Urban Plan. 2003, 65, 5–18. [Google Scholar] [CrossRef]
- UNDPCSD UN Department of Policy Co-ordination and Sustainable Development. Work Programme on Indicators of Sustainable Development; United Nations: New York, NY, USA, 1995. [Google Scholar]
- Bonaiuto, M.; Fornara, F.; Ariccio, S.; Cancellieri, U.G.; Rahimi, L. Perceived Residential Environment Quality Indicators (PREQIs) relevance for UN-HABITAT City Prosperity Index (CPI). Habitat Int. 2015, 45, 53–63. [Google Scholar] [CrossRef]
- Joseph, M.; Wang, F.; Wang, L. GIS-based assessment of urban environmental quality in Port-au-Prince, Haiti. Habitat Int. 2014, 41, 33–40. [Google Scholar] [CrossRef]
- Lee, Y.J. Subjective quality of life measurement in Taipei. Build. Environ. 2008, 43, 1205–1215. [Google Scholar] [CrossRef]
- Spangenberg, J.H.; Pfahl, S.; Deller, K. Towards indicators for institutional sustainability: Lessons from an analysis of Agenda 21. Ecol. Indic. 2002, 2, 61–77. [Google Scholar] [CrossRef]
- Sustainable Seattle. Available online: http://www.sustainableseattle.org (accessed on 12 March 2018).
- Cananzi, D.M. City, Nature, Culture. New way of living sociability (the case of Reggio Calabria). Proced. Soc. Behav. Sci. 2016, 223, 745–749. [Google Scholar] [CrossRef] [Green Version]
- Ietto, F.; Salvo, F.; Cantasano, N. The quality of life conditioning with reference to the local environmental management: A pattern in Bivona country (Calabria, Southern Italy). Ocean Coast. Manag. 2014, 102, 340–349. [Google Scholar] [CrossRef] [Green Version]
- Arifwidodo, S.D. Exploring the effect of compact development policy to urban quality of life in Bandung, Indonesia. City Cult. Soc. 2012, 3, 303–311. [Google Scholar] [CrossRef]
- Bayulken, B.; Huisingh, D. Perceived ‘Quality of Life’ in eco-developments and in conventional residential settings: An explorative study. J. Clean. Prod. 2015, 98, 253–262. [Google Scholar] [CrossRef]
- Li, D.F. An approach to fuzzy multiattribute decision making under uncertainty. Inf. Sci. 2005, 169, 97–112. [Google Scholar] [CrossRef]
- Yager, R.R. Uncertainty modeling using fuzzy measures. Knowl. Based Syst. 2016, 92, 1–8. [Google Scholar] [CrossRef]
- Beşikçi, E.B.; Kececi, T.; Arslan, O.; Turan, O. An application of fuzzy-AHP to ship operational energy efficiency measures. Ocean Eng. 2016, 121, 392–402. [Google Scholar] [CrossRef] [Green Version]
- Chen, J.F.; Hsieh, H.N.; Do, Q.H. Evaluating teaching performance based on fuzzy AHP and comprehensive evaluation approach. Appl. Soft Comput. 2015, 28, 100–108. [Google Scholar] [CrossRef]
- Lee, A.H.I.; Kang, H.Y.; Hsu, C.F.; Hung, H.C. A green supplier selection model for high-tech industry. Expert Syst. Appl. 2009, 36, 7917–7927. [Google Scholar] [CrossRef]
- Wang, C.Y. Evaluation of sports center performance using a fuzzy multi-criteria decision-making model. J. Test. Eval. 2015, 43, 1372–1382. [Google Scholar] [CrossRef]
- Chang, D.Y. Application of the extent analysis method on fuzzy AHP. Eur. J. Op. Res. 1996, 95, 649–655. [Google Scholar] [CrossRef]
- Büyüközkan, G.; Kahraman, C.; Ruan, D. A fuzzy multi-criteria decision approach for software development strategy selection. Int. J. Gen. Syst. 2004, 33, 259–280. [Google Scholar] [CrossRef]
- Pacione, M. Introduction on urban environmental quality and human wellbeing. Landsc. Urban Plan. 2003, 65, 1–3. [Google Scholar] [CrossRef]
- Musschenga, A.W. The relation between concepts of quality-of-life, health and happiness. J. Med. Philos. 1997, 22, 11–28. [Google Scholar] [CrossRef]
- Huang, S.C.L. A study of outdoor interactional spaces in high-rise housing. Landsc. Urban Plan. 2006, 78, 193–204. [Google Scholar] [CrossRef]
- Firouzmakan, S.; Daneshpour, S.A. Promotion quality of life by increasing place attachment in public places. Proced. Soc. Behav. Sci. 2015, 201, 418–428. [Google Scholar] [CrossRef] [Green Version]
- Kahnemann, R.; Sudgen, R. Experienced utility as a standard of policy evaluation. Environ. Res. Econ. 2005, 32, 161–181. [Google Scholar] [CrossRef]
- Veenhoven, R. Happy life-expectancy: A comprehensive measure of quality-of-life in nations. Soc. Indic. Res. 1996, 39, 1–58. [Google Scholar] [CrossRef] [Green Version]
- Marans, R.W. Understanding environmental quality through quality of life studies: The 2001 DAS and its use of subjective and objective indicators. Landsc. Urban Plan. 2003, 65, 73–83. [Google Scholar] [CrossRef]
- Tu, K.J.; Lin, L.T. Evaluative structure of perceived residential environment quality in high-density and mixed-use urban settings: An exploratory study on Taipei City. Landsc. Urban Plan. 2008, 87, 157–171. [Google Scholar] [CrossRef]
- Bonaiuto, M.; Fornara, F.; Bonnes, M. Indexes of perceived residential environment quality and neighborhood attachment in urban environments: A confirmation study on the city of Rome. Landsc. Urban Plan. 2003, 65, 41–52. [Google Scholar] [CrossRef]
- Smith, T.; Nelischer, M.; Perkins, N. Quality of an urban community: A framework for understanding the relationship between quality and physical form. Landsc. Urban Plan. 1997, 39, 229–241. [Google Scholar] [CrossRef]
- Shafer, C.S.; Lee, B.K.; Turner, S. A tale of three greenway trails: User perceptions related to quality of life. Landsc. Urban Plan. 2000, 49, 163–178. [Google Scholar] [CrossRef]
- Mitchell, G.; Namdeo, A.; Kay, D. A new disease-burden method for estimating the impact of outdoor air quality on human health. Sci. Total Environ. 2000, 246, 153–163. [Google Scholar] [CrossRef]
- Rogerson, R.J. Quality of life and city competitiveness. Urban Stud. 1999, 36, 969–985. [Google Scholar] [CrossRef]
- Singhal, S.; McGreal, S.; Berry, J. An evaluative model for city competitiveness: Application to UK cities. Land Use Policy 2013, 30, 214–222. [Google Scholar] [CrossRef]
- Jian, G.; Kazunori, H. Residential environment index system and evaluation model established by subjective and objective methods. J. Zhejiang Univ. Sci. 2004, 5, 1028–1034. [Google Scholar]
- Leung, L.; Lee, P.S.N. Multiple determinants of life quality: The roles of internet activities, use of new media, social support, and leisure activities. Telemat. Inform. 2005, 22, 161–180. [Google Scholar] [CrossRef]
- Wang, W.M.; Peng, H.H. The establishment of evaluation model for Life-city. In Proceedings of the 2011 International Conference on Engineering and Business Management, Wuhan, China, 22–24 March 2011; pp. 2745–2749. (In Chinese). [Google Scholar]
- Bouzon, M.; Govindan, K.; Rodriguez, C.M.T.; Campos, L.M.S. Identification and analysis of reverse logistics barriers using fuzzy Delphi method and AHP. Res. Conserv. Recycl. 2016, 108, 182–197. [Google Scholar] [CrossRef]
- Chen, C.A. How can Taiwan create a niche in Asia’s cruise tourism industry? Tour. Manag. 2016, 55, 173–183. [Google Scholar] [CrossRef]
- Chen, C.S.; Liu, Y.C. A methodology for evaluation and classification of rock mass quality on tunnel engineering. Tunn. Undergr. Space Technol. 2007, 22, 377–387. [Google Scholar] [CrossRef]
- Shen, Y.C.; Lin, G.T.R.; Tzeng, G.H. Combined DEMATEL techniques with novel MCDM for the organic light emitting diode technology selection. Expert Syst. Appl. 2011, 38, 1468–1481. [Google Scholar] [CrossRef]
- Wang, Y.; Yeo, G.T.; Ng, A.K.Y. Choosing optimal bunkering ports for liner shipping companies: A hybrid Fuzzy-Delphi-TOPSIS approach. Transp. Policy 2014, 35, 358–365. [Google Scholar] [CrossRef]
- Murray, T.J.; Pipino, L.L.; Van Gigch, J.P. A pilot study of fuzzy set modification of Delphi. Hum. Syst. Manag. 1985, 5, 76–80. [Google Scholar] [CrossRef]
- Ishikawa, A.; Amagasa, T.; Shiga, T.; Tomizawa, G.; Tatsuta, R.; Mieno, H. The Max-Min Delphi method and fuzzy Delphi method via fuzzy integration. Fuzzy Sets Syst. 1993, 55, 241–253. [Google Scholar] [CrossRef]
- Chang, P.C.; Wang, Y.W. Fuzzy Delphi and back-propagation model for sales forecasting in PCB industry. Expert Syst. Appl. 2006, 30, 715–726. [Google Scholar] [CrossRef]
- Cheng, J.H. Indexes of competitive power and core competence in selecting Asia-Pacific ports. J. Chin. Inst. Transp. 2001, 13, 1–25. (In Chinese) [Google Scholar]
- Lee, A.H.I.; Wang, W.M.; Lin, T.Y. An evaluation framework for technology transfer of new equipment in high technology industry. Technol. Forecast. Soc. Chang. 2010, 77, 135–150. [Google Scholar] [CrossRef]
- Wang, W.M.; Lee, A.H.I.; Chang, D.T. An integrated FDM-ANP evaluation model for sustainable development of housing community. Optim. Lett. 2010, 4, 239–257. [Google Scholar] [CrossRef]
- Dzeng, R.J.; Wen, K.S. Evaluating project teaming strategies for construction of Taipei 101 using resource-based theory. Int. J. Project Manag. 2005, 23, 483–491. [Google Scholar] [CrossRef]
- Kuo, Y.F.; Chen, P.C. Constructing performance appraisal indicators for mobility of the service industries using Fuzzy Delphi Method. Expert Syst. Appl. 2008, 35, 1930–1939. [Google Scholar] [CrossRef]
- Jakiel, P.; Fabianowski, D. FAHP model used for assessment of highway RC bridge structural and technological arrangements. Expert Syst. Appl. 2015, 42, 4054–4061. [Google Scholar] [CrossRef]
- Liao, C.N. Fuzzy analytical hierarchy process and multi-segment goal programming applied to new product segmented under price strategy. Comput. Ind. Eng. 2011, 61, 831–841. [Google Scholar] [CrossRef]
- Topuz, E.; Van Gestel, C.A.M. An approach for environmental risk assessment of engineered nanomaterials using Analytical Hierarchy Process (AHP) and fuzzy inference rules. Environ. Int. 2016, 92–93, 334–347. [Google Scholar] [CrossRef] [PubMed]
- Bozbura, F.T.; Beskese, A.; Kahraman, C. Prioritization of human capital measurement indicators using fuzzy AHP. Expert Syst. Appl. 2007, 32, 1100–1112. [Google Scholar] [CrossRef]
- Chan, F.T.S.; Kumar, N. Global supplier development considering risk factors using fuzzy extended AHP-based approach. Omega 2007, 35, 417–431. [Google Scholar] [CrossRef]
- Chen, Z.; Yang, W. An MAGDM based on constrained FAHP and FTOPSIS and its application to supplier selection. Math. Comput. Model. 2011, 54, 2802–2815. [Google Scholar] [CrossRef]
- Kahraman, C.; Cebeci, U.; Ruan, D. Multi-attribute comparison of catering service companies using fuzzy AHP: The case of Turkey. Int. J. Prod. Econ. 2004, 87, 171–184. [Google Scholar] [CrossRef]
- Paksoy, T.; Pehlivan, N.Y.; Kahraman, C. Organizational strategy development in distribution channel management using fuzzy AHP and hierarchical fuzzy TOPSIS. Expert Syst. Appl. 2012, 39, 2822–2841. [Google Scholar] [CrossRef]
- Wang, W.M.; Lee, A.H.I.; Chang, D.T. An integrated FA-FEAHP approach on the social indicators of Taiwan’s green building. Glob. Bus. Econ. Rev. 2009, 11, 304–316. [Google Scholar] [CrossRef]
- Zhu, K.J.; Jing, Y.; Chang, D.Y. A discussion on Extent Analysis Method and applications of fuzzy AHP. Eur. J. Oper. Res. 1999, 116, 450–456. [Google Scholar] [CrossRef]
- Kang, H.Y.; Lee, A.H.I. Inventory replenishment model using fuzzy multiple objective programming: A case study of a high-tech company in Taiwan. Appl. Soft Comput. 2010, 10, 1108–1118. [Google Scholar] [CrossRef]
- Lee, A.H.I. A fuzzy supplier selection model with the consideration of benefits, opportunities, costs and risks. Expert Syst. Appl. 2009, 36, 2879–2893. [Google Scholar] [CrossRef]

| Linguistic Scale | Triangular Fuzzy Number Scale | Reciprocal Triangular Fuzzy Number Scale |
|---|---|---|
| Just equal | (1, 1, 1) | (1, 1, 1) |
| Equally important | (1/3, 1, 5/3) | (3/5, 1, 3) |
| Weakly more important | (4/3, 2, 8/3) | (3/8, 1/2, 3/4) |
| Strongly more important | (7/3, 3, 11/3) | (3/11, 1/3, 3/7) |
| Very strongly more important | (10/3, 4, 14/3) | (3/14, 1/4, 3/10) |
| Absolutely more important | (13/3, 5, 17/3) | (3/17, 1/5, 3/13) |
| Ds | Safety Protection (SAP) (D1) | Living Needs (LIN) (D2) | Social Well-Being and Education (SWE) (D3) | Developmental Potential (DEP) (D4) |
|---|---|---|---|---|
| PIFs | P1: Protection of natural disasters (PND) | P10: Conservation of natural environment (CNE) | P23: Completeness of formal education (CFE) | P34: Practice of incorruptible government (PIG) |
| P2: Prevention of man-made disasters (PMD) | P11: Restoration of ecological environment (REE) | P24: Diversity of social education (DSE) | P35: Assistance of municipal services (AMS) | |
| P3: Protection of citizen’s privacy (PCP) | P12: Greening and beautification of landscape (GBL) | P25: Training of technical education (TTE) | P36: Effectiveness of government administration (EGA) | |
| P4: Promotion of safe life (PSL) | P13: Design of streets and city (DSC) | P26: Holding of artistic activities (HAA) | P37: Cooperation between public and private sectors (CPP) | |
| P5: Improvement of medical quality (IMQ) | P14: Promotion of green living (PGL) | P27: Provision of exhibition and performance spaces (PEP) | P38: R&D and promotion of policies (RDP) | |
| P6: Health care and service (HCS) | P15: Adequate supply of infrastructure (ASI) | P28: Friendly environment for women (FEW) | P39: Building of urban image (BUI) | |
| P7: Mutual assistance of community (MAC) | P16: Service of convenient transportation (SCT) | P29: Assistance for disadvantaged group (ADG) | P40: Social participation of enterprise (SPE) | |
| P8: Maintenance of public order (MPO) | P17: Improvement of pedestrian spaces (IPS) | P30: Provide service for immigration (PSI) | P41: R&D and application of technology (RDA) | |
| P9: Handling of social protests (HSP) | P18: Provision of adequate open spaces (PAO) | P31: Completeness of elderly welfare (CEW) | P42: Mutual linkage of internationalization (MLI) | |
| P19: Construction of leisure environment (CLE) | P32: Overall care of children (OCC) | |||
| P20: Supply of sports space (SSS) | P33: Conservation of cultural asset (CCA) | |||
| P21: Popularization of e-communication (PEC) | ||||
| P22: Construction of perfect life circles (CPL) |
| Ds PIFs | Gray Zone | |||||||||
|---|---|---|---|---|---|---|---|---|---|---|
| (Min) | (Max) | (Min) | (Max) | |||||||
| P42: MLI | 3 | 7 | 7 | 10 | 5.33 | 8.63 | -- | -- | -- | 6.98 |
| SAP (D1) | ||||||||||
| P1: PND | 3 | 8 | 8 | 10 | 5.43 | 9.10 | -- | -- | -- | 7.26 |
| P2: PMD | 3 | 8 | 8 | 10 | 5.31 | 9.03 | -- | -- | -- | 7.17 |
| P3: PCP | 3 | 7 | 6 | 9 | 4.87 | 7.88 | 1.00 | 3.00 | 2.00 | 6.47 |
| P4: PSL | 3 | 7 | 6 | 10 | 4.83 | 8.04 | 1.00 | 3.20 | 2.20 | 6.48 |
| P5: IMQ | 5 | 8 | 7 | 10 | 5.79 | 8.80 | 1.00 | 3.01 | 2.01 | 7.45 |
| P6: HCS | 4 | 7 | 7 | 10 | 5.61 | 8.69 | -- | -- | -- | 7.15 |
| P7: MAC | 3 | 7 | 6 | 10 | 5.03 | 8.79 | 1.00 | 3.76 | 2.76 | 6.59 |
| P8: MPO | 5 | 8 | 8 | 10 | 6.22 | 9.24 | -- | -- | -- | 7.73 |
| P9: HSP | 3 | 7 | 6 | 10 | 4.36 | 7.56 | 1.00 | 3.20 | 2.20 | 6.37 |
| LIN (D2) | ||||||||||
| P10: CNE | 4 | 8 | 8 | 10 | 5.59 | 8.96 | -- | -- | -- | 7.28 |
| P11: REE | 4 | 8 | 6 | 10 | 5.76 | 8.81 | 2.00 | 3.05 | 1.05 | 7.11 |
| P12: GBL | 4 | 8 | 8 | 10 | 5.56 | 8.63 | -- | -- | -- | 7.10 |
| P13: DSC | 2 | 9 | 7 | 10 | 5.04 | 8.55 | 2.00 | 3.51 | 1.51 | 7.56 |
| P14: PGL | 2 | 8 | 6 | 10 | 5.15 | 8.48 | 2.00 | 3.33 | 1.33 | 6.93 |
| P15: ASI | 4 | 8 | 8 | 10 | 6.18 | 9.24 | -- | -- | -- | 7.71 |
| P16: SCT | 5 | 8 | 7 | 10 | 5.73 | 8.89 | 1.00 | 3.16 | 2.16 | 7.45 |
| P17: IPS | 2 | 7 | 8 | 10 | 5.32 | 8.78 | -- | -- | -- | 7.05 |
| P18: PAO | 4 | 8 | 7 | 10 | 5.28 | 8.67 | 1.00 | 3.40 | 2.40 | 7.38 |
| P19: CLE | 2 | 6 | 7 | 10 | 4.91 | 8.42 | -- | -- | -- | 6.67 |
| P20: SSS | 4 | 6 | 7 | 10 | 5.24 | 8.55 | -- | -- | -- | 6.90 |
| P21: PEC | 4 | 7 | 7 | 10 | 5.26 | 8.52 | -- | -- | -- | 6.89 |
| P22: CPL | 3 | 8 | 7 | 10 | 5.26 | 8.52 | 1.00 | 3.26 | 2.26 | 7.36 |
| SWE (D3) | ||||||||||
| P23: CFE | 4 | 8 | 8 | 10 | 5.59 | 8.96 | -- | -- | -- | 7.28 |
| P24: DSE | 4 | 8 | 8 | 10 | 5.68 | 8.98 | -- | -- | -- | 7.33 |
| P25: TTE | 3 | 7 | 7 | 10 | 5.12 | 8.56 | -- | -- | -- | 6.84 |
| P26: HAA | 2 | 9 | 7 | 10 | 4.98 | 8.55 | 2.00 | 3.57 | 1.57 | 7.56 |
| P27: PEP | 2 | 8 | 6 | 10 | 5.15 | 8.42 | 2.00 | 3.27 | 1.27 | 6.92 |
| P28: FEW | 4 | 8 | 8 | 10 | 6.31 | 9.31 | -- | -- | -- | 7.81 |
| P29: ADG | 2 | 8 | 8 | 10 | 5.34 | 9.11 | -- | -- | -- | 7.23 |
| P30: PSI | 5 | 7 | 8 | 10 | 5.76 | 8.84 | -- | -- | -- | 7.30 |
| P31: CEW | 4 | 6 | 7 | 10 | 5.18 | 8.74 | -- | -- | -- | 6.96 |
| P32: OCC | 4 | 6 | 7 | 10 | 5.31 | 8.55 | -- | -- | -- | 6.93 |
| P33: CCA | 4 | 7 | 7 | 10 | 5.32 | 8.46 | -- | -- | -- | 6.89 |
| DEP (D4) | ||||||||||
| P34: PIG | 3 | 9 | 8 | 10 | 5.97 | 9.30 | 1.00 | 3.33 | 2.33 | 8.30 |
| P35: AMS | 5 | 7 | 8 | 10 | 5.74 | 8.98 | -- | -- | -- | 7.36 |
| P36: EGA | 5 | 8 | 8 | 10 | 6.41 | 9.10 | -- | -- | -- | 7.76 |
| P37: CPP | 2 | 7 | 7 | 10 | 4.90 | 8.52 | -- | -- | -- | 6.71 |
| P38: RDP | 5 | 7 | 7 | 10 | 5.60 | 8.77 | -- | -- | -- | 7.19 |
| P39: BUI | 3 | 7 | 7 | 10 | 5.27 | 8.40 | -- | -- | -- | 6.84 |
| P40: SPE | 3 | 7 | 7 | 10 | 5.12 | 8.45 | -- | -- | -- | 6.78 |
| P41: RDA | 5 | 7 | 7 | 10 | 5.38 | 8.23 | -- | -- | -- | 6.81 |
| (G) | Expert | SAP (O1) | LIN (O2) | SWE (O3) | DEP (O4) |
|---|---|---|---|---|---|
| Safety protection; SAP (O1) | 1 | (1, 1, 1) | (1, 1, 1) | (4/3, 2, 8/3) | (1/3, 1, 5/3) |
| 2 | (1, 1, 1) | (7/3, 3, 11/3) | (4/3, 2, 8/3) | (10/3, 4, 14/3) | |
| 3 | (1, 1, 1) | (4/3, 2, 8/3) | (3/5, 1, 3) | (1/3, 1, 5/3) | |
| 4 | (1, 1, 1) | (1/3, 1, 5/3) | (7/3, 3, 11/3) | (7/3, 3, 11/3) | |
| 5 | (1, 1, 1) | (1/3, 1, 5/3) | (4/3, 2, 8/3) | (10/3, 4, 14/3) | |
| 6 | (1, 1, 1) | (4/3, 2, 8/3) | (7/3, 3, 11/3) | (1, 1, 1) | |
| 7 | (1, 1, 1) | (7/3, 3, 11/3) | (7/3, 3, 11/3) | (3/5, 1, 3) | |
| Living needs; LIN (O2) | 1 | (1, 1, 1) | (1, 1, 1) | (4/3, 2, 8/3) | (1/3, 1, 5/3) |
| 2 | (3/11, 1/3, 3/7) | (1, 1, 1) | (3/8, 1/2, 3/4) | (4/3, 2, 8/3) | |
| 3 | (1/3, 1, 5/3) | (1, 1, 1) | (3/5, 1, 3) | (3/5, 1, 3) | |
| 4 | (1/3, 1, 5/3) | (1, 1, 1) | (1/3, 1, 5/3) | (4/3, 2, 8/3) | |
| 5 | (1/3, 1, 5/3) | (1, 1, 1) | (1/3, 1, 5/3) | (7/3, 3, 11/3) | |
| 6 | (1/3, 1, 5/3) | (1, 1, 1) | (1/3, 1, 5/3) | (1, 1, 1) | |
| 7 | (1/3, 1, 5/3) | (1, 1, 1) | (7/3, 3, 11/3) | (3/11, 1/3, 3/7) | |
| Social well-being and education;SWE (O3) | 1 | (3/8, 1/2, 3/4) | (3/8, 1/2, 3/4) | (1, 1, 1) | (4/3, 2, 8/3) |
| 2 | (3/8, 1/2, 3/4) | (4/3, 2, 8/3) | (1, 1, 1) | (7/3, 3, 11/3) | |
| 3 | (1/3, 1, 5/3) | (1/3, 1, 5/3) | (1, 1, 1) | (1/3, 1, 5/3) | |
| 4 | (3/8, 1/2, 3/4) | (3/5, 1, 3) | (1, 1, 1) | (1/3, 1, 5/3) | |
| 5 | (3/8, 1/2, 3/4) | (3/5, 1, 3) | (1, 1, 1) | (1/3, 1, 5/3) | |
| 6 | (3/11, 1/3, 3/7) | (3/5, 1, 3) | (1, 1, 1) | (3/11, 1/3, 3/7) | |
| 7 | (3/11, 1/3, 3/7) | (1, 1, 1) | (1, 1, 1) | (3/8, 1/2, 3/4) | |
| Developmental potential; DEP (O4) | 1 | (3/5, 1, 3) | (3/5, 1, 3) | (3/8, 1/2, 3/4) | (1, 1, 1) |
| 2 | (3/14, 1/4, 3/10) | (3/8, 1/2, 3/4) | (3/11, 1/3, 3/7) | (1, 1, 1) | |
| 3 | (3/5, 1, 3) | (1/3, 1, 5/3) | (3/5, 1, 3) | (1, 1, 1) | |
| 4 | (3/14, 1/4, 3/10) | (3/8, 1/2, 3/4) | (3/5, 1, 3) | (1, 1, 1) | |
| 5 | (3/14, 1/4, 3/10) | (3/11, 1/3, 3/7) | (3/5, 1, 3) | (1, 1, 1) | |
| 6 | (1, 1, 1) | (1, 1, 1) | (7/3, 3, 11/3) | (1, 1, 1) | |
| 7 | (3/11, 1/3, 3/7) | (7/3, 3, 11/3) | (4/3, 2, 8/3) | (1, 1, 1) |
| (Goal) | SAP (O1) | LIN (O2) | SWE (O3) | DEP (O4) | |
|---|---|---|---|---|---|
| SAP (O1) | (1, 1, 1) | (1.29, 1.86, 2.43) | (1.66, 2.29, 3.14) | (1.61, 2.14, 2.90) | (5.56, 7.29, 9.47) |
| LIN (O2) | (0.42, 0.90, 1.39) | (1, 1, 1) | (0.62, 1.07, 1.77) | (1.03, 1.48, 2.16) | (3.07, 4.45, 6.32) |
| SWE (O3) | (0.33, 0.50, 0.74) | (0.69, 1.07, 2.15) | (1, 1, 1) | (0.76, 1.26, 1.79) | (2.78, 3.83, 5.68) |
| DEP (O4) | (0.46, 0.69, 1.39) | (0.76, 1.05, 1.61) | (0.87, 1.26, 0.36) | (1, 1, 1) | (3.09, 4.00, 6.36) |
| (14.50, 19.57, 27.83) |
| The Degree of Possibility | ||||||
|---|---|---|---|---|---|---|
| SAP (O1) | (5.55, 7.29, 9.48) | (0.20,0.37,0.65) | = (1.00, 1.00, 1.00) | 1.00 | 1.00 | 0.36 |
| LIN (O2) | (3.06, 4.45, 6.32) | (0.11,0.23,0.44) | = (0.63, 1.00, 1.00) | 0.63 | 0.63 | 0.23 |
| SWE (O3) | (2.78, 3.83, 5.69) | (0.10,0.20,0.39) | = (0.53, 0.90, 1.00) | 0.53 | 0.53 | 0.19 |
| DEP (O4) | (3.09, 4.00, 6.35) | (0.11,0.20,0.44) | = (0.59, 0.92, 1.00) | 0.59 | 0.59 | 0.22 |
| The Degree of Possibility | ||||||
|---|---|---|---|---|---|---|
| PND (C1) | (5.55, 7.29, 9.48) | (0.12,0.20,0.33) | = (1.00, 1.00, 1.00, 0.64) | 0.64 | 0.64 | 0.19 |
| PMD (C2) | (3.06, 4.45, 6.32) | (0.11,0.18,0.30) | = (0.90, 1.00, 1.00, 0.54) | 0.54 | 0.54 | 0.17 |
| IMQ (C3) | (2.78, 3.83, 5.69) | (0.10,0.18,0.32) | = (0.91, 0.95, 1.00, 0.56) | 0.56 | 0.56 | 0.18 |
| HCS (C4) | (3.09, 4.00, 6.35) | (0.09,0.16,0.28) | = (0.80, 0.89, 0.95, 0.46) | 0.46 | 0.46 | 0.15 |
| MPO (C5) | (3.09, 4.00, 6.35) | (0.17,0.29,0.48) | = (1.00, 1.00, 1.00, 1.00) | 1.00 | 1.00 | 0.31 |
| The Degree of Possibility | ||||||
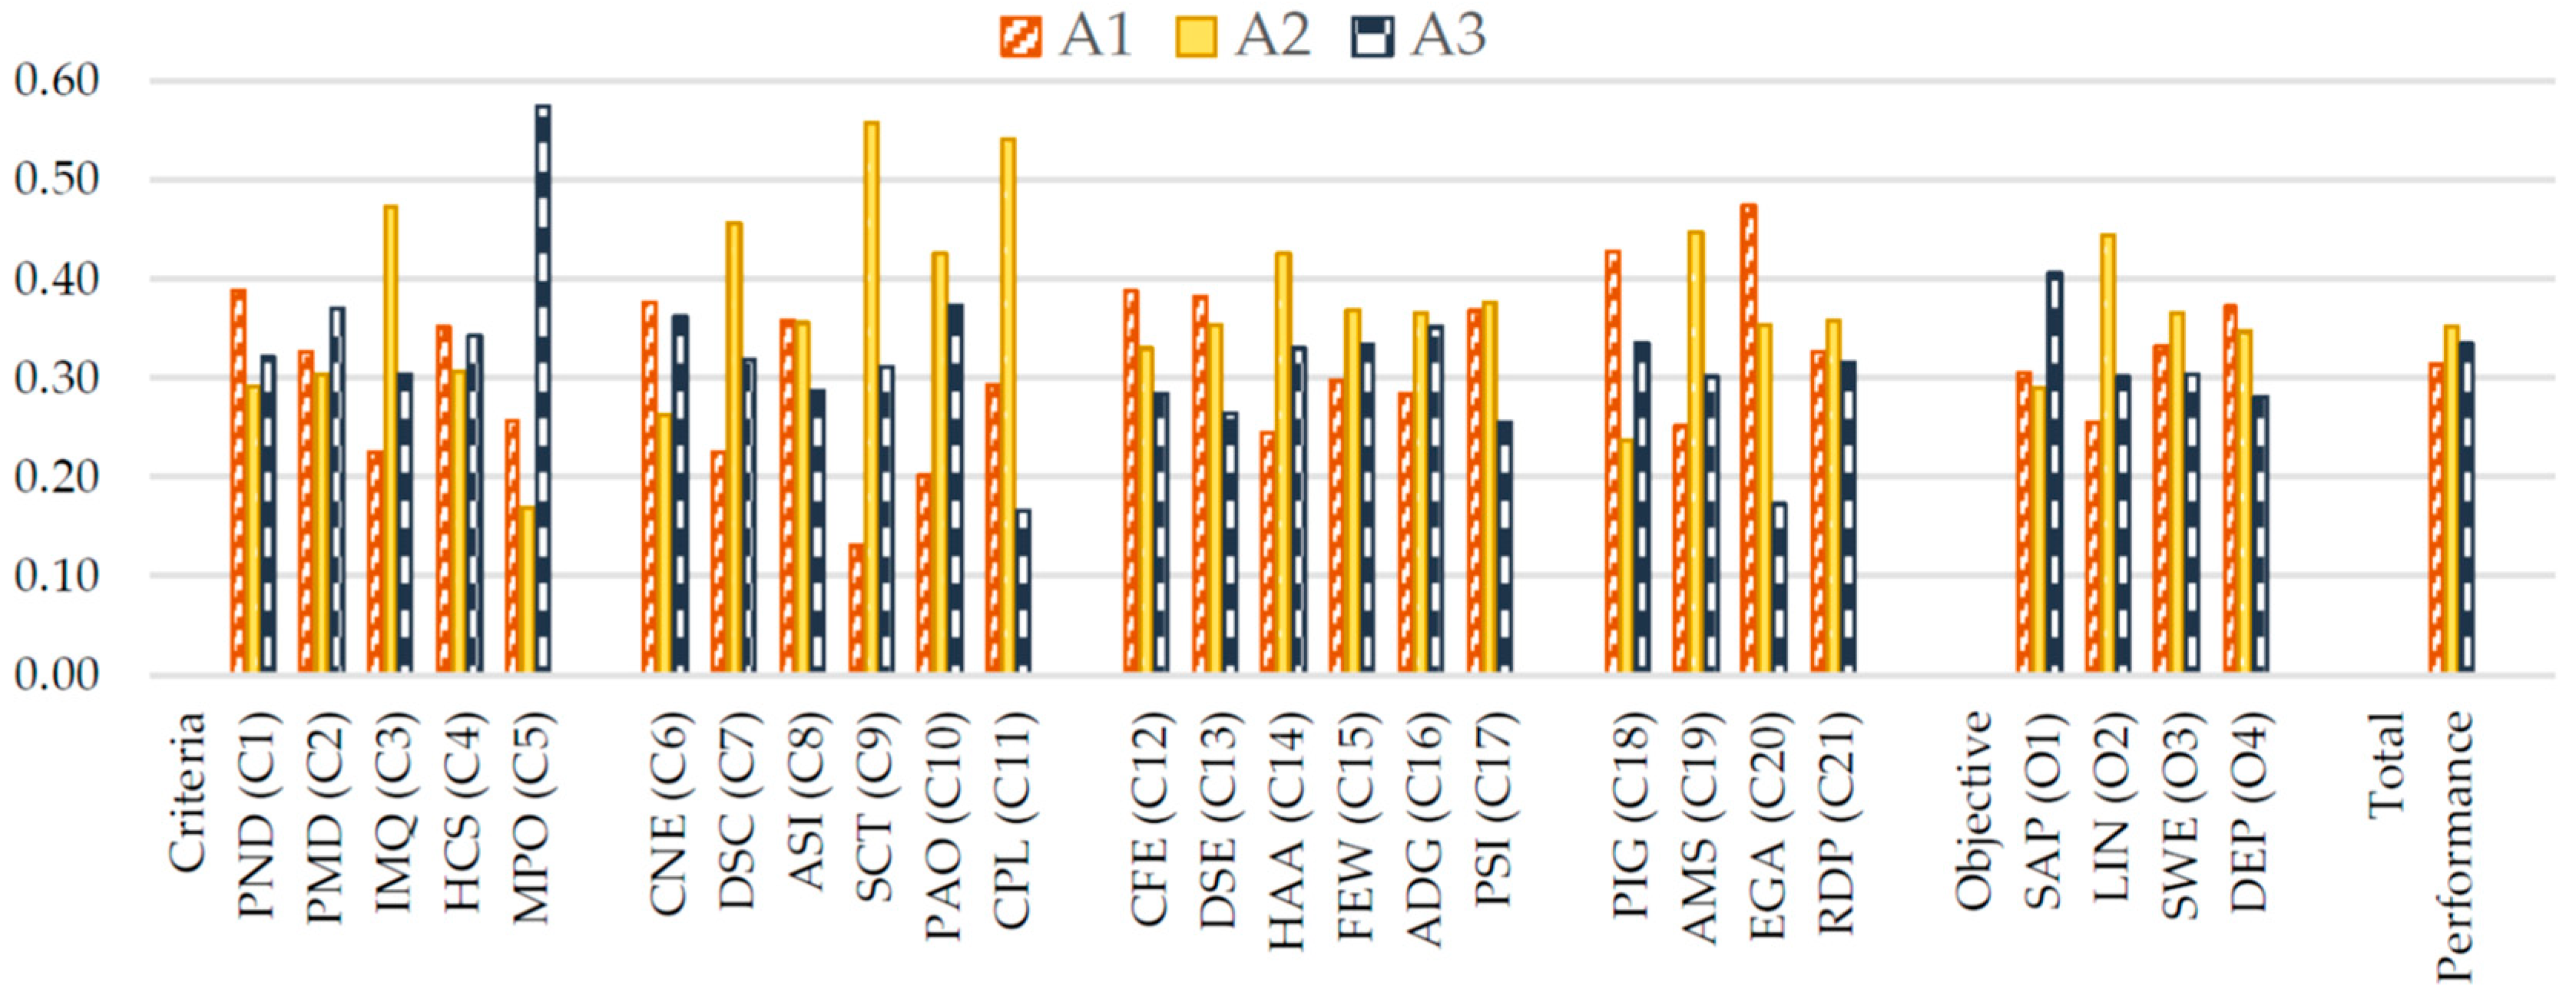
|---|---|---|---|---|---|---|
| Hsinchu city (A1) | (3.03, 3.77, 4.73) | (0.24,0.38,0.59) | = (1.00, 1.00) | 1.00 | 1.00 | 0.39 |
| Taichung city (A2) | (2.28, 2.79, 4.30) | (0.11,0.23,0.44) | = (0.74, 0.86) | 0.74 | 0.74 | 0.29 |
| Tainan city (A3) | (2.73, 3.26, 3.86) | (0.10,0.20,0.39) | = (0.83, 1.00) | 0.83 | 0.83 | 0.32 |
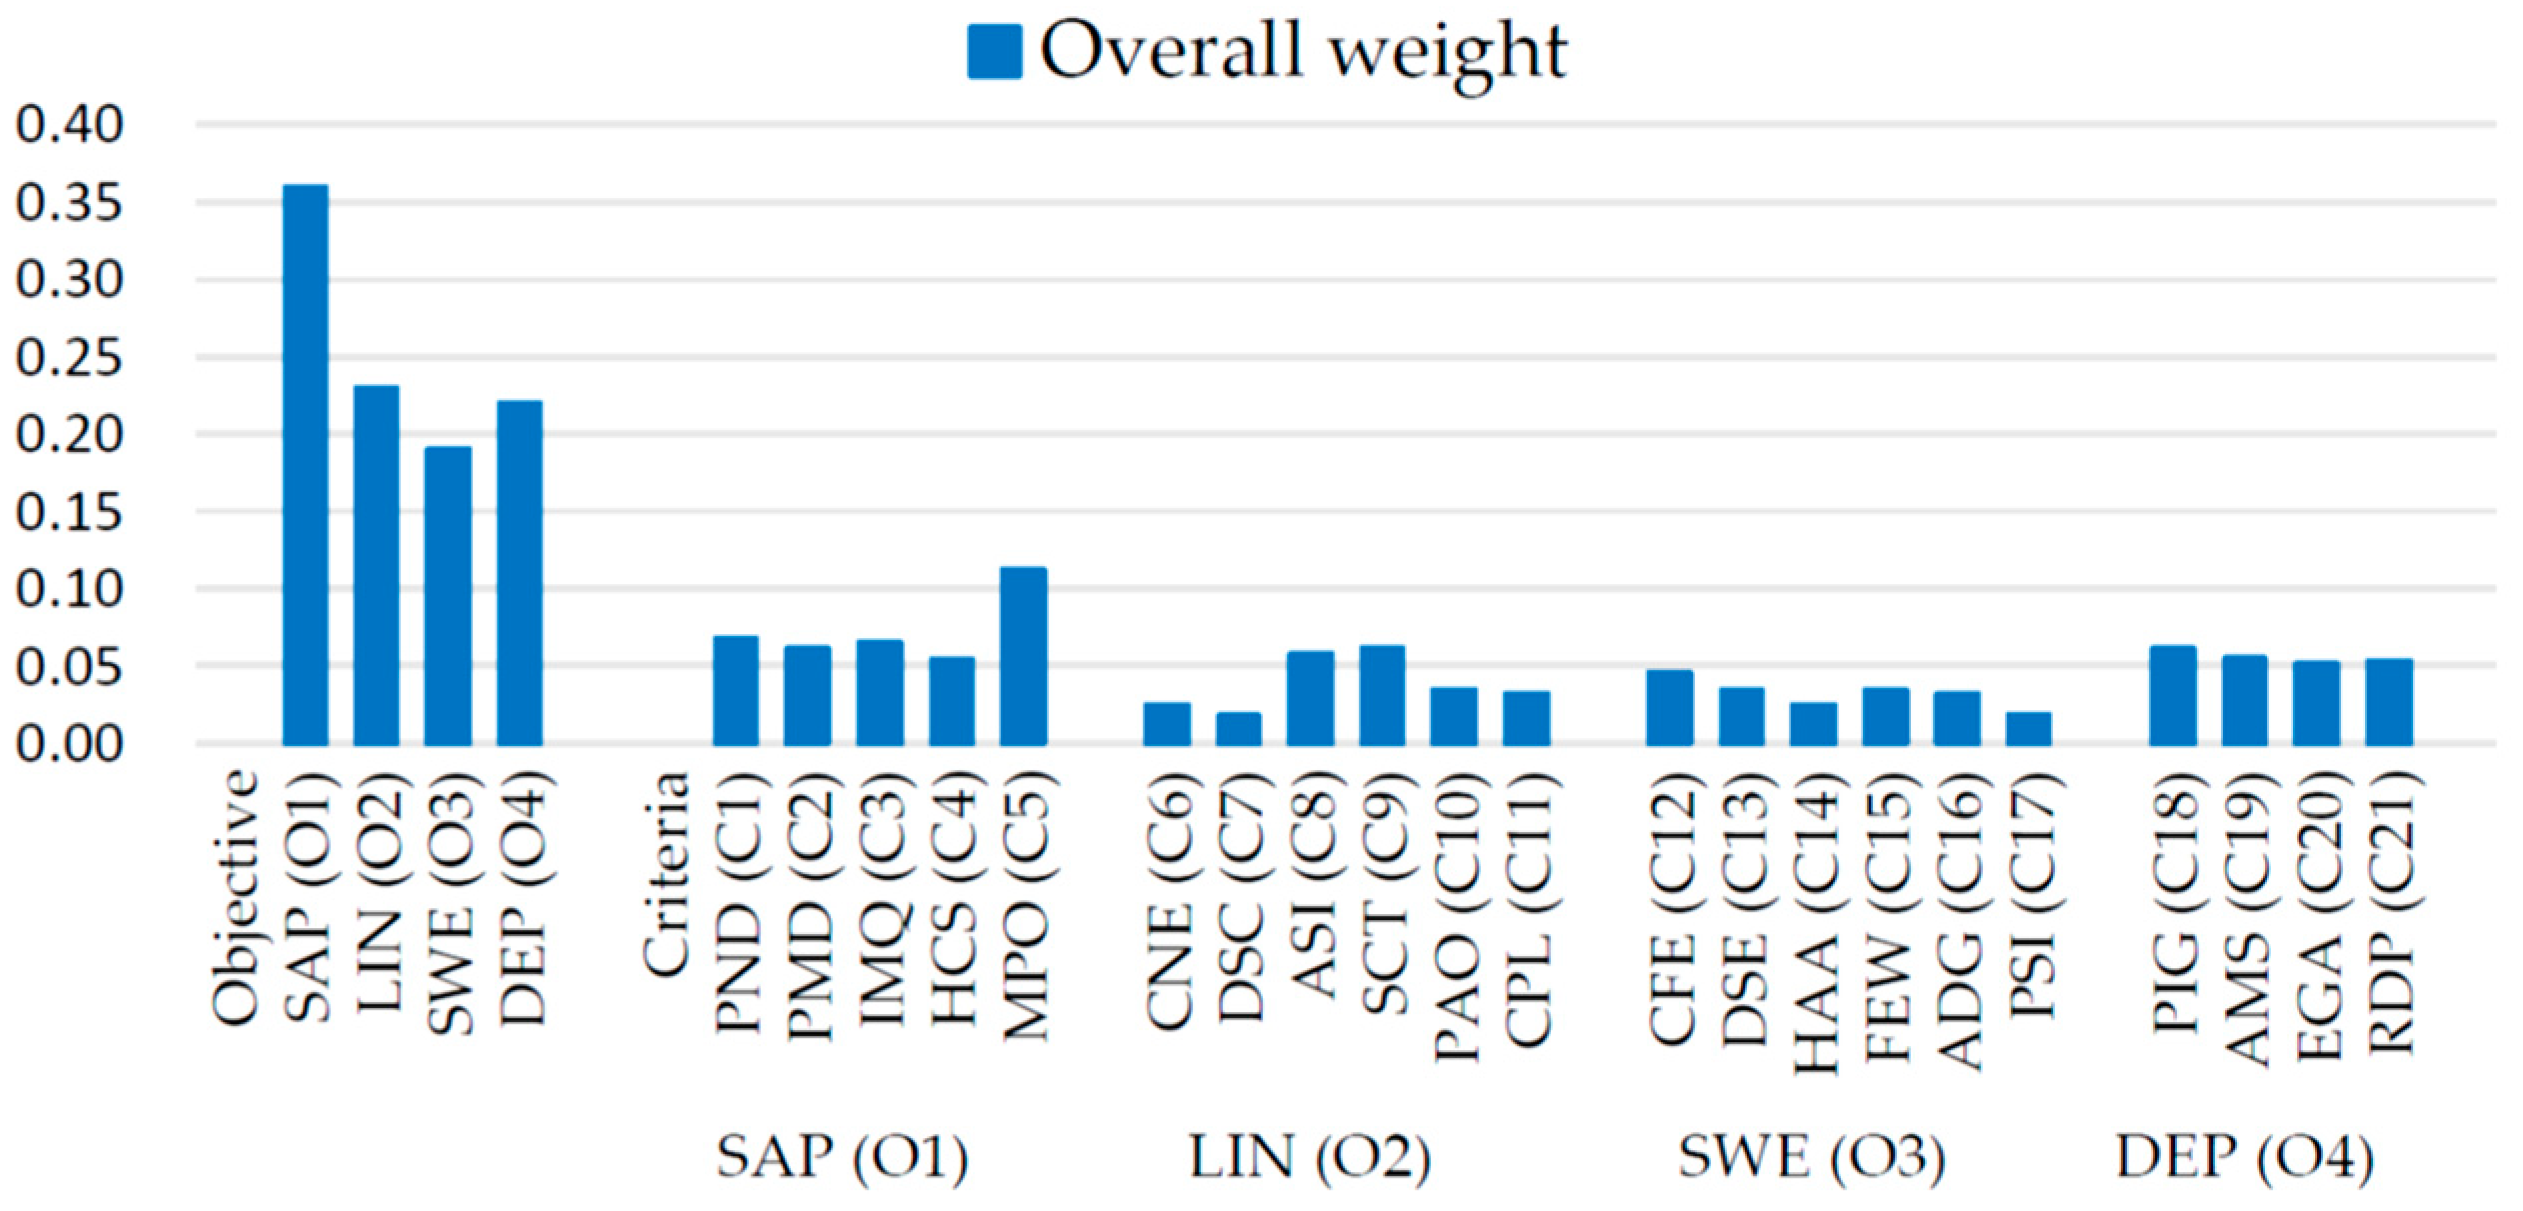
| Objectives (Weight) | Criteria | Weight (Cq under Op) | Overall Weight | Criteria Ranking | Hsinchu (A1) | Taichung (A2) | Tainan (A3) |
|---|---|---|---|---|---|---|---|
| Safety protection SAP (O1) (0.36) | PND (C1) | 0.19 | 0.068 | 2 | 0.39 | 0.29 | 0.32 |
| PMD (C2) | 0.17 | 0.061 | 5 | 0.33 | 0.30 | 0.37 | |
| IMQ (C3) | 0.18 | 0.065 | 3 | 0.23 | 0.47 | 0.30 | |
| HCS (C4) | 0.15 | 0.054 | 9 | 0.35 | 0.31 | 0.34 | |
| MPO (C5) | 0.31 | 0.112 | 1 | 0.26 | 0.17 | 0.57 | |
| Σ | 1.00 | 0.360 | 0.305 | 0.290 | 0.405 | ||
| Living needs LIN (O2) (0.23) | CNE (C6) | 0.11 | 0.025 | 18 | 0.38 | 0.26 | 0.36 |
| DSC (C7) | 0.08 | 0.018 | 21 | 0.22 | 0.46 | 0.32 | |
| ASI (C8) | 0.25 | 0.058 | 7 | 0.36 | 0.35 | 0.29 | |
| SCT (C9) | 0.27 | 0.062 | 4 | 0.13 | 0.56 | 0.31 | |
| PAO (C10) | 0.15 | 0.035 | 13 | 0.20 | 0.43 | 0.37 | |
| CPL (C11) | 0.14 | 0.032 | 16 | 0.29 | 0.54 | 0.17 | |
| Σ | 1.00 | 0.230 | 0.255 | 0.444 | 0.301 | ||
| Social well-being and education SWE (O3) (0.19) | CFE (C12) | 0.24 | 0.046 | 12 | 0.39 | 0.33 | 0.28 |
| DSE (C13) | 0.18 | 0.034 | 14 | 0.38 | 0.35 | 0.27 | |
| HAA (C14) | 0.13 | 0.025 | 18 | 0.24 | 0.43 | 0.33 | |
| FEW (C15) | 0.18 | 0.034 | 14 | 0.30 | 0.37 | 0.33 | |
| ADG (C16) | 0.17 | 0.032 | 16 | 0.28 | 0.37 | 0.35 | |
| PSI (C17) | 0.10 | 0.019 | 20 | 0.37 | 0.38 | 0.25 | |
| Σ | 1.00 | 0.190 | 0.332 | 0.365 | 0.303 | ||
| Developmental potential DEP (O4) (0.22) | PIG (C18) | 0.28 | 0.061 | 5 | 0.43 | 0.24 | 0.33 |
| AMS (C19) | 0.25 | 0.055 | 8 | 0.25 | 0.45 | 0.30 | |
| EGA (C20) | 0.23 | 0.051 | 11 | 0.48 | 0.35 | 0.17 | |
| RDP (C21) | 0.24 | 0.053 | 10 | 0.33 | 0.36 | 0.31 | |
| Σ | 1.00 | 0.220 | 0.372 | 0.347 | 0.281 | ||
| Total performance | 0.313 | 0.352 | 0.335 | ||||
© 2020 by the authors. Licensee MDPI, Basel, Switzerland. This article is an open access article distributed under the terms and conditions of the Creative Commons Attribution (CC BY) license (http://creativecommons.org/licenses/by/4.0/).
Share and Cite
Wang, W.-M.; Peng, H.-H. A Fuzzy Multi-Criteria Evaluation Framework for Urban Sustainable Development. Mathematics 2020, 8, 330. https://doi.org/10.3390/math8030330
Wang W-M, Peng H-H. A Fuzzy Multi-Criteria Evaluation Framework for Urban Sustainable Development. Mathematics. 2020; 8(3):330. https://doi.org/10.3390/math8030330
Chicago/Turabian StyleWang, Wei-Ming, and Hsiao-Han Peng. 2020. "A Fuzzy Multi-Criteria Evaluation Framework for Urban Sustainable Development" Mathematics 8, no. 3: 330. https://doi.org/10.3390/math8030330
APA StyleWang, W.-M., & Peng, H.-H. (2020). A Fuzzy Multi-Criteria Evaluation Framework for Urban Sustainable Development. Mathematics, 8(3), 330. https://doi.org/10.3390/math8030330