Article

Picture Fuzzy MCDM Approach for Risk Assessment of Railway Infrastructure

1
Faculty of Transport and Traffic Engineering, University of Belgrade, Vojvode Stepe 305, 11010 Belgrade, Serbia
2
Faculty of Transport Engineering, University of Pardubice, Studentská 95, 532 10 Pardubice, Czech Republic
*
Author to whom correspondence should be addressed.
Mathematics 2020, 8(12), 2259; https://doi.org/10.3390/math8122259
Submission received: 17 November 2020 / Revised: 14 December 2020 / Accepted: 17 December 2020 / Published: 21 December 2020
(This article belongs to the Section Mathematics and Computer Science)

Abstract

:
To increase the level of safety and prevent significant accidents, it is essential to prioritize risk factors and assess railway infrastructure. The key question is how to identify unsafe railway infrastructure so authorities can undertake safety improvement projects on time. The paper aims to introduce a picture fuzzy group multi-criteria decision-making approach for risk assessment of railway infrastructure. Firstly, picture fuzzy sets are employed for representing and handling risk-related information. Secondly, a picture fuzzy hybrid method based on the direct rating, and Tsallis–Havrda–Charvát entropy is provided to prioritize risk factors. Thirdly, a picture fuzzy measurement of alternatives and ranking according to compromise solution method is developed to rank railway infrastructures. Lastly, the formulated approach is implemented in the Czech Republic context. Two sensitivity analyses verified the high robustness of the formulated approach. The comparative analysis with five state-of-the-art picture fuzzy approaches approved its high reliability. Compared to the state-of-the-art picture fuzzy approaches, the provided three-parametric approach has superior flexibility.

1. Introduction

Railway infrastructure safety is an important element of urban public safety [1]. The safety of railway infrastructure is vital to secure goods and passengers from departures to destinations [2]. Accidental events in railway transportation cause damages to human health, public property, environment, and the economy [3]. In 2018, there were 1721 significant railway accidents in the European Union, with a total of 853 fatalities and 760 serious injuries. The total cost of railway accidents was approximately 5 billion EUR [4]. Collisions and derailments account for about 200 accidents each year [5].
To increase safety levels of assets, passengers, goods, and employees as well as prevent significant accidents it is essential to prioritize risk factors and assess railway infrastructure. However, the risk assessment of railway infrastructure is an emerging problem for railway planners. It is considered as a multi-criteria decision-making (MCDM) problem, since there are a finite set of available railway infrastructures, which safety levels need to be assessed, and numerous risk factors influencing railway infrastructure (i.e., evaluation criteria). Additionally, to mitigate information loss and prevent erroneous decisions, it is critical to efficiently represent and handle risk-related uncertain information when solving this complex MCDM problem.
Solving the railway infrastructure risk assessment problem is critical for railway transport worldwide. The key question is how to identify unsafe railway infrastructure so relevant authorities can undertake safety improvement projects on time. However, (i) only deterministic numbers and type-1 fuzzy sets have been used in the available studies to evaluate risk factors in railway transport; (ii) there is no methodological framework that can represent and handle uncertain, incomplete, and inconsistent risk-related information; and (iii) the available prioritization methods are unable to consider the subjective and objective importance of risk factors under a highly uncertain environment. As a result, the main objective of this paper is to introduce a picture fuzzy group MCDM approach for risk assessment of railway infrastructure.
Recently, Cuong and Kreinovich [6] and Cuong [7] proposed picture fuzzy sets (PFSs). PFSs represent an advanced generalization of intuitionistic fuzzy sets for efficient uncertainty modeling and solving real-life decision-making problems [8]. They can efficiently describe fuzzy, uncertain, incomplete, and inconsistent information [9]. PFSs are characterized by four functions, namely, the degree of positive membership, the degree of neutral membership, the degree of negative membership, and the degree of refusal membership [10,11]. Therefore, they are especially suitable for decision-making situations that require answers of the type yes, no, abstain, and refusal [12]. This particular type of information is dominantly used in surveys and voting systems where experts are divided into previously mentioned four categories [13]. As a result, PFSs can efficiently represent railway planners’ preferences and handle risk-related information. Unfortunately, railway planners are unable to naturally express their preferences by voting, since no previous research has applied a PFS-based MCDM approach for railway transport.
The Measurement of Alternatives and Ranking according to Compromise Solution (MARCOS) is one of the most recent MCDM methods developed by Stević et al. [14]. It synthesizes the ratio and reference point sorting approaches to obtain ranking results [15]. Compared with other MCDM methods, the MARCOS method is simple, effective, and easy to sort and optimize a decision-making process [14,16]. Its features are [14,15] consideration of ideal and anti-ideal solutions at the very beginning, the definition of utility degree to both solutions, ability to process large data sets, flexibility to analyze expert preferences, and a simple algorithm. However, the MARCOS method has not been extended before using PFSs, so it cannot reflect neutral/refusal information of decision-makers in the railway industry.
Based on the highlighted research gaps, the aims of this paper are (1) to utilize PFSs, which are superior in handling fuzzy, uncertain, incomplete, and inconsistent risk-related information, and help railway planners to naturally express their risk preferences by voting; (2) to determine the importance of each risk factor influencing railway infrastructure by using the novel picture fuzzy hybrid method for risk factor prioritization, which is developed by hybridizing the picture fuzzy direct rating and Tsallis–Havrda–Charvát entropy methods; (3) to rank railway infrastructures by employing the developed picture fuzzy MARCOS method for railway infrastructure ranking, which is for the first time extended under the picture fuzzy environment; and (4) to apply the formulated picture fuzzy group MCDM approach for risk assessment of railway infrastructure in the Czech Republic.
The rest of the paper is organized as follows: Section 2 surveys the state-of-the-art research. Section 3 reviews some definitions of PFSs. Section 4 presents the introduced picture fuzzy group MCDM approach for risk assessment of railway infrastructure. A real-life case study is described in Section 5. Section 6 presents the case study results and discussions. Section 7 gives the conclusions of the work and indicates possible extension areas.

2. Literature Review

The literature review is organized into three sub-sections. The first sub-section surveys existing MCDM approaches for railway transport. The second sub-section overviews applications and extensions of the MARCOS method. The last sub-section presents identified research gaps.

2.1. MCDM Approach for Railway Transport

The application of the MCDM approach for solving diverse problems in railway transport attracted a large interest of researchers, since it is important for the economy and society. The comprehensive summary of the state-of-the-art contributions is presented in Table 1.
Mohajeri and Amin [17] coupled the Analytical Hierarchy Process (AHP) with Data Envelopment Analysis (DEA) to evaluate sites for a railway station. Sivilevičius and Maskeliūnaite [18] applied the AHP method to assess quality criteria of passenger railway trips in international routes. Brunner et al. [19] utilized the AHP method to compare fixed-rail transit alignment locations plotted in the Geographic Information System (GIS) environment. Liu et al. [20] integrated the analytic network process (ANP) and the technique of multiple regression to elicit the environmental impact of high-speed railway systems. Poorzahedy and Rezaei [21] applied several MCDM methods to rank alternative configurations of a light railway transit network.
Celik et al. [22] developed an interval type-2 fuzzy (VIšeKriterijumska Optimizacija i kompromisno Rešenje) VIKOR method to rank railway transit lines. They hybridized the statistical analysis, service quality (SERVQUAL) model, and direct rating method to classify and acquire criteria weights of passenger satisfaction criteria. Lu et al. [23] provided a simple fuzzy framework to determine critical risk factors in railway reconstruction projects. Nathanail [24] applied the Delphi-AHP approach to evaluate quality indicators of a railway network.
Aydin et al. [25] coupled the statistical analysis, fuzzy AHP method, and Choquet integral to compare railway transit lines from the passenger satisfaction perspective. Dhir et al. [26] used the cost–benefit analysis (CBA) and AHP method to identify the most suitable manufacturer for high-speed rail vehicles. An et al. [27] employed the fuzzy AHP method to obtain contributions of hazard groups in a shunting depot. Zhao et al. [28] used the fuzzy AHP method to prioritize fire emergency alternatives of an unattended train operation metro system.
Hamurcu and Eren [29] utilized the AHP and Technique for the Order Preference by Similarity to Ideal Solution (TOPSIS) methods to select the best monorail technology. Montesinos-Valera et al. [30] exploited the ANP method with benefits, opportunities, costs, and risks (BOCR) analysis to order projects for maintenance, renewal, and improvement of railway lines. Polat et al. [31] applied the fuzzy AHP-TOPSIS approach to compare rail suppliers in intercity construction projects. Song et al. [32] utilized the AHP method and interpretative structural modeling (ISM) approach to ascertain the importance and interrelations of vulnerability factors of urban rail transit operations, respectively. Stević et al. [33] combined the best–worst method (BWM), simple additive weighting (SAW) method, and rough numbers to select used rail wagons for carrying out internal transport.
Hamurcu and Eren [34] used the ANP method to prioritize railway construction projects. Mlinarić et al. [35] employed the Delphi-AHP approach to prioritize a common set of key performance indicators of railway intelligent transportation systems. Sharma et al. [36] combined the rough AHP and Multi-Attributive Border Approximation Area Comparison (MABAC) methods to rank railway stations from the service quality perspective. Wang et al. [37] utilized the AHP method and Fuzzy Reasoning Approach (FRA) to assess safety performances of railway track systems. Yadegari et al. [38] used the Delphi-ANP approach to prioritize factors affecting the development of an industry cluster of the rail industry.
Đorđević et al. [39] formulated a rough FUll Consistency Method (FUCOM) to compute subjective weights of service quality criteria in railway transport from the position of passengers with disabilities. Jasti and Ram [40] used the AHP method to appraise performance indicators and benchmark metro systems. Krmac and Djordjević [41] utilized the AHP method to obtain weights of strengths, weaknesses, opportunities, and threats of implementing rail traffic management systems. Norouzi and Namin [42] applied the fuzzy BWM-TOPSIS approach to sort risks of constructing railway megaprojects. Phanyakit and Satiennam [43] employed the AHP-SAW approach to select a rehabilitation alternative for railway tracks structure. Wu et al. [44] used the fuzzy ANP method to evaluate risks of constructing metro stations.
Recently, Blagojević et al. [45] coupled the DEA and SAW methods to rank railway line sections in terms of safety. Brumercikova and Sperka [46] used the AHP method to obtain an entrance order of freight carriers in railway stations. Huang et al. [47] utilized two objective criteria weighting methods and historical data to elicit risks of transporting dangerous goods by railway. Kumar and Anbanandam [48] applied the grey decision making trial and evaluation laboratory (DEMATEL) method to quantify relationships of prominent inhibitors to the implementation of railroad freight transport. Li et al. [49] presented a hybrid Pythagorean MULTIMOORA method to order rail transit lines according to the passenger satisfaction level. Majumdar et al. [50] exploited the TOPSIS method to prioritize key factors affecting metro rail infrastructure based on commuter perception. Sangiorgio et al. [51] integrated the AHP method and linear programming approach to estimate the number of accidents and assess the safety of railway networks. Stoilova [52] coupled the AHP and sequential interactive model of urban systems (SIMUS) methods to select railway passenger plans. Stoilova et al. [53] used the SIMUS method to compare railway transport systems of different countries. Vesković et al. [54] combined the pivot pairwise relative criteria importance assessment (PIPRECIA) and evaluation based on distance from average solution (EDAS) methods to rank options for achieving business balance in organizing railway traffic. Wang and Shi [55] applied an interval-valued intuitionistic fuzzy weighted average operator and maximum entropy method to prioritize the traffic service quality of urban railway transit lines. Zhang and Sun [56] formulated a Delphi-DEMATEL-ANP-TOPSIS approach to assess shunting derailment risk response strategies in railway stations. Tavassolirizi et al. [57] used the DEMATEL-ANP approach to prioritize key delay factors in implementing railway development projects and identify their interactions.

2.2. Applications and Extensions of the MARCOS Method

The MARCOS method is one of the latest MCDM approaches. Its applications and extensions are summarized in Table 2.
Badi and Pamucar [58] coupled the grey direct rating and MARCOS methods to evaluate suppliers for the iron and steel industry. Ilieva et al. [59] utilized the fuzzy MARCOS method to order cloud storage systems. Chakraborty et al. [60] ranked suppliers for the iron and steel industry based on D numbers and the MARCOS method. Puška et al. [61] used the MARCOS method to rank project management software solutions for facilitating business operations. Stanković et al. [62] developed a fuzzy MARCOS method to identify a road section with the highest traffic risk for all participants. They applied the fuzzy PIPRECIA method to determine the importance of criteria affecting the traffic risk. Stević and Brković [63] combined the FUCOM and MARCOS approach to compare performances of drivers engaged in international road transport. Stević et al. [14] developed the MARCOS method and used it to solve the sustainable supplier selection problem in the healthcare industry. Ulutaş et al. [16] integrated the correlation coefficient and standard deviation (CCSD), indifference threshold-based attribute ratio analysis (ITARA), and MARCOS methods to select manual stacker for performing logistics activities in warehouses.

2.3. Research Gaps

According to the performed comprehensive literature review, the research gaps are as follows: (i) No previous research has applied a PFS-based MCDM approach for railway transport. Hence, railway planners are unable to naturally express their preferences by voting; (ii) there is no risk assessment framework that can handle ambiguous, uncertain, and vague information, since only deterministic numbers and type-1 fuzzy sets have been used in the available studies; (iii) the direct rating and Tsallis–Havrda–Charvát entropy methods have not been hybridized before to determine the importance of risk factors; and (iv) the MARCOS method has not been extended previously using picture fuzzy sets.

3. Preliminaries

This section provides some definitions of picture fuzzy sets.
Definition 1
[6,7]. Let PFS A on a universe X is an object in the form of:
A ^ = { < x ,   μ A ^ ( x ) ,   η A ^ ( x ) ,   υ A ^ ( x ) > | x X } ,
where μ A ^ ( x ) [ 0 ,   1 ] is called the degree of positive membership of x in A ^ ; η A ^ ( x ) [ 0 ,   1 ] is the degree of neutral membership of x in A ^ ; υ A ^ [ 0 ,   1 ] is the degree of negative membership of x in A ^ ; and μ A ^ ( x ) , η A ^ ( x ) , and υ A ^ ( x ) satisfy the following condition:
0 μ A ^ ( x ) + η A ^ ( x ) + υ A ^ ( x ) 1 ,   x X .
The degree of refusal membership of x in the PFS A can be calculated as follows:
ξ A ^ ( x ) = 1 ( μ A ^ ( x ) + η A ^ ( x ) + υ A ^ ( x ) ) ,   x X .
If X has only one element, then A ^ = { < x ,   μ A ^ ( x ) ,   η A ^ ( x ) ,   υ A ^ ( x ) > | x X } is called a picture fuzzy number (PFN) in which μ A ^ ( x ) [ 0 ,   1 ] , η A ^ ( x ) [ 0 ,   1 ] , υ A ^ [ 0 ,   1 ] , and 0 μ A ^ ( x ) + η A ^ ( x ) + υ A ^ ( x ) 1 . For convenience, a PFN is denoted by A ^ = < μ A ^ ,   η A ^ ,   υ A ^ > [64,65].
Definition 2
[66]. As a generalization of the algebraic product and sum, and Einstein T-conorm and T-norm, the Hamacher T-conorm and T-norm is more general and more flexible. Let A ^ = < μ A ^ ,   η A ^ ,   υ A ^ > , A ^ 1 = < μ A ^ 1 ,   η A ^ 1 ,   υ A ^ 1 > , and A ^ 2 = < μ A ^ 2 ,   η A ^ 2 ,   υ A ^ 2 > be three PFNs, operational parameter ζ > 0, and λ > 0. The Hamacher T-norm and T-conorm operations of PFNs are defined as follows:
(a) Addition “⊕”
A ^ 1 A ^ 2 = < μ A ^ 1 + μ A ^ 2 μ A ^ 1 μ A ^ 2 ( 1 ζ ) μ A ^ 1 μ A ^ 2 1 ( 1 ζ ) μ A ^ 1 μ A ^ 2 ,   η A ^ 1 η A ^ 2 ζ + ( 1 ζ ) ( η A ^ 1 + η A ^ 2 η A ^ 1 η A ^ 2 ) , υ A ^ 1 υ A ^ 2 ζ + ( 1 ζ ) ( υ A ^ 1 + υ A ^ 2 υ A ^ 1 υ A ^ 2 ) > ,
(b) Multiplication “⊗”
A ^ 1 A ^ 2 = < μ A ^ 1 μ A ^ 2 ζ + ( 1 ζ ) ( μ A ^ 1 + μ A ^ 2 μ A ^ 1 μ A ^ 2 ) ,   η A ^ 1 + η A ^ 2 η A ^ 1 η A ^ 2 ( 1 ζ ) η A ^ 1 η A ^ 2 1 ( 1 ζ ) η A ^ 1 η A ^ 2 , υ A ^ 1 + υ A ^ 2 υ A ^ 1 υ A ^ 2 ( 1 ζ ) υ A ^ 1 υ A ^ 2 1 ( 1 ζ ) υ A ^ 1 υ A ^ 2 > ,
(c) Scalar multiplication
λ A ^ = < ( 1 + ( ζ 1 ) μ A ^ ) λ ( 1 μ A ^ ) λ [ 1 + ( ζ 1 ) μ A ^ ] λ + ( ζ 1 ) ( 1 μ A ^ ) λ ,   ζ ( η A ^ ) λ [ 1 + ( ζ 1 ) ( 1 η A ^ ) ] λ + ( ζ 1 ) ( η A ^ ) λ , ζ ( υ A ^ ) λ [ 1 + ( ζ 1 ) ( 1 υ A ^ ) ] λ + ( ζ 1 ) ( υ A ^ ) λ > ,
(d) Power
A ^ λ = < ζ ( μ A ^ ) λ [ 1 + ( ζ 1 ) ( 1 μ A ^ ) ] λ + ( ζ 1 ) ( μ A ^ ) λ ,   [ 1 + ( ζ 1 ) η A ^ ] λ ( 1 η A ^ ) λ [ 1 + ( ζ 1 ) η A ^ ] λ + ( ζ 1 ) ( 1 η A ^ ) λ , [ 1 + ( ζ 1 ) υ A ^ ] λ ( 1 υ A ^ ) λ [ 1 + ( ζ 1 ) υ A ^ ] λ + ( ζ 1 ) ( 1 υ A ^ ) λ > .
Definition 3
[67]. Let A ^ = { A ^ 1 ,   ,   A ^ f } and B ^ = { B ^ 1 ,   ,   B ^ f } be two PFSs in X. A function En: PFSs(X) → [0, 1] is an entropy on PFS, if En satisfies the following axiomatic requirements:
(a) Sharpness: E n ( A ^ ) = 0 , if and only if A ^ is a crisp set.
(b) Maximality: E n ( A ^ ) = 1 , if μ A ^ t = η A ^ t = υ A ^ t = ξ A ^ t = 0.25 for all t = 1, …, f.
(c) Resolution: E n ( A ^ ) E n ( B ^ ) , if A ^ ,   B ^ P F S ( x ) satisfy either μ A ^ t μ B ^ t , η A ^ t η B ^ t , υ A ^ t υ B ^ t when max { μ A ^ t ,   η A ^ t ,   υ A ^ t } 0.25 or μ A ^ t μ B ^ t , η A ^ t η B ^ t , υ A ^ t υ B ^ t when min { μ B ^ t ,   η B ^ t ,   υ B ^ t } 0.25 for all t = 1, …, f.
(d) Symmetry: E n ( A ^ ) = E n ( A ^ c ) , where A ^ c denotes the complement of A ^ .
Definition 4
[68]. Tsallis–Havrda–Charvát entropy [69,70] is a generalized form of Shannon entropy [71]. This well-known one-parametric entropy is suitable for real-world applications, since its strength lies in properties and applications. Let A ^ = { A ^ 1 ,   ,   A ^ f } be a PFS in X and χ > 0 (≠1) be the information measure parameter. The picture fuzzy Tsallis–Havrda–Charvát entropy measure of the PFS A is defined as follows:
E n T H C χ ( A ) = 1 f ( 1 χ ) t = 1 f { [ ( μ A ^ t ) χ + ( η A ^ t ) χ + ( υ A ^ t ) χ + ( ξ A ^ t ) χ ] 1 } ,   χ ( 0 ,   1 ) ( 1 ,   ) .
Definition 5
[66]. Let A ^ l = < μ A ^ l ,   η A ^ l ,   υ A ^ l > (l = 1, …, s) be a collection of PFNs, the operational parameter ζ > 0, and φ = (φ1, …, φs)T be the weight vector of the collection of PFNs with φl > 0 and l = 1 s φ l = 1 . The picture fuzzy Hamacher weighted average (PFHWA) operator is defined as follows:
P F H W A φ ( A ^ 1 ,   ,   A ^ s ) = l = 1 s ( φ l A ^ l ) = < l = 1 s [ 1 + ( ζ 1 ) μ A ^ l ] φ l l = 1 s ( 1 μ A ^ l ) φ l l = 1 s [ 1 + ( ζ 1 ) μ A ^ l ] φ l + ( ζ 1 ) l = 1 s ( 1 μ A ^ l ) φ l , ζ l = 1 s ( η A ^ l ) φ l l = 1 s [ 1 + ( ζ 1 ) ( 1 η A ^ l ) ] φ l + ( ζ 1 ) l = 1 s ( η A ^ l ) φ l ,   ζ l = 1 s ( υ A ^ l ) φ l l = 1 s [ 1 + ( ζ 1 ) ( 1 υ A ^ l ) ] φ l + ( ζ 1 ) l = 1 s ( υ A ^ l ) φ l > ,
Definition 6
[72,73]. Let A ^ = < μ A ^ ,   η A ^ ,   υ A ^ > be a PFN. A two-step defuzzification method to obtain a crisp value of the PFN A ^ is:
Step 1. Distribute the neutral degree to the positive and negative degrees as follows:
μ A ^ = μ A ^ + η A ^ 2 ,
υ A ^ = υ A ^ + η A ^ 2 .
Step 2. Calculate the crisp value y by:
y = μ A ^ + 1 + μ A ^ υ A ^ 2 ξ A ^ .

4. Picture Fuzzy Group MCDM Approach for Risk Assessment

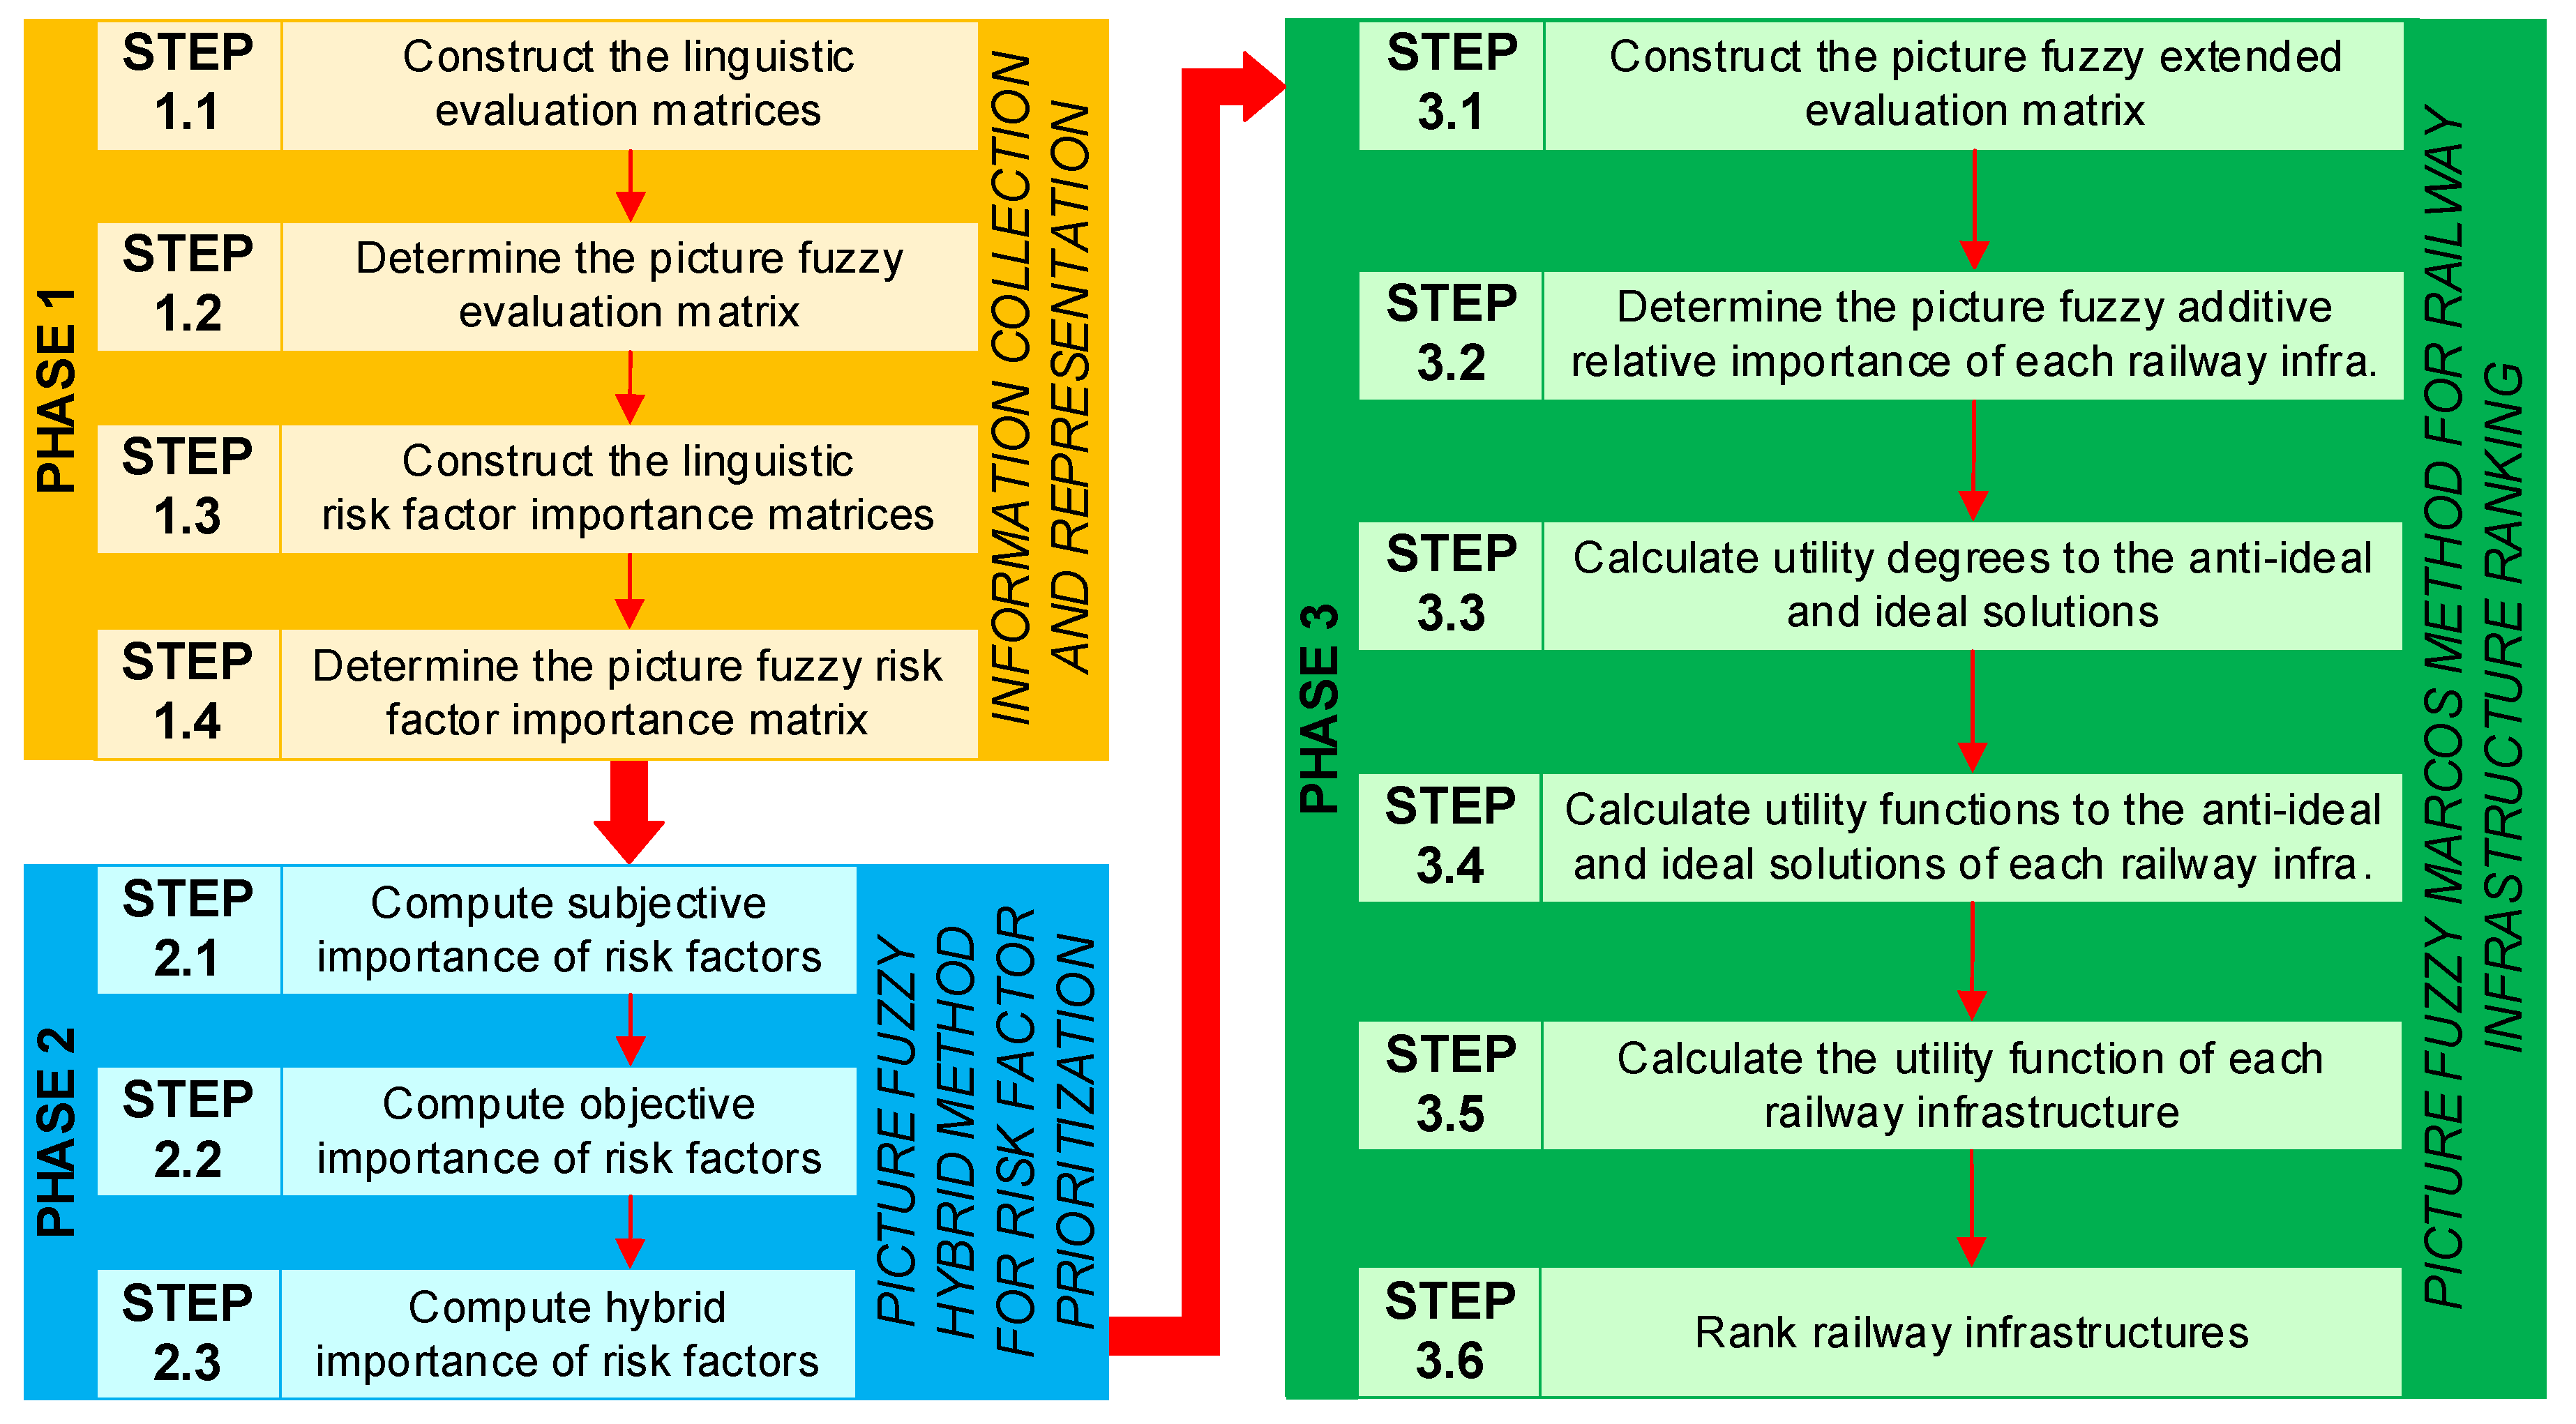
This section presents the developed picture fuzzy group MCDM approach for risk assessment of railway infrastructure (Figure 1). The approach has three phases. In the first phase, linguistic importance evaluations towards railway infrastructures and risk factors are collected from invited experts and expressed as PFNs. In the second phase, subjective, objective, and hybrid importance of risk factors are computed. This phase represents the formulated picture fuzzy hybrid method for risk factor prioritization. Firstly, the picture fuzzy direct rating method is utilized to compute the subjective importance of risk factors. Secondly, the picture fuzzy Tsallis–Havrda–Charvát entropy method is applied to calculate the objective importance of risk factors. Thirdly, the subjective and objective importance are hybridized. In the last phase, the formulated picture fuzzy MARCOS method is used to rank railway infrastructures.
Let A = {A1, …, Am} (m ≥ 2) be a finite set of railway infrastructures that experts have to choose from, D = {D1, …, Dk} (k ≥ 2) be a set of invited experts, and C = {C1, …, Cn} (n ≥ 2) be a finite set of risk factors. The phases and encompassed steps of the developed group MCDM approach are given in the following:
Phase 1.
Information collection and representation.
Step 1.1. Construct the linguistic evaluation matrices Γ i = [ γ e j i ] k × n :
C 1       C n Γ i = D 1 D k [ γ 1   1 i γ 1   n i γ k   1 i γ k   n i ] ,   i = 1 ,   ,   m ,
where m, k, and n are the number of railway infrastructures, invited experts, and risk factors, respectively; γ e j i (i = 1, …, m; e = 1, …, k; j = 1, …, n) is the linguistic evaluation (i.e., yes, abstain, no, or refusal) given by the invited expert De towards the railway infrastructure Ai with respect to the risk factor Cj.
Step 1.2. Determine the picture fuzzy evaluation matrix Z ^ = [ z ^ i j ] m × n :
    C 1         C n Z ^ = A 1 A m [ z ^ 1   1 z ^ 1   n z ^ m   1 z ^ m   n ] ,
where z ^ i j = < μ z ^ i j , η z ^ i j , υ z ^ i j > is a PFN, which represents an evaluation of the railway infrastructure Ai with respect to the risk factor Cj given by the invited experts. Importance evaluations are represented as PFNs by computing the share of each item (i.e., yes, abstain, no, or refusal) in the related voting results of the invited experts.
Step 1.3. Construct the linguistic risk factor importance matrices Ψ e = [ ψ j e ] n × 1 :
Ψ e = C 1 C n [ ψ 1 e ψ n e ] ,   e = 1 ,   , k ,
where ψ j e is the linguistic importance evaluation (i.e., yes, abstain, no, or refusal) given by the invited expert De towards the risk factor Cj.
Step 1.4. Determine the picture fuzzy risk factor importance matrix V ^ = [ v ^ j ] n × 1 :
V ^ = C 1 C n [ v ^ 1 v ^ n ] ,
where υ ^ j < μ υ ^ j , η υ ^ j , υ υ ^ j > is a PFN, which represents the importance evaluation of the risk factor Cj given by the invited experts. It is computed as the share of each item in the corresponding voting results of the invited experts.
Phase 2.
Picture fuzzy hybrid method for risk factor prioritization.
Step 2.1. Compute subjective importance of risk factors:
w j S = μ v ^ j + η v ^ j 2 + ξ v ^ j 2 ( 1 + μ v ^ j υ v ^ j ) t = 1 n [ μ v ^ t + η v ^ t 2 + ξ v ^ t 2 ( 1 + μ v ^ t υ v ^ t ) ] ,   j = 1 ,   ,   n ,
where υ ^ j < μ υ ^ j , η υ ^ j , υ υ ^ j > is a PFN, which represents the importance evaluation of the risk factor Cj given by the invited experts; and w S = ( w 1 S ,   ,   w n S ) T represents the subjective importance vector of the risk factors, with w j S [ 0 ,   1 ] and j = 1 n w j S = 1 . The subjective importance of risk factors are computed by using the picture fuzzy direct rating method.
Step 2.2. Compute objective importance of risk factors:
w j O = 1 1 m ( 1 χ ) i = 1 m { [ ( μ z ^ i j ) χ + ( η z ^ i j ) χ + ( υ z ^ i j ) χ + ( ξ z ^ i j ) χ ] 1 } t = 1 n { 1 1 m ( 1 χ ) l = 1 m { [ ( μ z ^ l t ) χ + ( η z ^ l t ) χ + ( υ z ^ l t ) χ + ( ξ z ^ l t ) χ ] 1 } ,   χ ( 0 ,   1 ) ( 1 ,   ) ;   j = 1 ,   ,   n ,
where z ^ i j = < μ z ^ i j , η z ^ i j , υ z ^ i j > is a PFN which represents an evaluation of the railway infrastructure Ai with respect to the risk factor Cj given by the experts; χ is the information measure parameter; and w O = ( w 1 O ,   ,   w n O ) T represents the objective importance vector of the risk factors, with w j O [ 0 ,   1 ] and j = 1 n w j O = 1 . The objective importance of risk factors are computed by using the picture fuzzy Tsallis–Havrda–Charvát entropy method.
Step 2.3. Compute hybrid importance of risk factors:
w j = γ w j S + ( 1 γ ) w j O ,   j = 1 ,   ,   n ,
where γ ∈ [0, 1] represents the trade-off parameter; w = ( w 1 ,   ,   w n ) T is the hybrid importance vector of the risk factors, with w j [ 0 ,   1 ] and j = 1 n w j = 1 . The risk factors have hybrid importance when γ ∈ (0, 1). They have exclusively subjective and objective importance when γ = 1 and γ = 0, respectively.
Phase 3.
Picture fuzzy MARCOS method for railway infrastructure ranking.
Step 3.1. Construct the picture fuzzy extended evaluation matrix Φ ^ = [ ϕ ^ i j ] ( m + 2 ) × n :
        C 1             C n Φ ^ = A 0 A 1 A m A m + 1 [ ϕ ^ 0   1 ϕ ^ 0   n ϕ ^ 1   1 ϕ ^ 1   n ϕ ^ m   1 ϕ ^ m   n ϕ ^ m + 1   1 ϕ ^ m + 1   n ] ,
where A = { A 0 ,   ,   A i ,   ,   A m + 1 } ( i = 0 ,   ,   m + 1 ) is a finite set of railway infrastructures; ϕ ^ i j = < μ ϕ ^ i j ,   η ϕ ^ i j ,   υ ϕ ^ i j > is a PFN which represents an evaluation of the railway infrastructure Ai with respect to the risk factor Cj given by the experts:
ϕ ^ i j = z ^ i j = < μ z ^ i j ,   η z ^ i j ,   υ z ^ i j > ,   i = 1 ,   ,   m ; j = 1 ,   ,   n ,
In this step, the picture fuzzy evaluation matrix is extended by adding the anti-ideal and ideal railway infrastructures.
(1) Anti-ideal railway infrastructure A 0 = { ϕ ^ 0   1 ,   ,   ϕ ^ 0   n } :
ϕ ^ 0   j = < μ ϕ ^ 0   j ,   η ϕ ^ 0   j ,   υ ϕ ^ 0   j > = < max i = 1 ,   ,   m μ z ^ i j ,   min i = 1 ,   ,   m η z ^ i j ,   min i = 1 ,   ,   m υ z ^ i j > ,   j = 1 ,   ,   n ,
where ϕ ^ 0   j = < μ ϕ ^ 0   j ,   η ϕ ^ 0   j ,   υ ϕ ^ 0   j > (j = 1, …, n) is a collection of PFNs, which represent anti-ideal values for each risk factor.
(2) Ideal railway infrastructure A m + 1 = { ϕ ^ m + 1   1 ,   ,   ϕ ^ m + 1   n } :
ϕ ^ m + 1   j = < μ ϕ ^ m + 1   j ,   η ϕ ^ m + 1   j ,   υ ϕ ^ m + 1   j > = < min i = 1 ,   ,   m μ z ^ i j ,   min i = 1 ,   ,   m η z ^ i j ,   max i = 1 ,   ,   m υ z ^ i j > ,   j = 1 ,   ,   n ,
where ϕ ^ m + 1   j = < μ ϕ ^ m + 1   j ,   η ϕ ^ m + 1   j ,   υ ϕ ^ m + 1   j > (j = 1, …, n) is a collection of PFNs which represent ideal values for each risk factor.
Step 3.2. Determine the picture fuzzy additive relative importance of each railway infrastructure as follows:
G ^ i = < μ G ^ i ,   η G ^ i ,   υ G ^ i > = P F H W A w ( ϕ ^ i 1 ,   ,   ϕ ^ i n ) = j = 1 n ( w j ϕ ^ i j ) = < j = 1 n [ 1 + ( ζ 1 ) μ ϕ ^ i j ] w j j = 1 n ( 1 μ ϕ ^ i j ) w j j = 1 n [ 1 + ( ζ 1 ) μ ϕ ^ i j ] w j + ( ζ 1 ) j = 1 n ( 1 μ ϕ ^ i j ) w j ,   ζ l = 1 n ( η ϕ ^ i j ) w j j = 1 n [ 1 + ( ζ 1 ) ( 1 η ϕ ^ i j ) ] w j + ( ζ 1 ) j = 1 n ( η ϕ ^ i j ) w j , ζ l = 1 n ( υ ϕ ^ i j ) φ l j = 1 n [ 1 + ( ζ 1 ) ( 1 υ ϕ ^ i j ) ] w j + ( ζ 1 ) j = 1 n ( υ ϕ ^ i j ) w j > ,   i = 0 ,   ,   m + 1 ; ζ > 0 .
where ζ is the operational parameter.
Step 3.3. Calculate utility degrees to the anti-ideal and ideal solutions of each railway infrastructure.
(1) Utility degree to the anti-ideal solution:
K i = μ G ^ i + η G ^ i 2 + ξ G ^ i 2 ( 1 + μ G ^ i υ G ^ i ) μ G ^ 0 + η G ^ 0 2 + ξ G ^ 0 2 ( 1 + μ G ^ 0 υ G ^ 0 ) ,   i = 0 ,   ,   m + 1 ,
(2) Utility degree to the ideal solution:
K i + = μ G ^ i + η G ^ i 2 + ξ G ^ i 2 ( 1 + μ G ^ i υ G ^ i ) μ G ^ m + 1 + η G ^ m + 1 2 + ξ G ^ m + 1 2 ( 1 + μ G ^ m + 1 υ G ^ m + 1 ) ,   i = 0 ,   ,   m + 1 .
Step 3.4. Calculate utility functions to the anti-ideal and ideal solutions.
(1) Utility function to the anti-ideal solution:
f ( K ) = K 0 + K 0 + K 0 + ,
(2) Utility function to the ideal solution:
f ( K + ) = K m + 1 K m + 1 + K m + 1 + .
Step 3.5. Calculate the utility function of each railway infrastructure as follows:
f ( K i ) = ( K i + K i + ) [ f ( K + ) f ( K ) ] f ( K ) + f ( K + ) f ( K ) f ( K + ) ,   i = 1 ,   ,   m ,
Step 3.6. Rank railway infrastructures.
Rank the railway infrastructures according to the increasing values of utility functions. The lowest value is the safest railway infrastructure.

5. Case Study

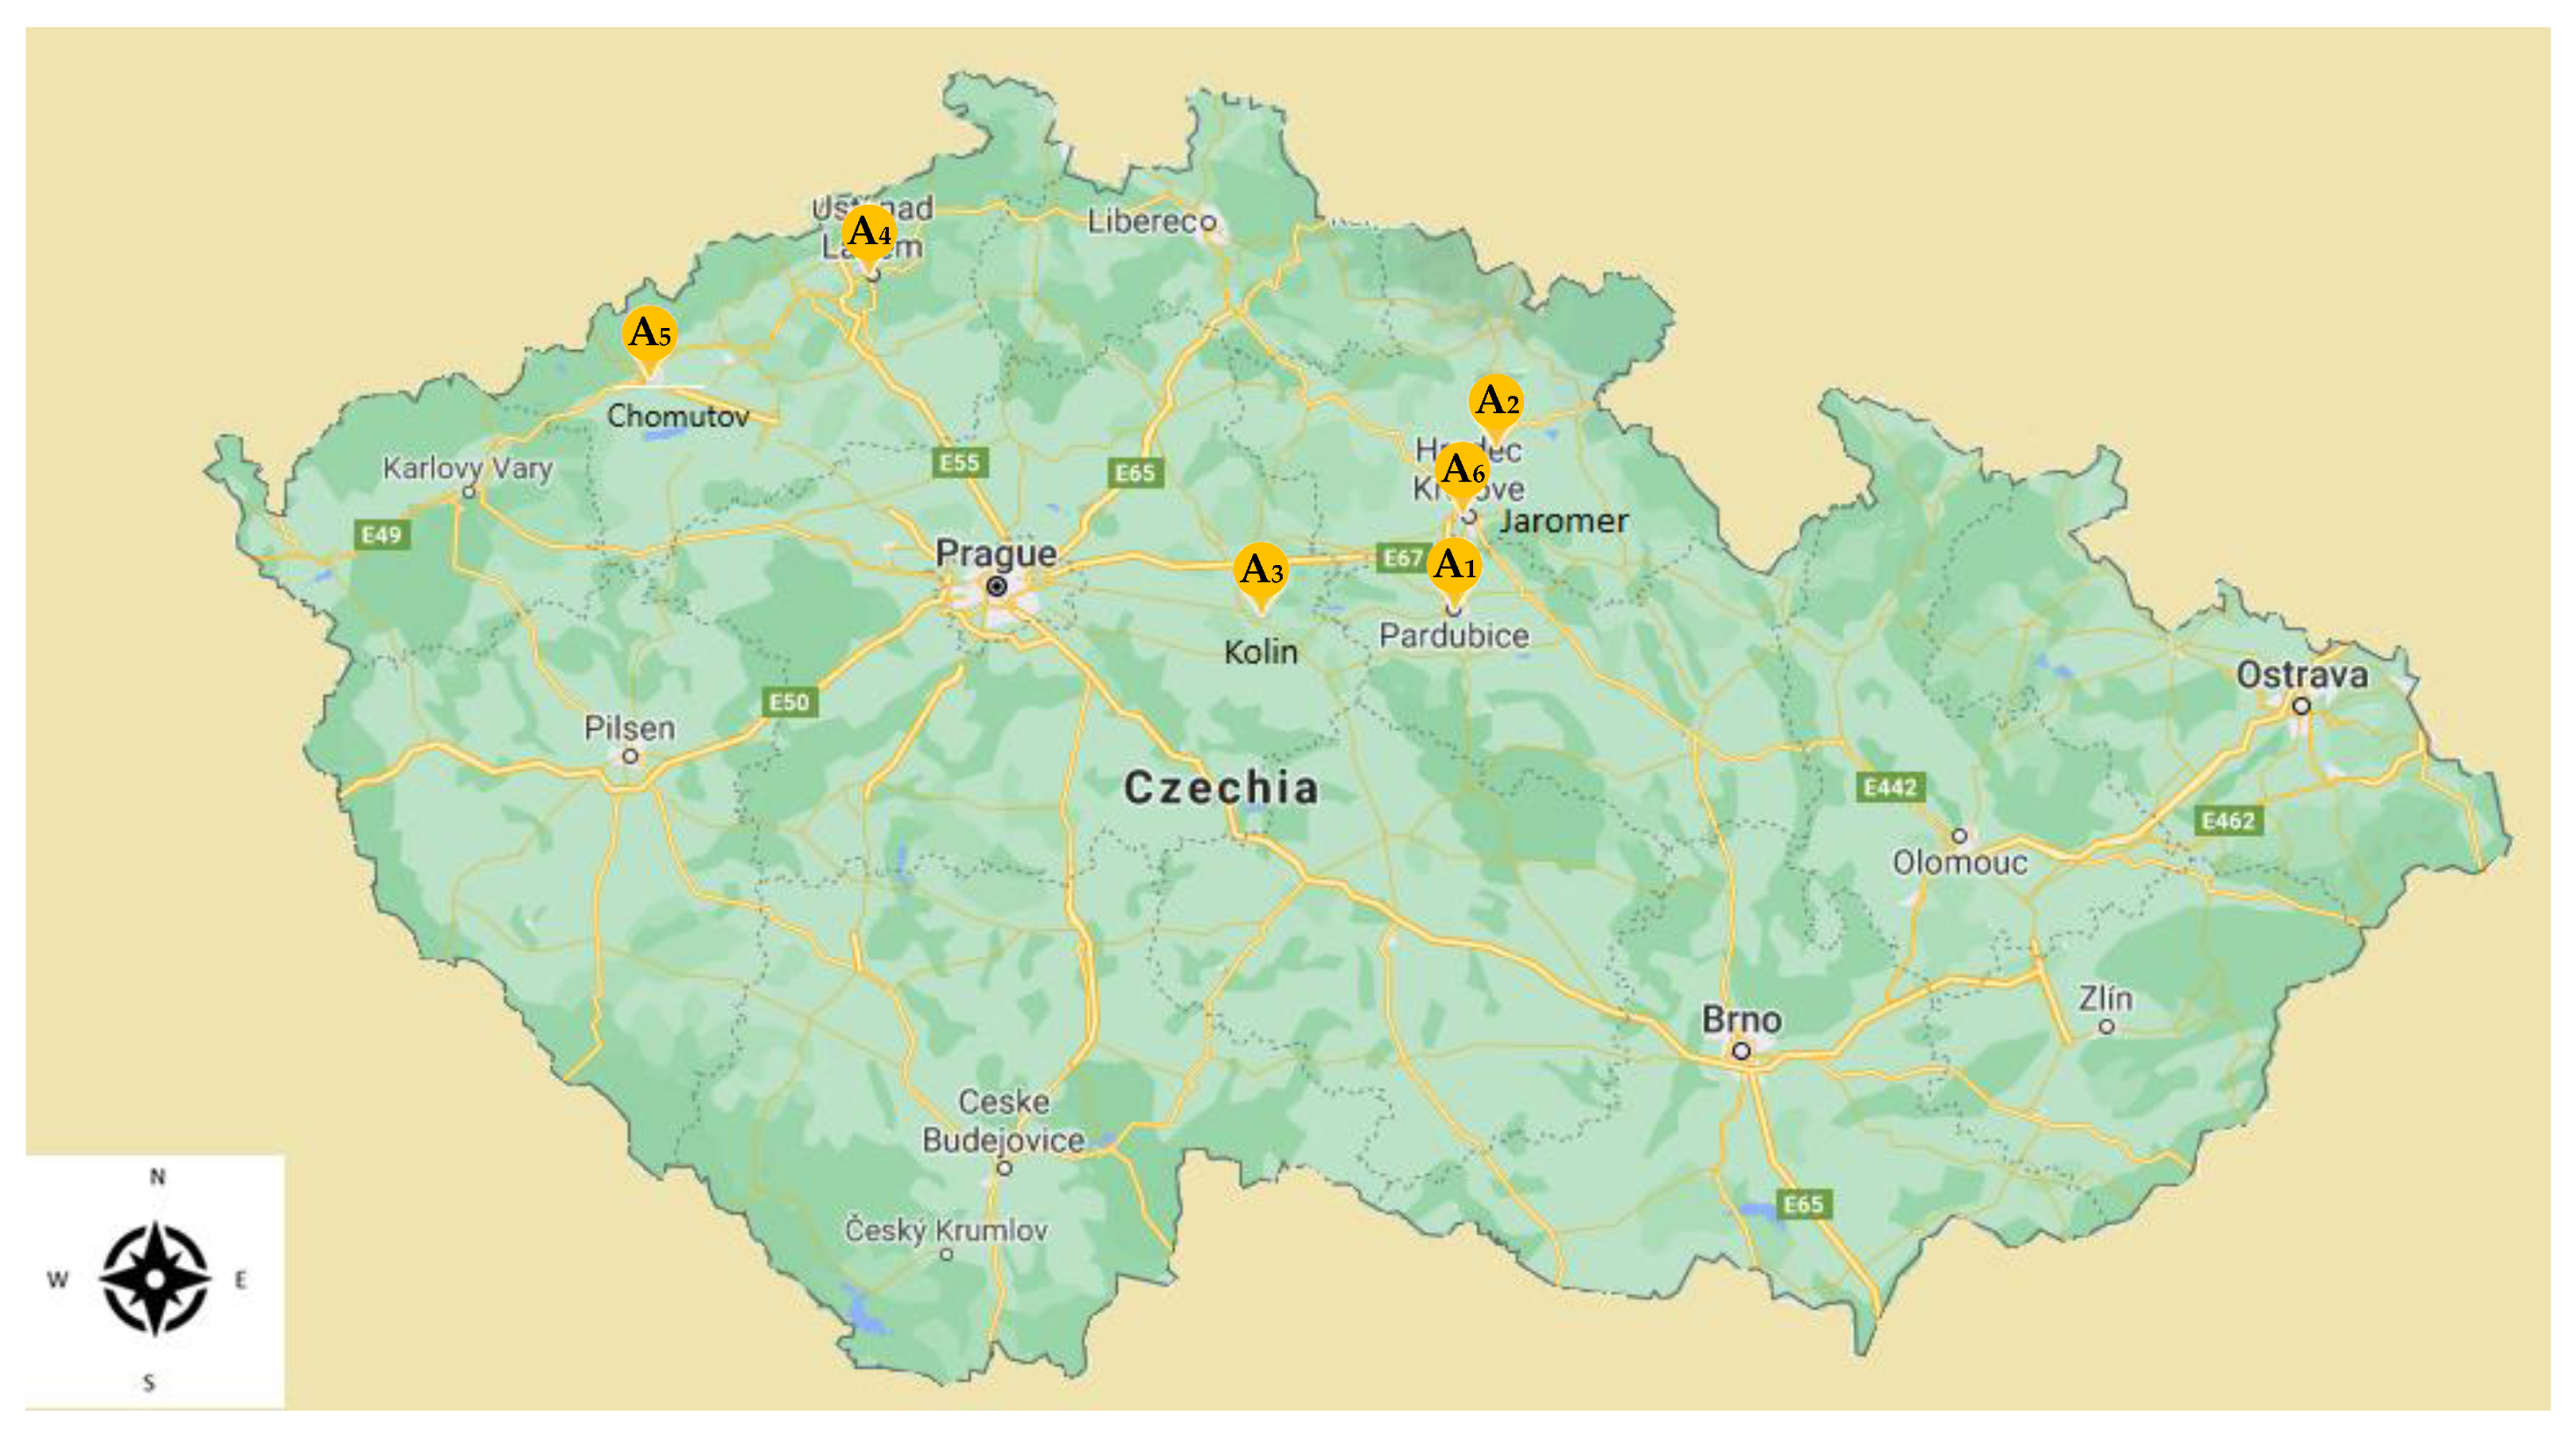
According to the 2020 census, the Czech Republic has 10.7 million inhabitants. More than 50% of the population use railway transportation. A real-life case study of risk assessment of railway infrastructure in the Czech Republic context is presented to evaluate railway infrastructure safety and demonstrate the utility of the formulated approach. The approach is used to prioritize twenty-three relevant risk factors (Table 3) and assess six railway infrastructures (Figure 2).
The investigated railway infrastructures in the Czech Republic context are:
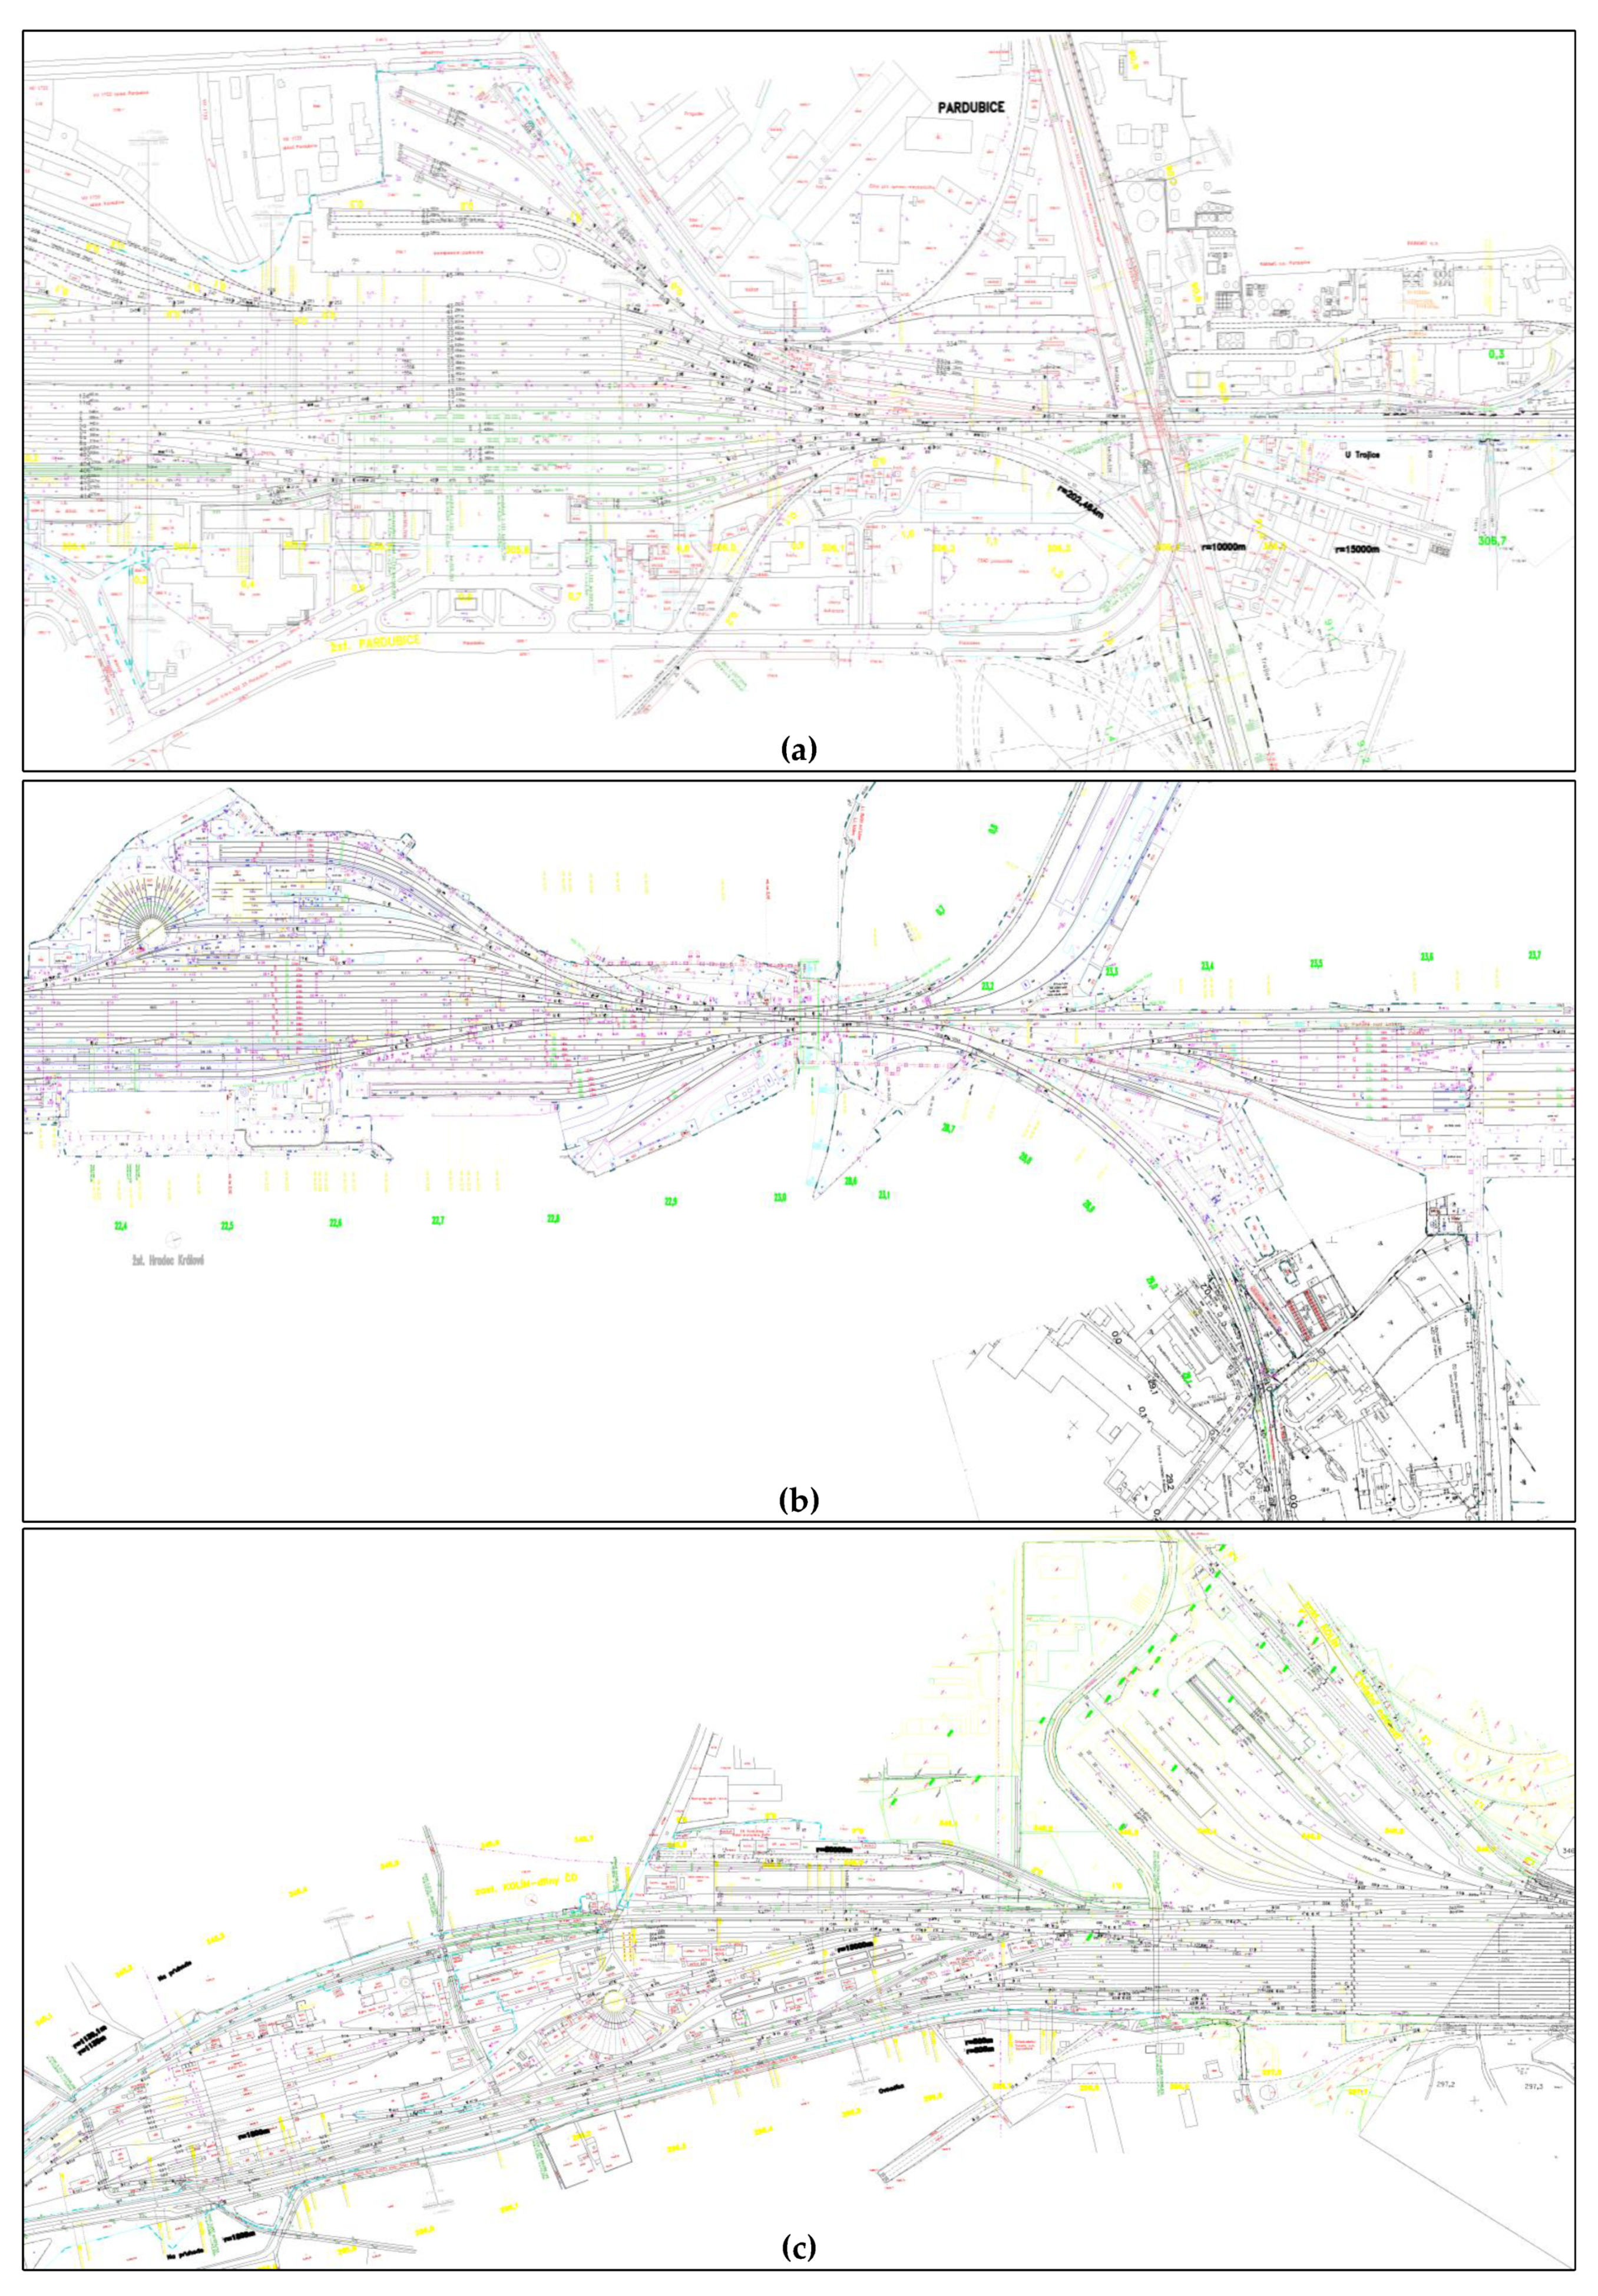
  • (A1) Pardubice (Figure 3a). The railway infrastructure of Pardubice is an important network hub. It is served by international and local trains. This railway infrastructure has connections to Prague, Brno, Bratislava, Budapest, and other large cities. The main railway station, operated by Czech Railways, is vital for passenger traffic and freight transport. Its passenger hall became a place where homeless people concentrate. This railway infrastructure was bombed several times during World War II and many reconstruction projects had been done. Additionally, few significant accidents occurred in the past.
  • (A2) Hradec Kralove (Figure 3b). It is well-connected with Pardubice. These two railway infrastructures are 21 km away. Hradec Kralove is also an important hub for both passengers and freight. Several significant accidents occurred. Since lots of people pass through its station, the risk of a terroristic attack is possible as well.
  • (A3) Kolin (Figure 3c). This railway infrastructure is located between the capital of the Czech Republic Prague and Pardubice. It is of huge importance for railway transportation in the Czech Republic as a whole, due to a high frequency of trains on the way to Prague. Several years ago, on the railway infrastructure in Kolin, illegal driving was noticed, but luckily there were no injuries and damage declared.
  • (A4) Usti nad Labem (Figure 3d). It is located near the border with Germany. This railway infrastructure counts many departures and arrivals of the local and international trains. Its railway station has been operable for more than sixty years. Due to its location, this railway infrastructure is exposed to various risks such as epidemics, terroristic attacks, and similar accidental events. In the past, some traffic accidents happened. For instance, a freight train passed a signal prohibiting driving and entered the built train path for a departing passenger train running along the adjacent track in the same direction. The drivers of both trains stopped in front of the switch, with the sides of the trains approaching each other less than a meter.
  • (A5) Chomutov (Figure 3e). The railway infrastructure in Chomutov is located in the north-west part of the Czech Republic. It is 86 km away from Prague and 50 km away from Usti nad Labem. Recently, this railway infrastructure had several significant accidents. In 2010, a freight train knocked down a woman and seriously injured her. In 2016, two people died after being hit by a freight train. The accident occurred at a railway crossing secured by a light warning signal without barriers. According to the information of the Railway Inspectorate, it was in operation at the time of the accident.
  • (A6) Jaromer (Figure 3f). This railway infrastructure connects Hradec Kralove with Pardubice. Some causes of accidents that happened in the past are walking on the track, passing a signal prohibiting driving, derailment of a train on the ground that was washed up on the track after torrential rain, and track defects.
A systematic approach is carried out to identify relevant risk factors influencing railway infrastructure in the Czech Republic from the literature [74,75]. Risk factors that do not apply to the Czech Republic context are not listed in Table 3. Each risk is briefly described in Table 3.

6. Results and Discussion

6.1. Experimental Results

Six assessed railway infrastructures in the Czech Republic context are “Pardubice” (A1), “Hradec Kralove” (A2), “Kolin” (A3), “Usti nad Labem” (A4), “Chomutov” (A5), and “Jaromer” (A6). Twenty-three risk factors influencing railway infrastructure are considered (Table 3). Ten railway planners participated in the case study (Table 4).
The online questionnaire approach via Google Forms was utilized to collect evaluations of risk factors and railway infrastructures due to the COVID-19 outbreak. In the first part of the online questionnaire, the invited railway planners are asked to enter their e-mail address, name, occupation, qualifications, total years of experience, and gender. In the second part, the experts are asked to evaluate twenty-three risk factors influencing railway infrastructure in the Czech Republic. In the last part, the participants are requested to provide linguistic evaluations of six investigated railway infrastructures with respect to the risk factors.
Phase 1.
Information collection and representation.
Step 1.1. The invited railway planners provided evaluations of six railway infrastructures in the Czech Republic with respect to the risk factors via the online questionnaire. Importance evaluations can be yes, abstain, no, and refusal. Group refusal of voting either is invalid voting papers or does not take the vote. As a result, six linguistic evaluation matrices are constructed with the help of Equation (13). Linguistic evaluations given by 10 relevant railway planners towards the railway infrastructures with respect to twenty-three risk factors are presented in Table 5.
Step 1.2. A picture fuzzy evaluation of railway infrastructure with respect to a risk factor is calculated as the proportion of each out of four items (i.e., yes, abstain, no, or refusal) in the corresponding online voting results of 10 questioned railway planners. The picture fuzzy evaluation matrix is given in Table 6. It is determined based on six linguistic evaluation matrices (Table 5) by using Equation (14).
Step 1.3. Twenty-three risk factors influencing railway infrastructure are evaluated by the relevant experts (Table 7). A sample of the online questionnaire to determine the importance of the risk factors is given in the Appendix A. Ten linguistic risk factor importance matrices are constructed by using Equation 15.
Step 1.4. A picture fuzzy evaluation of a risk factor is computed as the proportion of each out of four items in the corresponding results of the online questionnaire. The picture fuzzy risk factor importance matrix is provided in Table 8. It is determined based on ten linguistic risk factor importance matrices (Table 7) with the help of Equation (16).
Phase 2.
Picture fuzzy hybrid method for risk factor prioritization.
Step 2.1. The subjective importance and ranks of twenty-three risk factors are given in Table 9. The values are determined based on the railway planners’ voting on the risk factors influencing railway infrastructure (Table 8) by using the picture fuzzy direct rating method defined in Equation (17).
Step 2.2. The objective importance and ranks of the risk factors are presented in Table 9. The values are calculated based on the railway planners’ voting on six railway infrastructures (Table 6) by using the picture fuzzy Tsallis–Havrda–Charvát entropy method defined in Equation (18). In the base case scenario, it is adopted that the information measure parameter χ of the developed picture fuzzy group MCDM approach for risk assessment of railway infrastructure is 1.4.
Step 2.3. The hybrid importance and ranks of the risk factors influencing railway infrastructure are provided in Table 9. The values are computed by using Equation (19). In the base case scenario, it is assumed that the value of the trade-off parameter γ of the formulated picture fuzzy group MCDM approach is 0.5. This value equally appraises the picture fuzzy direct rating method and the picture fuzzy Tsallis–Havrda–Charvát entropy method.
Phase 3.
Picture fuzzy MARCOS method for railway infrastructure ranking.
Step 3.1. Anti-ideal and ideal railway infrastructures are determined by employing Equations (22) and (23), respectively. The picture fuzzy evaluation matrix (Table 6) is extended by adding the anti-ideal and ideal railway infrastructures. The resulting matrix is given in Table 10.
Step 3.2. The picture fuzzy additive relative importance of the anti-ideal and ideal railway infrastructures, as well as six real-life railway infrastructures, are calculated by applying the picture fuzzy Hamacher weighted average operator defined in Equation (24). The obtained values can be found in Table 11. In the base case scenario, it is assumed that the operational parameter ζ of the developed picture fuzzy group MCDM approach for risk assessment of railway infrastructure is 3.
Step 3.3. The utility degrees to the anti-ideal and ideal solutions of railway infrastructures are given in Table 11. They are calculated based on the picture fuzzy additive relative importance of railway infrastructures with the help of Equations (25) and (26).
Step 3.4. According to Equation (27), the utility function to the anti-ideal solution is 0.708. On the other hand, the utility function to the ideal solution is 0.292. This value is obtained by using Equation (28).
Step 3.5. Table 11 provides the utility function for the assessed railway infrastructures. The values are calculated with the help of Equation (29).
Step 3.6. Six railway infrastructures in the Czech Republic context are ranked according to the increasing values of the utility functions (Table 11). The ranking order is A6 (Jaromer) ≻ A2 (Hradec Kralove) ≻ A5 (Chomutov) ≻ A3 (Kolin) ≻ A1 (Pardubice) ≻ A4 (Usti nad Labem). As a result, the presented picture fuzzy group MCDM approach for risk assessment of railway infrastructure ranked “Jaromer” (A6) as the safest. Additionally, it is found that “Usti nad Labem” (A4) has the highest risk in the Czech Republic context.

6.2. Sensitivity Analyses

The sensitivity analyses to changes in the trade-off and operational parameters of the presented picture fuzzy group MCDM approach are performed to check the robustness of the obtained railway infrastructure risk assessment results.
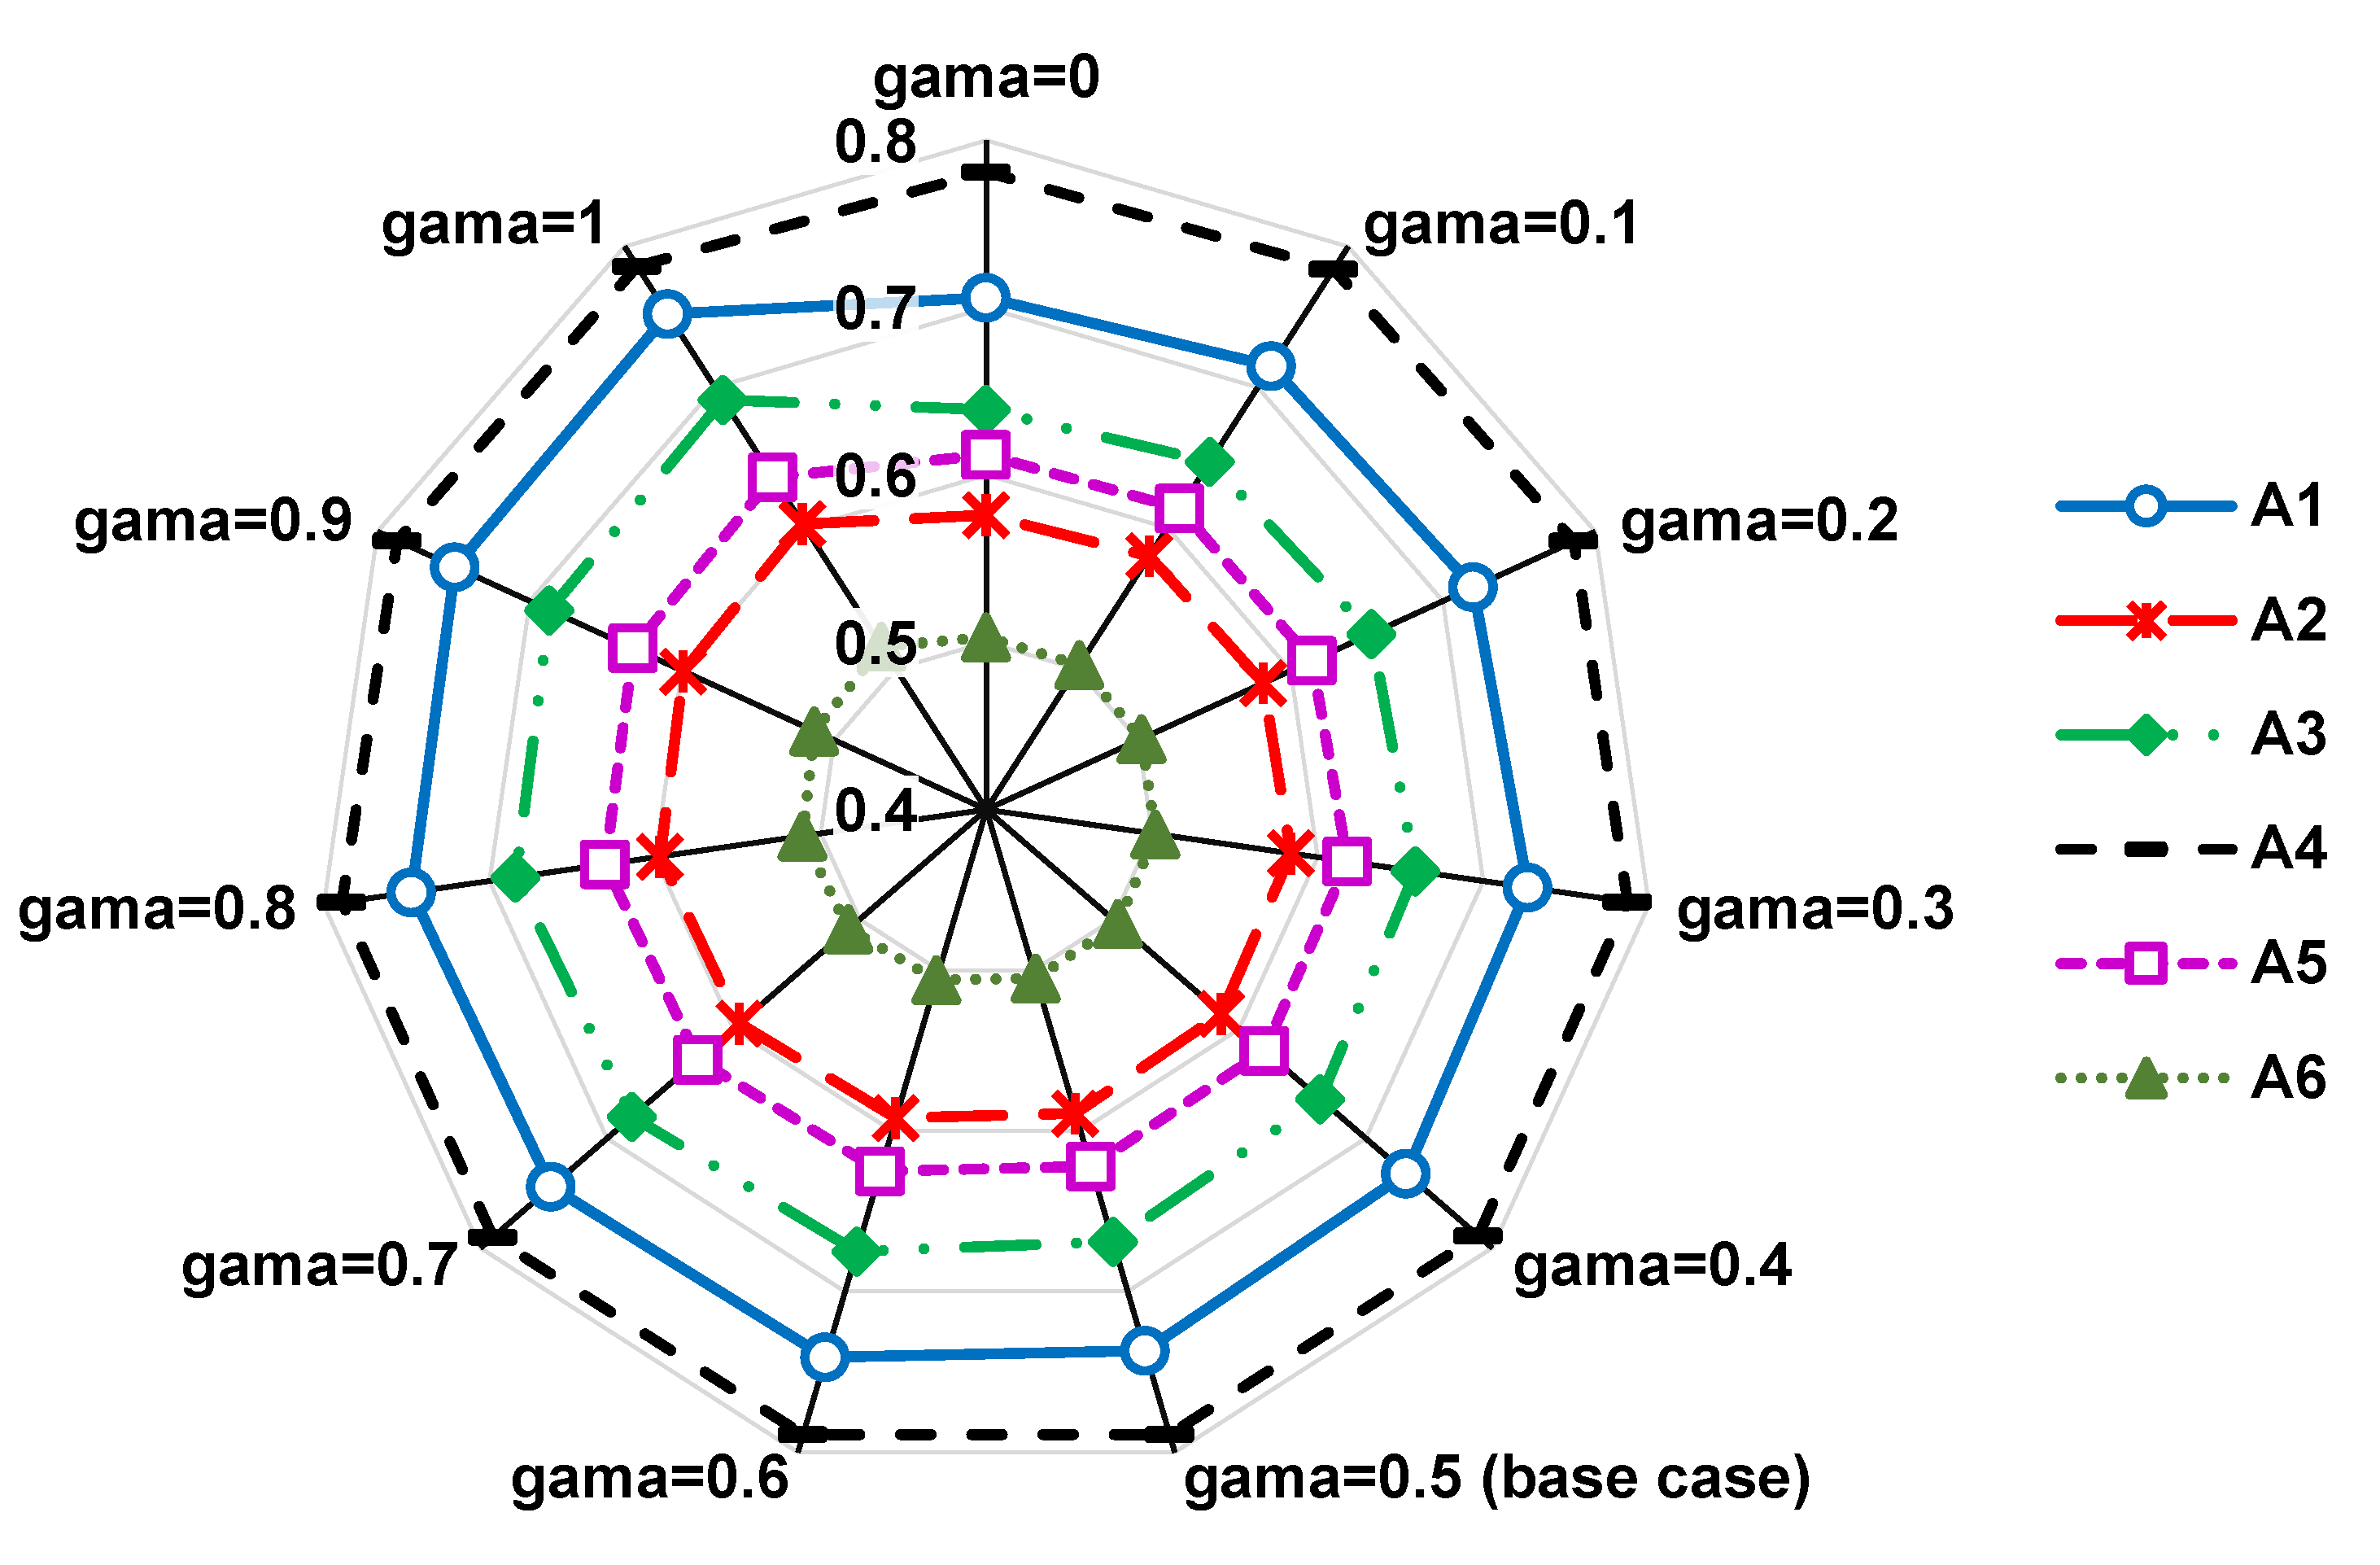
The first sensitivity analysis thoroughly explores how the trade-off parameter γ of the novel picture fuzzy hybrid method influences the ranking order of the railway infrastructures in the Czech Republic context. This method based on the direct rating and Tsallis–Havrda–Charvát entropy prioritizes the risk factors influencing railway infrastructure. More detailed, the subjective importance of a risk factor is based on importance evaluations of that risk factor by the invited railway planners. Its value is computed by using the picture fuzzy direct rating method. On the other hand, the objective importance of a risk factor is based on the railway planners’ voting on six railway infrastructures. Its value is calculated by using the picture fuzzy Tsallis–Havrda–Charvát entropy method. Since different input data are used to obtain the subjective and objective ranking orders as well as the number of considered risk factors is large, significant differences in the ranking order of the risk factors are expected.
The parameter γ allows practitioners to make a trade-off between the picture fuzzy direct rating and Tsallis–Havrda–Charvát entropy methods; i.e., a compromise amongst subjective and objective importance of the risk factors. In this regard, the parameter γ is changed in the range [0, 1] with an increment value of 0.1 (Figure 4). When γ = 1, only the picture fuzzy direct rating method is applied to subjectively prioritize the risk factors. When γ = 0, the picture fuzzy Tsallis–Havrda–Charvát entropy method is solely used to objectively evaluate the risk factors. Therefore, in the base case scenario, γ was set to 0.5 to equally appraise both methods and generate hybrid risk factor importance. According to Figure 4, “Jaromer” (A6) is the best railway infrastructure under all γ values, since its utility function has the lowest value. Moreover, there is no change in the ranks of any railway infrastructure in all 10 new test cases; i.e., the railway infrastructure ranking order is A6A2A5A3A1A4. As a result, it is identified that the railway infrastructure risk assessment results of the investigated real-life context are very stable to changes in the trade-off parameter γ.
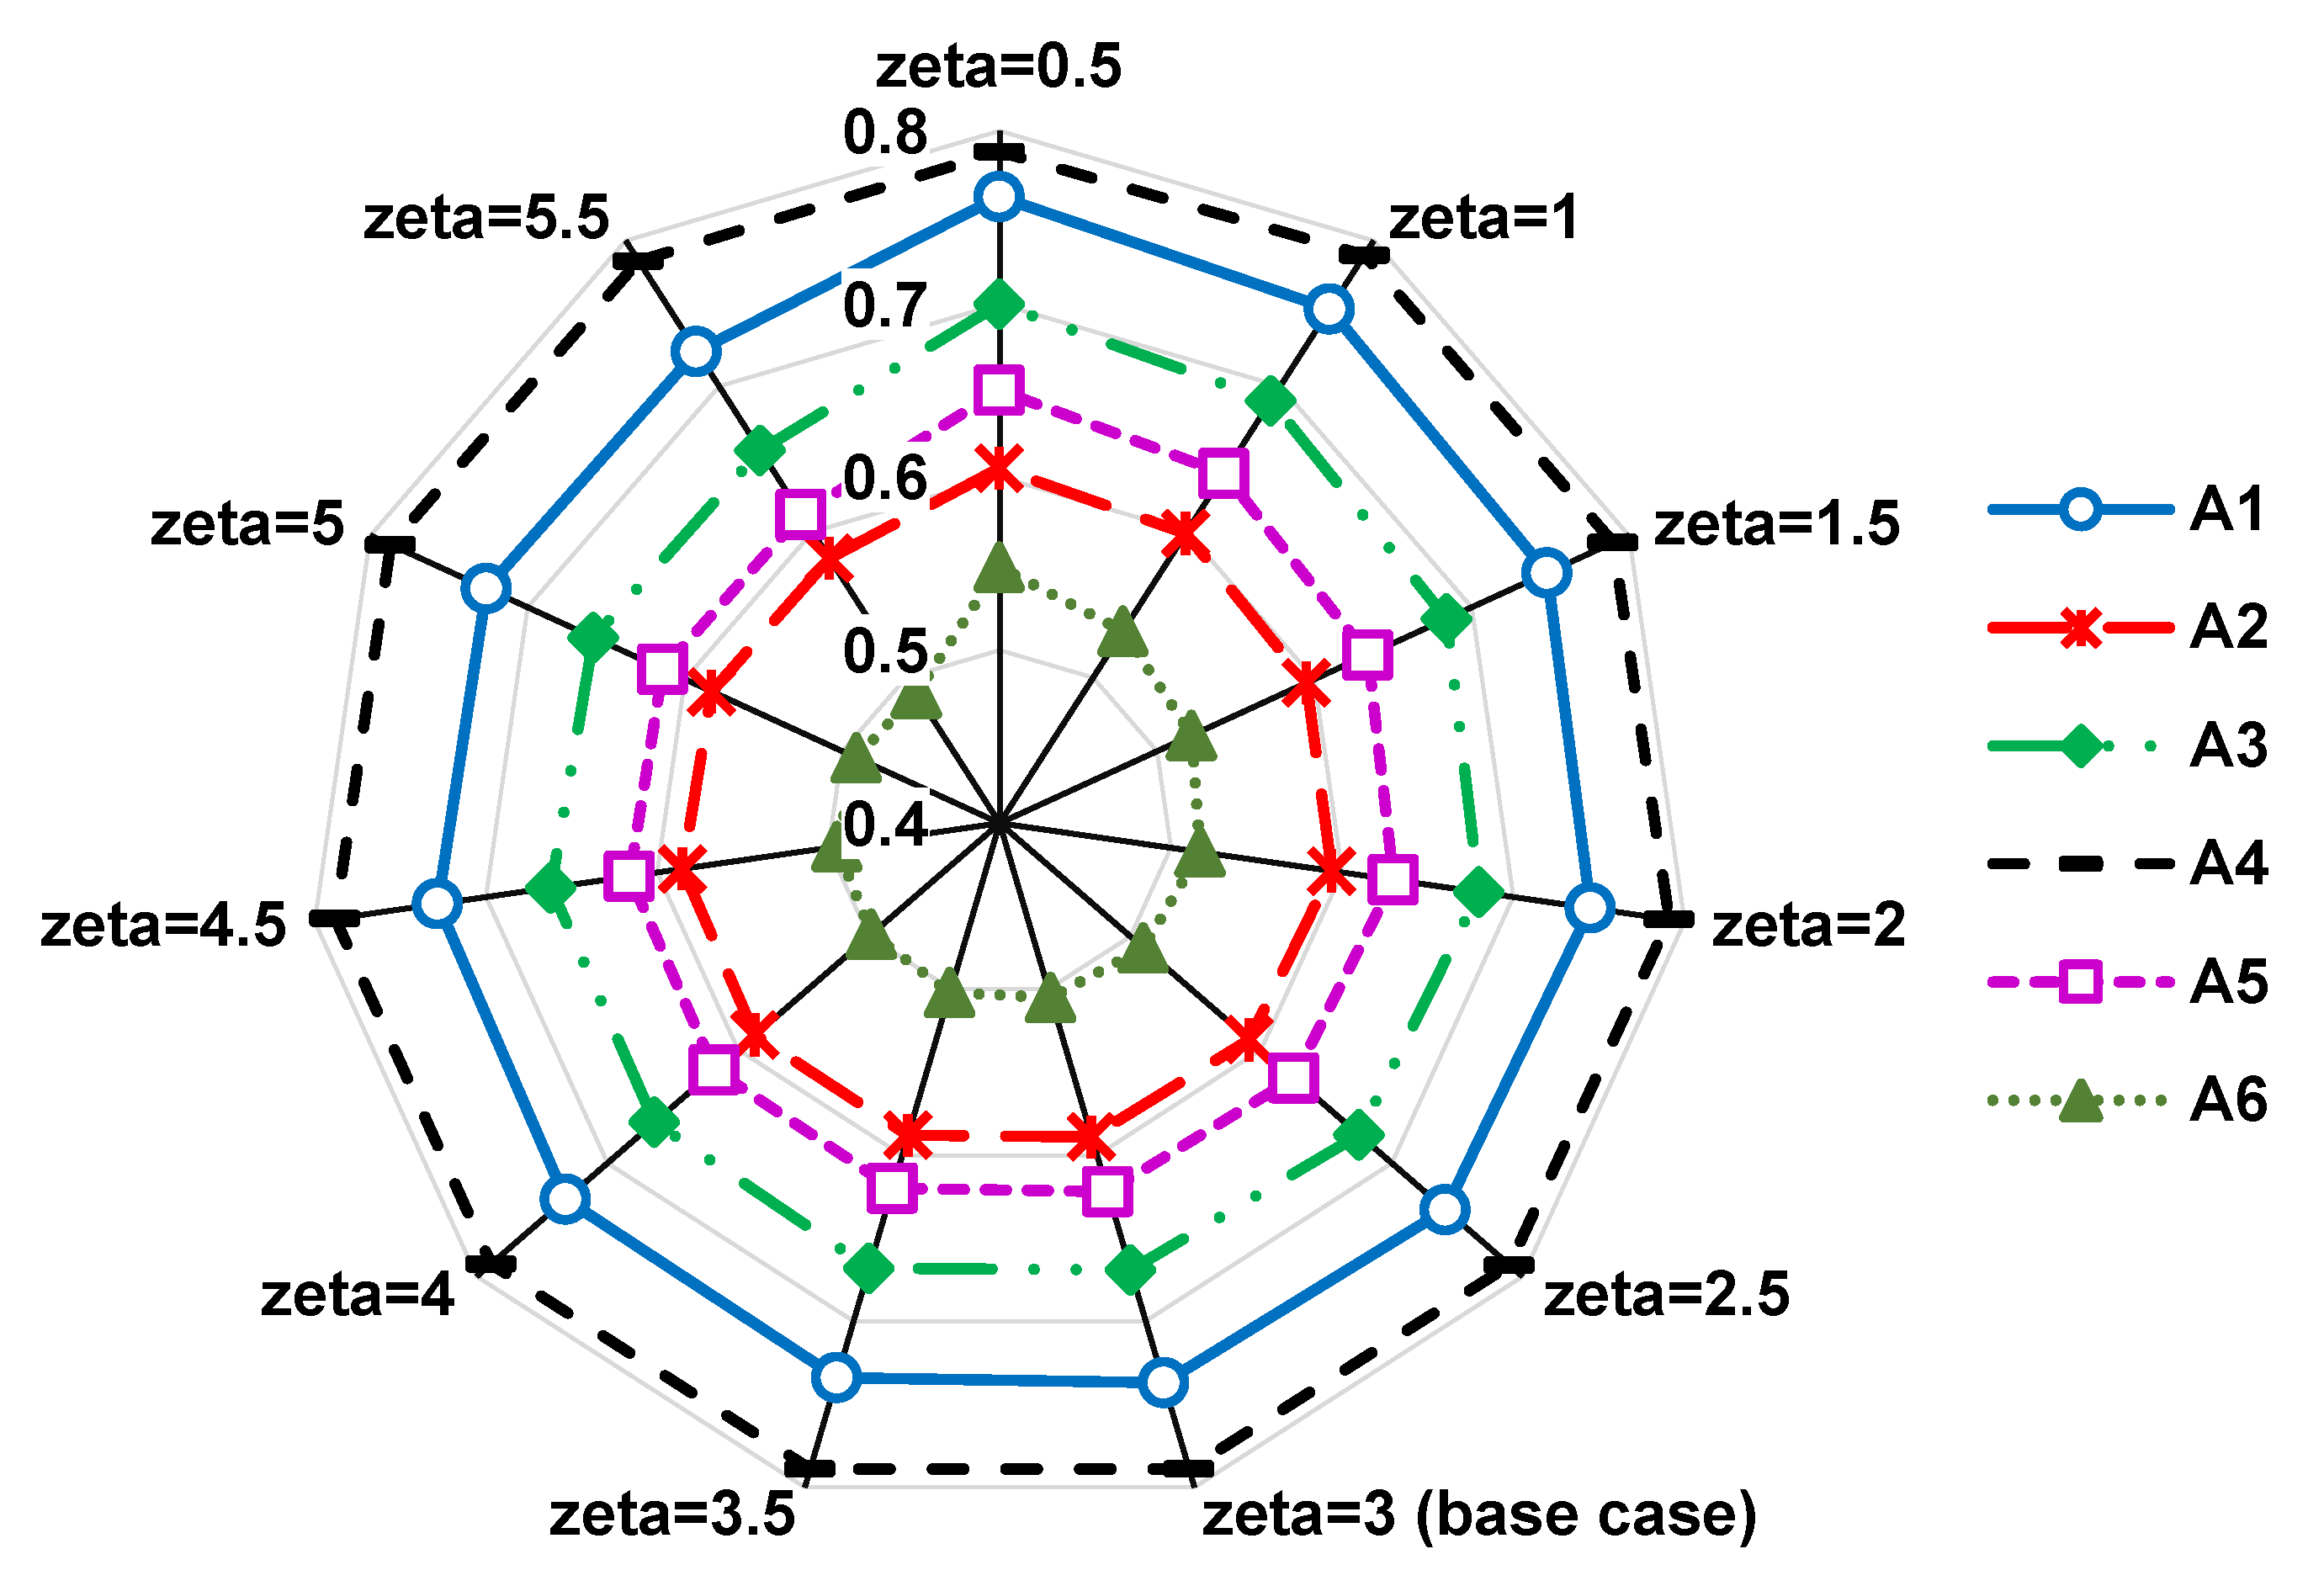
The second sensitivity analysis is performed to check the robustness of generated solutions to changes in the operational parameter ζ of the developed picture fuzzy group MCDM approach for risk assessment of railway infrastructure (Figure 5). When ζ = 1, the Hamacher T-norm and T-conorm reduce to probabilistic T-norm and T-conorm, respectively. When ζ = 2, the Hamacher T-norm and T-conorm reduce to Einstein T-norm and T-conorm, respectively. As a result, in the base case scenario, it was assumed that ζ is 3. Ten additional test cases are created to systematically analyze the influence of the operational parameter; i.e., ζ ∈ {0.5, 1, 1.5, 2, 2.5, 3.5, 4, 4.5, 5, 5.5}. In all additional test cases, the ranking order of the railway infrastructures in the Czech Republic context is A6A2A5A3A1A4 (Figure 5). This result was obtained in the base case scenario. It is found that the ranks of the railway infrastructures are very stable to changes in the operational parameter ζ.
According to the results of both sensitivity analyses, it can be outlined that the formulated picture fuzzy group MCDM approach for risk assessment of railway infrastructure is highly robust.

6.3. Comparative Analysis

The comparative analysis is performed to check the reliability of the presented results of the developed picture fuzzy group MCDM approach for risk assessment of railway infrastructure. The railway infrastructure risk assessment problem in the Czech Republic context is solved with five available state-of-the-art picture fuzzy approaches: (1) picture fuzzy TOPSIS [76], (2) picture fuzzy EDAS [77], (3) picture fuzzy grey relational analysis [78], (4) picture fuzzy grey relational projection [79], and (5) picture fuzzy cross-entropy [80].
The comparison results are presented in Table 12. The developed picture fuzzy group MCDM approach and picture fuzzy grey relational projection generate the identical ranking order of the railway infrastructures; i.e., A6 (Jaromer) ≻ A2 (Hradec Kralove) ≻ A5 (Chomutov) ≻ A3 (Kolin) ≻ A1 (Pardubice) ≻ A4 (Usti nad Labem). On the other hand, the picture fuzzy TOPSIS, grey relational analysis, and cross-entropy produce the same ranking order; i.e., A6 (Jaromer) ≻ A5 (Chomutov) ≻ A2 (Hradec Kralove) ≻ A3 (Kolin) ≻ A1 (Pardubice) ≻ A4 (Usti nad Labem). Six compared approaches assess “Jaromer” (A6) as the safest railway infrastructure of the analyzed real-life context. The proposed approach, picture fuzzy grey relational projection and picture fuzzy EDAS, rank “Hradec Kralove” (A2) as the second-best railway infrastructure. The other three approaches put this railway infrastructure in the third position and evaluate “Chomutov” (A5) as the second-best. “Kolin” (A3) holds the fourth position in five out of six approaches. Only the picture fuzzy EDAS puts this railway infrastructure in the third place. “Pardubice” (A1) is the second-worst railway infrastructure in five out of six approaches. Finally, “Usti nad Labem” (A4) is the worst-ranked in all approaches.
According to the results of the comparative analysis, it can be outlined that the developed approach for risk assessment of railway infrastructure is highly reliable.
The ranking similarity between six compared approaches is examined by Spearman’s rank correlation coefficient. This quantitative metric reveals the strength of the relationship between compared approaches (Table 13).
The picture fuzzy group MCDM approach for risk assessment of railway infrastructure has 93.2% of ranks matched. Additionally, there is a perfect relationship between the formulated approach and picture fuzzy grey relational projection. Finally, a very strong correlation exists between the introduced approach and picture fuzzy TOPSIS, EDAS, grey relational analysis, and cross-entropy.
According to the results of Spearman’s rank correlation analysis (Table 13), it can be outlined that the introduced approach for risk assessment of railway infrastructure produces highly consistent results.

7. Conclusions

The picture fuzzy group MCDM approach for risk assessment of railway infrastructure is introduced in this paper. Its major contributions are: (i) For the first time, PFSs are employed for representing railway planners’ preferences and handling risk-related information; (ii) the novel picture fuzzy hybrid method based on the direct rating and Tsallis–Havrda–Charvát entropy is provided to prioritize risk factors influencing railway infrastructure; (iii) the new picture fuzzy MARCOS method is developed to rank railway infrastructures; and (iv) the formulated approach is implemented in the Czech Republic context.
The merits of the presented real-life case study are: (a) The utility of the introduced approach is demonstrated; (b) the high robustness of the formulated approach is verified by two sensitivity analyses, since the ranks of the railway infrastructures are very stable to changes in the trade-off and operational parameters; (c) the high reliability of the developed approach is approved by the comparative analysis with the picture fuzzy TOPSIS, EDAS, grey relational analysis, grey relational projection, and cross-entropy; and (d) the high consistency with five state-of-the-art picture fuzzy approaches is confirmed by Spearman’s rank correlation analysis, since 93.2% of railway infrastructure ranks are matched.
The picture fuzzy group MCDM approach for risk assessment of railway infrastructure generates the following ranking order: A6 (Jaromer) ≻ A2 (Hradec Kralove) ≻ A5 (Chomutov) ≻ A3 (Kolin) ≻ A1 (Pardubice) ≻ A4 (Usti nad Labem). This novel approach identified “Jaromer” as the safest. On the other hand, the worst-ranked railway infrastructure is “Usti nad Labem”. It has the highest risk in the Czech Republic context. As a result, it is strongly recommended to undertake a safety improvement project for this railway infrastructure.
The picture fuzzy grey relational analysis and grey relational projection are one-parametric approaches with build-in distinguishing coefficients. The picture fuzzy TOPSIS, EDAS, and cross-entropy have no parameters. On the other hand, the formulated approach involves three intrinsic parameters, which is highly desirable for solving the complex railway infrastructure risk assessment problem. They are the trade-off parameter γ, the operational parameter ζ, and the information measure parameter χ. As a result, compared to the state-of-the-art picture fuzzy approaches, the provided three-parametric approach has superior flexibility in assessing the risk of railway infrastructure.
Limitations of this paper can indicate its possible extension areas. The limitations are: (1) The risk factors influencing railway infrastructure are not filtered; (2) interrelationships between the risk factors are mainly ignored. A well-known technique for filtering influential factors is the Delphi method. It is traditionally used to obtain a consistent flow of answers through the results of questionnaires. Its major features are anonymous response, iteration and controlled feedback, and finally statistical group response. In a future study, an online multi-round questionnaire approach, in line with the Delphi method, could be performed to collect risk-related information and overcome the first limitation. On the other hand, the DEMATEL method is mostly applied for modeling interrelationships of influential factors. This method has not been extended before into the picture fuzzy environment. One of the future researches may integrate a picture fuzzy DEMATEL method into the introduced methodological framework for risk assessment to handle the second limitation. Additionally, a comparison of the risk factors influencing railway infrastructure in the Czech Republic with risk factors proposed by other researchers can also be seen as an interesting topic that deserves a future research effort. Finally, the introduced methodological approach can be used not only for risk assessment of railway infrastructure but also in macro-level issues. Indicatively, various risks exist in different frames, due to climate change, like fires, floods, droughts, hurricanes, and tornadoes, which affect social and economic life seriously.

Author Contributions

Conceptualization: V.S., R.S. and S.J.; methodology: V.S.; software: V.S.; data curation: V.S., R.S. and S.J.; writing—original draft preparation: V.S., R.S. and S.J.; writing—review and editing: V.S., R.S. and S.J.; visualization, V.S., R.S., and S.J.; supervision: V.S. and R.S. All authors have read and agreed to the published version of the manuscript.

Funding

This research received no external funding.

Acknowledgments

The first author thanks Miloš Milenković for valuable comments on an earlier version of this paper. The authors are grateful for the valuable comments of five anonymous reviewers, who helped to improve the manuscript greatly.

Conflicts of Interest

The authors declare no conflict of interest.

Appendix A

Sample questionnaire—Importance of risk factors influencing railway infrastructure in the Czech Republic.
Response in each row is not required since a participant can refuse to vote on a particular risk factor. There are three responses/columns to choose from: YES—risk factor is important for railway infrastructure; ABSTAIN—if you are not certain about the importance of a risk factor; NO—risk factor is not important for railway infrastructure.
YESABSTAINNO
(1) Prolonged drought
(2) Extreme temperatures
(3) Flood
(4) Heavy rainfall
(5) Extreme wind
(6) Epidemics
(7) Epiphytia
(8) Epizootics
(9) Disrupted food supplies
(10) Disrupted communication systems
(11) Critical information infrastructure violation
(12) Special flood
(13) Hazardous chemical leakage
(14) Disrupted water supply
(15) Disrupted gas supply
(16) Disrupted oil supplies
(17) Radiation accidents
(18) Disrupted electricity supply
(19) Migration wave
(20) Legality violation
(21) Economic destabilization
(22) Military assault
(23) Human factor failure

References

  1. Cheng, Y.H. Railway safety climate: A study on organizational development. Int. J. Occup. Saf. Ergon. 2019, 25, 200–216. [Google Scholar] [CrossRef] [PubMed]
  2. Chang, L.; Dong, W.; Yang, J.; Sun, X.; Xu, X.; Zhang, L. Hybrid belief rule base for regional railway safety assessment with data and knowledge under uncertainty. Inf. Sci. 2020, 518, 376–395. [Google Scholar] [CrossRef]
  3. Huang, W.; Shuai, B.; Zuo, B.; Xu, Y.; Antwi, E. A systematic railway dangerous goods transportation system risk analysis approach: The 24 model. J. Loss Prev. Process Ind. 2019, 61, 94–103. [Google Scholar] [CrossRef]
  4. European Union Agency for Railways (EUAR). Report on Railway Safety and Interoperability in the EU—2020. 2020. Available online: https://www.era.europa.eu/library/corporate-publications/safety-and-interoperability-progress-reports_en (accessed on 15 November 2020).
  5. International Union of Railways (IUR). UIC Safety Report 2019, Significant Accidents 2018—Public Report. 2019. Available online: https://safetydb.uic.org/IMG/pdf/sdb_report_2019_public.pdf (accessed on 15 November 2020).
  6. Cuong, B.C.; Kreinovich, V. Picture fuzzy sets—A new concept for computational intelligence problems. In Proceedings of the Third World Congress on Information and Communication Technologies, Hanoi, Vietnam, 15–18 December 2013; pp. 1–6. [Google Scholar] [CrossRef] [Green Version]
  7. Cuong, B.C. Picture fuzzy sets. J. Comput. Sci. Cybern. 2014, 30, 409–420. [Google Scholar] [CrossRef] [Green Version]
  8. Khan, M.J.; Kumam, P.; Deebani, W.; Kumam, W.; Shah, Z. Bi-parametric distance and similarity measures of picture fuzzy sets and their applications in medical diagnosis. Egypt. Inform. J. 2020, in press. [Google Scholar] [CrossRef]
  9. Luo, M.; Zhang, Y. A new similarity measure between picture fuzzy sets and its application. Eng. Appl. Artif. Intell. 2020, 96, 103956. [Google Scholar] [CrossRef]
  10. Koczy, L.T.; Jan, N.; Mahmood, T.; Ullah, K. Analysis of social networks and Wi-Fi networks by using the concept of picture fuzzy graphs. Soft Comput. 2020, 24, 16551–16563. [Google Scholar] [CrossRef]
  11. Wang, L.; Zhang, H.Y.; Wang, J.Q.; Wu, G.F. Picture fuzzy multi-criteria group decision-making method to hotel building energy efficiency retrofit project selection. RAIRO Oper. Res. 2020, 54, 211–229. [Google Scholar] [CrossRef] [Green Version]
  12. Ganie, A.H.; Singh, S.; Bhatia, P.K. Some new correlation coefficients of picture fuzzy sets with applications. Neural Comput. Appl. 2020, 32, 12609–12625. [Google Scholar] [CrossRef]
  13. Singh, A.; Kumar, S. Picture fuzzy Choquet integral-based VIKOR for multicriteria group decision-making problems. Granul. Comput. 2020. [Google Scholar] [CrossRef]
  14. Stević, Ž.; Pamučar, D.; Puška, A.; Chatterjee, P. Sustainable supplier selection in healthcare industries using a new MCDM method: Measurement of alternatives and ranking according to COmpromise solution (MARCOS). Comput. Ind. Eng. 2020, 140, 106231. [Google Scholar] [CrossRef]
  15. Gong, X.; Yang, M.; Du, P. Renewable energy accommodation potential evaluation of distribution network: A hybrid decision-making framework under interval type-2 fuzzy environment. J. Clean. Prod. 2020, 124918. [Google Scholar] [CrossRef]
  16. Ulutaş, A.; Karabasevic, D.; Popovic, G.; Stanujkic, D.; Nguyen, P.T.; Karaköy, Ç. Development of a novel integrated CCSD-ITARA-MARCOS decision-making approach for stackers selection in a logistics system. Mathematics 2020, 8, 1672. [Google Scholar] [CrossRef]
  17. Mohajeri, N.; Amin, G.R. Railway station site selection using analytical hierarchy process and data envelopment analysis. Comput. Ind. Eng. 2010, 59, 107–114. [Google Scholar] [CrossRef]
  18. Sivilevičius, H.; Maskeliūnaite, L. The criteria for identifying the quality of passengers’ transportation by railway and their ranking using AHP method. Transport 2010, 25, 368–381. [Google Scholar] [CrossRef] [Green Version]
  19. Brunner, I.M.; Kim, K.; Yamashita, E. Analytic hierarchy process and geographic information systems to identify optimal transit alignments. Transp. Res. Rec. J. Transp. Res. Board 2011, 2215, 59–66. [Google Scholar] [CrossRef]
  20. Liu, K.F.R.; Hsu, C.-Y.; Yeh, K.; Chen, C.-W. Hierarchical analytic network process and its application in environmental impact evaluation. Civil Eng. Environ. Syst. 2011, 28, 1–18. [Google Scholar] [CrossRef]
  21. Poorzahedy, H.; Rezaei, A. Peer evaluation of multi-attribute analysis techniques: Case of a light rail transit network choice. Sci. Iran. 2013, 20, 371–386. [Google Scholar] [CrossRef]
  22. Celik, E.; Aydin, N.; Gumus, A.T. A multiattribute customer satisfaction evaluation approach for rail transit network: A real case study for Istanbul, Turkey. Transp. Policy 2014, 36, 283–293. [Google Scholar] [CrossRef]
  23. Lu, S.T.; Yu, S.H.; Chang, D.S. Using fuzzy multiple criteria decision-making approach for assessing the risk of railway reconstruction project in Taiwan. Sci. World J. 2014, 239793. [Google Scholar] [CrossRef] [Green Version]
  24. Nathanail, E. Framework for monitoring and assessing performance quality of railway network infrastructure: Hellenic Railways case study. J. Infrastruct. Syst. 2014, 20, 04014019. [Google Scholar] [CrossRef]
  25. Aydin, N.; Celik, E.; Gumus, A.T. A hierarchical customer satisfaction framework for evaluating rail transit systems of Istanbul. Transp. Res. Part A Policy Pract. 2015, 77, 61–81. [Google Scholar] [CrossRef]
  26. Dhir, S.; Marinov, M.V.; Worsley, D. Application of the analytic hierarchy process to identify the most suitable manufacturer of rail vehicles for High Speed 2. Case Stud. Transp. Policy 2015, 3, 431–448. [Google Scholar] [CrossRef]
  27. An, M.; Qin, Y.; Jia, L.M.; Chen, Y. Aggregation of group fuzzy risk information in the railway risk decision making process. Saf. Sci. 2016, 82, 18–28. [Google Scholar] [CrossRef]
  28. Zhao, B.; Tang, T.; Ning, B. Applying hybrid decision-making method based on fuzzy AHP-WOWA operator for emergency alternative evaluation of unattended train operation metro system. Math. Probl. Eng. 2016, 4105079. [Google Scholar] [CrossRef] [Green Version]
  29. Hamurcu, M.; Eren, T. Selection of monorail technology by using multicriteria decision making. Sigma J. Eng. Nat. Sci. 2017, 8, 303–314. [Google Scholar]
  30. Montesinos-Valera, J.; Aragonés-Beltrán, P.; Pastor-Ferrando, J.P. Selection of maintenance, renewal and improvement projects in rail lines using the analytic network process. Struct. Infrastruct. Eng. 2017, 13, 1476–1496. [Google Scholar] [CrossRef]
  31. Polat, G.; Eray, E.; Bingol, B.N. An integrated fuzzy MCGDM approach for supplier selection problem. J. Civ. Eng. Manag. 2017, 23, 926–942. [Google Scholar] [CrossRef]
  32. Song, L.; Li, Q.; List, G.F.; Deng, Y.; Lu, P. Using an AHP-ISM based method to study the vulnerability factors of urban rail transit system. Sustainability 2017, 9, 1065. [Google Scholar] [CrossRef] [Green Version]
  33. Stević, Ž.; Pamučar, D.; Kazimieras-Zavadskas, E.; Ćirović, G.; Prentkovskis, O. The selection of wagons for the internal transport of a logistics company: A novel approach based on rough BWM and rough SAW methods. Symmetry 2017, 9, 264. [Google Scholar] [CrossRef] [Green Version]
  34. Hamurcu, M.; Eren, T. A fuzzy analytical network process approach to the selection of the rail system projects. Sigma J. Eng. Nat. Sci. 2018, 9, 415–426. [Google Scholar]
  35. Mlinarić, T.J.; Đorđević, B.; Krmac, E. Evaluation framework for key performance indicators of railway ITS. Promet-Traffic Transp. 2018, 30, 491–500. [Google Scholar] [CrossRef]
  36. Sharma, H.K.; Roy, J.; Kar, S.; Prentkovskis, O. Multi criteria evaluation framework for prioritizing Indian railway stations using modified rough AHP-MABAC method. Transp. Telecommun. J. 2018, 19, 113–127. [Google Scholar] [CrossRef] [Green Version]
  37. Wang, L.; An, M.; Qin, Y.; Jia, L. A risk-based maintenance decision-making approach for railway asset management. Int. J. Softw. Eng. Knowl. Eng. 2018, 28, 453–483. [Google Scholar] [CrossRef]
  38. Yadegari, R.; Rahmani, K.; Khiyabani, F.M. Identification and prioritization of effective factors on the creation and development of industry cluster of rail industries using network analysis technique. Braz. J. Oper. Prod. Manag. 2018, 15, 490–498. [Google Scholar] [CrossRef] [Green Version]
  39. Đorđević, D.; Stojić, G.; Stević, Ž.; Pamučar, D.; Vulević, A.; Mišić, V. A new model for defining the criteria of service quality in rail transport: The full consistency method based on a rough power Heronian aggregator. Symmetry 2019, 11, 992. [Google Scholar] [CrossRef] [Green Version]
  40. Jasti, P.C.; Ram, V.V. Integrated and sustainable benchmarking of metro rail system using analytic hierarchy process and fuzzy logic: A case study of Mumbai. Urban Rail Transit 2019, 5, 155–171. [Google Scholar] [CrossRef] [Green Version]
  41. Krmac, E.; Djordjević, B. A multi-criteria decision-making framework for the evaluation of train control information systems, the case of ERTMS. Int. J. Inf. Technol. Decis. Mak. 2019, 18, 209–239. [Google Scholar] [CrossRef] [Green Version]
  42. Norouzi, A.; Namin, H.G. A hybrid fuzzy TOPSIS–Best Worst Method for risk prioritization in megaprojects. Civ. Eng. J. 2019, 5, 1257–1272. [Google Scholar] [CrossRef]
  43. Phanyakit, T.; Satiennam, T. Fuzzy multi-attribute decision making for the selection of a suitable railway track maintenance plan: A case study in Thailand. Int. J. GEOMATE 2019, 17, 96–104. [Google Scholar] [CrossRef]
  44. Wu, L.; Bai, H.; Yuan, C.; Xu, C. FANPCE technique for risk assessment on subway station construction. J. Civ. Eng. Manag. 2019, 25, 599–616. [Google Scholar] [CrossRef]
  45. Blagojević, A.; Stević, Ž.; Marinković, D.; Kasalica, S.; Rajilić, S. A novel entropy-fuzzy PIPRECIA-DEA model for safety evaluation of railway traffic. Symmetry 2020, 12, 1479. [Google Scholar] [CrossRef]
  46. Brumercikova, E.; Sperka, A. Problems of access to services at railway stations in freight transport in the Slovak Republic. Sustainability 2020, 12, 8018. [Google Scholar] [CrossRef]
  47. Huang, W.; Zhang, Y.; Yu, Y.; Xu, Y.; Xu, M.; Zhang, R.; Liu, Z. Historical data-driven risk assessment of railway dangerous goods transportation system: Comparisons between Entropy Weight Method and Scatter Degree Method. Reliab. Eng. Syst. Saf. 2020, 107236. [Google Scholar] [CrossRef]
  48. Kumar, A.; Anbanandam, R. Evaluating the interrelationships among inhibitors to intermodal railroad freight transport in emerging economies: A multi-stakeholder perspective. Transp. Res. Part A Policy Pract. 2020, 132, 559–581. [Google Scholar] [CrossRef]
  49. Li, X.H.; Huang, L.; Li, Q.; Liu, H.C. Passenger satisfaction evaluation of public transportation using Pythagorean fuzzy MULTIMOORA method under large group environment. Sustainability 2020, 12, 4996. [Google Scholar] [CrossRef]
  50. Majumdar, B.B.; Dissanayake, D.; Rajput, A.S.; Saw, Y.Q.; Sahu, P.K. Prioritizing metro service quality attributes to enhance commuter experience: TOPSIS ranking and importance satisfaction analysis methods. Transp. Res. Rec. 2020, 2674, 124–139. [Google Scholar] [CrossRef]
  51. Sangiorgio, V.; Mangini, A.M.; Precchiazzi, I. A new index to evaluate the safety performance level of railway transportation systems. Saf. Sci. 2020, 131, 104921. [Google Scholar] [CrossRef]
  52. Stoilova, S. An integrated multi-criteria approach for planning railway passenger transport in the case of uncertainty. Symmetry 2020, 12, 949. [Google Scholar] [CrossRef]
  53. Stoilova, S.; Munier, N.; Kendra, M.; Skrúcaný, T. Multi-criteria evaluation of railway network performance in countries of the TEN-T Orient–East Med corridor. Sustainability 2020, 12, 1482. [Google Scholar] [CrossRef] [Green Version]
  54. Vesković, S.; Stević, Ž.; Karabašević, D.; Rajilić, S.; Milinković, S.; Stojić, G. A new integrated fuzzy approach to selecting the best solution for business balance of passenger rail operator: Fuzzy PIPRECIA-fuzzy EDAS model. Symmetry 2020, 12, 743. [Google Scholar] [CrossRef]
  55. Wang, Y.; Shi, Y. Measuring the service quality of urban rail transit based on interval-valued intuitionistic fuzzy model. KSCE J. Civ. Eng. 2020, 24, 647–656. [Google Scholar] [CrossRef]
  56. Zhang, H.; Sun, Q. An integrated MCDM approach to train derailment risk response strategy selection. Symmetry 2020, 12, 47. [Google Scholar] [CrossRef] [Green Version]
  57. Tavassolirizi, M.; Sarvari, H.; Chan, D.W.; Olawumi, T.O. Factors affecting delays in rail transportation projects using Analytic Network Process: The case of Iran. Int. J. Constr. Manag. 2020, in press. [Google Scholar] [CrossRef]
  58. Badi, I.; Pamucar, D. Supplier selection for steelmaking company by using combined Grey-MARCOS methods. Decis. Mak. Appl. Manag. Eng. 2020, 3, 37–48. [Google Scholar] [CrossRef]
  59. Ilieva, G.; Yankova, T.; Hadjieva, V.; Doneva, R.; Totkov, G. Cloud service selection as a fuzzy multi-criteria problem. TEM J. 2020, 9, 484–495. [Google Scholar] [CrossRef]
  60. Chakraborty, S.; Chattopadhyay, R.; Chakraborty, S. An integrated D-MARCOS method for supplier selection in an iron and steel industry. Decis. Mak. Appl. Manag. Eng. 2020, 3, 49–69. [Google Scholar] [CrossRef]
  61. Puška, A.; Stojanović, I.; Maksimović, A.; Osmanović, N. Evaluation software of project management used measurement of alternatives and ranking according to compromise solution (MARCOS) method. Oper. Res. Eng. Sci. Theory Appl. 2020, 3, 89–102. [Google Scholar] [CrossRef]
  62. Stanković, M.; Stević, Ž.; Das, D.K.; Subotić, M.; Pamučar, D. A New Fuzzy MARCOS Method for Road Traffic Risk Analysis. Mathematics 2020, 8, 457. [Google Scholar] [CrossRef] [Green Version]
  63. Stević, Ž.; Brković, N. A novel integrated FUCOM-MARCOS model for evaluation of human resources in a transport company. Logistics 2020, 4, 4. [Google Scholar] [CrossRef] [Green Version]
  64. Wang, C.; Zhou, X.; Tu, H.; Tao, S. Some geometric aggregation operators based on picture fuzzy sets and their application in multiple attribute decision making. Ital. J. Pure Appl. Math. 2017, 37, 477–492. [Google Scholar]
  65. Jovčić, S.; Simić, V.; Průša, P.; Dobrodolac, M. Picture fuzzy ARAS method for freight distribution concept selection. Symmetry 2020, 12, 1062. [Google Scholar] [CrossRef]
  66. Wei, G. Picture fuzzy Hamacher aggregation operators and their application to multiple attribute decision making. Fundam. Inform. 2018, 157, 271–320. [Google Scholar] [CrossRef]
  67. Thao, N.X. Similarity measures of picture fuzzy sets based on entropy and their application in MCDM. Pattern Anal. Appl. 2020, 23, 1203–1213. [Google Scholar] [CrossRef]
  68. Joshi, R. A new picture fuzzy information measure based on Tsallis–Havrda–Charvat concept with applications in presaging poll outcome. Comput. Appl. Math. 2020, 39, 71. [Google Scholar] [CrossRef]
  69. Havdra, J.H.; Charvat, F. Quantification method classification process: Concept of structral α-entropy. Kybernetika 1967, 3, 30–35. [Google Scholar]
  70. Tsallis, C. Possible generalization of Boltzman-Gibbs statistics. J. Stat. Phys. 1988, 52, 479–487. [Google Scholar] [CrossRef]
  71. Shannon, C.E. A mathematical theory of communication. Bell Syst. Tech. J. 1948, 27, 379–423. [Google Scholar] [CrossRef] [Green Version]
  72. Son, L.H. Measuring analogousness in picture fuzzy sets: From picture distance measures to picture association measures. Fuzzy Optim. Decis. Mak. 2017, 16, 359–378. [Google Scholar] [CrossRef]
  73. Xu, X.-G.; Shi, H.; Xu, D.-H.; Liu, H.-C. Picture fuzzy Petri nets for knowledge representation and acquisition in considering conflicting opinions. Appl. Sci. 2019, 9, 983. [Google Scholar] [CrossRef] [Green Version]
  74. Soušek, R. Doprava a Krizový Management, 2nd ed.; Institut Jana Pernera: Pardubice, Czech Republic, 2010; ISBN 978-80-86530-64-2. [Google Scholar]
  75. Soušek, R. Nový Systém Obnovy Železniční Infrastruktury za Krizových Stavů, 1st ed.; Institut Jana Pernera: Pardubice, Czech Republic, 2011; ISBN 978-80-86530-75-8. [Google Scholar]
  76. Ashraf, S.; Mahmood, T.; Abdullah, S.; Khan, Q. Different approaches to multi-criteria group decision making problems for picture fuzzy environment. Bull. Braz. Math. Soc. 2019, 50, 373–397. [Google Scholar] [CrossRef]
  77. Zhang, S.; Wei, G.; Gao, H.; Wei, C.; Wei, Y. EDAS method for multiple criteria group decision making with picture fuzzy information and its application to green suppliersselections. Technol. Econ. Dev. Econ. 2019, 25, 1123–1138. [Google Scholar] [CrossRef] [Green Version]
  78. Liu, H.; Wang, H.; Yuan, Y.; Zhang, C. Models for multiple attribute decision making with picture fuzzy information. J. Intell. Fuzzy Syst. 2019, 37, 1973–1980. [Google Scholar] [CrossRef]
  79. Ju, Y.; Ju, D.; Gonzalez, E.D.R.S.; Giannakis, M.; Wang, A. Study of site selection of electric vehicle charging station based on extended GRP method under picture fuzzy environment. Comput. Ind. Eng. 2019, 135, 1271–1285. [Google Scholar] [CrossRef]
  80. Wei, G. Picture fuzzy cross-entropy for multiple attribute decision making problems. J. Bus. Econ. Manag. 2016, 17, 491–502. [Google Scholar] [CrossRef] [Green Version]
Figure 1. The flowchart of the picture fuzzy group MCDM approach for risk assessment of railway infrastructure.
Mathematics 08 02259 g001
Figure 2. Locations of six assessed railway infrastructures in the Czech Republic.
Mathematics 08 02259 g002
Figure 3. The railway infrastructures: (a) Pardubice; (b) Hradec Kralove; (c) Kolin; (d) Usti nad Labem; (e) Chomutov; (f) Jaromer.
Mathematics 08 02259 g003aMathematics 08 02259 g003b
Figure 4. The sensitivity analysis to changes in the trade-off parameter γ.
Mathematics 08 02259 g004
Figure 5. The sensitivity analysis to changes in the operational parameter ζ.
Mathematics 08 02259 g005
Table 1. Summary of the available MCDM approaches for railway transport.
Author(s)Research FocusGDM (Yes/No)Parameter TypeSA (Yes/No)CA (Yes/No)Method(s)Application Type
Mohajeri and Amin [17]Station location selectionYesDeterministicNoNoAHP, DEAReal-life
Sivilevičius and Maskeliūnaite [18]Traffic quality indicator evaluationYesDeterministicNoNoAHPReal-life
Brunner et al. [19]Transit alignment location selectionYesDeterministicNoNoAHP, GISReal-life
Liu et al. [20]System indicator evaluationNoDeterministicNoNoANP, RA, ANOVAReal-life
Poorzahedy and Rezaei [21]Network configuration evaluationYesDeterministicNoYesELECTRE, SAW, TOPSISReal-life
Celik et al. [22]Transit line quality evaluationYesIT2FYesNoSERVQUAL, DR, VIKORReal-life
Lu et al. [23]Reconstruction risk factor evaluationYesFuzzyNoNoDRReal-life
Nathanail [24]Infrastructure quality indicator evaluationYesDeterministicNoNoDelphi, AHPReal-life
Aydin et al. [25]Transit line quality evaluationYesFuzzyNoNoAHP, Choquet integralReal-life
Dhir et al. [26]Rolling stock manufacturer evaluationNoDeterministicNoYesAHP, CBAReal-life
An et al. [27]Shunting depot risk factor evaluationNoFuzzyNoNoAHPReal-life
Zhao et al. [28]Metro system emergency evaluationYesFuzzyNoNoAHPIE
Hamurcu and Eren [29]Monorail technology evaluationNoDeterministicNoNoAHP, TOPSISIE
Montesinos-Valera et al. [30]Line maintenance project selectionNoDeterministicYesNoANP, BOCR, DRReal-life
Polat et al. [31]Supplier selectionYesFuzzyNoNoAHP, TOPSISIE
Song et al. [32]System vulnerability factor evaluationYesDeterministicNoNoAHP, ISMReal-life
Stević et al. [33]Wagon evaluationYesRoughYesYesBWM, SAWReal-life
Hamurcu and Eren [34]Construction project selectionNoFuzzyNoNoANPReal-life
Mlinarić et al. [35]ITS performance indicator evaluationYesDeterministicNoNoDelphi, AHP, SWOTReal-life
Sharma et al. [36]Station service evaluationYesRoughYesYesAHP, MABACReal-life
Wang et al. [37]Track maintenance option selectionNoFuzzyNoNoFRA, AHP IE
Yadegari et al. [38]Industry cluster indicator evaluationYesDeterministicNoNoDelphi, AHPReal-life
Đorđević et al. [39]Traffic quality indicator evaluationYesRoughNoNoFUCOMReal-life
Jasti and Ram [40]System performance indicator evaluationYesDeterministicNoNoAHPReal-life
Krmac and Djordjević [41]Train CIS enabler and barrier evaluationNoDeterministicYesNoSWOT, AHPIE
Norouzi and Namin [42]Construction risk factor evaluationNoFuzzyNoNoBWM, TOPSISReal-life
Phanyakit and Satiennam [43]Line maintenance project selectionYesDet., fuzzyNoNoAHP, SAWReal-life
Wu et al. [44]Station construction risk factor evaluationYesFuzzyNoNoANPReal-life
Blagojević et al. [45]Line section safety evaluationYesDet., fuzzyYesYesPIPRECIA, SE, SAWReal-life
Brumercikova and Sperka [46]Freight carrier access evaluationNoDeterministicNoNoAHPReal-life
Huang et al. [47]Transport risk factor evaluationNoDeterministicYesNoSE, SDMReal-life
Kumar and Anbanandam [48]Railroad transport inhibitor evaluationYesGreyNoNoDEMATELReal-life
Li et al. [49]Transit line quality evaluationYesPyFNoYesDR, SE, MULTIMOORAReal-life
Majumdar et al. [50]Metro infrastructure indicator evaluationYesDeterministicNoYesTOPSIS, ISAReal-life
Sangiorgio et al. [51]Network safety performance assessmentNoDeterministicNoNoAHP, LPReal-life
Stoilova [52]Traffic plan evaluationNoDeterministicYesNoAHP, SIMUSReal-life
Stoilova et al. [53]Network performance assessmentNoDeterministicYesYesSIMUSReal-life
Vesković et al. [54]Traffic rationalization option selectionYesFuzzyYesYesPIPRECIA, EDASReal-life
Wang and Shi [55]Transit line quality evaluationYesIVIFYesNoME, IVIFWAOReal-life
Zhang and Sun [56]Train derailment response plan evaluationYesDeterministicNoNoDEMATEL, ANP, TOPSISReal-life
Tavassolirizi et al. [57]Project delay indicator evaluationYesDeterministicNoNoDelphi, ANP, DEMATELReal-life
Our studyRailway infrastructure risk assessmentYesPicture fuzzyYesYesDR, THCE, MARCOSReal-life
Analysis Of Variance: ANOVA; Analytic Network Process: ANP; Analytical Hierarchy Process: AHP; Benefits, Opportunities, Costs, and Risks: BOCR; Best-Worst Method: BWM; Comparative Analysis: CA; Control Information System: CIS; Cost-Benefit Analysis: CBA; Data Envelopment Analysis: DEA; Decision Making Trial and Evaluation Laboratory: DEMATEL; Direct Rating: DR; Elimination Et Choix Traduisant La Realite: ELECTRE; Evaluation based on Distance from Average Solution: EDAS; Full Consistency Method: FUCOM; Fuzzy Reasoning Approach: FRA; Geographic Information Systems: GIS; Group Decision-Making: GDM; Illustrative Example: IE; Importance Satisfaction Analysis: ISA; Intelligent Transportation System: ITS; Interpretative Structural Modeling: ISM; Interval type-2 fuzzy: IT2F; Interval-Valued Intuitionistic Fuzzy Weighted Average Operator: IVIFWAO; Interval-Valued Intuitionistic Fuzzy: IVIF; Linear Programming: LP; Maximum Entropy: ME; Measurement of Alternatives and Ranking according to Compromise Solution: MARCOS; Multi-Attributive Border Approximation area Comparison: MABAC; Multi-Objective Analysis by Ratio Analysis plus the Full Multiplicative Form: MULTIMOORA; Pivot Pairwise Relative Criteria Importance Assessment: PIPRECIA; Pythagorean fuzzy: PyF; Regression analysis: RA; Scatter Degree Method: SDM; Sensitivity Analysis: SA; Sequential Interactive Model of Urban Systems: SIMUS; Service Quality: SERVQUAL; Shannon Entropy: SE; Simple Additive Weighting: SAW; Strengths, Weaknesses, Opportunities, and Threats: SWOT; Technique for the Order Preference by Similarity to Ideal Solution: TOPSIS; Tsallis–Havrda–Charvát Entropy: THCE; VIšeKriterijumska Optimizacija i kompromisno Rešenje: VIKOR.
Table 2. Summary of the available applications and extensions of the MARCOS method.
Author(s)Research FocusGDM (Yes/No)Parameter TypeSA (Yes/No)CA (Yes/No)Criteria Weighting Method(s)Application Type
SubjectiveObjectiveHybrid (Yes/No)
Badi and Pamucar [58]Supplier selectionYesGrey, Det.NoYesDirect ratingNoReal-life
Chakraborty et al. [60]Supplier selectionYesD numberNoNoDirect ratingNoReal-life
Ilieva et al. [59]Cloud service provider selectionNoFuzzyNoNoNot specifiedIllustrative example
Puška et al. [61]Software evaluationYesDeterministicYesNoDirect ratingNoReal-life
Stanković et al. [62]Road traffic risk evaluationNoFuzzyYesYesPIPRECIANoReal-life
Stević and Brković [63]Personnel selectionNoDeterministicNoYesFUCOMNoIllustrative example
Stević et al. [14]Sustainable supplier selectionYesDeterministicYesYesDirect ratingNoReal-life
Ulutaş et al. [16]Equipment evaluationYesDeterministicNoYesITARACCSDYesIllustrative example
Our studyRailway infrastructure risk assessmentYesPicture fuzzyYesYesDirect ratingTHC entropyYesReal-life
Comparative analysis: CA; Correlation Coefficient and Standard Deviation: CCSD; Full Consistency Method: FUCOM; Group decision-making: GDM; Indifference Threshold-based Attribute Ratio Analysis: ITARA; Pivot Pairwise Relative Criteria Importance Assessment: PIPRECIA; Sensitivity analysis: SA; Tsallis–Havrda–Charvát: THC.
Table 3. Risk factors influencing railway infrastructure in the Czech Republic.
Risk FactorCodeDescription
Prolonged droughtC1Prolonged drought is an accidental natural phenomenon caused by a deficit of precipitation. It causes significant economic damage and endangers public health, harms forests and crops, and increases the risk of fires.
Extreme temperaturesC2Extremely high temperatures are a phenomenon that can occur in the Czech Republic in the period from June to August, rarely in late May and early September. The daily maximum air temperature exceeds 30 °C for several days.
FloodC3Temporary significant increase in the level of watercourses or other surface waters, during which water floods the area outside the riverbed and can cause damage. The Czech Republic has a dense hydrographic network with a length of 85.000 km.
Heavy rainfallC4The occurrence of intense rainfall in urban areas results in exceeding the capacity of the sewer network, flooding the lower floors of buildings, and technical infrastructure with surface runoff rainwater.
Extreme windC5Wind speed in gusts greater than 30 m/s or in high gusts greater than 25 m/s. Its effects complicate the functionality of critical infrastructure entities. The average annual wind speed in the Czech Republic is between 2 and 4 m/s.
EpidemicsC6Mass human infection as a result of which, in a local and temporal context, the morbidity of an infectious disease increases above the usual limit. In the Czech Republic, epidemics occur sporadically.
EpiphytiaC7Mass plant disease is a spread of pests at a level that cannot be managed by conventional methods and means of protection. There is a risk of significant societal losses.
EpizooticsC8Mass animal disease occurs when emergency measures cannot be implemented by veterinary authorities. There is a risk of human infection with zoonoses.
Disrupted food suppliesC9Large-scale disruption of food supplies. It can be a secondary consequence of other emergencies.
Disrupted communication systemsC10Disrupted functionality of important electronic communication networks, which consist of broadcasting systems, routing equipment, and other means enabling the transmission of signals. It affects the monitoring systems and information support.
Critical information infrastructure violationC11Planned attack or unintentional failure of technology and people, which leads to failure of services provided by information and communication systems, causes security violations of critical information infrastructure.
Special floodC12A special flood is caused by a failure or accident through the rupture of a dam of a waterworks swelling or accumulating water or by an emergency solution of a critical situation.
Hazardous chemical leakageC13Hazardous chemicals and mixtures are a source of risk for the occurrence of serious accidents. Accidents are manifested by the release of a chemical or mixture under uncontrolled conditions in a stationary installation. Physiochemical effects are fire and explosion. Biological effects are toxicity and ecotoxicity.
Disrupted water supplyC14Large-scale disruption of drinking water supplies for drinking, cooking, food, and beverage preparation.
Disrupted gas supplyC15Large-scale disruption of gas supplies. Equipment for gas extraction, transportation, or storage poses a local risk of explosion. The failure of cross-border points does not have an impact on the gas supply of the Czech Republic.
Disrupted oil suppliesC16A significant and sudden decrease in crude oil and petroleum supplies. This security threat impacts the economy and living conditions.
Radiation accidentsC17The radiation emergency is unmanageable with the forces and means of staff. It is manifested by the leakage of radioactive substances and requires the introduction of urgent protective measures for the population.
Disrupted electricity supplyC18Large-scale disruption of electricity supply. The significant and sudden shortage of electricity, which endangers the integrity, safety, and reliability of an electricity system. Transmission and distribution system operators implement measures and activities to prevent a state of emergency.
Migration waveC19Foreigners from third countries coming to the state borders with the aim of legally or illegally enter this territory, transit through to other states, or reside in it. A large-scale migration wave is the arrival of about 750 foreigners/day or 5000 foreigners/month.
Legality violationC20Large-scale legality violation is dangerous and intentional behavior in which there is a violation of legislation and security of the Czech Republic to endanger the lives and health of citizens, infrastructure, environment, and democratic system.
Economic destabilizationC21Large-scale economic destabilization, macroeconomic imbalances, reduction of economic performances, external vulnerability, and economic crisis threats to the financing of social and health expenditure.
Military assaultC22Violent action or direct attack on the territory of the Czech Republic by the military and other forces of a foreign power.
Human factor failureC23Possible risk caused by human mistakes.
Table 4. The information about the invited railway planners.
ExpertOccupationQualificationsExperience (years)Gender
D1AcademiaPh.D.25Male
D2IndustryEng.5Male
D3IndustryEng.2Male
D4IndustryEng.50Male
D5IndustryPh.D.13Male
D6AcademiaPh.D.20Female
D7IndustryM.Sc.42Female
D8IndustryB.Sc.28Female
D9IndustryEng.30Female
D10IndustryEng.20Male
Table 5. Linguistic evaluations of the railway infrastructures.
RIExpertRisk Factor
C1C2C3C4C5C6C7C8C9C10C11C12C13C14C15C16C17C18C19C20C21C22C23
A1D1NANANYNNAYYNYNNANAAYNNY
D2NAAAAYNNNYYNYNAYAYNANYY
D3NAANAANNNYYNANNYNYNYNYY
D4NYAAAANNNAANYNNNNANNNNA
D5NYYAYANNNYYNYNNYYYAYAYY
D6NYAAYANNAAYNAANYRYNANNA
D7RNANNNRRRNNAYNNYNANARAY
D8NAAAAAAANAANNNNYYNNANYN
D9NYAAAYNANYYNANAYAANANYY
D10AYAAAYNNNYYNAANYAYNANYY
A2D1NANANANNANANNANNNAAAANY
D2NNAAAYNNNYYAANNYAYNNNAY
D3NAANAANNNAYNNNNANYNANYY
D4NYYYYANNNAANNNNNNANNNNN
D5NYYAYANNNYYYYNNYYYAYAYY
D6NYAAYANNAAANNANYRYNANNA
D7RNNNNYRRNNNNNNNNNYNANAY
D8ANANNYANNYYAANAYYNNNNAY
D9NAANNNNAANYAANNYAYAANAY
D10NNAAYANNANANNNNYAYNNNAN
A3D1NAYANANNANANYNNNNAAYNNA
D2NNANAYNNNYYNYNNYAYNANYY
D3NAANAANNNAYNANNANANANYY
D4NYAAYANNNAYNYNNNAYNNNNA
D5NYAAYANNNYYAYNNYYYYYAYY
D6NYAAYANNAAYNAANYRYNANNA
D7RNANNYRANNNAYNNYNYNANAN
D8NNNNNNANNAYNNNNYAANANYY
D9AYANAYNNNYYNYNAYNANYNYY
D10NYANAYNNANYNANAAANNANYY
A4D1NAYYNANNYAAYYNNNNAAANNY
D2NAYAYYNNNYYAYNNYAYNANYY
D3NNANANNNNAYAANNANYNANYY
D4NYYYYANNNAANYNNNNANNNNA
D5NYAYYANNNYYAYNNYYYAYAYY
D6NYAAAANNAAYNAANYRYNANNA
D7RRNAAYRRNNNAANNYNYNANAY
D8NYAAYYNNAAYNNNNYNNNANYN
D9AAYYYYANNYYAANAYAYNANYY
D10NAYAYAYANYYAYANYRYNANYA
A5D1NAAYAANNNNNNANNNNNAANNY
D2NNNNAYNNNYYNANNYAYNNNAY
D3NNANANNNNAYYANNNNYNANYY
D4NYAAYANNNAANNNNNNNNNNNN
D5NANNYANNNYYNYNNAAYAYAYY
D6NYNAAANNAAYNAANYRYNANNA
D7RRNNNYRRNNNNNNNYNYNNNAY
D8AAANAYAANYYAANNYAYNYAYY
D9NYNNAYYRYYYNANNYRAYYYAY
D10NNNNAYNNNAYYANAYRYNNNAY
A6D1NNNAAANNANNNNNNNNNANNNY
D2NNNAAYNNNYYNANNNAYNNNNY
D3NNANANNNNAYANNNANANANYY
D4NYAAYANNNNAANNNNNNNNNNN
D5NYAAYANNNYYNYNNAYYAYAYY
D6NYNAYANNAAYNNANYRYNNNNA
D7RANNNYRRNNNANNAANYNNNAA
D8NNNAYAAANNYNANANNYNNNNY
D9AYNAAAYANYYNANANNYNANYY
D10RNNAAANNNYAAANNNNYNNNNY
Abstain: A; No: N; Railway infrastructure: RI; Refusal: R; Yes: Y.
Table 6. The picture fuzzy evaluation matrix.
Risk FactorRailway Infrastructure
A1A2A3A4A5A6
C1<0, 0.1, 0.8><0, 0.1, 0.8><0, 0.1, 0.8><0, 0.1, 0.8><0, 0.1, 0.8><0, 0.1, 0.7>
C2<0.5, 0.4, 0.1><0.3, 0.3, 0.4><0.5, 0.2, 0.3><0.4, 0.4, 0.1><0.3, 0.3, 0.3><0.4, 0.1, 0.5>
C3<0.1, 0.8, 0.1><0.2, 0.6, 0.2><0.1, 0.8, 0.1><0.5, 0.4, 0.1><0, 0.4, 0.6><0, 0.3, 0.7>
C4<0, 0.8, 0.2><0.1, 0.5, 0.4><0, 0.4, 0.6><0.4, 0.5, 0.1><0.1, 0.2, 0.7><0, 0.8, 0.2>
C5<0.2, 0.6, 0.2><0.4, 0.2, 0.4><0.3, 0.4, 0.3><0.6, 0.3, 0.1><0.2, 0.7, 0.1><0.4, 0.5, 0.1>
C6<0.4, 0.5, 0.1><0.3, 0.6, 0.1><0.4, 0.5, 0.1><0.4, 0.5, 0.1><0.5, 0.4, 0.1><0.2, 0.7, 0.1>
C7<0, 0.1, 0.8><0, 0.1, 0.8><0, 0.1, 0.8><0.1, 0.1, 0.7><0.1, 0.1, 0.7><0.1, 0.1, 0.7>
C8<0, 0.2, 0.7><0, 0.1, 0.8><0, 0.1, 0.9><0, 0.1, 0.8><0, 0.1, 0.7><0, 0.2, 0.7>
C9<0, 0.2, 0.7><0, 0.4, 0.6><0, 0.3, 0.7><0.1, 0.2, 0.7><0.1, 0.1, 0.8><0, 0.2, 0.8>
C10<0.6, 0.3, 0.1><0.3, 0.3, 0.4><0.3, 0.4, 0.3><0.4, 0.5, 0.1><0.4, 0.4, 0.2><0.4, 0.2, 0.4>
C11<0.7, 0.2, 0.1><0.5, 0.4, 0.1><0.8, 0.1, 0.1><0.7, 0.2, 0.1><0.7, 0.1, 0.2><0.6, 0.2, 0.2>
C12<0, 0.1, 0.9><0.1, 0.3, 0.6><0, 0.2, 0.8><0.1, 0.6, 0.3><0.2, 0.1, 0.7><0, 0.4, 0.6>
C13<0.5, 0.4, 0.1><0.1, 0.3, 0.6><0.6, 0.3, 0.1><0.5, 0.4, 0.1><0.1, 0.7, 0.2><0.1, 0.4, 0.5>
C14<0, 0.2, 0.8><0, 0.2, 0.8><0, 0.1, 0.9><0, 0.2, 0.8><0, 0.1, 0.9><0, 0.1, 0.9>
C15<0, 0.2, 0.8><0, 0.1, 0.9><0, 0.2, 0.8><0, 0.1, 0.9><0, 0.1, 0.9><0, 0.3, 0.7>
C16<0.8, 0.1, 0.1><0.6, 0.1, 0.3><0.6, 0.2, 0.2><0.7, 0.1, 0.2><0.6, 0.1, 0.3><0.1, 0.3, 0.6>
C17<0.2, 0.3, 0.4><0.2, 0.3, 0.4><0.1, 0.4, 0.4><0.1, 0.2, 0.5><0, 0.3, 0.4><0.1, 0.1, 0.7>
C18<0.5, 0.4, 0.1><0.7, 0.2, 0.1><0.5, 0.4, 0.1><0.7, 0.2, 0.1><0.7, 0.1, 0.2><0.7, 0.1, 0.2>
C19<0, 0.2, 0.8><0, 0.3, 0.7><0.1, 0.1, 0.8><0, 0.2, 0.8><0.1, 0.2, 0.7><0, 0.2, 0.8>
C20<0.3, 0.6, 0.1><0.1, 0.5, 0.4><0.3, 0.6, 0.1><0.1, 0.8, 0.1><0.3, 0.3, 0.4><0.1, 0.2, 0.7>
C21<0, 0.1, 0.8><0, 0.2, 0.8><0, 0.1, 0.9><0, 0.1, 0.9><0.1, 0.2, 0.7><0, 0.1, 0.9>
C22<0.6, 0.1, 0.3><0.2, 0.5, 0.3><0.6, 0.1, 0.3><0.6, 0.1, 0.3><0.3, 0.4, 0.3><0.3, 0.1, 0.6>
C23<0.7, 0.2, 0.1><0.7, 0.1, 0.2><0.6, 0.3, 0.1><0.6, 0.3, 0.1><0.8, 0.1, 0.1><0.7, 0.2, 0.1>
Table 7. Linguistic importance evaluations of the risk factors.
ExpertRisk Factor
C1C2C3C4C5C6C7C8C9C10C11C12C13C14C15C16C17C18C19C20C21C22C23
D1NYYYYYNNYYYYAAAYYYAYAYA
D2RYYAYYNNAYYYYAAYYYAYAYY
D3NAYNAANNNAYANNAYAYAYNYY
D4NYYAYYNNAYYAANNYYYAAAYY
D5NYYYYYNNNYYYYNNYYYYYYYY
D6NYYYYYNNAYYYYANYYYAYAYY
D7RYYYAYRRRANAANNYAYNYAYY
D8NAYAYYNNNYYYANNYYYYYYYY
D9RYYAYYNNAANAYANYYYAYNYY
D10YYYYYYANYYYYYYAYAYNYAYY
Abstain: A; No: N; Refusal: R; Yes: Y.
Table 8. The picture fuzzy risk factor importance matrix.
Risk FactorDegree of Positive MembershipDegree of Neutral MembershipDegree of Negative MembershipDegree of Refusal Membership
C10.100.60.3
C20.80.200
C31000
C40.50.40.10
C50.80.200
C60.90.100
C700.10.80.1
C8000.90.1
C90.20.40.30.1
C100.70.300
C110.800.20
C120.60.400
C130.50.40.10
C140.10.40.50
C1500.40.60
C161000
C170.70.300
C181000
C190.20.60.20
C200.90.100
C210.20.60.20
C221000
C230.90.100
Table 9. Subjective, objective, and hybrid risk factor importance.
Risk FactorSubjective ImportanceObjective ImportanceHybrid Importance
ValueRankValueRankValueRank
C10.0113110.057350.034320
C20.057930.0161220.037019
C30.064410.0463110.05541
C40.045160.0466100.045912
C50.057930.0270200.042515
C60.061220.0308180.046011
C70.0039120.048090.026023
C80.0003130.056060.028222
C90.028680.052670.040616
C100.054740.0202210.037518
C110.051550.0409130.04629
C120.051550.051580.05154
C130.045160.0317170.038417
C140.019390.076710.04808
C150.0129100.074620.043814
C160.064410.0382140.05135
C170.054740.0120230.033421
C180.064410.0379150.05126
C190.032270.060040.046110
C200.061220.0349160.04817
C210.032270.071530.05192
C220.064410.0272190.045813
C230.061220.0424120.05182
Table 10. The picture fuzzy extended evaluation matrix.
Risk FactorRailway Infrastructure
A0 (Anti-Ideal)A1A2A3A6A7 (Ideal)
C1<0, 0.1, 0.7><0, 0.1, 0.8><0, 0.1, 0.8><0, 0.1, 0.8><0, 0.1, 0.7><0, 0.1, 0.8>
C2<0.5, 0.1, 0.1><0.5, 0.4, 0.1><0.3, 0.3, 0.4><0.5, 0.2, 0.3><0.4, 0.1, 0.5><0.3, 0.1, 0.5>
C3<0.5, 0.3, 0.1><0.1, 0.8, 0.1><0.2, 0.6, 0.2><0.1, 0.8, 0.1><0, 0.3, 0.7><0, 0.3, 0.7>
C4<0.4, 0.2, 0.1><0, 0.8, 0.2><0.1, 0.5, 0.4><0, 0.4, 0.6><0, 0.8, 0.2><0, 0.2, 0.7>
C5<0.6, 0.2, 0.1><0.2, 0.6, 0.2><0.4, 0.2, 0.4><0.3, 0.4, 0.3><0.4, 0.5, 0.1><0.2, 0.2, 0.4>
C6<0.5, 0.4, 0.1><0.4, 0.5, 0.1><0.3, 0.6, 0.1><0.4, 0.5, 0.1><0.2, 0.7, 0.1><0.2, 0.4, 0.1>
C7<0.1, 0.1, 0.7><0, 0.1, 0.8><0, 0.1, 0.8><0, 0.1, 0.8><0.1, 0.1, 0.7><0, 0.1, 0.8>
C8<0, 0.1, 0.7><0, 0.2, 0.7><0, 0.1, 0.8><0, 0.1, 0.9><0, 0.2, 0.7><0, 0.1, 0.9>
C9<0.1, 0.1, 0.6><0, 0.2, 0.7><0, 0.4, 0.6><0, 0.3, 0.7><0, 0.2, 0.8><0, 0.1, 0.8>
C10<0.6, 0.2, 0.1><0.6, 0.3, 0.1><0.3, 0.3, 0.4><0.3, 0.4, 0.3><0.4, 0.2, 0.4><0.3, 0.2, 0.4>
C11<0.8, 0.1, 0.1><0.7, 0.2, 0.1><0.5, 0.4, 0.1><0.8, 0.1, 0.1><0.6, 0.2, 0.2><0.5, 0.1, 0.2>
C12<0.2, 0.1, 0.3><0, 0.1, 0.9><0.1, 0.3, 0.6><0, 0.2, 0.8><0, 0.4, 0.6><0, 0.1, 0.9>
C13<0.6, 0.3, 0.1><0.5, 0.4, 0.1><0.1, 0.3, 0.6><0.6, 0.3, 0.1><0.1, 0.4, 0.5><0.1, 0.3, 0.6>
C14<0, 0.1, 0.8><0, 0.2, 0.8><0, 0.2, 0.8><0, 0.1, 0.9><0, 0.1, 0.9><0, 0.1, 0.9>
C15<0, 0.1, 0.7><0, 0.2, 0.8><0, 0.1, 0.9><0, 0.2, 0.8><0, 0.3, 0.7><0, 0.1, 0.9>
C16<0.8, 0.1, 0.1><0.8, 0.1, 0.1><0.6, 0.1, 0.3><0.6, 0.2, 0.2><0.1, 0.3, 0.6><0.1, 0.1, 0.6>
C17<0.2, 0.1, 0.4><0.2, 0.3, 0.4><0.2, 0.3, 0.4><0.1, 0.4, 0.4><0.1, 0.1, 0.7><0, 0.1, 0.7>
C18<0.7, 0.1, 0.1><0.5, 0.4, 0.1><0.7, 0.2, 0.1><0.5, 0.4, 0.1><0.7, 0.1, 0.2><0.5, 0.1, 0.2>
C19<0.1, 0.1, 0.7><0, 0.2, 0.8><0, 0.3, 0.7><0.1, 0.1, 0.8><0, 0.2, 0.8><0, 0.1, 0.8>
C20<0.3, 0.2, 0.1><0.3, 0.6, 0.1><0.1, 0.5, 0.4><0.3, 0.6, 0.1><0.1, 0.2, 0.7><0.1, 0.2, 0.7>
C21<0.1, 0.1, 0.7><0, 0.1, 0.8><0, 0.2, 0.8><0, 0.1, 0.9><0, 0.1, 0.9><0, 0.1, 0.9>
C22<0.6, 0.1, 0.3><0.6, 0.1, 0.3><0.2, 0.5, 0.3><0.6, 0.1, 0.3><0.3, 0.1, 0.6><0.2, 0.1, 0.6>
C23<0.8, 0.1, 0.1><0.7, 0.2, 0.1><0.7, 0.1, 0.2><0.6, 0.3, 0.1><0.7, 0.2, 0.1><0.6, 0.1, 0.2>
Table 11. The railway infrastructure additive relative importance, utility degrees, utility functions, and ranks.
Railway InfrastructurePicture Fuzzy Additive Relative ImportanceUtility Degree to AISUtility Degree to ISUtility FunctionRank
A0 (anti-ideal)<0.417, 0.135, 0.239>1.02.421˗˗
A1<0.291, 0.265, 0.287>0.8272.0010.7375
A2<0.23, 0.263, 0.41>0.6601.5990.5892
A3<0.273, 0.243, 0.35>0.7511.8180.6704
A4<0.334, 0.25, 0.268>0.8852.1430.7896
A5<0.275, 0.199, 0.412>0.6971.6880.6223
A6<0.193, 0.222, 0.474>0.5661.3700.5051
A7 (ideal)<0.141, 0.135, 0.574>0.4131.0˗˗
Anti-ideal solution: AIS; Ideal solution: IS.
Table 12. The comparative analysis of the state-of-the-art picture fuzzy approaches.
ApproachOrdering
Picture fuzzy group MCDM approach for risk assessment of railway infrastructure
(our approach)
A6A2A5A3A1A4
Picture fuzzy TOPSIS [76]A6A5A2A3A1A4
Picture fuzzy EDAS [77]A6A2A3A1A5A4
Picture fuzzy grey relational analysis [78]A6A5A2A3A1A4
Picture fuzzy grey relational projection [79]A6A2A5A3A1A4
Picture fuzzy cross-entropy [80]A6A5A2A3A1A4
Table 13. The ranking similarity of the compared picture fuzzy approaches.
ApproachOur ApproachPF TOPSISPF EDASPF GRAPF GRPPF CEOverall
Our approach0.9430.8290.94310.9430.932
PF TOPSIS0.9430.65710.94310.909
PF EDAS0.8290.6570.6570.8290.6570.726
PF GRA0.94310.6570.94310.909
PF GRP10.9430.8290.9430.9430.932
PF CE0.94310.65710.9430.909
Cross-entropy: CE; Grey relational analysis: GRA; Grey relational projection: GRP; Picture fuzzy: PF.
Publisher’s Note: MDPI stays neutral with regard to jurisdictional claims in published maps and institutional affiliations.

