1. Introduction
Digitalization of all human life spheres is one of the priority areas of human exploration for at least the next ten years. Today, a variety of information web resources create opportunities for a user to virtualize the processes of both ordering and performing various services. Virtual systems for providing administrative services, in particular those related to business, and the production of goods and services, are in great demand. This primarily applies to environmental expertise permitting services for the deployment of industrial production. Such systems operate in municipalities and significantly simplify the process of the provision of administrative services. The developers of one such system (
www.cnap.rada.te.ua) are the authors of this paper. The efficiency of information web resources is important. Quite often, systems are inefficient primarily due to poor content structuring or due to disregard for the dynamics of requests and user activity. The processes of interaction with information sources are to generate requests, convert requests in the terms of sources, receive and process data from sources and form the result, which will be sent to a web browser using a web server. This is completed by the data access subsystem of the web resource. To interact with sources, a data scheme is used, which contains a description of all sources connected to the resource, a description of the types of data implemented by the sources, and the rules for request generation to the sources in the terms of these sources. However, virtual systems for providing administrative services fundamentally differ from conventional information web resources, as the content of such resources is well structured by the types of services and documents that need to be downloaded by a user. More important here is the analytics obtained from the web resource, which are necessary for the organization of business processes by employees of the administrative services center. Such analytics can be the general activity of the users or their activity in terms of types of services.
To assess the web resources efficiency information, the mathematical models of their functioning processes are required. These models allow the solving of both problems of software algorithm optimization and technical resource usage, and problems of optimization of the organization of business processes by staff. The building of such models requires a comprehensive study of the functioning of web resources, taking into account the impact of all the elements of the system regarding its functioning [
1,
2,
3].
For the model of information sources efficiency, the amount of time spent by the source to execute queries on the current observation interval [
4,
5,
6,
7] is often chosen as a source indicator. For the model of user activity, the initial indicator is usually the number of requests to information sources in the current observation interval. With this, the external influences are unobserved. In the above-mentioned context, the model of user activity is predominant for this type of web resource.
An important requirement for a mathematical model is its adequacy. Therefore, it is advisable to build it based on the inductive approach. This means that the created web resource operates in test or experimental mode, and the obtained data are the basis for building a model of its efficiency [
8,
9]. The fact that in the process of the functioning of the web resource, its indicators are influenced by a number of uncontrolled factors that distort the results of observations should be taken into account. For time response characteristics, requests are influenced by the following factors [
1,
3]: different performance of the hardware and software used by the sources; different amount of source data; the difference in the volume of results related to the complexity of query; different availability of sources related to the nature of the environment; different levels of load on hardware and software from other applications that exist on the same platform; different load of network segments for use in interaction with the source, etc. Some of those factors also affect user activity. At the same time, seasonality and periodicity, for example weekly, are observed for user activity. This fact is taken as a basis for building the model of user activity. The influence of the uncontrolled factors on the interval of seasonal fluctuations is proposed to be taken into account in the form of interval estimates of the observed characteristics. This approach will allow the tracking and prediction of the dynamics of web resource efficiency with guaranteed accuracy within the influence of unaccounted and uncontrolled factors.
2. Analysis of Literature Data and Problem Statement
As mentioned above, the efficiency of the web resource will be described by user activity, which has a purely cyclical nature.
When building a model of the described phenomenon, the following requirements must be taken into account [
7,
9]:
The final model should take into account the dependence of the modeled indicator on time (to be dynamic) because as mentioned above, user activity changes over time and is periodic, which is important in terms of analysis and the optimization of business processes;
Uncontrolled factors that distort the results of observations of temporal characteristics of user activity are proposed to be taken into account in the form of interval estimates of the observed characteristics, which will track and predict the dynamics of web resource efficiency with guaranteed accuracy within unaccounted and uncontrolled factors;
Discrete time should be used for the modeling process, so that the computing resources used by the model are insignificant compared to the resources needed to provide basic web resource functionality. Observed characteristic of the information web resource efficiency should be represented in the interval form.
By changing the parameters of the respective models, it becomes possible to model different types of information sources and modes of user activity. As a result, it is possible to analyze the performance and efficiency of the web system with different modes of user activity, with different combinations of settings.
For each category of services, the model of observations can be presented as follows [
1,
8]:
where
are the lower and upper bounds of the range of possible values of user activity to a particular type of information resource service
l on discrete
, respectively.
To present the discrete model of the users activity for a certain type of service
l of an information resource, such the expression is used [
1,
10]:
where
is a vector of basic functions, nonlinear in the general case, by means of which the values of the modeled characteristics (values of the users activity) and also input variables for certain discrete time are transforming;
are the sets of vectors of input variables (controls);
d is the order of a discrete model, which is known to be equivalent to the order of a differential equation analogous to a discrete model.
Based on the requirements of ensuring the accuracy of the mathematical model within the accuracy of observations, the conditions for matching the experimental data presented in interval form (1) with the data obtained on the basis of the mathematical model in the form of a discrete model (2) are formulated as follows:
Conditions (3) provide the calculated values of user activity in information web resources within the range of possible values of this number of active visitors on the web resource, which we obtain by analyzing the site.
Based on the analysis results, we can state that to ensure the conditions (3) with a given accuracy of the macromodel in the form of linear difference operators (2), in solving the problem of its parameters’ identification, it is justified to use the methods of interval data analysis [
1,
8].
Let us assume that the vector of estimates
of parameter
in the difference operator (2) is obtained on the basis of interval data analysis. Substituting the vector of estimates
of the parameters of the difference operator instead of the vector of their true values
together with the given initial interval values of each element of the set
and given vectors of input variables
an interval estimate of the modeled characteristics
on time discrete
will be obtained:
Thus, the number of active users will be predicted based on the interval discrete model (IDM) [
1].
For the mathematical formulation of the IDM parameters’ identification tasks on the basis of the interval data analysis, the conditions of the model accuracy are as follows:
Conditions (5) ensure we obtain the interval estimates of the number of active users of information web resources within the experimentally observed intervals of the user’s activity on the web resource.
By substituting in expression (5), instead of interval estimates
of the modeled characteristics, their interval values are calculated on the basis of IDM (4) together with the given initial interval values of each element from a set:
and given the vectors of input variables
the interval system of nonlinear algebraic equations (ISNAE) [
10] obtained:
Therefore, ISNAE (7) for each l information resource is obtained by substituting interval estimates of the initial characteristic (given as initial conditions and predicted on the basis of expression (6) into the remaining nodes of the grid) in conditions (5).
Therefore, the task of IDM (4) parameters’ identification under conditions (5) is the task of ISNAE (7) solving.
Given that this problem cannot be solved for a predetermined number of iterations, this type of problem is classified as a NP-complete one. The only way to solve it is to do a full search or random search. Given the complexity of the task of parameters’ identification of the macromodel in the form of IDM, for finding at least one solution of ISNAE, we can use random search methods [
11].
Let us define the purpose and objectives of the research. For the model of information source efficiency, the activity of users with an initial indicator number of queries to information sources on the current interval of observations is chosen. Thus, external influences appear unobserved.
Since it is difficult to propose models based on physical analogies for the researched indicator, the models are expected to be identified. In this case, for the linear parameters of the discrete model (2), it is necessary to solve the task of structural and parameters’ identification [
1,
11]. Nonlinear processes of the users activity dynamics at a certain type of information resource can be represented by the model in the form of difference operator (2). In this case, the structure of the model is set, and only the task of parameters’ identification is solved.
Thus, the purpose of the research is the parameters’ identification of the IDM of user activity on a particular type of information resource. Additionally, based on this model, we aim to optimize the future structures of these resources.
3. Method of Parameters Identification of IDM
In the general case, it is not possible to obtain the complete solution of ISNAE (7) as a set of values of the components of the vector . Therefore, using the iterative procedure, we will search for at least one solution that ensures that the predicted interval includes the number of active users of the web resource for a given discrete time.
The “quality” indicator of the current ISNAE solution shows the degree of proximity of this solution to the solution that makes ISNAE (7) a compatible system. Obviously, the closer the predicted corridor, built on the basis of this approximation parameters vector, to the experimental one, the better the “quality” of the approximation is.
The quality of the approximation will be determined as the difference between the centers of the most distant predictive and experimental intervals in the case that they do not intersect each other and the smallest width of the intersection of the predicted and experimental intervals in the case of their intersection [
1,
10]:
where
and
are operations determining the center and width of the interval, respectively.
Thus, the task of IDM parameters’ identification can be formulated as follows:
where
,
are the smallest and largest values of each IDM parameter.
Thus, for the objective function, which determines the “quality” of the current approximation, we will have two expressions (8) and (9), which calculate the “rough” and accurate estimates of the parameters vector, respectively.
Functions (8) and (9) are complex and discrete. Calculating even one of their values is a time-consuming procedure, with NP complexity.
If the calculated value of “quality” of the current approximation of estimation of the IDM parameters vector on the current iteration is zero ( = 0), then the procedure (10) is terminated.
This problem cannot be solved for a predetermined number of iterations. The only approach to its solving is complete enumeration methods, or heuristic methods, in particular random search methods [
11].
The methods of random search in the context of solving the IDM parameters’ identification task are based on iterative procedures [
11]: setting the initial conditions in the form (6); initial task
or random formation of the current
estimates of the vector of the difference operator parameters; calculation of interval estimations of the modeled characteristics at
points on time discrete
using a recurrent scheme; “quality” check
of the current approximation of the estimation
vector of IDM parameters. When forming the current estimate of the parameters vector of the difference operator, different approaches are used, including random search or genetic operators (crossing), or operators of systems with self-organization. However, the existing methods are not suitable for solving problems with such complex objective functions, which are given by expressions (8) or (9). Under these conditions, it is proposed to use the artificial bee colony algorithm (ABCA) [
12,
13]. It is the best suited for solving optimization tasks with complex nonlinear and discrete objective functions. ABCA consists of four phases: initialization; phase of employed bees; phase of onlooker bees; phase of scout bees. Let us consider this algorithm in more detail [
10,
12,
13,
14].
Initialization phase.
Vectors that determine the coordinates of nectar sources for one l bee are denoted as .
In the context of the parameters’ identification task, these are the vectors of the IDM parameters. The number of the entire population is denoted as S. All population vectors are initialized (l = 1, …, S) by scout bees. Each parameter vector contains n variables , which should be evaluated by criterion (10).
In this phase, to randomly initialize the initial sources of a nectar, we use the following Equation (11) [
14,
15]:
where
is a random real number from the range (0, 1).
It should be noted that in this phase we also configure all parameters of the algorithm, such as:
mcn = 0 is the current number of iterations and
MCN (the maximum number of iterations
) is the total number of iterations,
LIMIT is the number that determines the nectar source exhaustion and its current value
limit = 0 [
16,
17].
The phase of employed bees.
Employed bees search for new nectar sources. In the context of the optimization task (10), this means finding new solutions with smaller values of the objective function (8) or (9). Thus, employed bees look for neighbors of current sources of nectar and evaluate their “quality”. To calculate the neighboring sources of nectar, we use the following Equation (12) [
14,
17]:
where
is the coordinate of the nectar source on the current iteration;
is a randomly chosen vector of nectar source from
;
is a randomly chosen parameter index;
is a random number in the range [–1, 1].
After calculating the coordinates of new sources of nectar,
pairwise selection among the existing one and current one using the objective function (8) or (9) is executed:
Phase of onlooker bees.
According to the ABCA [
12,
13], unemployed bees consist of two groups: onlooker bees and scout bees. Employed bees fly to a hive and share in the hive their information about nectar sources with research bees. The latter make the choice of the nectar sources according to the probability, depending on the obtained information. Therefore, for each current nectar source, we calculate the probability
of its choice by researcher bees [
14,
15]:
In this case, before using expression (14), pre-normalized values of the objective function to a single interval (0, 1) are used.
Based on the calculated probabilities, scout bees choose the neighborhood from
points of certain nectar sources
, whose coordinates are calculated by Equation (12). In this case, the number of circumference points for each source is calculated by the expression [
14,
15]:
For each generated nectar source, we calculate the objective function (8) or (9) and perform the pairwise selection between existing and current nectar sources based on expression (13) again.
Phase of scout bees.
This is the phase of bees that randomly choose new sources of nectar. At this phase, the IDM parameters are calculated using expression (11). The procedure is as follows. Employed bees that form new solutions to the optimization task become scout bees if these solutions do not improve over many iterations. In the context of a bee colony behavioral model, this means the depletion of current nectar sources when the limit counter exceeds LIMIT value.
From the point of view of solving the optimization task (10), the mechanism with the use of scout bees provides a way out of the local minimum [
16,
17].
The implementation of the parameters’ identification method is performed in a software system consisting of three subsystems that interact through the RESTful API, in particular:
(1) Subsystem of registration as a web resource, which allows the addition of new users and the addition of new mathematical expressions (structures) for the difference equations. It is possible to specify the settings of the calculation process, such as: the number of bee populations S, the area of search for the minimum function in the form of restrictions on the parameters of the difference equation, LIMIT and other. This subsystem is developed in the PHP programming language using the Laravel framework and the MySQL database. The client part of the site (frontend) uses the Bootstrap CSS framework and the jQuery JavaScript library.
(2) Subsystem in which mathematical calculations are performed. Developed using the PHP programming language, Lumen micro-framework, and the MySQL database. The software libraries that work with mathematical expressions (MathExecutor) and intervals (php-math-interval) were used.
(3) Subsystem for data collection, retrieval, and visualization. This allows seeing how the calculations are performed, which points are selected at each iteration of the cycle and other information that can help control the calculation process. This allows the detection of errors and increase of the calculation process efficiency. Elasticsearch is used as a database, and Kiban is used for data processing.
4. Experimental Research of the Method of IDM Parameters’ Identification
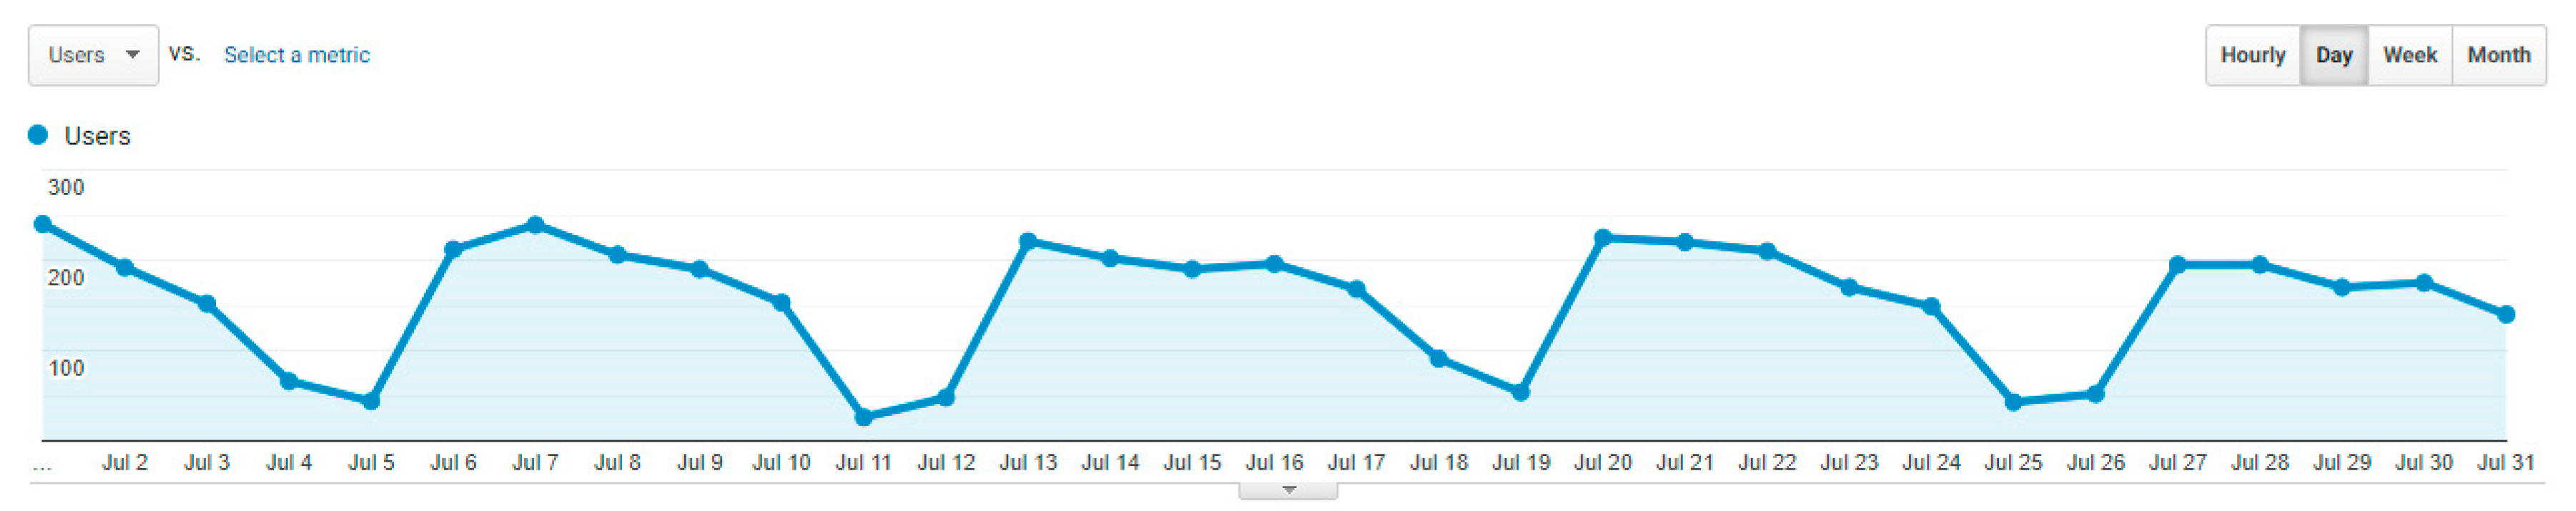
Let us consider the application of the described above procedure on the example of the web resource of the Center of Municipal Services of Ternopil City Council concerning environmental expertise services. The authors of the web resource are the authors of the paper. Therefore, using Google Analytics, statistics on the activity of users related to environmental expertise services have been collected. The research has been conducted over one year.
Figure 1 shows a fragment of the activity graph.
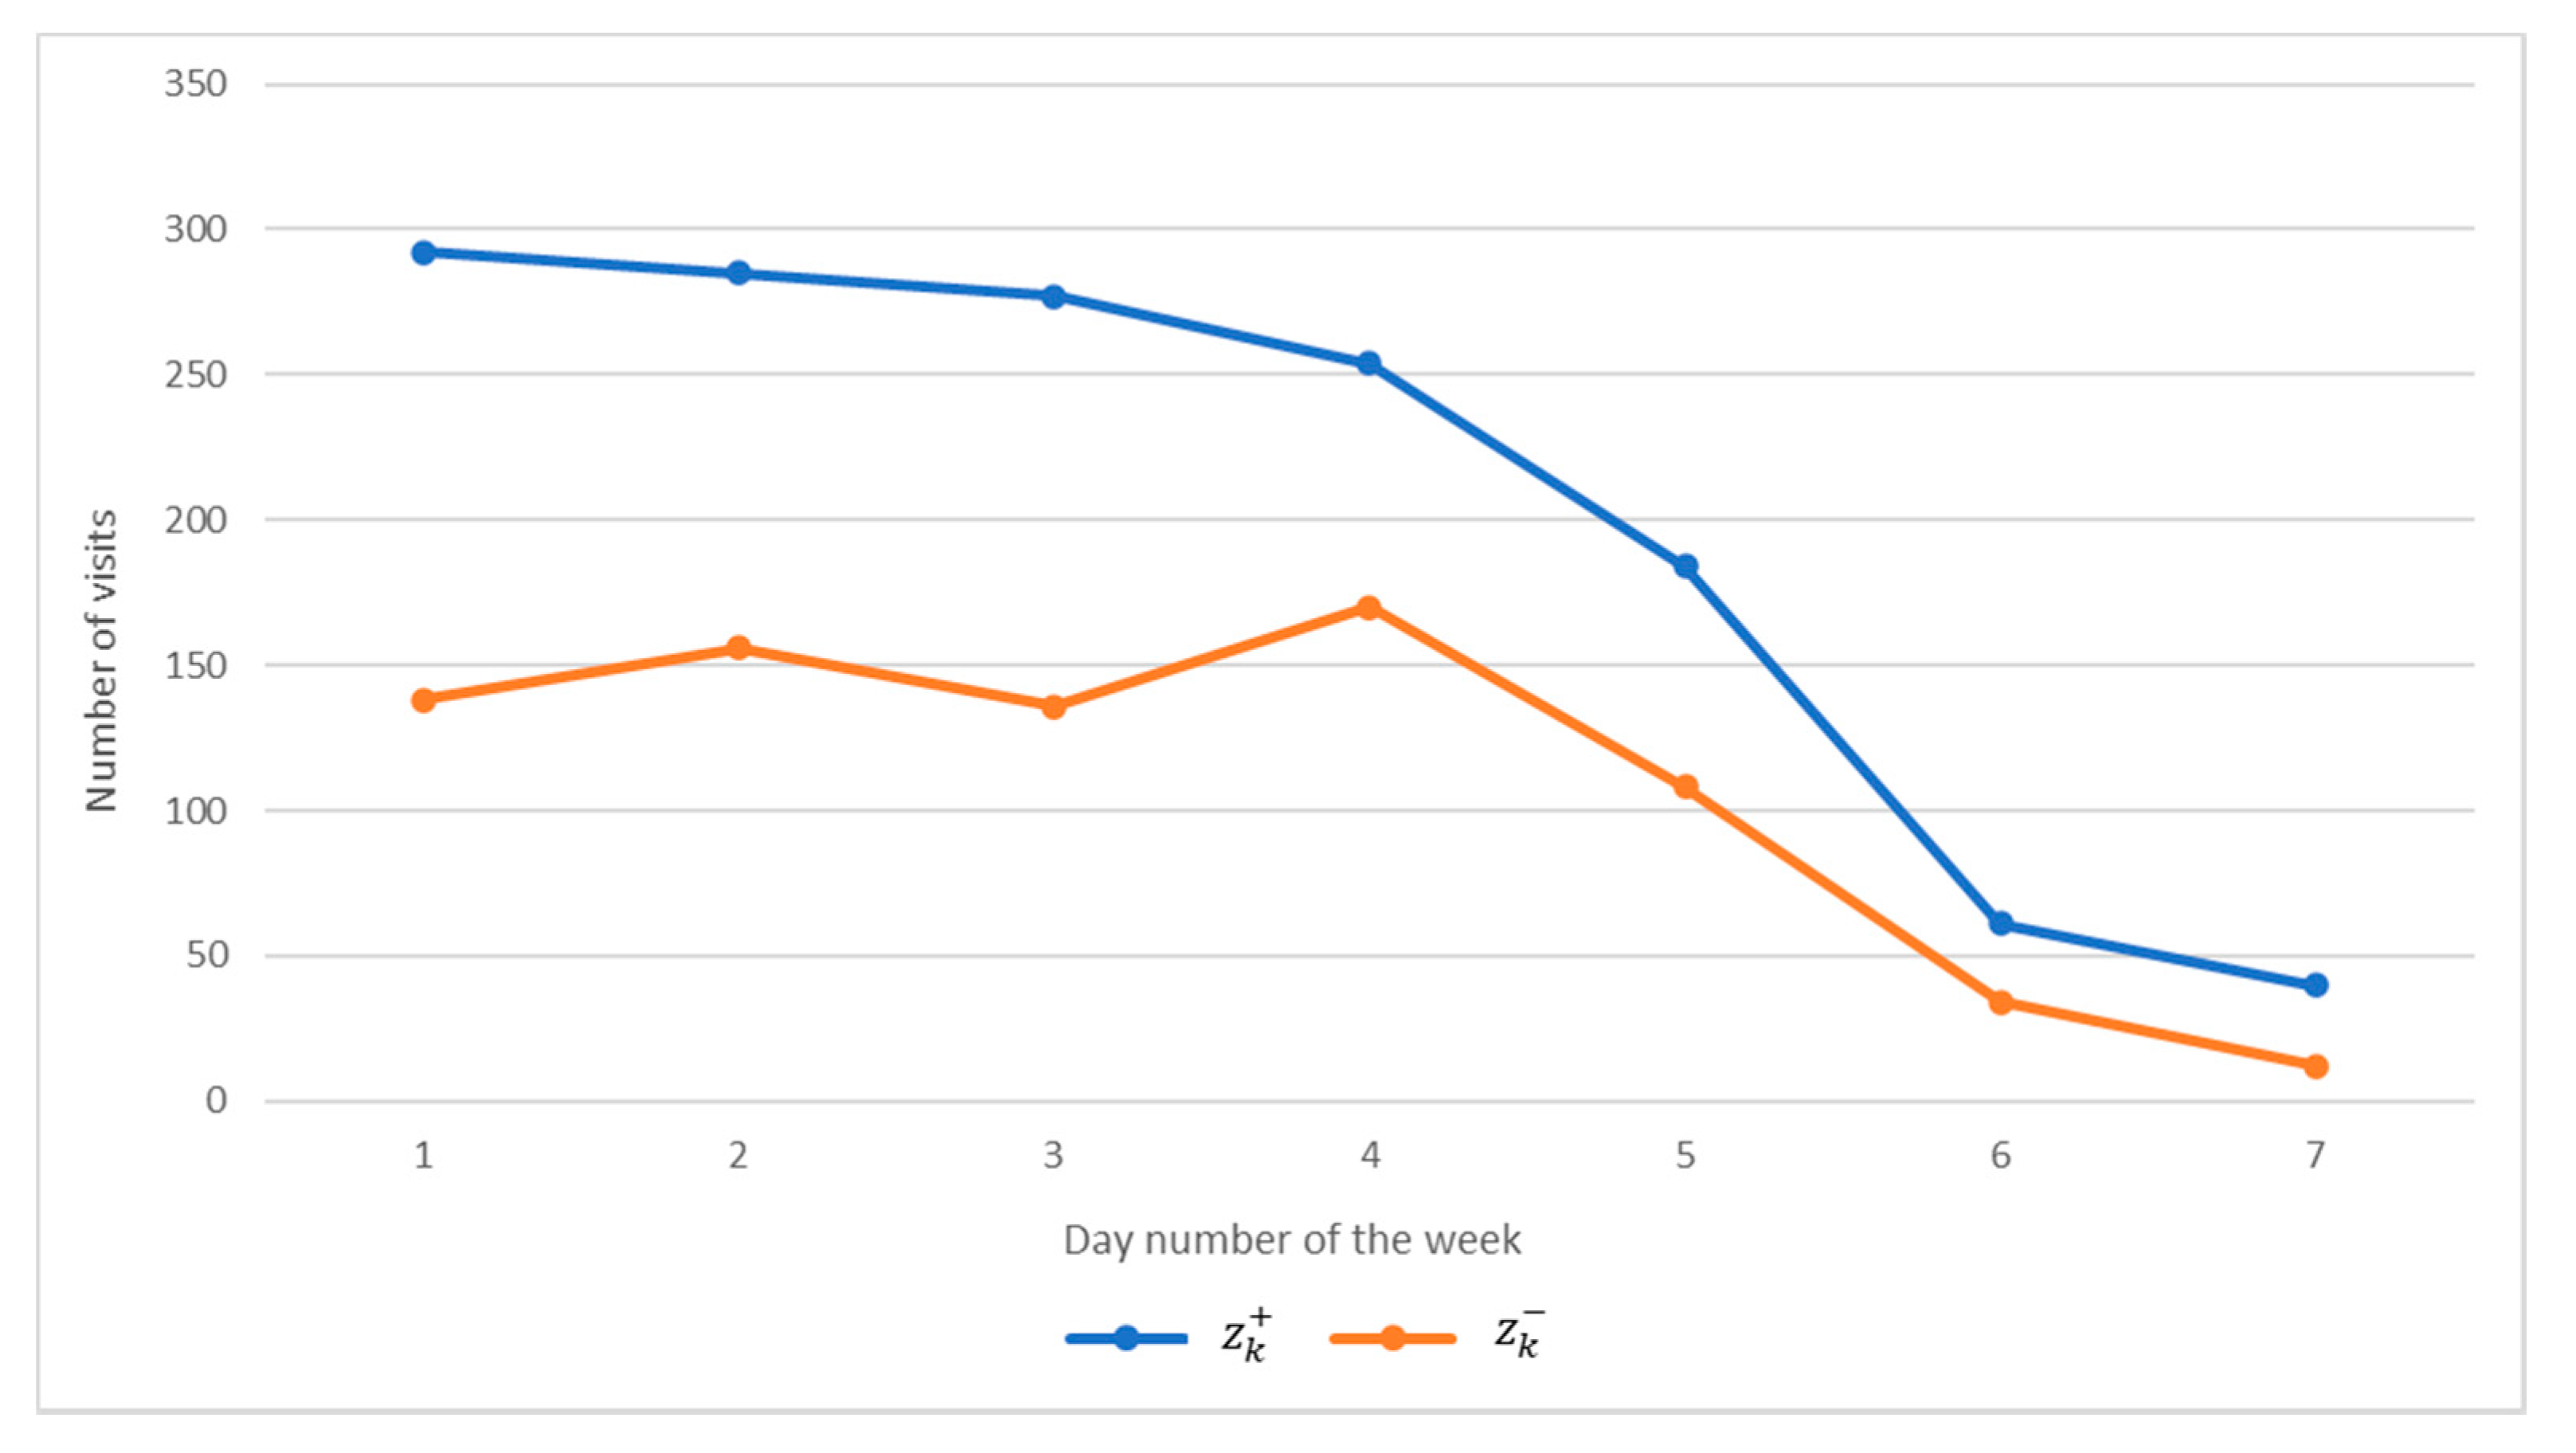
As you can see from this fragment, user activity is cyclical. Moreover, this cycle is over a period of a week, which is completely natural for this web resource. Based on such observations, it was decided to determine the activity intervals for each day of the week during the year. The results of these studies are shown in
Figure 2 and in
Table 1.
As it is known, the procedure of IDM parameters’ identification is a subtask of the structural identification task [
10]. That is why to build the above-mentioned model, it also required to solve the structural identification task. To do this, the known method of IDM structural identification, which is described in detail in [
10], has been used. Note that this method, as well as the method of parameters’ identification, is based on the biological aspects of the foraging behavior of the honeybee’s colony in the wild. To build the IDM, aggregated experimental data of user activity on the specified resource, shown in
Table 1, have been used.
During the first computational experiment, an attempt was made to build the IDM in the form of a linear difference scheme. During this experiment, the following kind of difference equation (the structure of the mathematical model) was proposed for the mathematical model:
At the same time, at the stage of parameters’ identification using the method of parameters’ identification described in
Section 3 of this article, the following estimates of the model parameters were obtained (16):
= 0.6644,
= −0.6178,
= 1.5105.
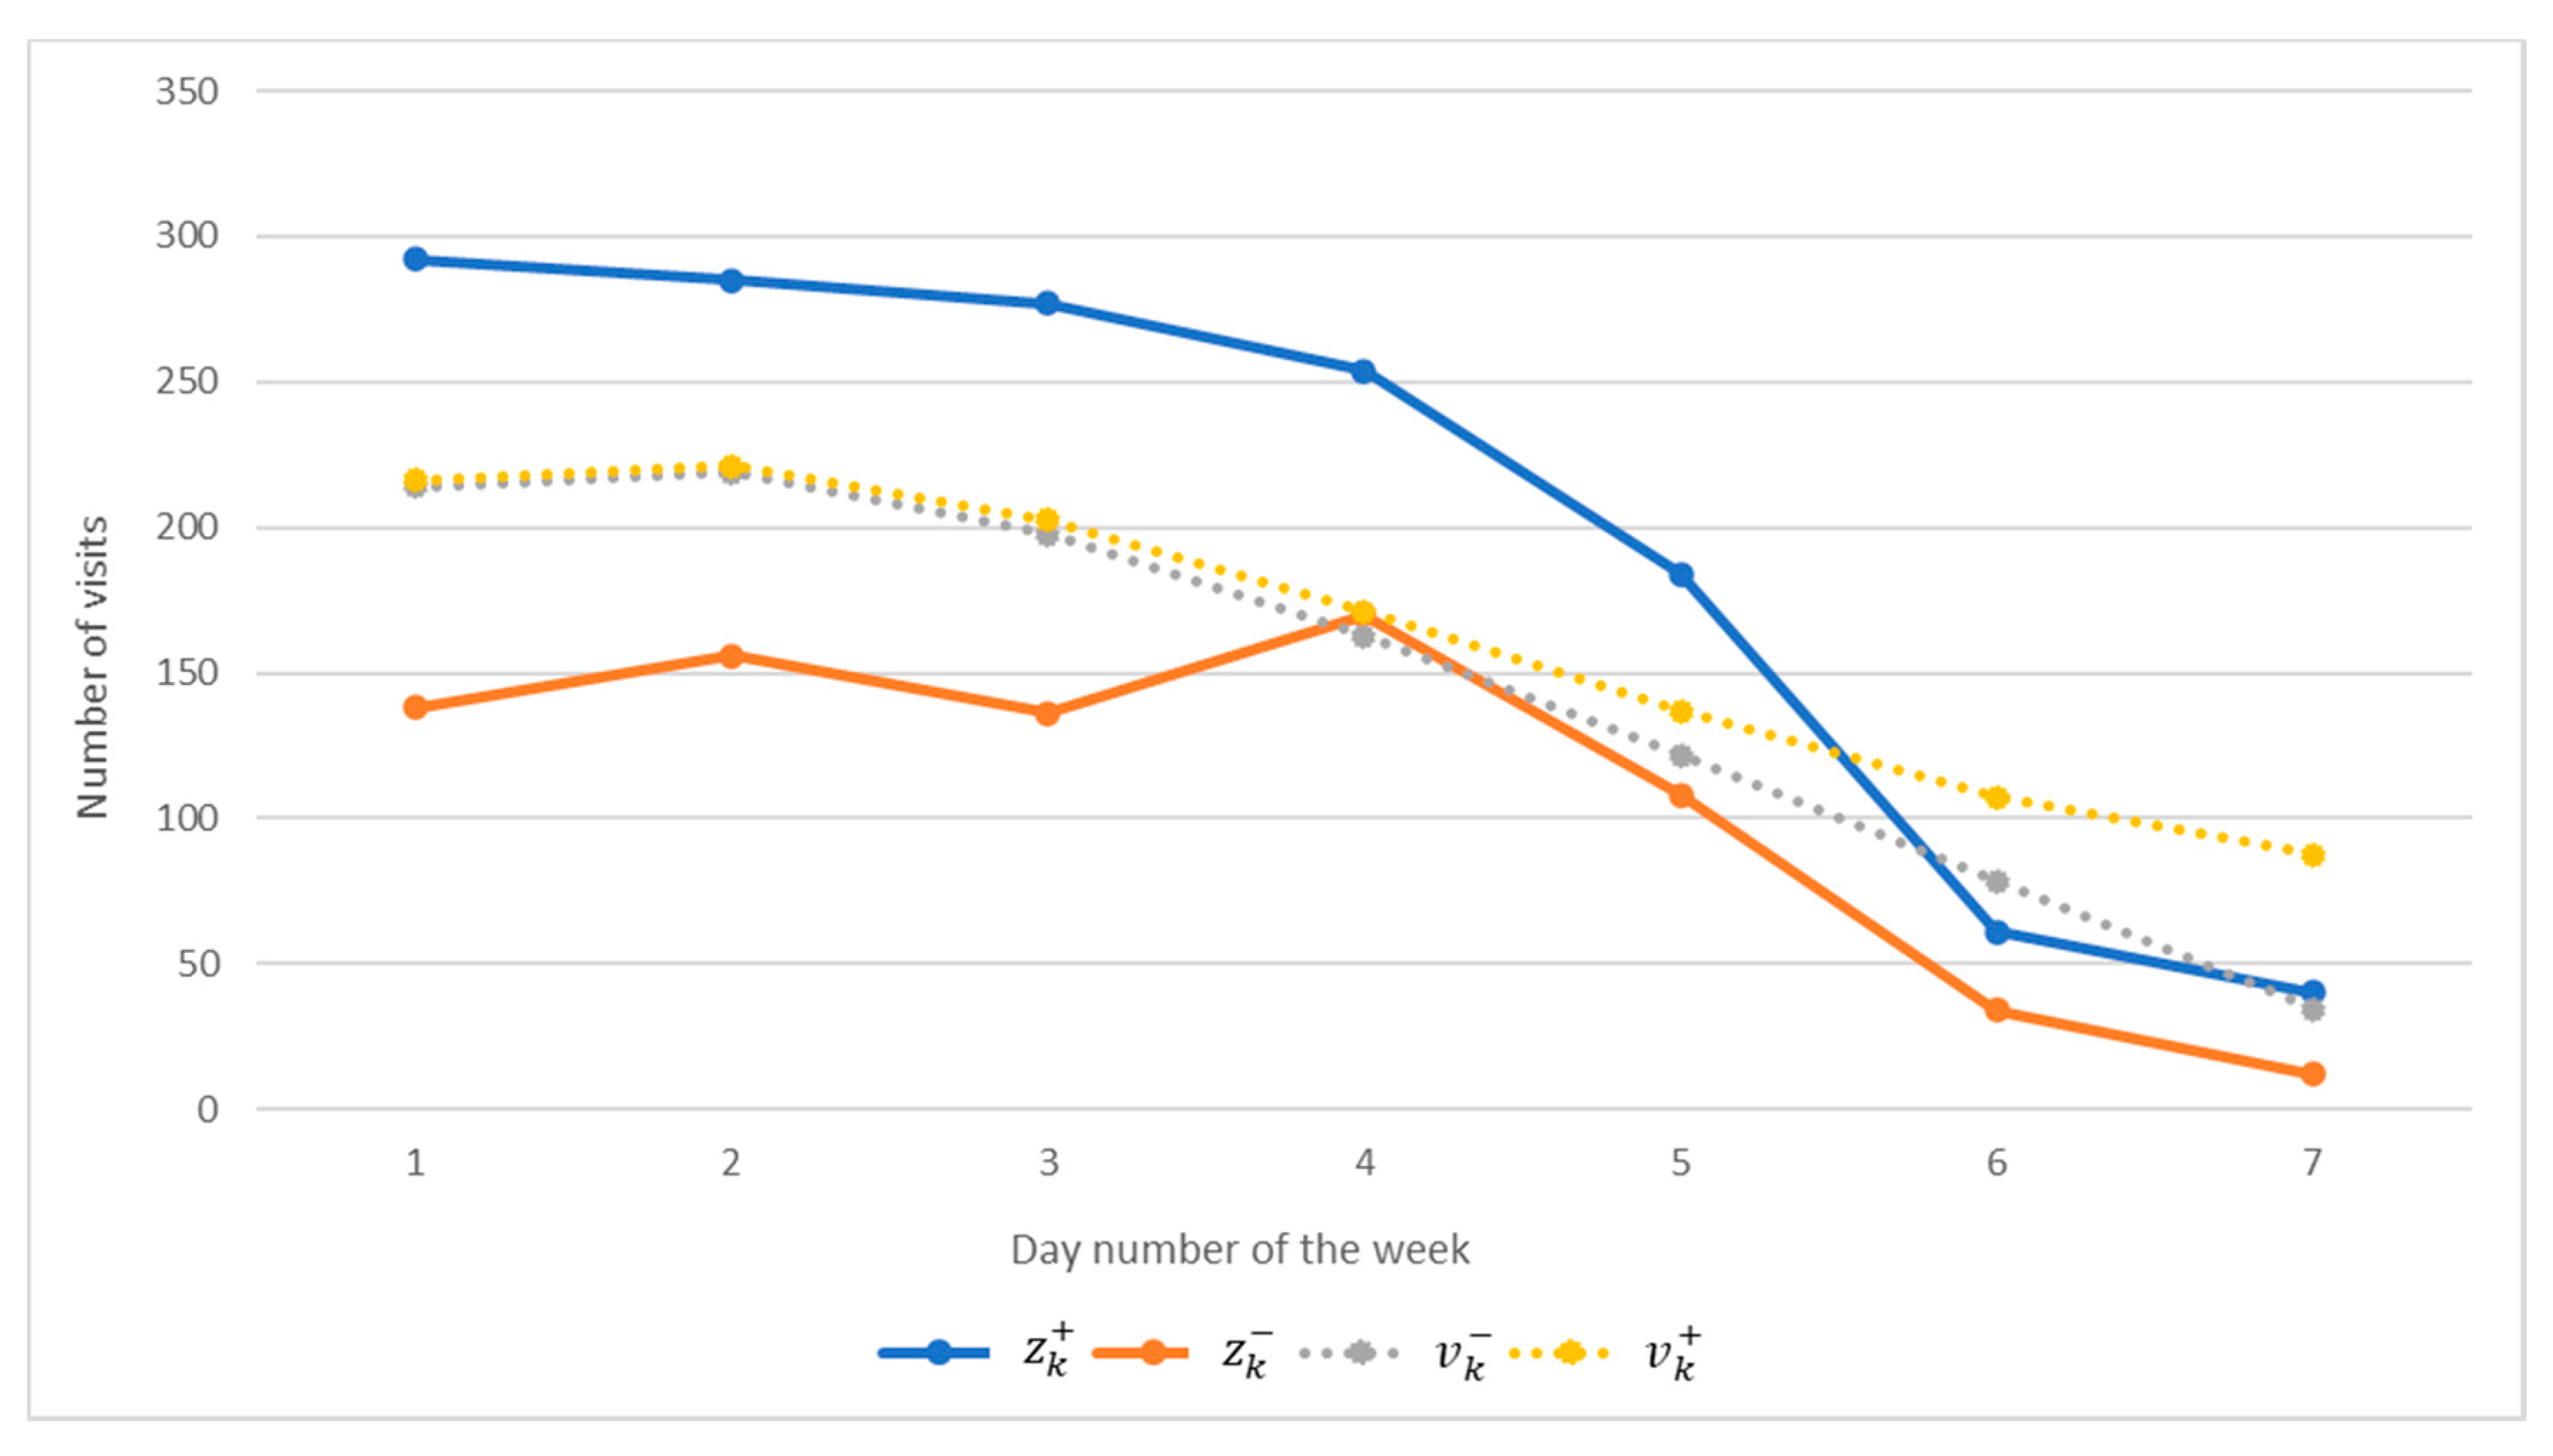
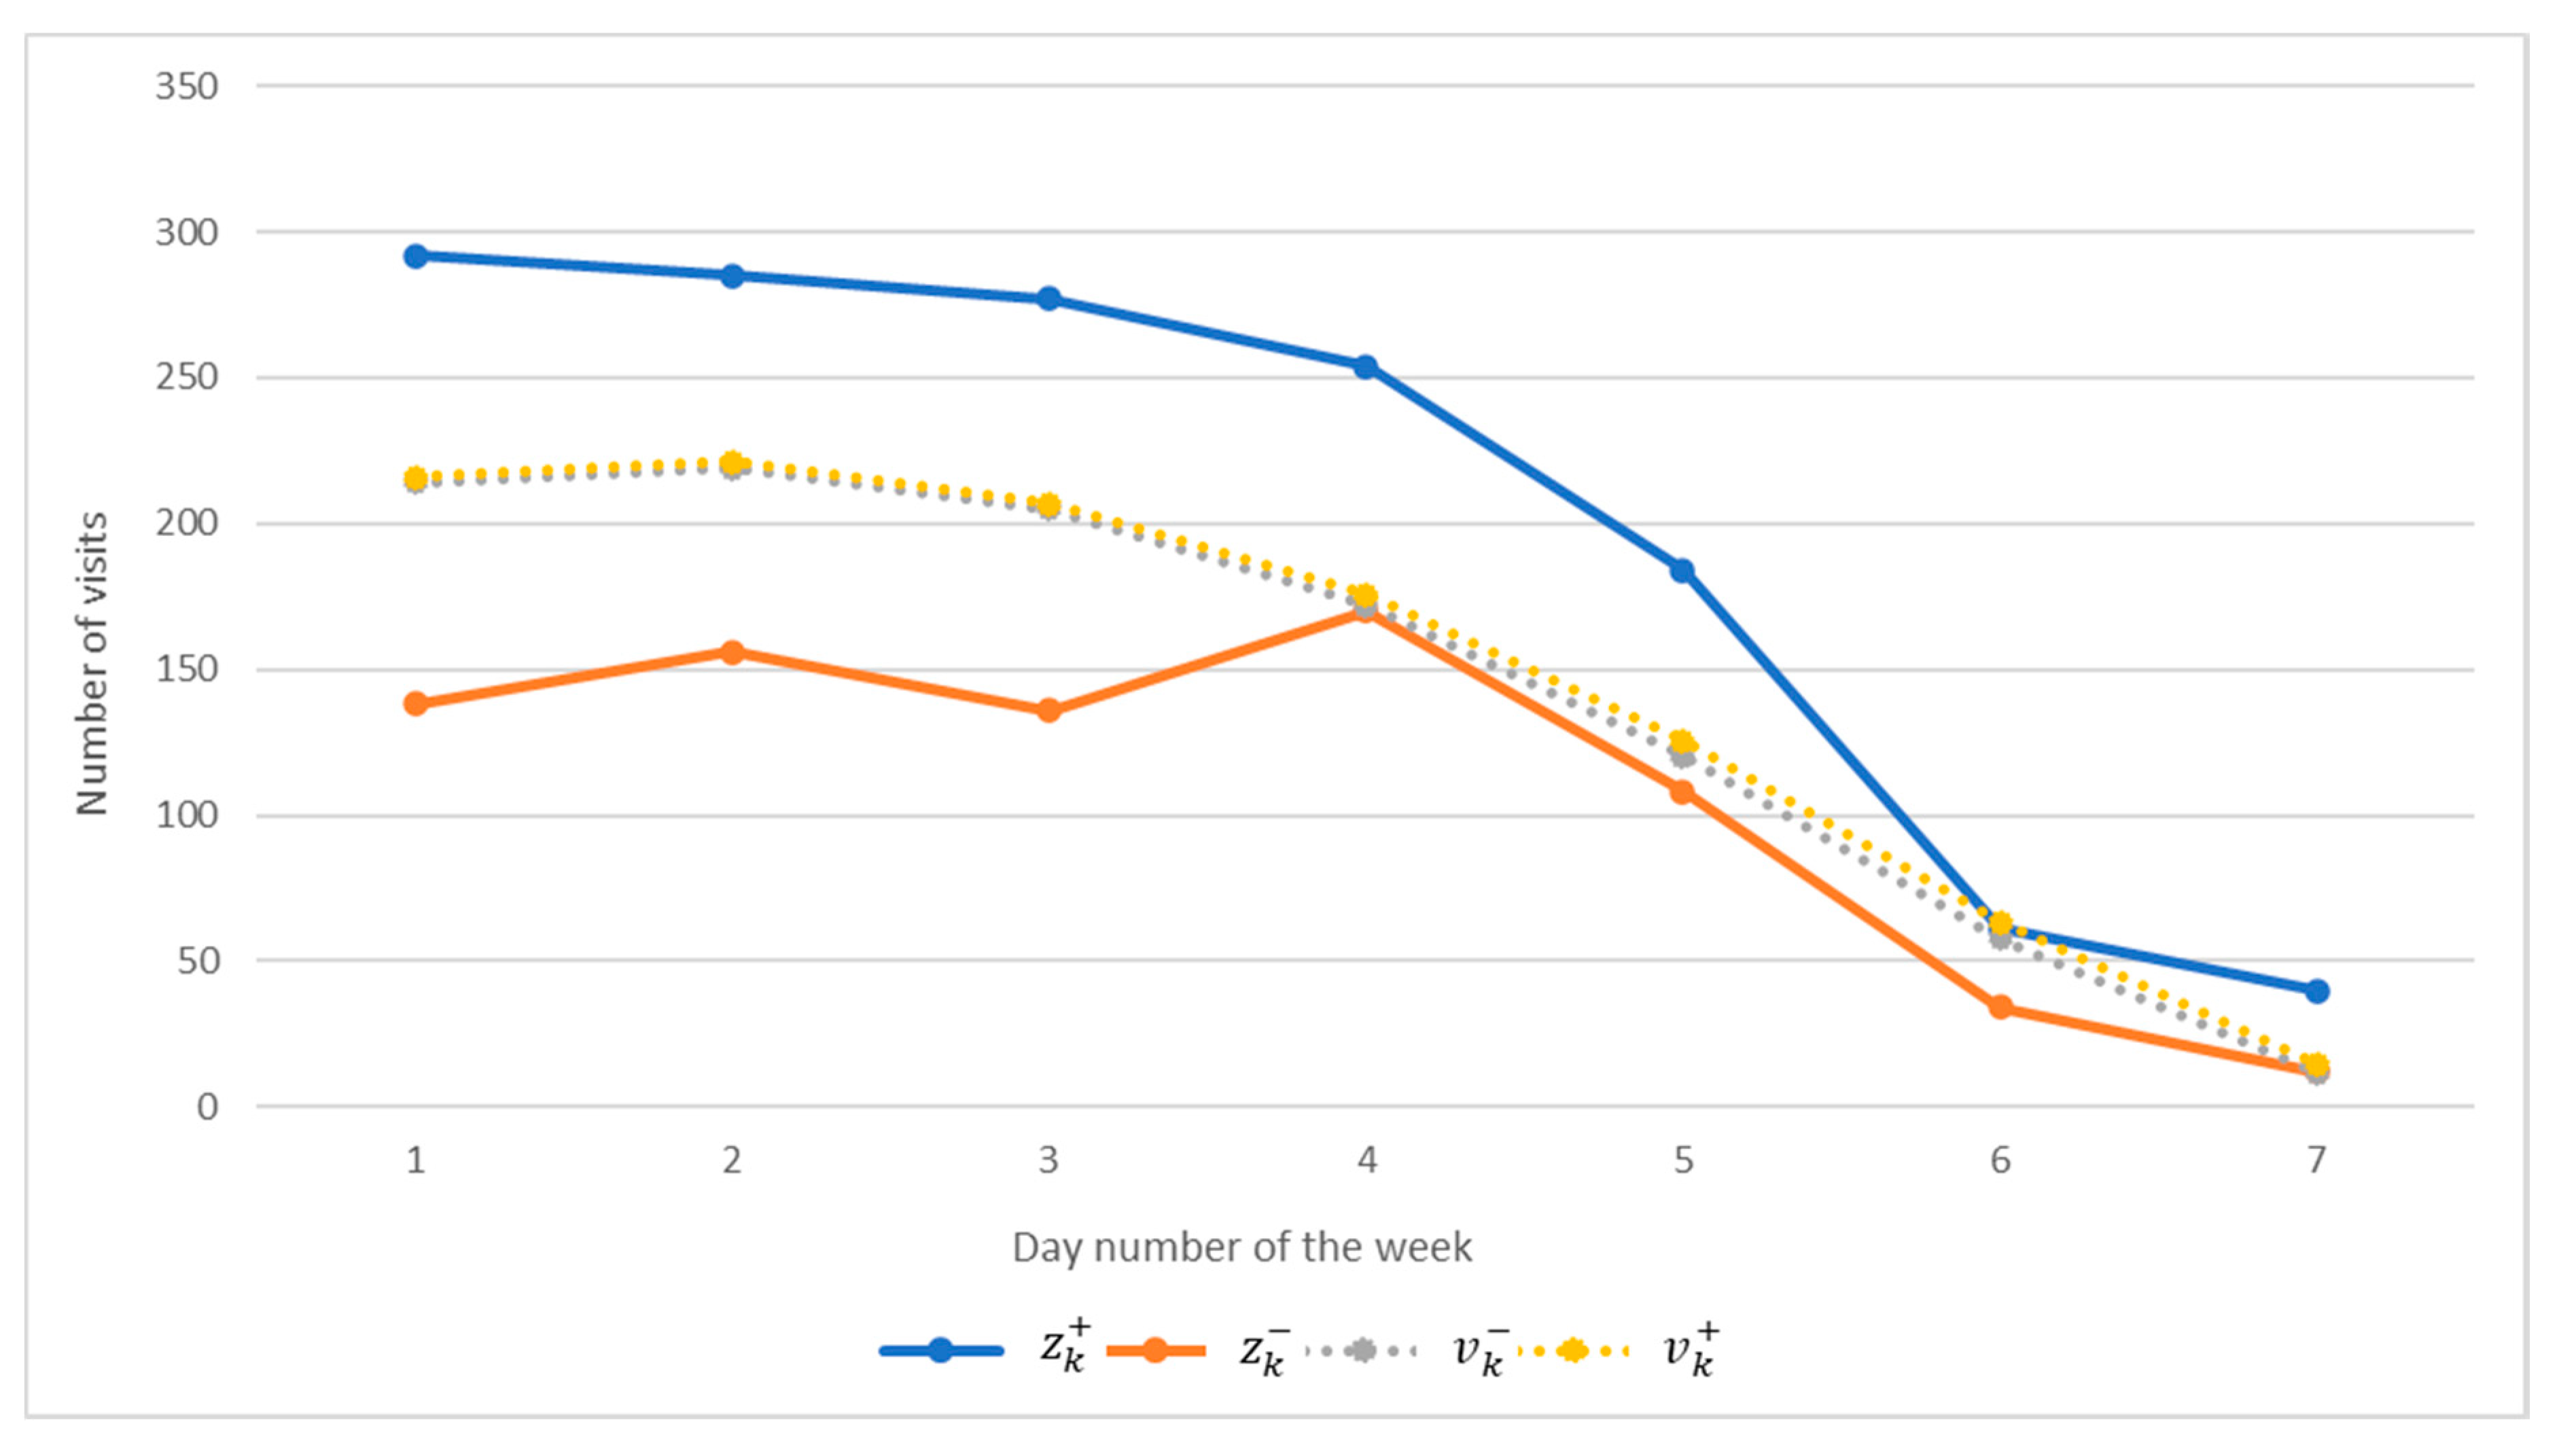
The results of modeling using the obtained mathematical model together with the experimental data are shown in
Figure 3. In particular, the calculated lower bound of the interval
is indicated by a gray dotted line, and the upper bound
is indicated by a yellow dotted line.
As can be seen from
Figure 3, this model is inaccurate. In particular, for discrete values with numbers
k = 3, 5, 6 (for 4, 6, 7 days) conditions (5) are false. Note that with an adequate IDM structure, these conditions must be satisfied for all discrete values of the modeled characteristic.
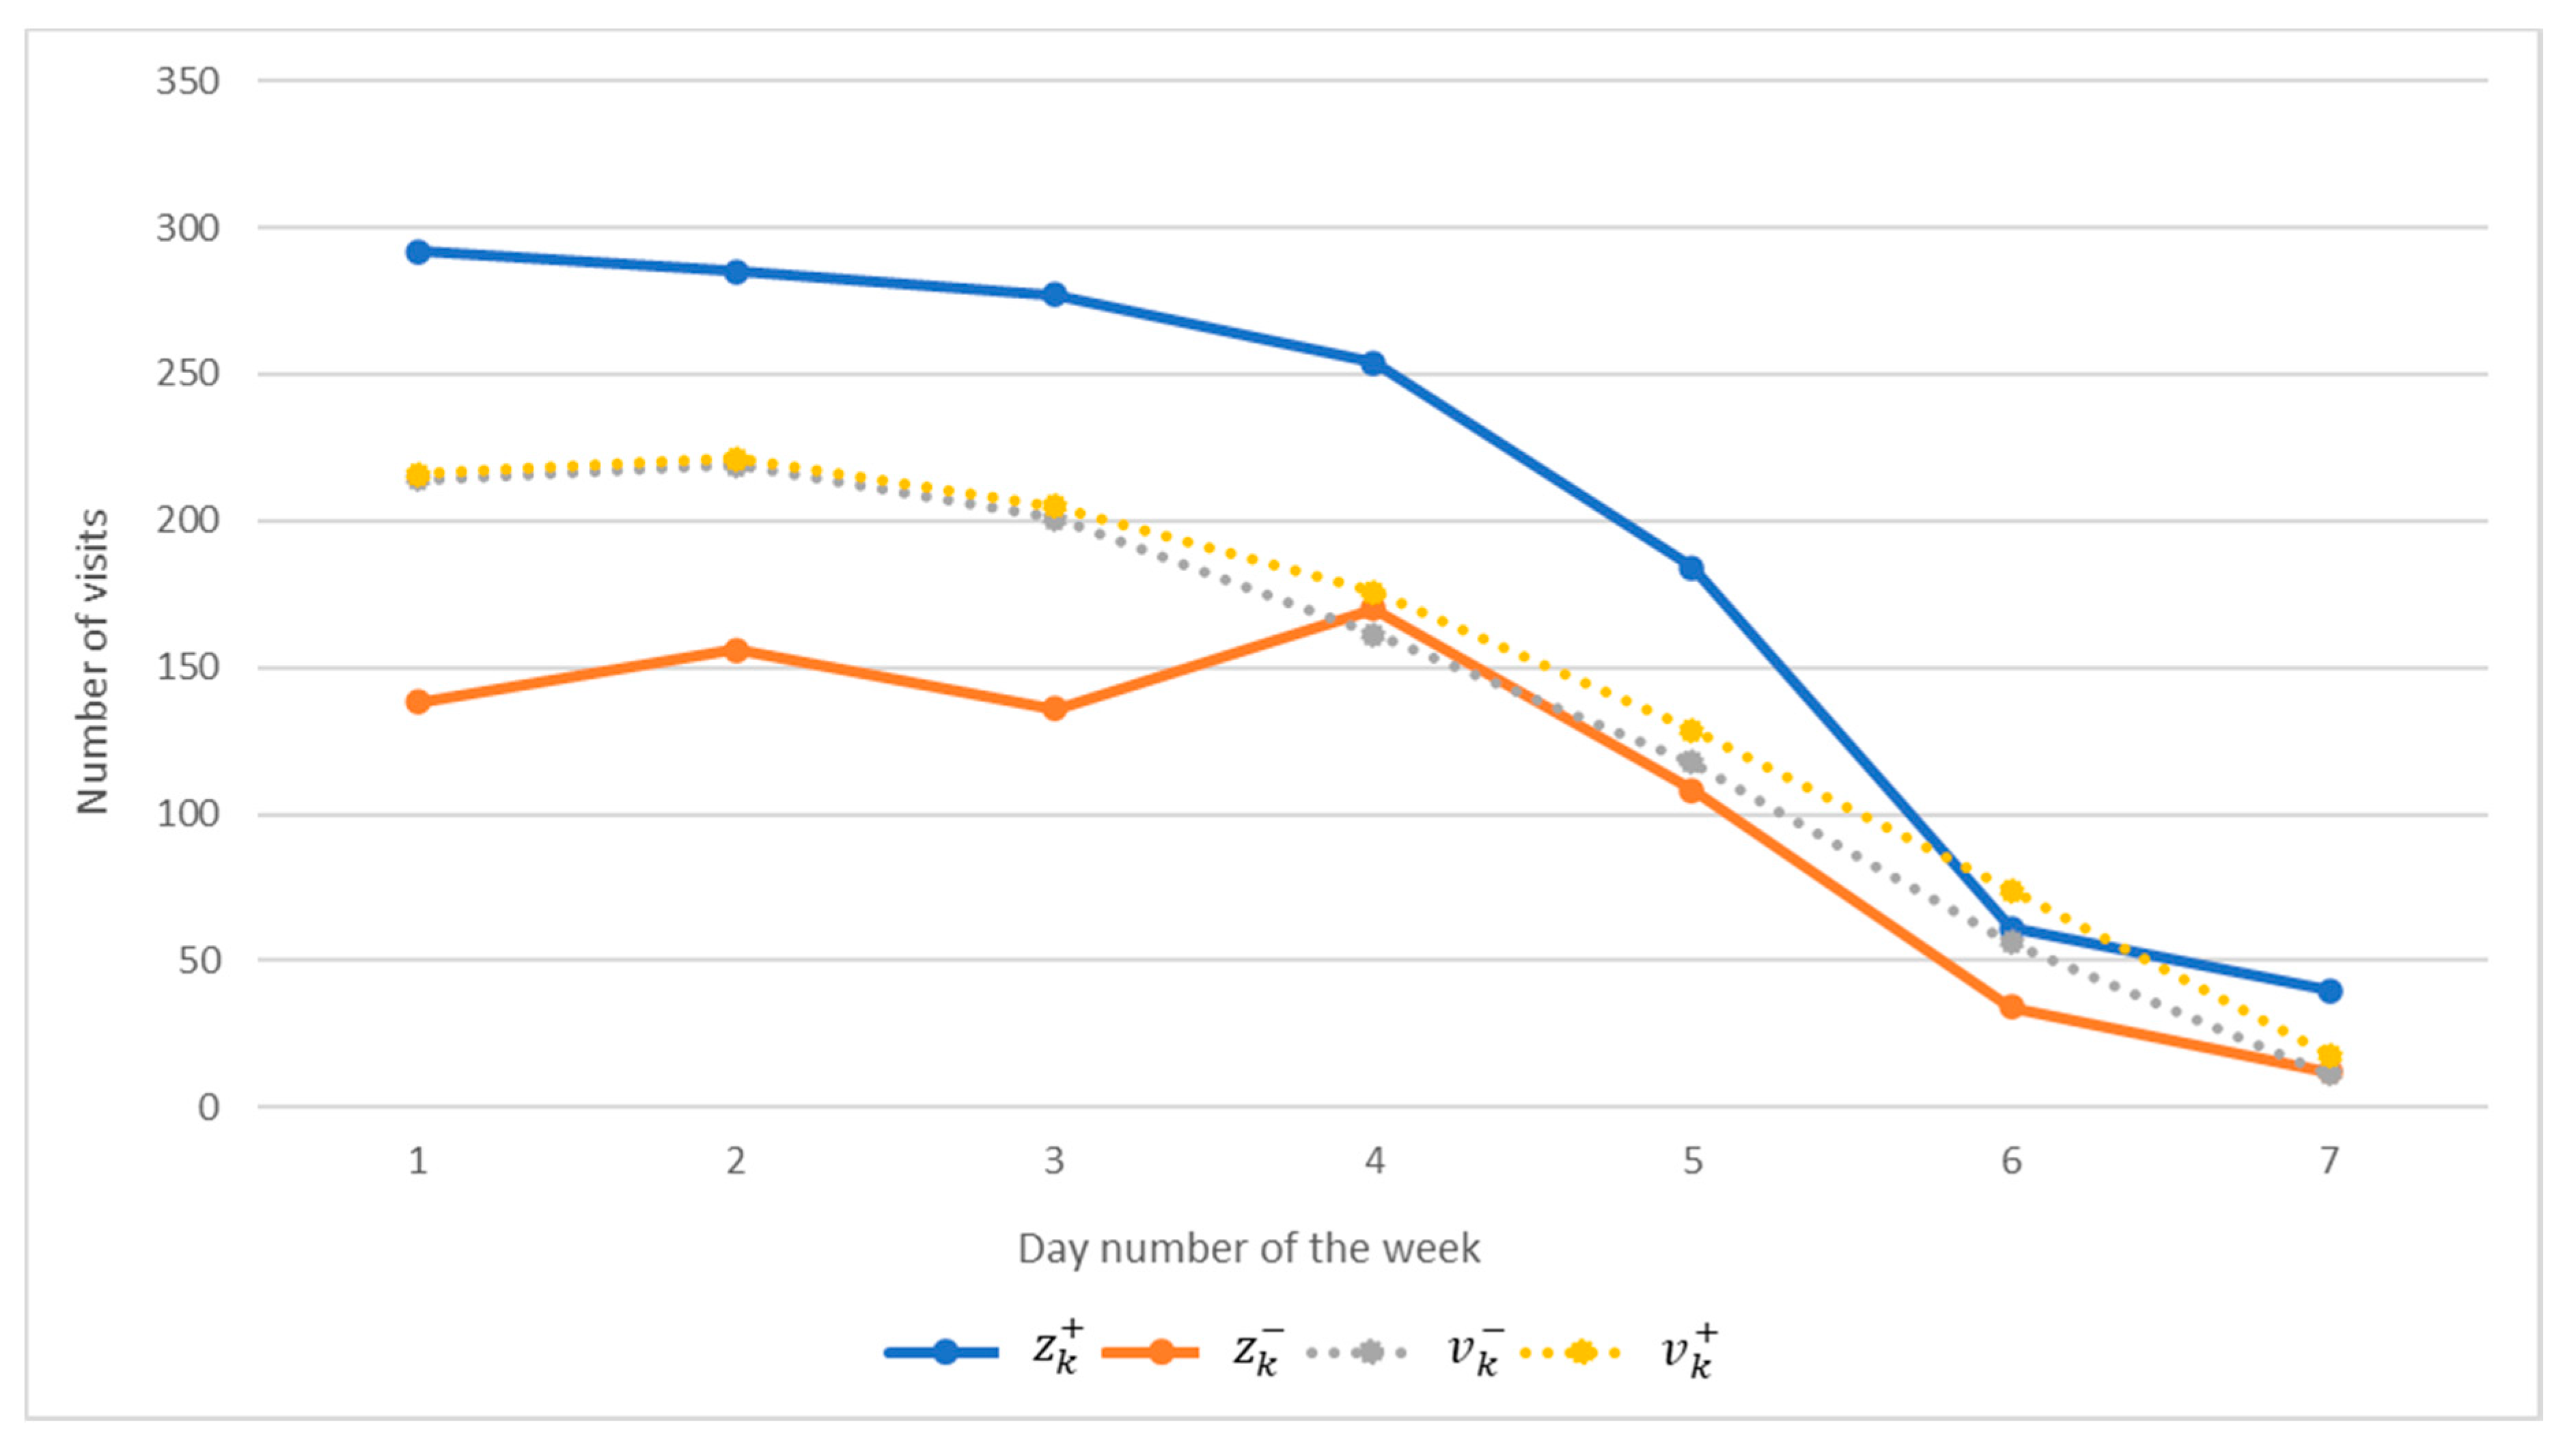
Therefore, in further research, it was decided to build an IDM to predict the activity of users on this resource in a nonlinear form. To achieve this, while solving the task of structural identification of the model, the set of structural elements was extended by nonlinear elements. Thus, as a result of the second computational experiment, the following IDM structure was obtained to predict the activity of users on the specified resource:
With this, the estimations of the model (17) parameters were obtained on the parameter estimation step: = −0.2954, = 0.1549, = 0.0042, = −3.3365.
As can be seen from
Figure 4, the IDM built during the second computational experiment also does not have fully guaranteed predicting properties. In particular, conditions (5) are not met for the discrete
k = 3, 5, 6. However, it should also be noted that this structure of the model is much more accurate than the previous structure of the model (16). It is closer to being adequate.
Therefore, during the third computational experiment, it was decided to keep the structure of the model (17) unchanged and carry out the procedure of parameters’ identification once more. In this case, it was also decided to extend the set of initial conditions as follows: k = 0, …, 2.
Thus, other estimates of the model parameters (17) were obtained to predict the discrete values with numbers
k = 3, …, 6 for the users activity at the specified resource, in particular:
= −0.2657,
= 0.3150,
= 0.0041,
= −3.2707. The mathematical model has the following form:
The predicting properties of the IDM according to the results of the third computational experiment are shown in
Figure 5. Parameters of
Figure 5 show the results of applying the model to the prediction of user activity. As we can see, the predicted activity is entirely included in the interval of observations, which means the model is adequate. This also ensures guaranteed predictive properties of the model, which is the fulfillment of conditions (5) on the set of all discrete values of the modeled characteristic.
It is worth noting that to predict the user activity, it is enough to set the activity value as the first 3 days.
The obtained mathematical model of the activity of users on the web resource of the administrative services center of Ternopil City Council concerning environmental expertise services can be extended to other similar web resources. It only needs an insignificant adjustment. The use of such a model makes it possible to optimize staff business processes, to plan the weekly workload of service providers and optimally allocate resources within the organization.

 ,
, 


