1. Introduction
The importance of mathematics transcends mere knowledge and is considered one of the key competencies for personal and professional development [
1]. The learning and development of this competence in Spain appear in the school curriculum regulated by the Organic Law 8/2013, 9th December, for the improvement of educational quality (LOMCE), as well as the ECD 65/2015 of 21st January, which describes the relationships between competences, contents, and criteria for the evaluation of primary, high school, and post-16 education.
This policy also sets guidelines for improving students’ academic performance. This is generally affected by socioeconomic, environmental, family, ethnic, and educational factors, among others [
2]. Significant associations between academic performance and interpersonal relationships in the educational environment have also been noted, with the teacher–student relationship being the most relevant [
3]. On the other hand, the classroom climate, perceptions of learning mathematics, and personal motivation also play an important role in students’ academic success [
4,
5,
6].
Therefore, this study focuses on the analysis of several academic factors that influence the academic performance of students, such as learning mathematics, interpersonal relationships within the classroom, and the perception and motivation of students. In this context, an analysis of students’ academic performance in mathematics is proposed using an innovative methodological approach that allows the maximum gain in academic performance in mathematics to be quantified through predictive calculations of the data collected in the study.
1.1. Mathematics and Its Learning
Mathematical competence is one of the skills that allow students to build visions of the future from performance in the present [
7]. This competence also favors entrepreneurship, regardless of later studies that the students will pursue [
8]. Despite the importance of mathematics as a fundamental competence for personal and professional development, it has been demonstrated that students in general have a low capacity for understanding and justifying basic concepts in mathematics [
9]. These results are partly explained by a fear of mistakes, due to negative connotations at a personal and social level [
10].
To improve these results, practical activities are recommended, because they facilitate meaningful learning and encourage interest in Science, Technology, Engineering, and Mathematics (STEM) [
11]. However, students’ perception of science practices decreases with age, affected by the demands for good grades in higher courses [
12]. In addition, it has been shown that interest in STEM higher education greatly depends on the mathematics skills acquired during high school [
13]. This competence decreases more rapidly among teenage girls, affected in part by gender stereotypes [
13]. On the other hand, students’ perception of mathematics affects their academic performance [
14,
15]. Although their overall assessment is not negative, students avoid higher STEM studies since the other options appear to be less rigorous and more accessible to them [
16].
With regard to gender, there is a tendency to order and manage mathematical knowledge better in the case of girls, and girls also tend to seek help in the case of difficulty to a greater extent than boys [
17]. Therefore, teachers must have effective feedback tools to enable them to know the interest and mathematical understanding of their students [
18]. The perception of students of their teachers, classroom, classmates, and learning in the different subjects are factors that affect their motivation and academic performance [
19,
20].
From the teacher’s point of view, the most appropriate teaching methodology should be considered, depending on the available resources, subject matter, and type of students, favoring their motivation in learning [
21]. On the student side, it is essential for them to be involved in the design of powerful learning environments [
22]. In addition, students who abandon school need to create effective learning environments [
23]. The teacher–student relationship [
24] and motivational aspects should also be taken into account, as everything necessarily impacts students and their academic performance [
5,
19].
1.2. Interactions in the Educational Environment
Classroom interactions and disruptive behavior among high school students are other important elements that impact academic achievement [
25,
26]. These factors may justify absenteeism in school and early school failure associated with academic failure [
26]. Therefore, it is important to evaluate the classroom as a learning environment, articulate interventions aimed at its improvement [
27], and address pedagogical aspects of mathematics learning in the psychosocial environment [
28]. In addition, it should be noted that the effects of classmates in ethnically mixed classrooms are important for educational development during adolescence [
29].
From a constructivist pedagogical perspective, errors are considered natural elements of learning processes. In the classroom, however, making mistakes is not only a personal event, but also a social event, and is a major disincentive for students of mathematics [
10]. This affects interest in higher STEM studies [
13].
For all of the above, it is necessary to create and validate a scale to evaluate the climate that both teachers and students create in the classroom [
30] because of its influence on the academic success of the students [
31]. These tools are required especially among groups at risk of social exclusion, and exposed to early school failure [
32].
The scientific literature postulates that the teacher–student relationship is another important aspect that affects students academically [
33,
34]. This relationship depends on the students’ perception of the subject taught by the teacher and the difficulty as perceived by the teacher [
35]. These perceptions significantly influence interest in the subject matter and condition the student’s future academic career [
36,
37]. However, a recent study states that the effects of teachers on student outcomes are generally not significant for most [
38]. In contrast, the influence of the teacher may reduce opportunities perceived by students at risk of social exclusion [
39]. In this sense, good communication between the teacher and student is advisable, in order to know about and improve the mathematical competence of the student through attractive didactic strategies [
18,
40,
41].
1.3. Motivation
The role of motivation and effort should not be forgotten, as these factors influence the learning of mathematics [
6]. Beyond capacity, traits related to perseverance, such as determination and self-discipline, are associated with adaptive educational outcomes [
42]. The scientific literature provides evidence of significant positive correlations between self-motivation and students’ socio-cognitive perceptions of STEM activities in academic outcomes [
43,
44].
On the other hand, when analyzing the motivation to study, it has been observed that an external stimulus, such as a qualification or title, causes superficial cognitive affect that does not last. Conversely, internal stimuli, such as the desire for personal improvement, the idea of social mobility, the creative spirit of research, or commitment to a virtual object of learning, cause deep and permanent cognitive affects [
6]. In association with this, the role of the teacher in implementing effective intervention strategies among an unmotivated student body is noteworthy [
45]. Therefore, motivation can and should be encouraged from an attractive and participatory methodological and curricular proposal for students [
46]. Therefore, it is important to change the perception of students towards failure. Adequate motivation changes the perception of students towards mathematics and promotes entrepreneurship [
7,
8].
1.4. Justification
According to the 2019 National School Board Report, the Autonomous City of Melilla has the highest early school failure rate in the country, with a value of 29.5% compared to Spain (17.9%) and the European Union (10.6%). Nationally, the average rate is 17.9%, 14.0% for girls and 21.7% for boys. In Melilla, gender-based percentages are 26.9% for girls and 31.9% for boys [
47]. These values are far removed from the 2009 European Union forecasts for all member states. In these forecasts, it was established as an objective that “by 2020, the percentage of 15-year-olds with insufficient competence in reading, mathematics and science should be less than 15%.”
In addition, the National School Board Report shows that in the Autonomous City of Melilla, the ratio for secondary school classrooms is 29.6 and is 28.2 in post-16 education, which are both well above the national averages of 25.3 and 26.1, respectively [
47]. These data suggest the need for the construction of new schools in the city and invite us to analyze the underlying academic problem from a broad perspective, with the participation of the entire educational community.
In this context, due to the high rate of school failure and the low results in mathematics exhibited by Melilla high school and post-16 education students, there is a need to evaluate the academic performance of mathematics students through the analysis of several indicators of the dimensions “B. Learning Mathematics” and “C. School Environment” that could be related to it.
Considering this, this study aims to achieve the following objectives: (1) To examine which variables of the dimensions “B. Learning mathematics” and “C. School Environment” significantly contribute to the scores of the second quarter and quantify their relative importance; (2) to determine the optimal algorithm model for predicting the maximum gain in students’ grades in the second quarter and quantifying it; and (3) to analyze maximum earnings based on gender. The following research questions are also raised, related to the qualifications obtained in the second trimester in mathematics: PI1: Could actions be taken to improve results? If yes, PI2: How could this be evaluated? PI3: How much could be improved? PI4: Are there gender differences?
2. Materials and Methods
To achieve the objectives set out in this study, a quasi-experimental method was used, without pre-post and without a control group. The selection of the study population considered the following inclusion criteria: (1) Residing in the Autonomous City of Melilla and (2) studying high school and post-16 education during the 2018/2019 academic year. With the above criteria, the population of students in the city amounts to 5875 students, of whom 50.84% are girls. Students from all schools and all levels participated in the study, avoiding any kind of bias. The total sample consisted of 2018 students (53.40% girls), of which 417 were first secondary school, 473 were second secondary school, 394 were third secondary school, 417 were fourth secondary school, 233 were first post-16 education, and 84 were second post-16 students.
Questionnaires were completed during school hours using Google Forms. This procedure ensured the reliability of data collection. In addition, all subjects who voluntarily participated in this study had been previously informed of the nature of the study. In order to access the classrooms, the Provincial Directorate of Melilla of the Ministry of Education and Vocational Training was authorized.
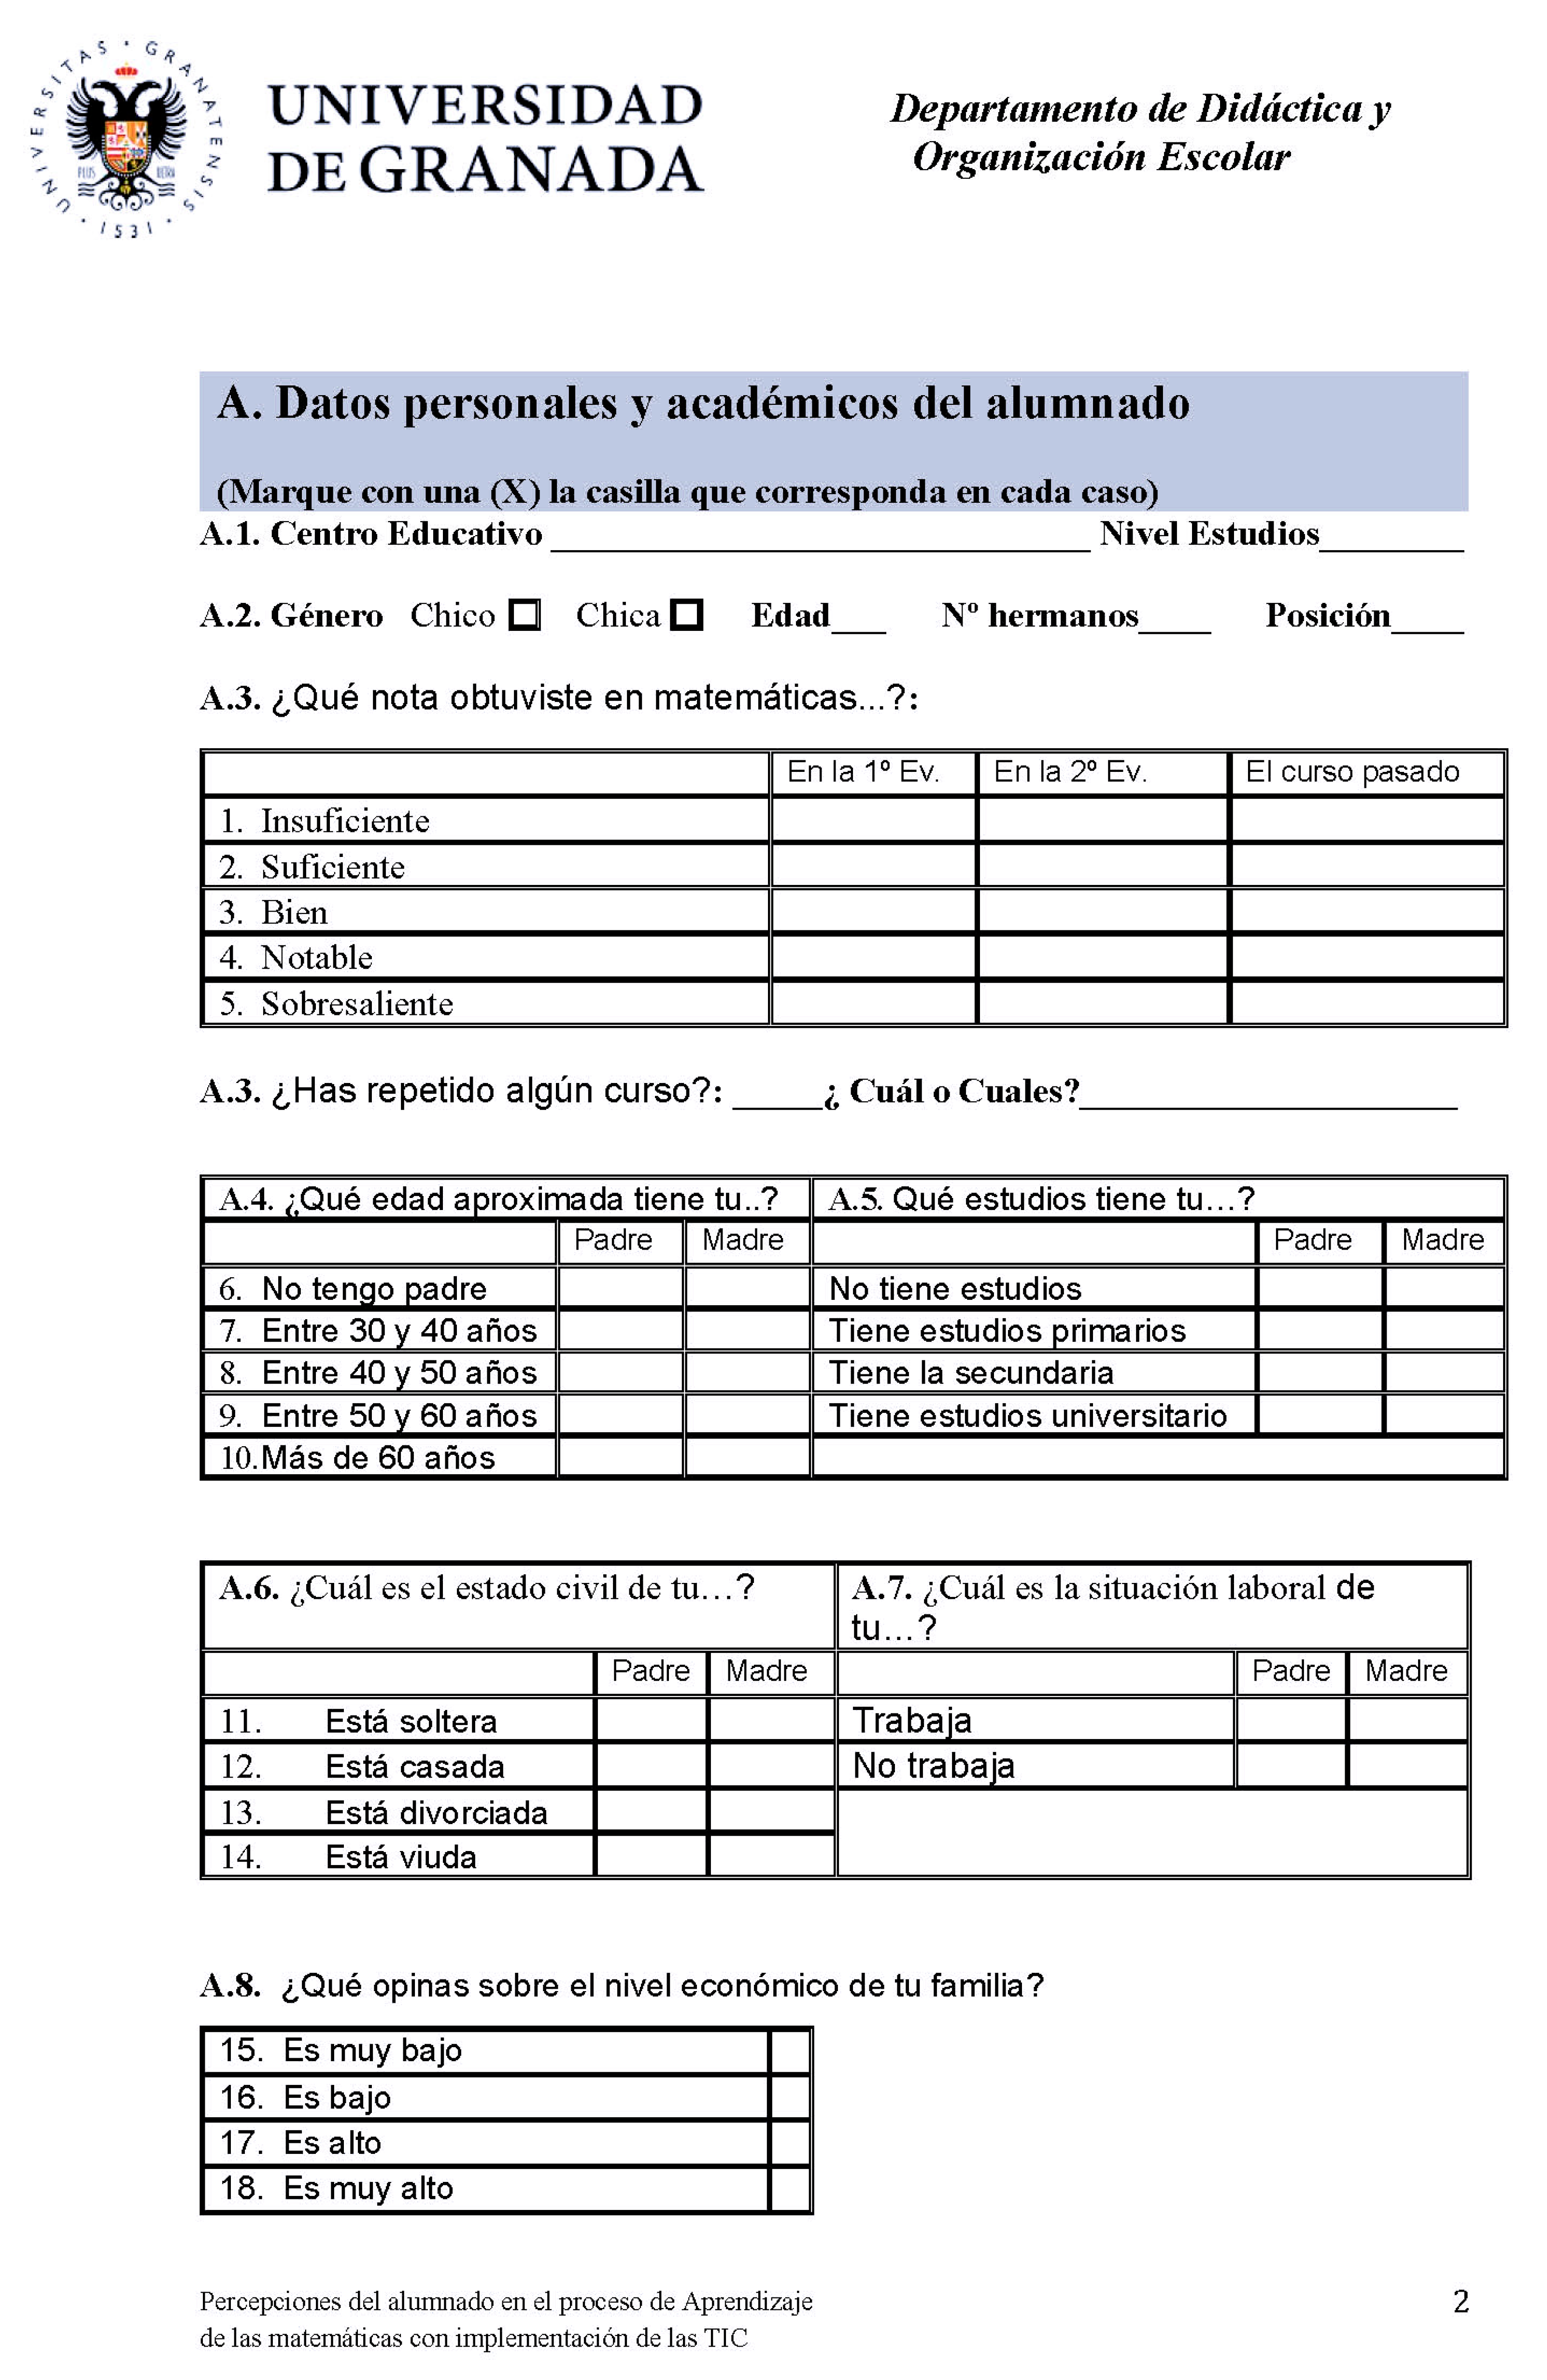
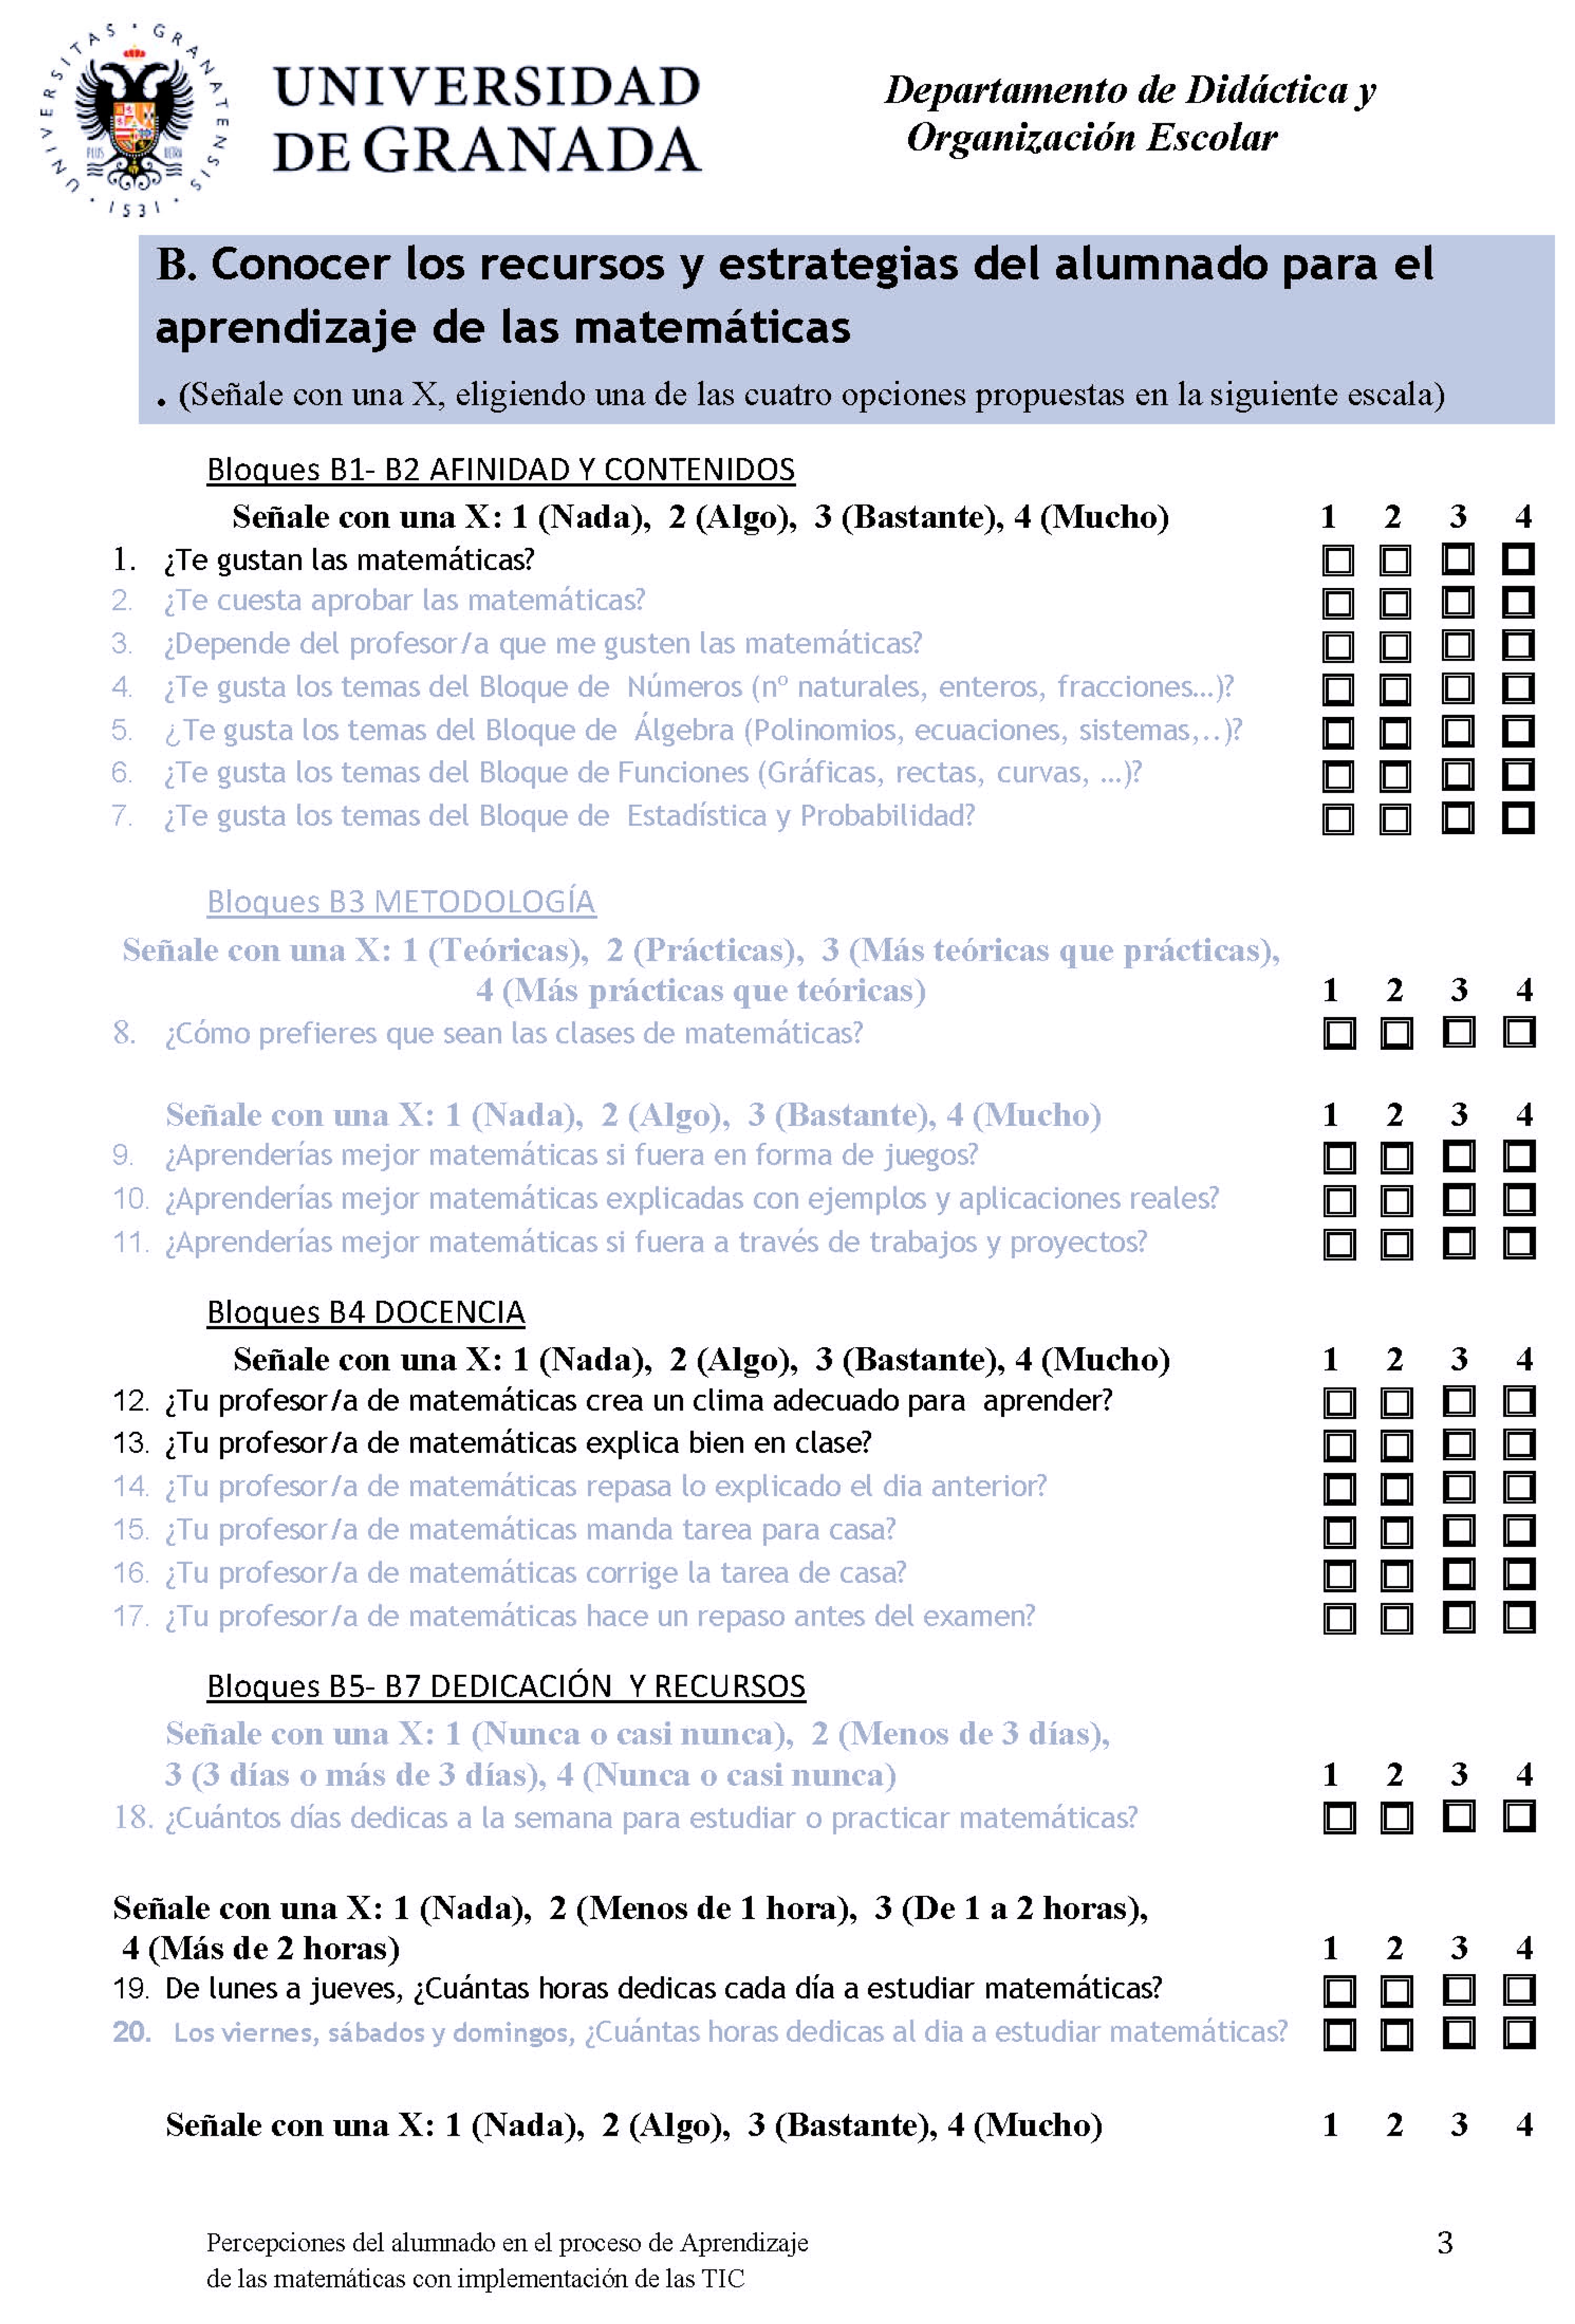
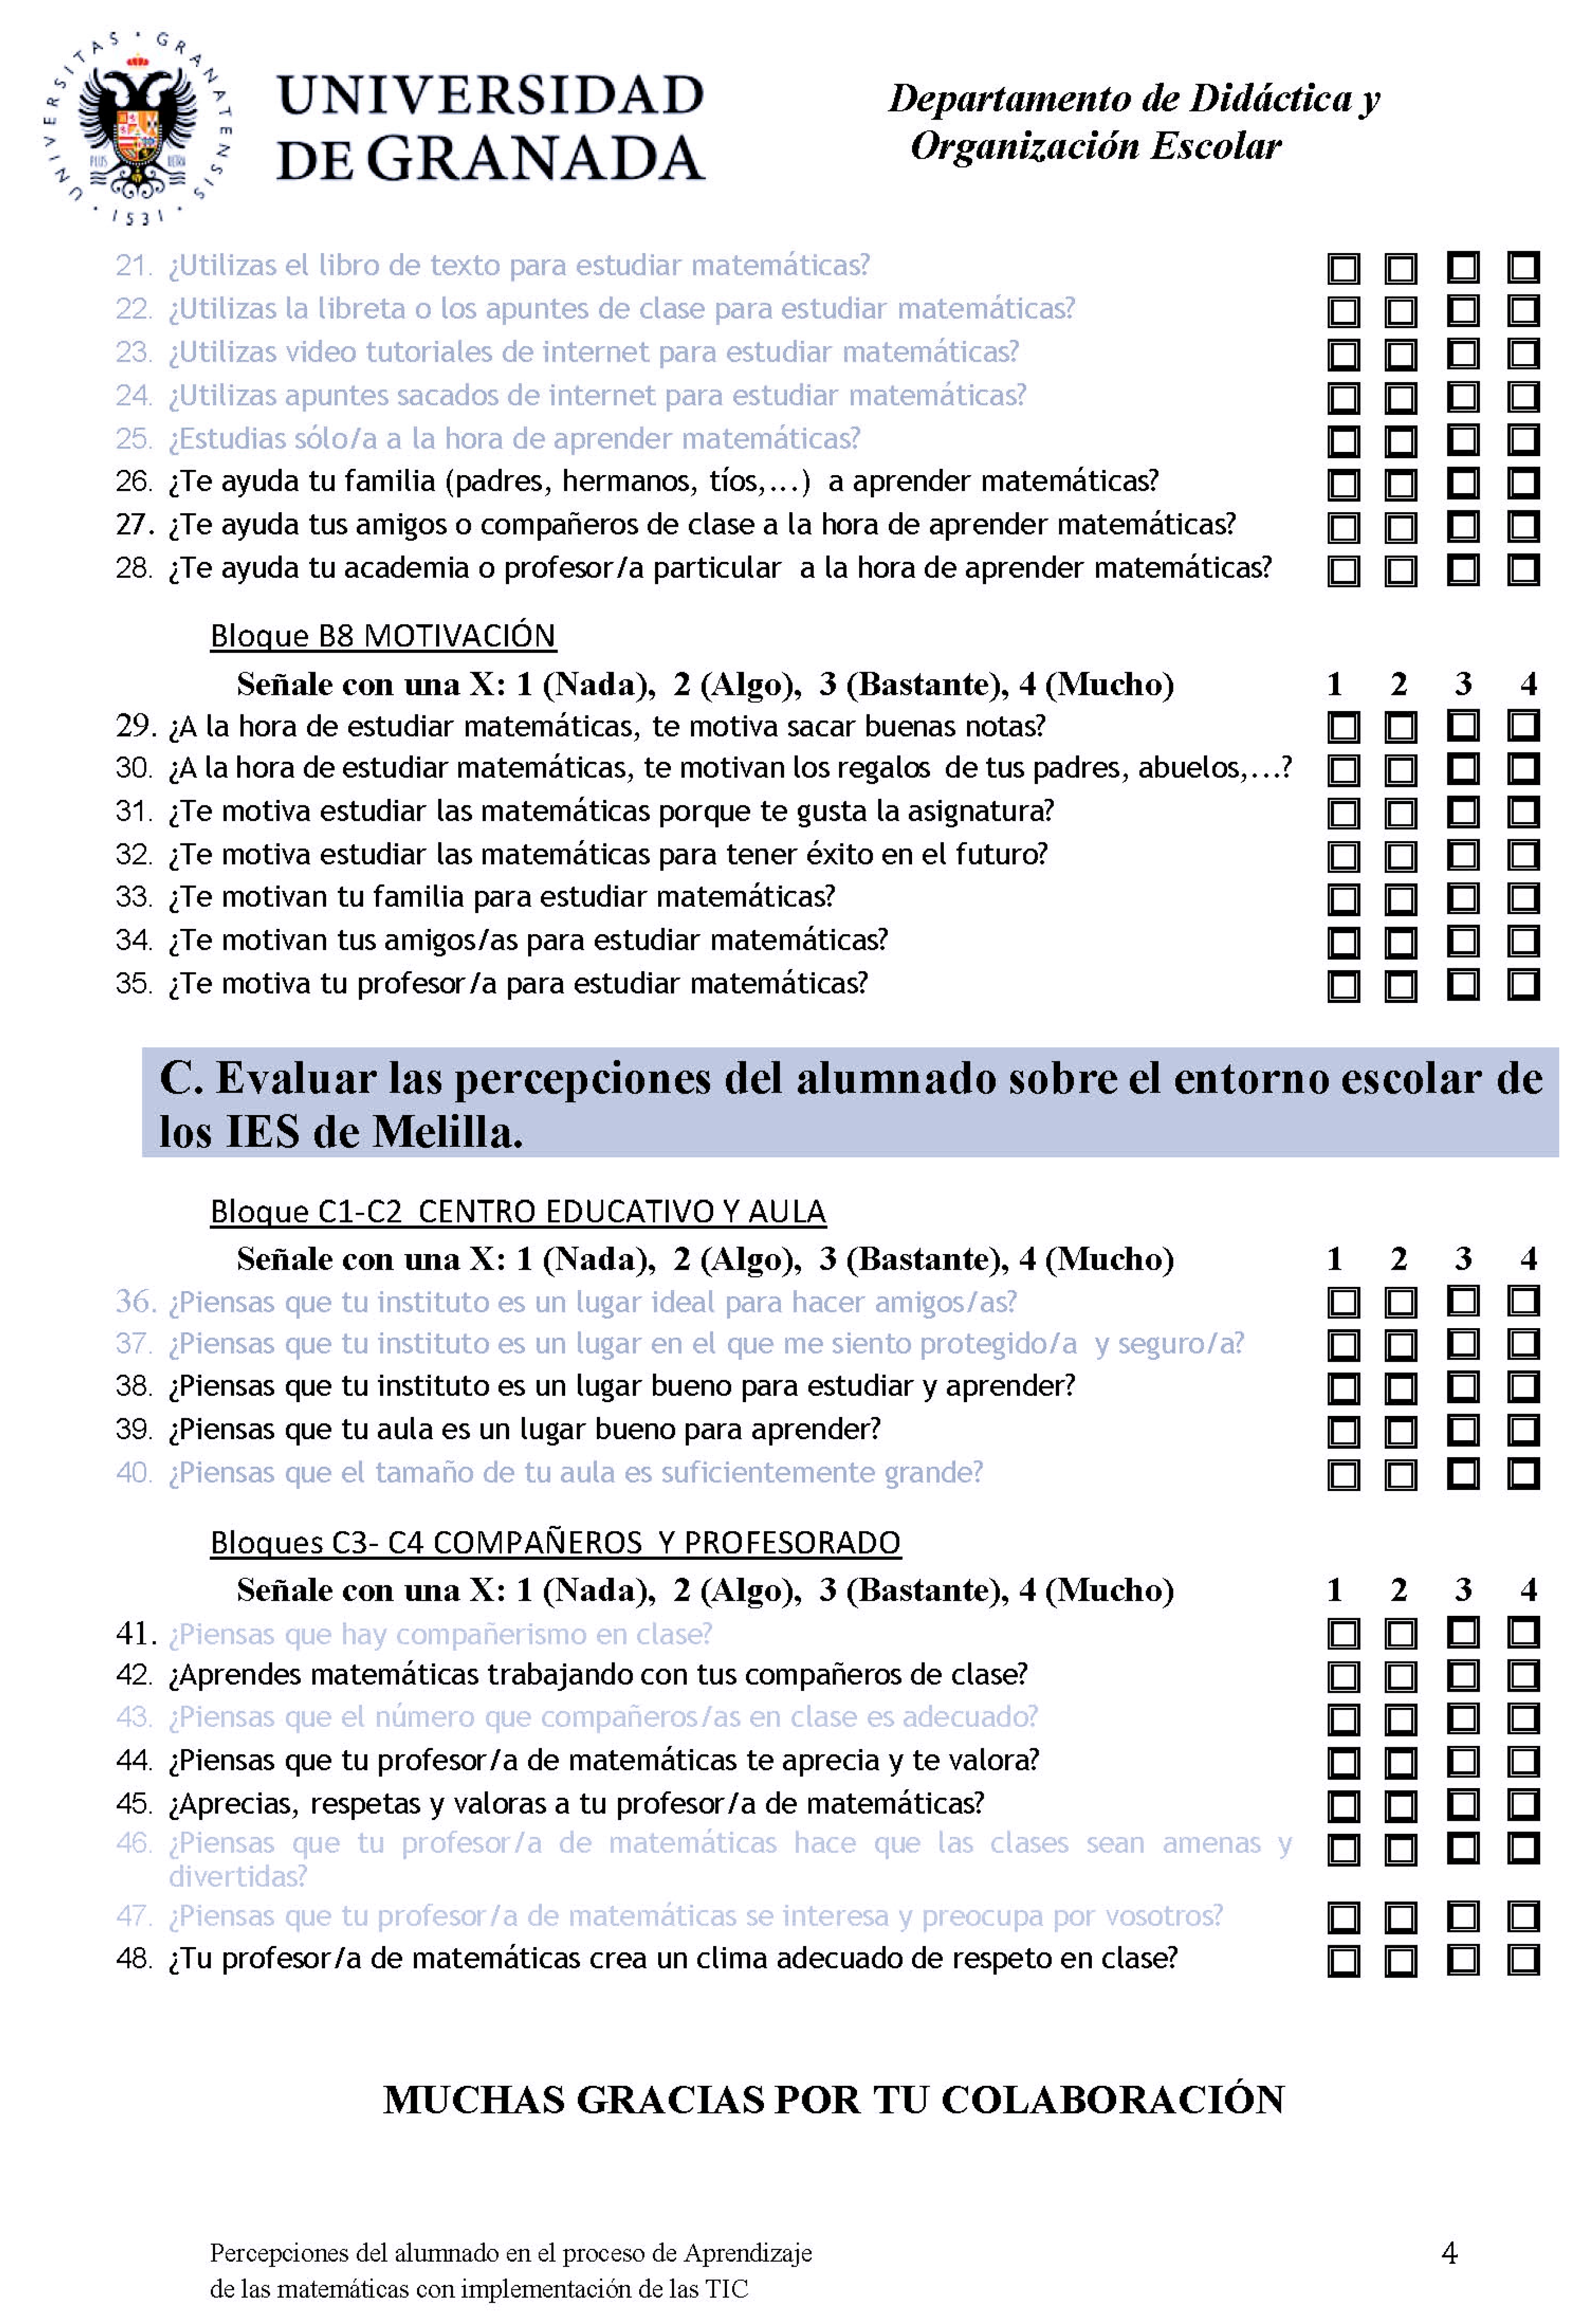
The instrument was designed ad hoc with 135 Likert-scale closed items with four graduated levels (1, none; 2, a little; 3, enough; and 4, a lot) for most items. For its creation, procedures for reviewing literature and determining dimensions were followed, which consisted of drafting of the items, expert content validation, construct validation, and reliability analysis [
48]. The questionnaire was previously validated by expert judgement (content validity), both at the drafting level and at the level of adequacy of the items. A test questionnaire was also administered to detect aspects of improvement. Subsequently, with the complete data matrix, the instrument was validated through the Kaiser–Guttman and Tucker Lewis Index criteria, with a score of 1052.
This study took the results of 14 items of the dimensions
“B. Learning Mathematics” and “C. School Environment” from the general questionnaire. To analyze students’ academic performance, the second trimester math grade was used as a variable (the questionnaire was approved in the third evaluation). This is because grades are considered to be one of the most reliable predictors for analyzing academic performance [
49]. The final version of the questionnaire used in this study is shown in
Appendix A.
Table 1 lists the different dimensions, their indicators, and the corresponding analyzed items.
2.1. Inferential Statistics
2.1.1. Global Adjustment of the Model
Prior to the adjustment of the multiple linear regression model (
Table 2), linearity was calculated, since, if two independent variables were correlated, this would have affected the model. None of the variables had a Variance Inflation Factor (VIF) greater than 10, indicating that linearity was not a problem in the data.
The results of
Table 2 indicate that the model is significant (F(14,2024) = 21.38,
p < 0.05); that is, it predicts the scores obtained by the students in the second quarter quite well. However, the model only explains 12.27% of the variability of the response (R2). In other words, 87.72% of the variation in the scores of the second quarter cannot be explained with the variables used. Therefore, there must be other variables that also influence the scores. It can also be observed that the variables which have a significant contribution among the analyzed dependent variables are TGM, CLB, PAV, and PCA. The intercept was also significant, which means that, if the score for all the independent variables is 0, the subjects will have a dependent variable score of 0.66.
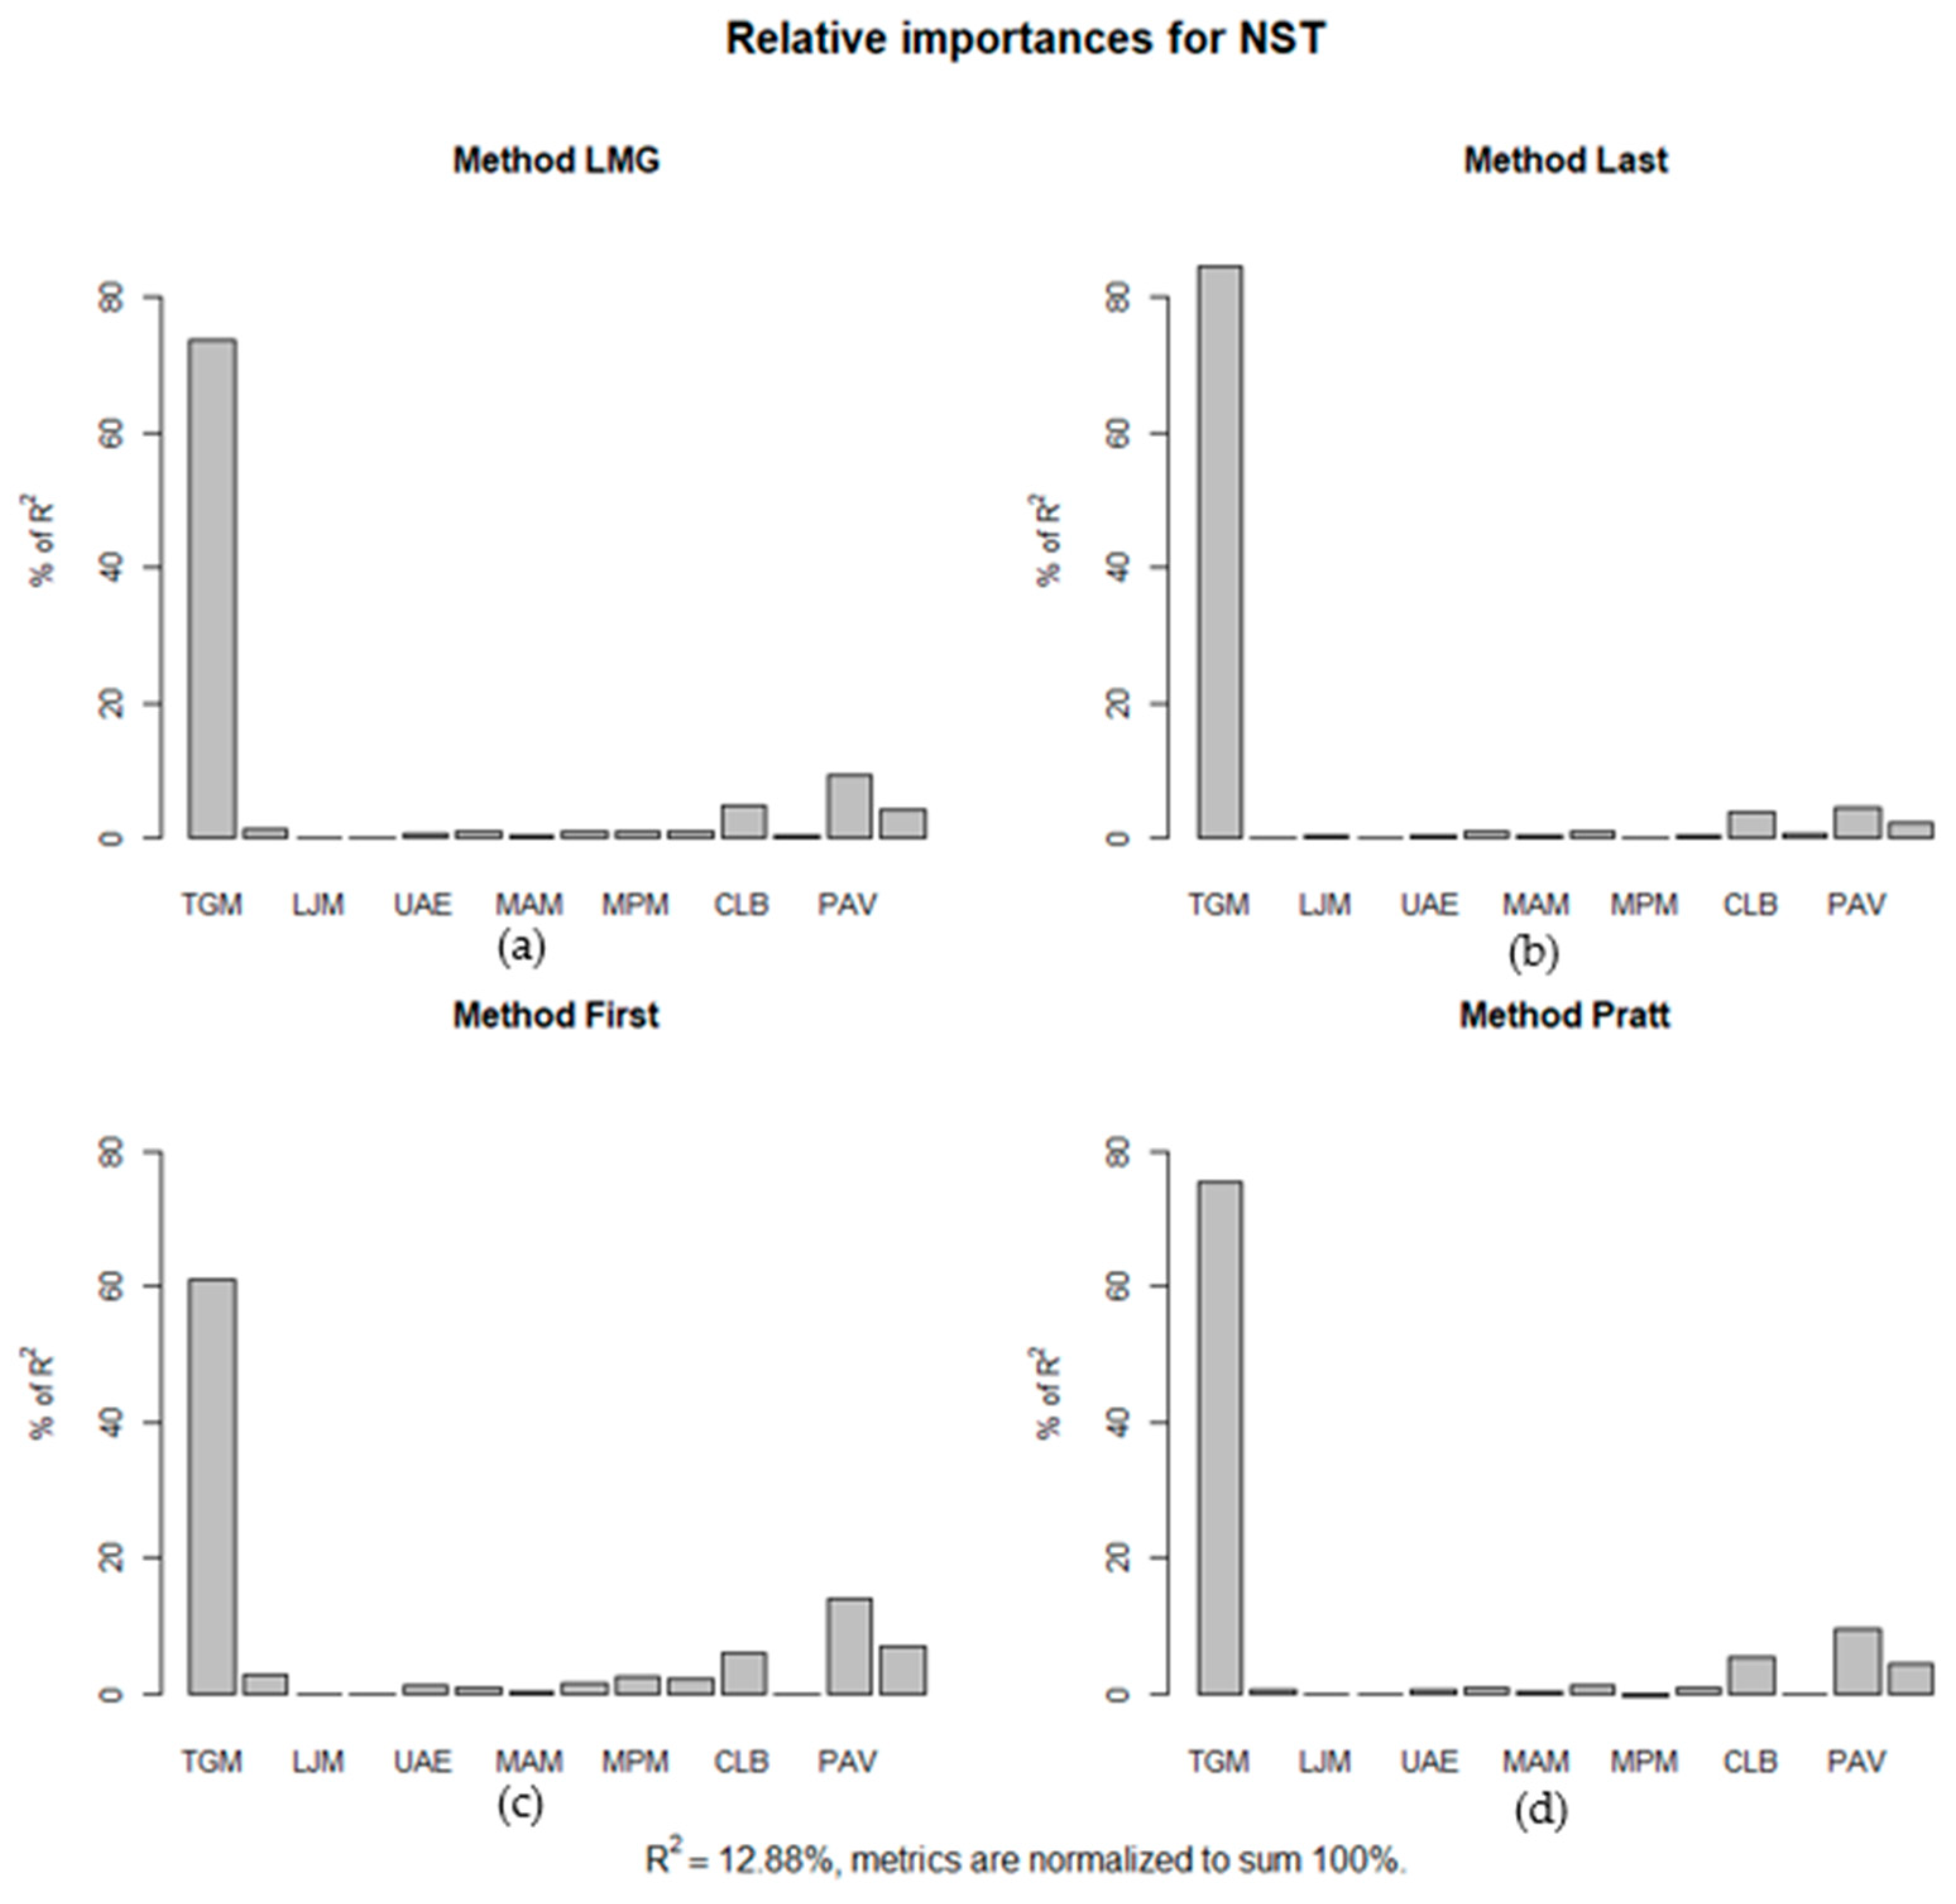
The relative importance of the predictors (
Figure 1) was then determined using the “relaimpo” package.
According to previous methods (
Figure 1), the most important variables of the study were TGM and PAV.
2.1.2. Parameters of the Model
The ANOVA tells us that the model is generally good; however, it does not indicate anything about the contribution of each variable or term in the model. In the results, the “coefficients” section can be seen, which contains the parameters of the model (the beta values) and their significance. The values of the parameters are as follows:
b0 = 8.97 × 10⁻⁷, implies that, if all the independent variables took the value 0, the participants’ scores would be 8.97 × 10⁻⁷.
b1 (TGM) = 0.33; b2 (PME) = 0.01; b3 (LJM) = 0.02; b4 (ULT) = 0.001; b5 (UAE) = 0.04; b6 (APM) = −0.04; b7 (MAM) = −0.03; b8 (MFM) = 0.05; b9 (MPM) = −0.01; b10 (ILS) = 0.02; b11 (CLB) = 0.07; b12 (TCE) = −0.03; b13 (PAV) = 0.09; and b14 (PCA) = 0.07.
Beta values (b1–b14) represent the slope of the model and the change in response associated with each unit of change in the predictor and imply the following: (1) If students’ scores increase in terms of TGM, PME, LJM, ULT, UAE, ILS, CLB, PAV, and PCA, they will increase their scores compared to their second quarter scores; and (2) participants’ scores in the second quarter increase as their scores in APM, MAM, MPM, and TCE decrease.
Based on the above and replacing the values of the regression Equation (1), the following model can be obtained:
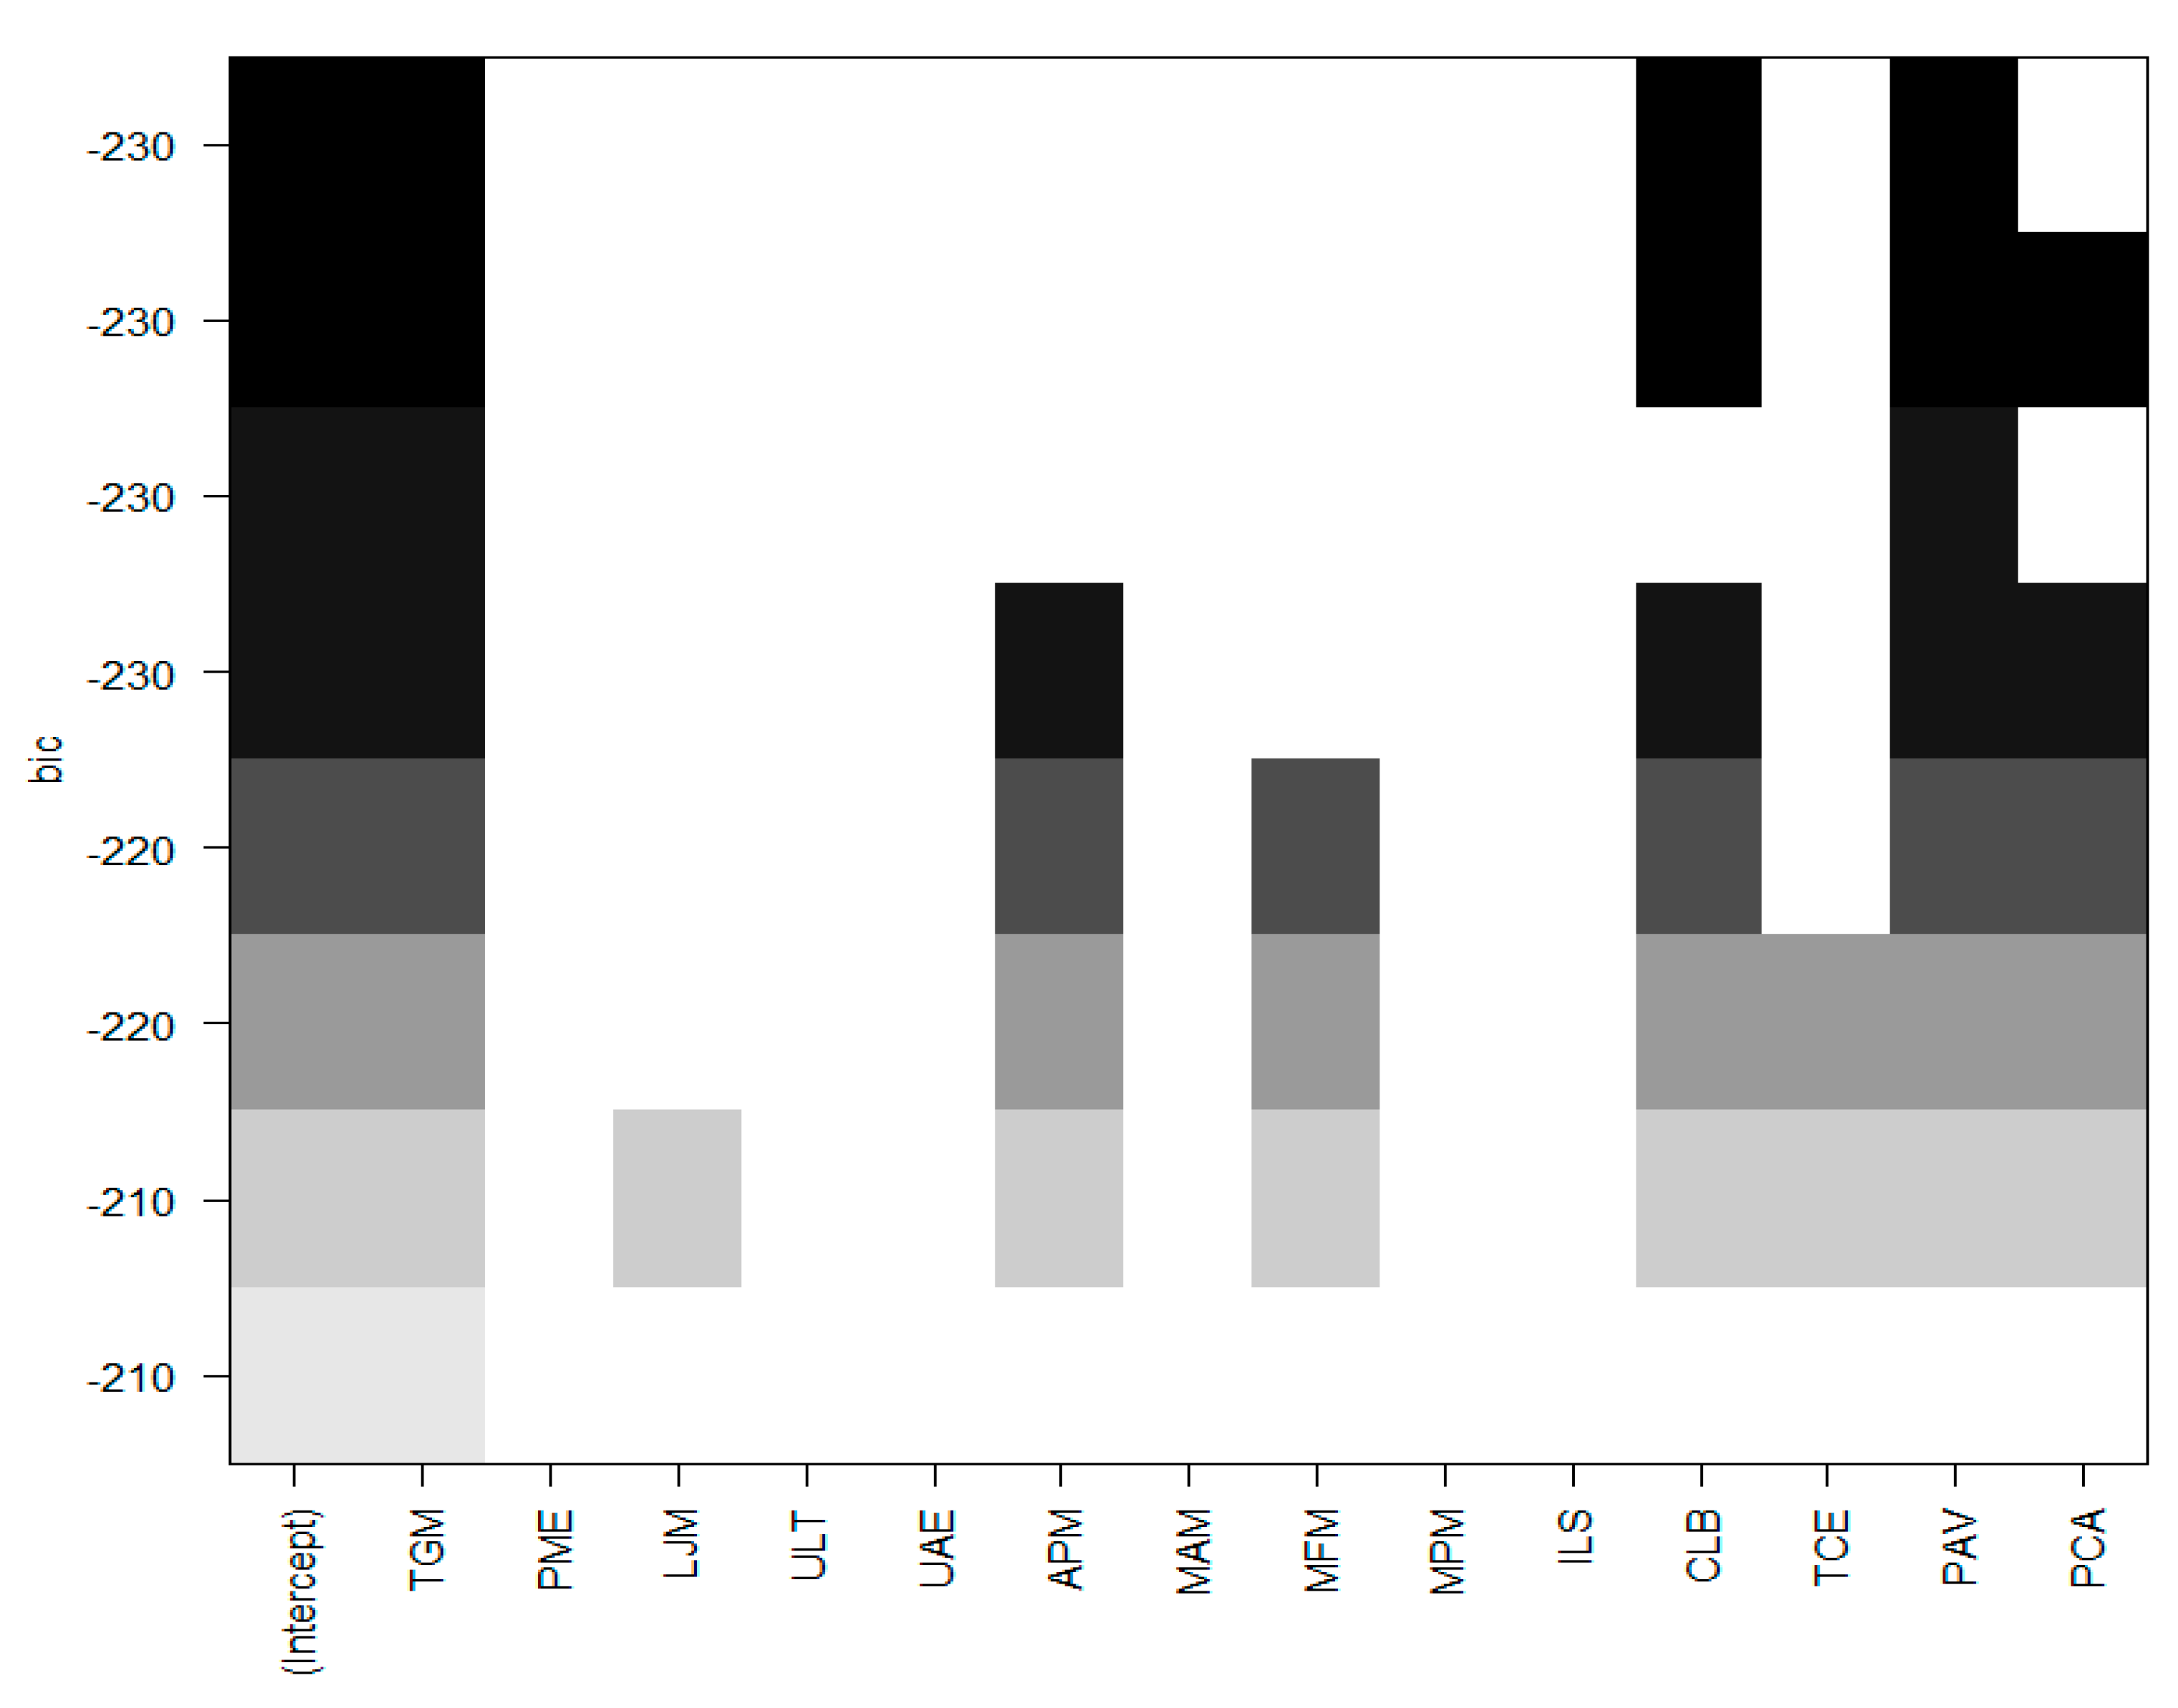
This was optimized through sequential replacements using Python (
Figure 2).
According to
Figure 2, it can be seen that the best regression model would be the one whose Bayesian information criterion (BIC), was the best. In this case, only the intercept and the TGM variable could be selected to predict the scores of the students in the second trimester.
2.1.3. Marginal Averages Predicted by the Model and Estimated with the Data
The marginal means predicted by the linear regression model were as follows: TGM = 1.5; CLB = 1.6; PAV = 1.7; and PCA = 1.8. In other words, TGM has the lowest performance. Taking into account that the mean scores in the previous variables were 1.5, 1.6, 1.7, and 1.8, it can be concluded that the configured linear regression model is good. Next, the diagnosis of the model was analyzed.
Figure 3a corresponds to the residuals vs. adjusted (predicted) values. The residuals are a part of the dependent variable (VD) not explained by the model, and an estimation of the model error term. Under the assumptions of the linear regression model, the variability of the residuals should not change in the range of the VD, and therefore, we should not observe any pattern in the residuals. Values that are outliers are indicated with a label indicating the observation number. Secondly, the normal quantile-quantile of the standardized residues figure can be observed. In the linear regression model, we assume that the errors follow a normal distribution, so we expect the figure of the residuals to follow a straight line. Deviations from this line may mean that errors do not follow a normal distribution.
Figure 3c is similar to the first figure but uses the square root of the standardized residues. As in the first case, there should be no pattern in the residues.
Figure 3d shows Cook’s distances, which is a statistic that tries to identify the points that have more influence. Generally, these are points that are distant from the rest, both in the VD and the independent variable (VI). The high values are labeled with the numbers of observations and indicate that it is necessary to study these.
As a consequence of these annotations, it was necessary to calculate the gain and lift plots by running an automatic regression model with the H2o package. Gain Lift is an application that selects the best model among more than 100 algorithms to classify the different subjects and predict the quantitative increase.
The steps followed were, first, to select the target variable Second Quarter Notes (NST) representative of academic performance. The NST was binary, since it is not possible to develop a gain plot and lift plot if the dependent variable does not take only two values; if the subject had passed, it was assigned the value of 1, and otherwise, the value 0 was assigned. Then, the value matrix was fragmented into two; 85% of the data were taken for the training matrix and 15% for the testing matrix.
Before constructing the gain and lift plot, the following steps were followed in cascade; the H2o algorithm in R was used, keeping the same previous matrices, but in this case, the testing matrix was split into two, one for testing and the other for validation. The main objective was to determine the accuracy of the algorithm and the area under the curve. In the first case, the accuracy of the algorithm was 73.3% and the area under the curve was 56%, which means that more than 50% of the cases would be correctly predicted through the automatic algorithm used. Of all the selected algorithms, H2o indicated that the model that best fit the study data was the “XGBoost” for the total sample. In contrast, the predictive model was different in the gender-differentiated analysis, with the automatic algorithm “Gradient Boosting Machine” being the most optimal among those used for the subsample formed by the girls, and “Stacked Ensembles” for the subsample formed by the boys.
3. Results
The results show that the items of the study correlated differently with the NST variable (second quarter grades). There were insignificant positive correlations between academic performance and PME (Does your math teacher explain well in class?), LJM (From Monday to Thursday, how many hours do you dedicate to the study of mathematics?), ULT (Do you use the textbook to study mathematics?), UAE (Do you use the notebook or class notes to study math?), and ILS (Do you think your school is a place where you feel protected and safe?)
The variables that correlated significantly with NST were TGM (Do you like mathematics?), CLB (Do you think your classroom is a good place to learn?), PAV (Do you think your math teacher appreciates and values you?), and PCA (Does your mathematics teacher create an appropriate climate of respect in the classroom?). The regression Equation (1) answers the first research question (PI1: Could actions be taken to improve the results?) and shows that the variable that best explains the NST scores is TGM (Do you like mathematics?). However, the model only explains 12% of the variability of the answer.
(“Second quarter grades” = 0.66 + 0.33 * Do you like mathematics? + 0.07 * Do you think your classroom is a good place to learn? + 0.09 * Do you think your mathematics teacher appreciates and values you? + 0.07 * Does your mathematics teacher create an appropriate climate of respect in classroom?)
On the other hand, there is a small negative correlation between academic performance and APM (Does your academy or tutor help you to learn mathematics?), MAM (Do your friends motivate you to study mathematics?), MPM (Does your teacher motivate you to study mathematics?), and TCE (Do you learn math by working with your classmates?). In other words, academic performance in mathematics correlates negatively with external motivation and support.
To answer the research question PI2 (How could it be evaluated?), a statistical tool called Gain Lift was implemented, which is also used in business studies, but is innovative in educational research and appropriate for answering the research questions posed and facilitating the achievement of the objectives of this study. This instrument predicts, in a quantitative way, the maximum gain of the grades obtained in the second quarter, taking into account the variables of the study involved. To do this, it selects the optimal model from more than 100 algorithms to classify the different subjects and predict the quantitative increase.
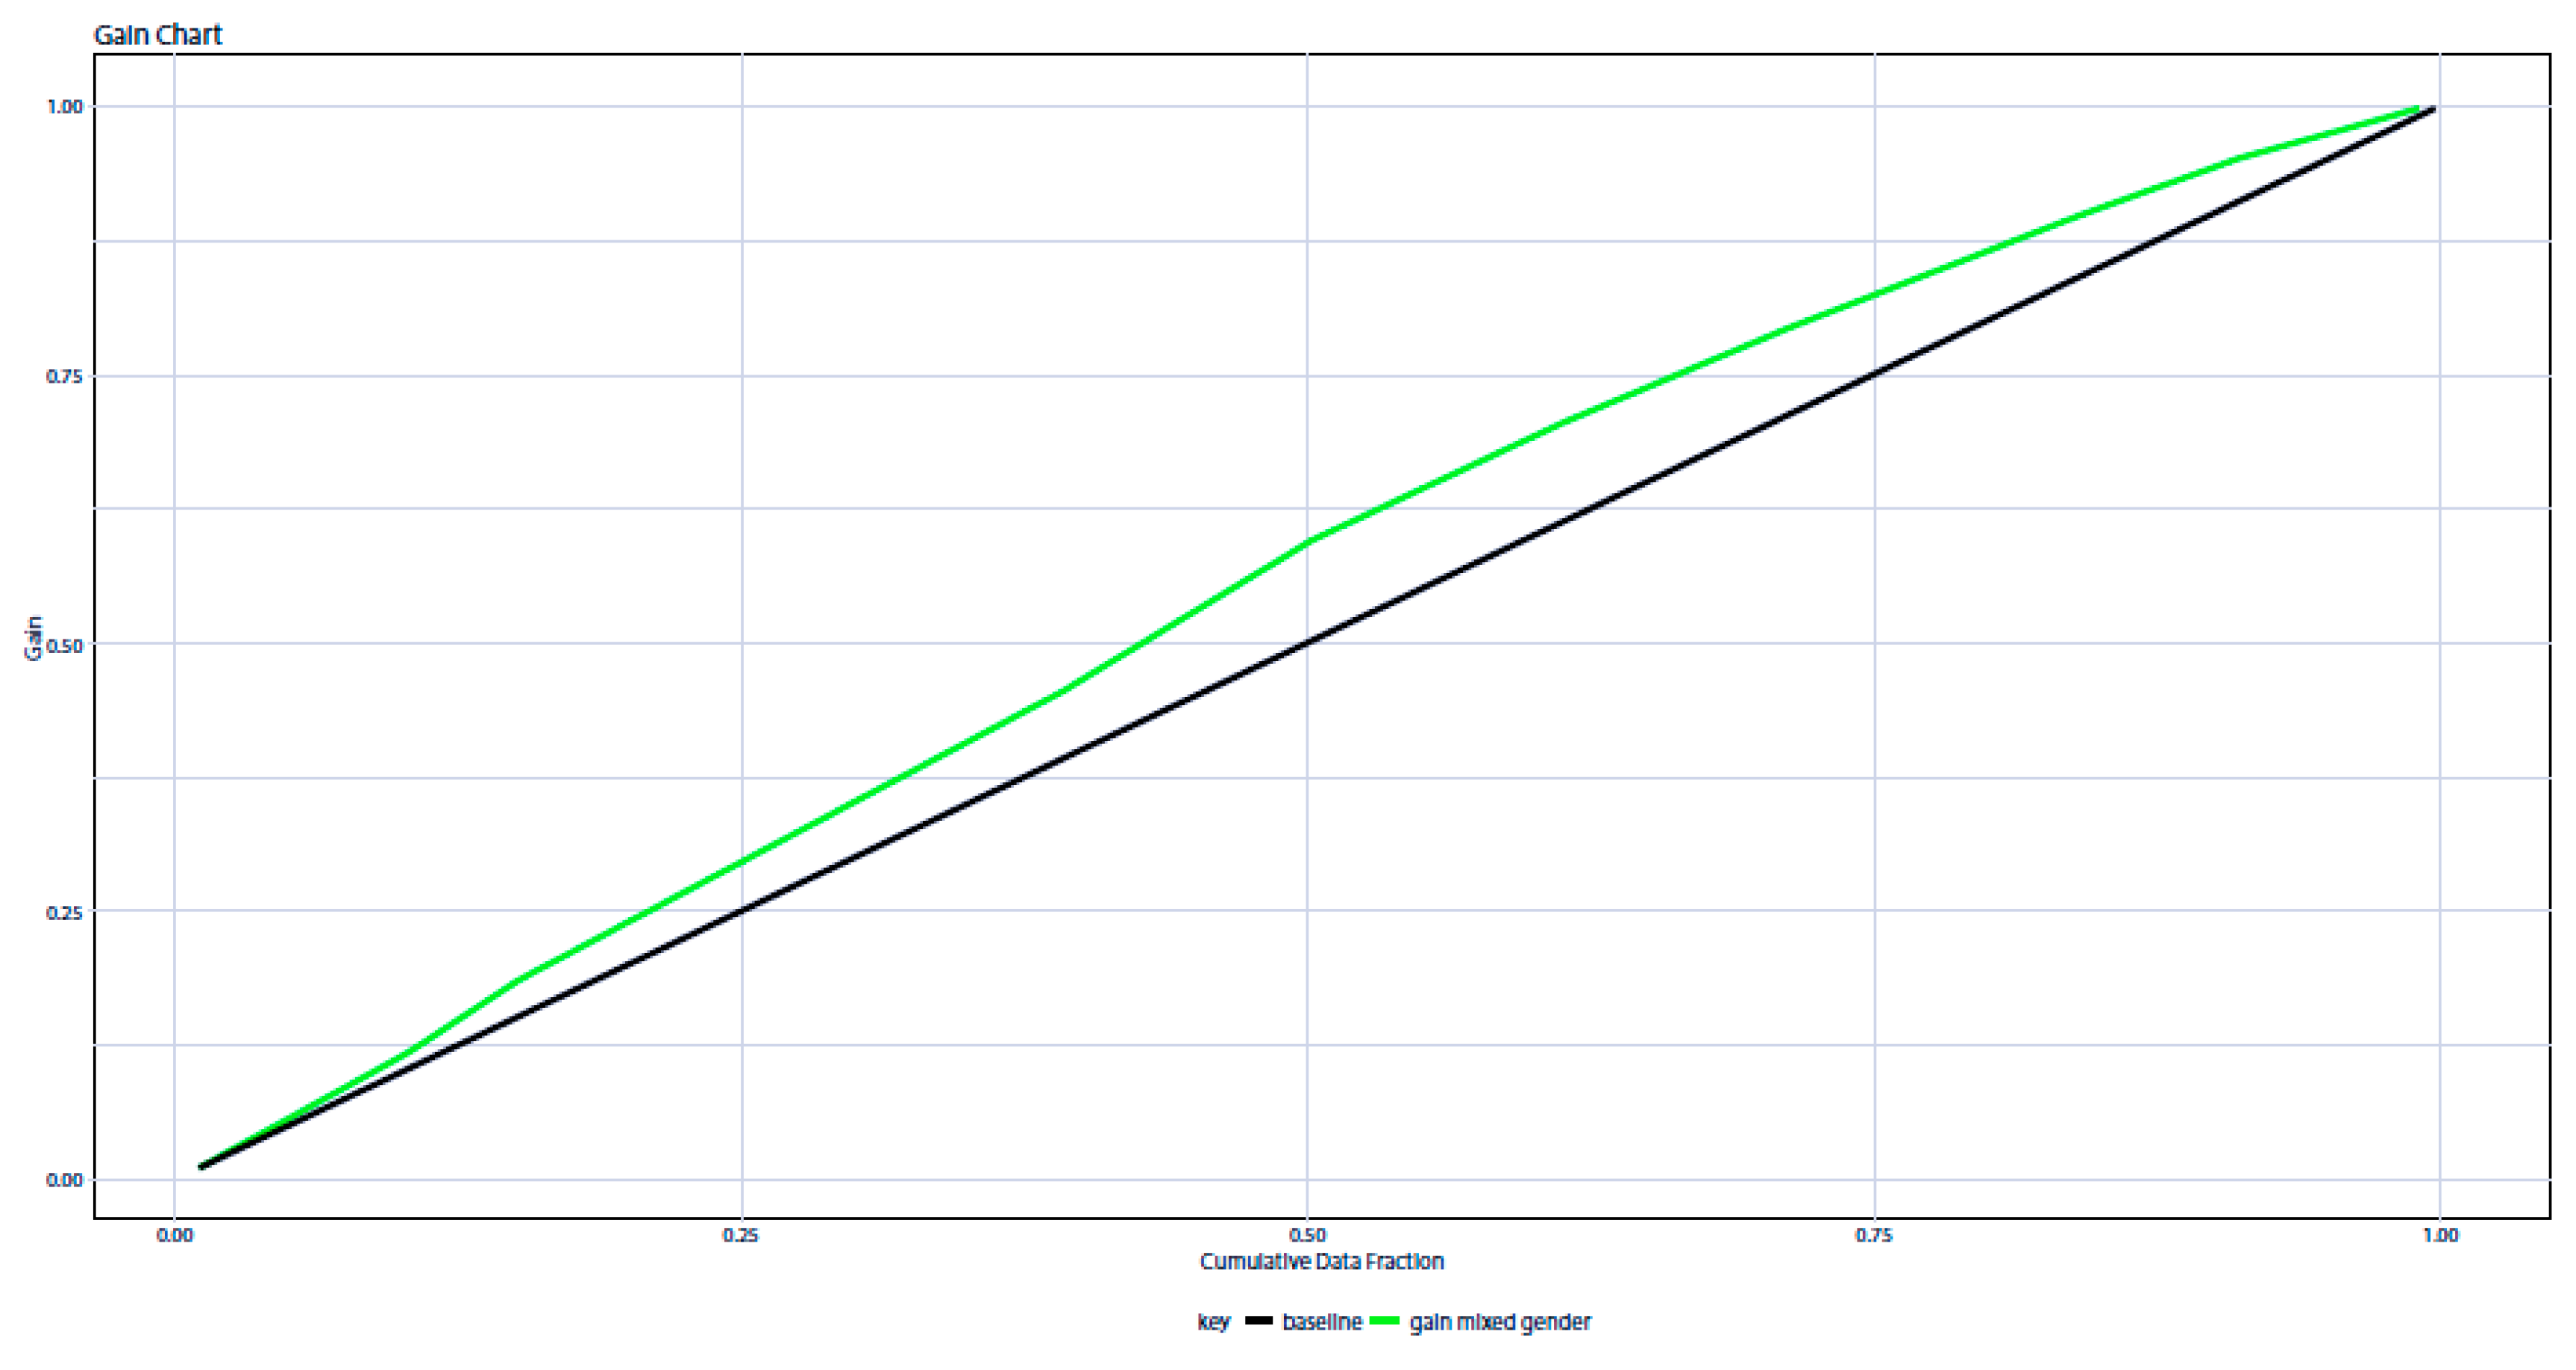
The results of
Figure 4 show that if “n” students are randomly selected, the “XGBoost” algorithm predicts that 25% of the subsample would improve their second quarter grades by 18% at most. The same result would be obtained if 50% of the students of a subsample “n” were randomly selected. In contrast, for 75% of the subsample, the model predicts a maximum gain in second quarter grades of 10%. To achieve these gains, appropriate interventions in the school setting are recommended. This affirmation is based on the fact that the analysis of correlations of the present study shows that the variables that had a significant impact on the second trimester’s grades corresponded to the dimension “School Environment” and the predictors with a greater weight were a positive perception towards the subject TGM and towards the teacher PAV.
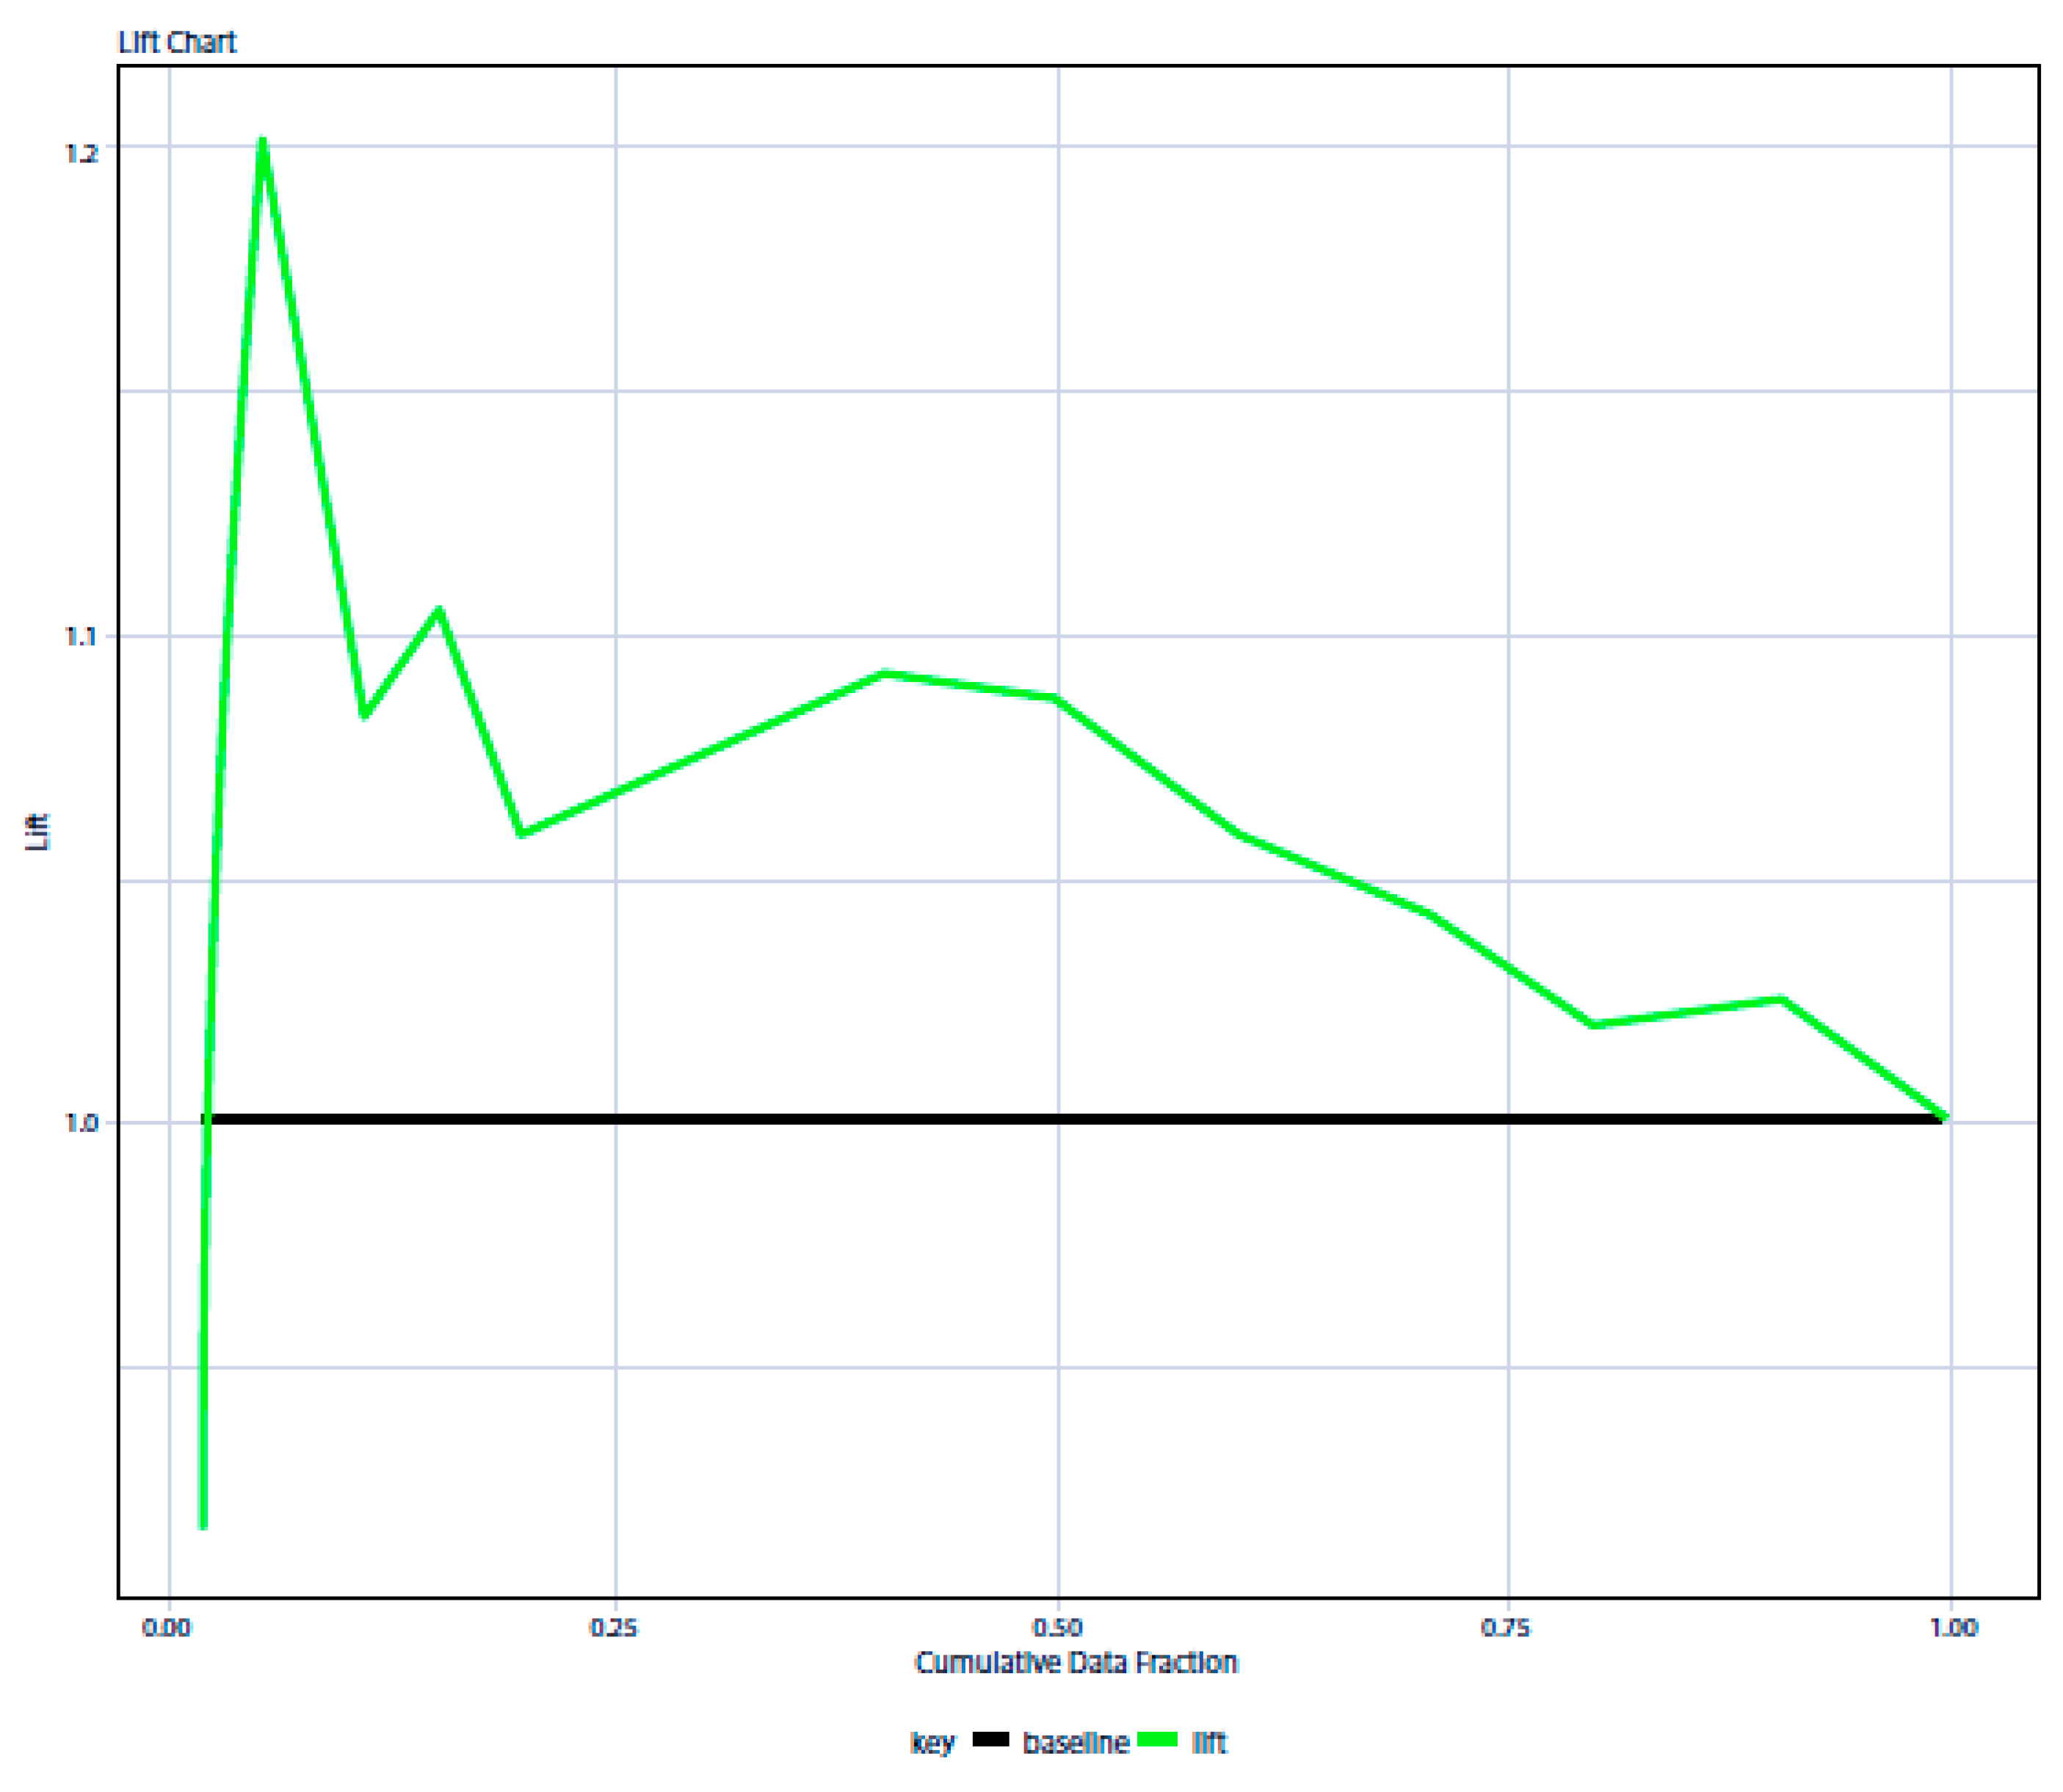
The lift chart allows this gain to be quantified in a complementary way. More specifically, the lift chart results show that if “n” students were randomly selected, 50% of the sub-sample would improve their second quarter scores by 0.4 points if appropriate interventions were carried out in the school environment.
In
Figure 4 and
Figure 5, it can be seen that if appropriate interventions are used in the school environment, contemplated in the study variables, students can improve their performance (their grades in the second quarter). Metrically, if the scores with respect to the dimensions analyzed (Do you like mathematics? Do you think your classroom is a good place to learn? Do you think your mathematics teacher appreciates and values you? Does your math teacher create an appropriate climate of respect in classroom?) were optimal, the scores measured in the second quarter would have increased by 0.4 points.
The overall results show a small gain in students’ academic achievement in mathematics, if appropriate interventions are applied in the school environment. The following questions arise from the results: Would similar results be expected among girls and boys? Which gender would have the greatest gain? These are encompassed in the research question IP4: Are there gender differences? To answer all of these questions, the gender-differentiated results in
Figure 6,
Figure 7 and
Figure 8 were analyzed.
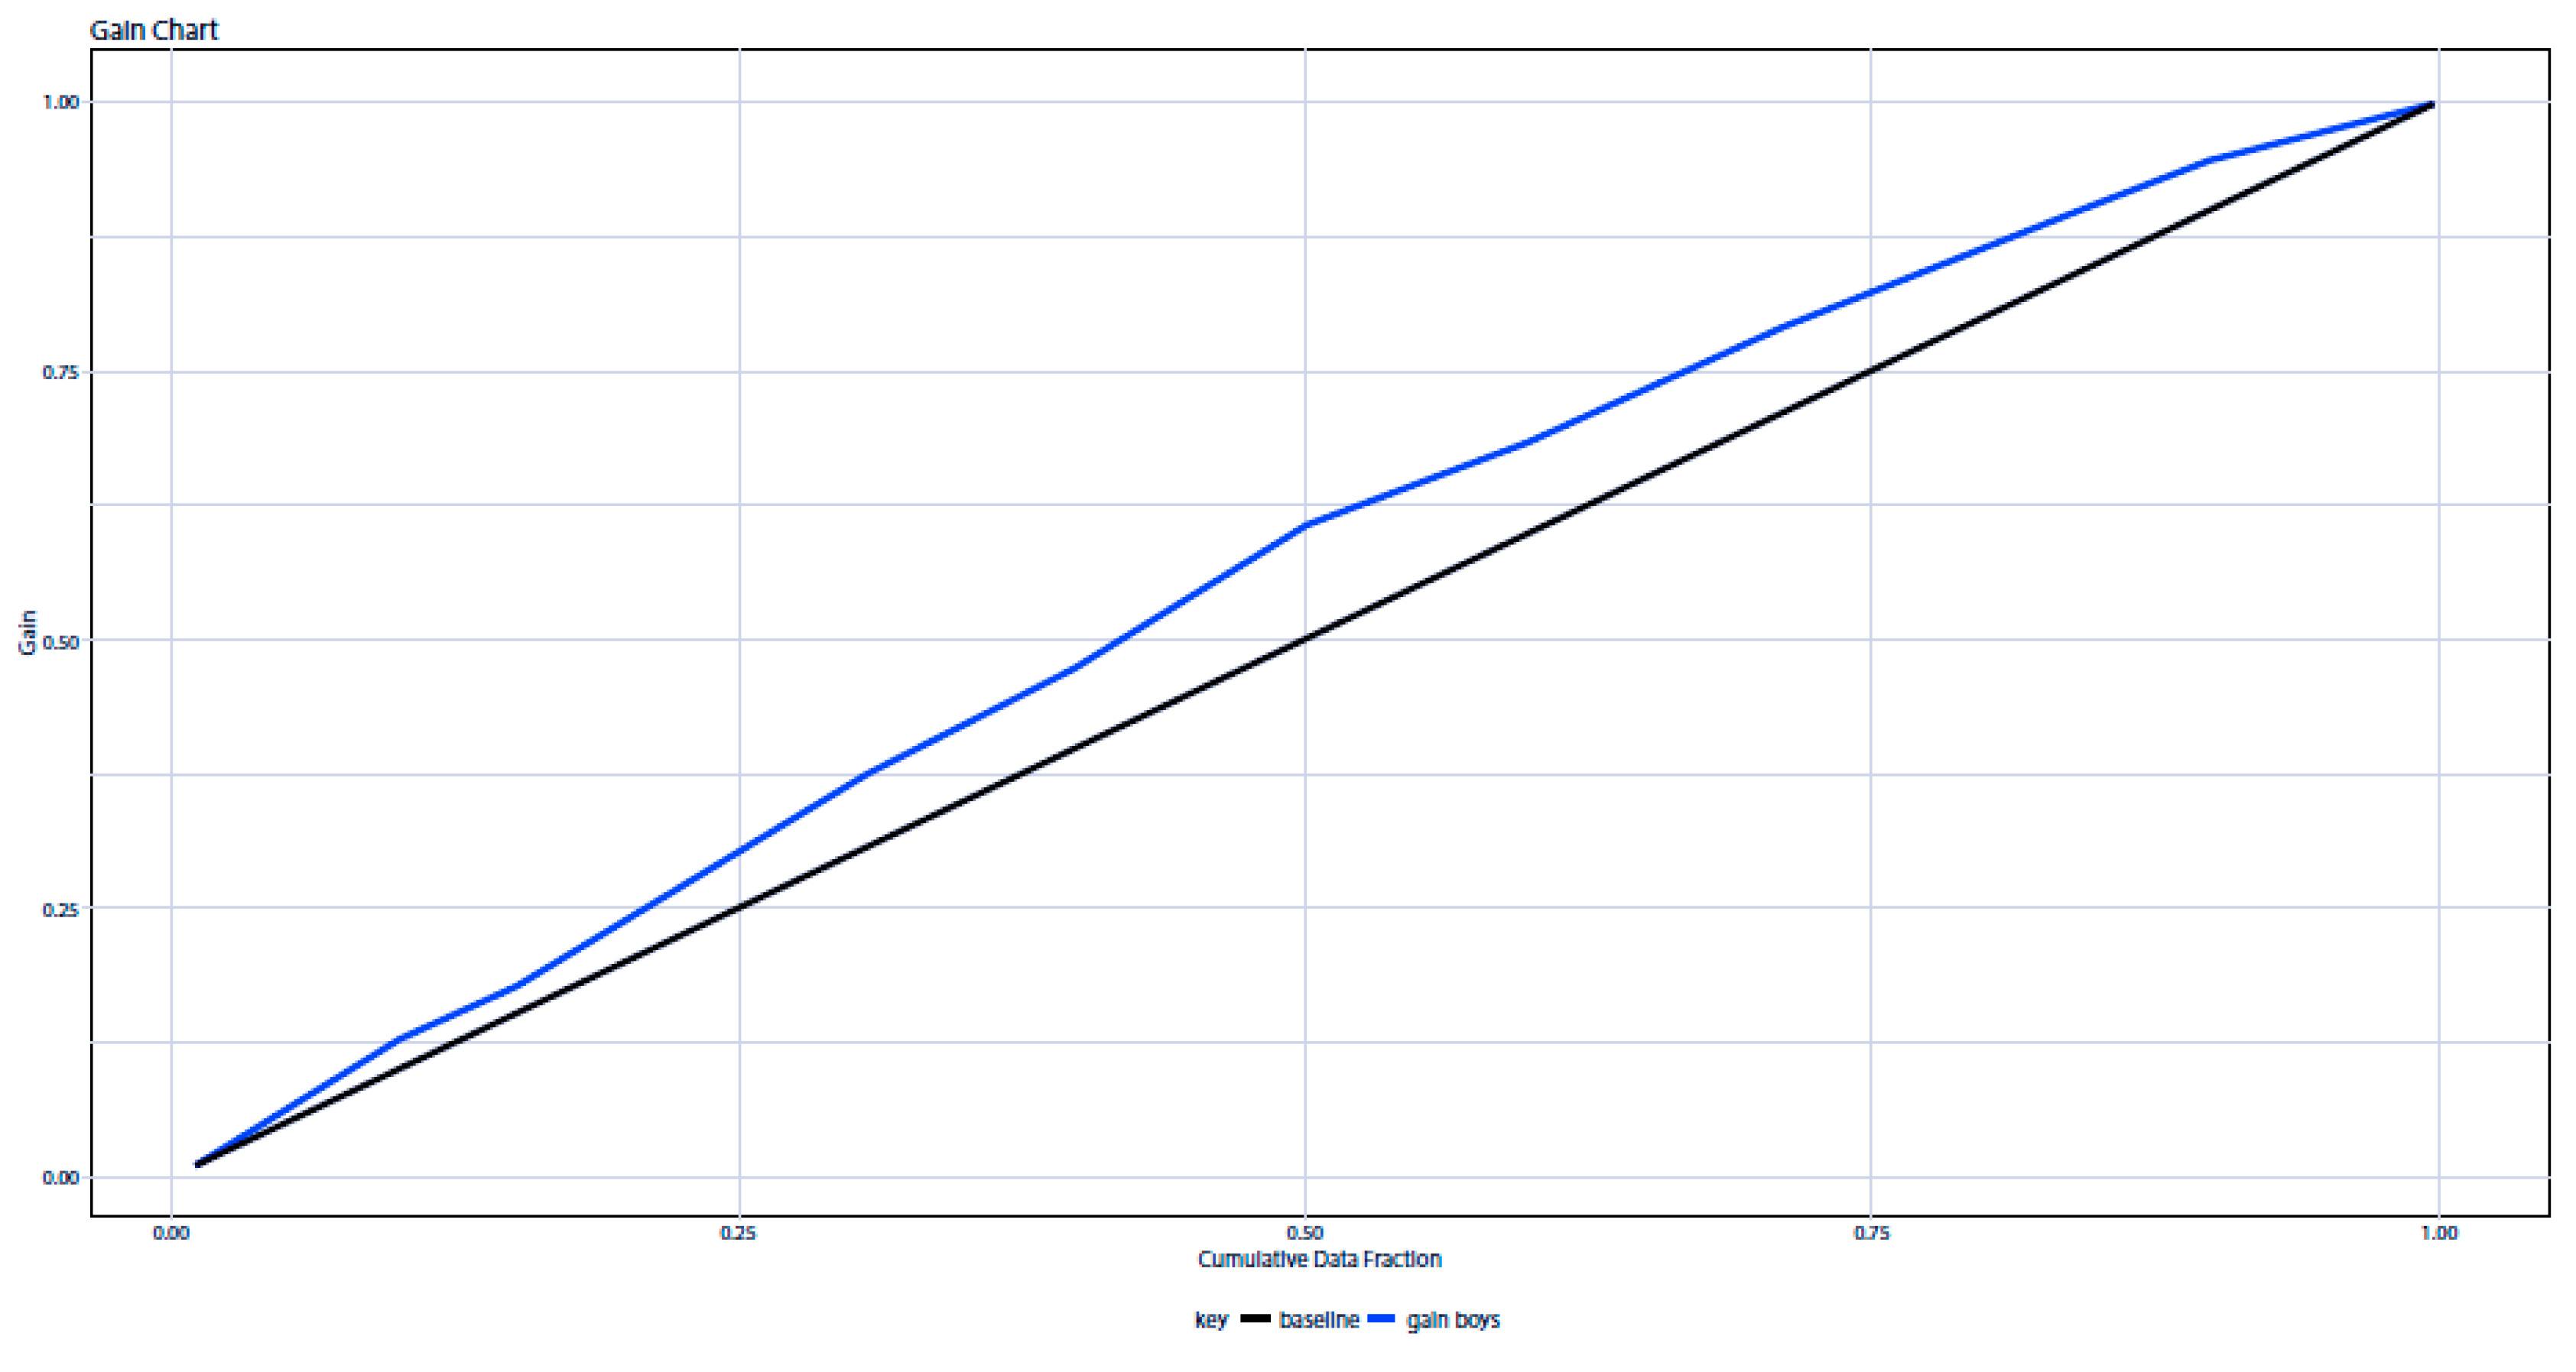
The results of the gain chart for the subsample of boys show similar results to those obtained in the global mixed figure analyzed above. It can be observed that if a subsample of “n” students is randomly selected, the “Stacked Ensembles” algorithm predicts that 25% of the subsample would have a maximum gain of 22% in their scores in the second quarter, if appropriate interventions were carried out in the school environment. The same result would be obtained if 50% of the students were randomly selected. For this percentage, the maximum gain would be obtained. On the other hand, the maximum gain would be 10% for 75% of the selected sub-sample (in this case, the gain is reduced by 54%, according to the other cases).
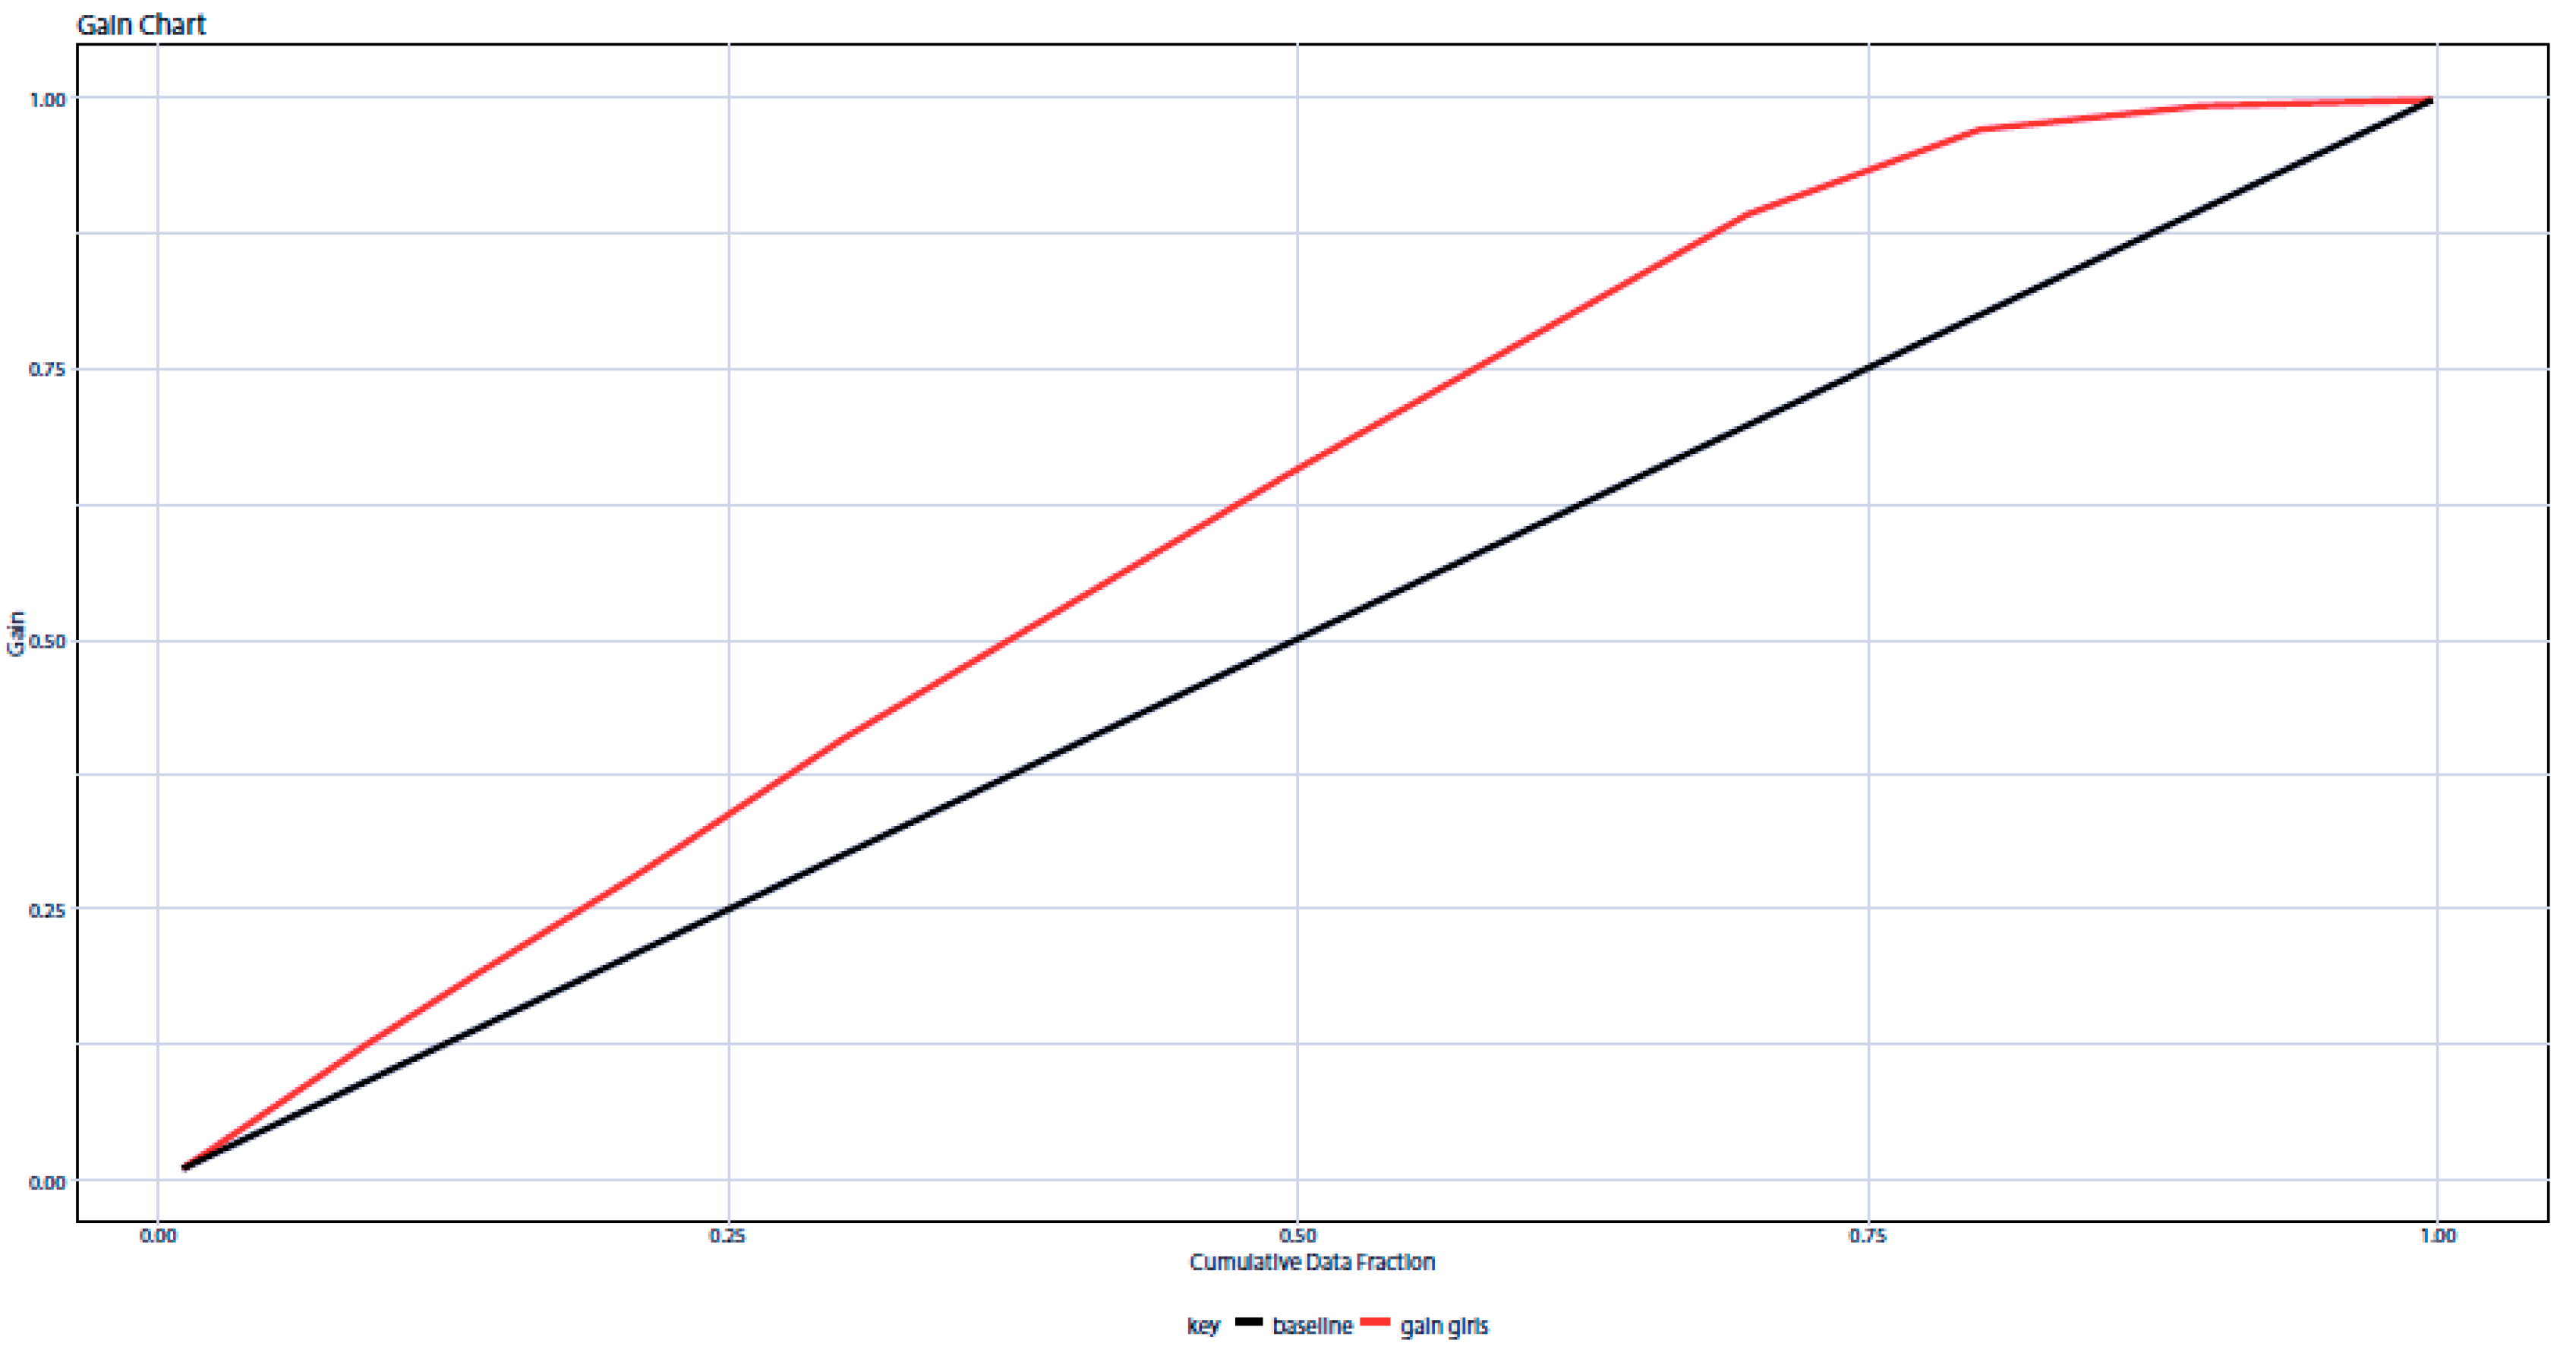
The gain chart results for girls indicate that if a subsample of “n” students is randomly selected, the “Gradient Boosting Machine” algorithm predicts that 25% would have a maximum gain of 36%, achieving the optimal gain in their second quarter grades if appropriate interventions were carried out in the school setting. The percentages would decrease if we randomly selected 50% of the students whose maximum gain would be 33% and 25% if we selected 75% of the sample (in this scenario, the gain is reduced by 30% from the maximum gain).
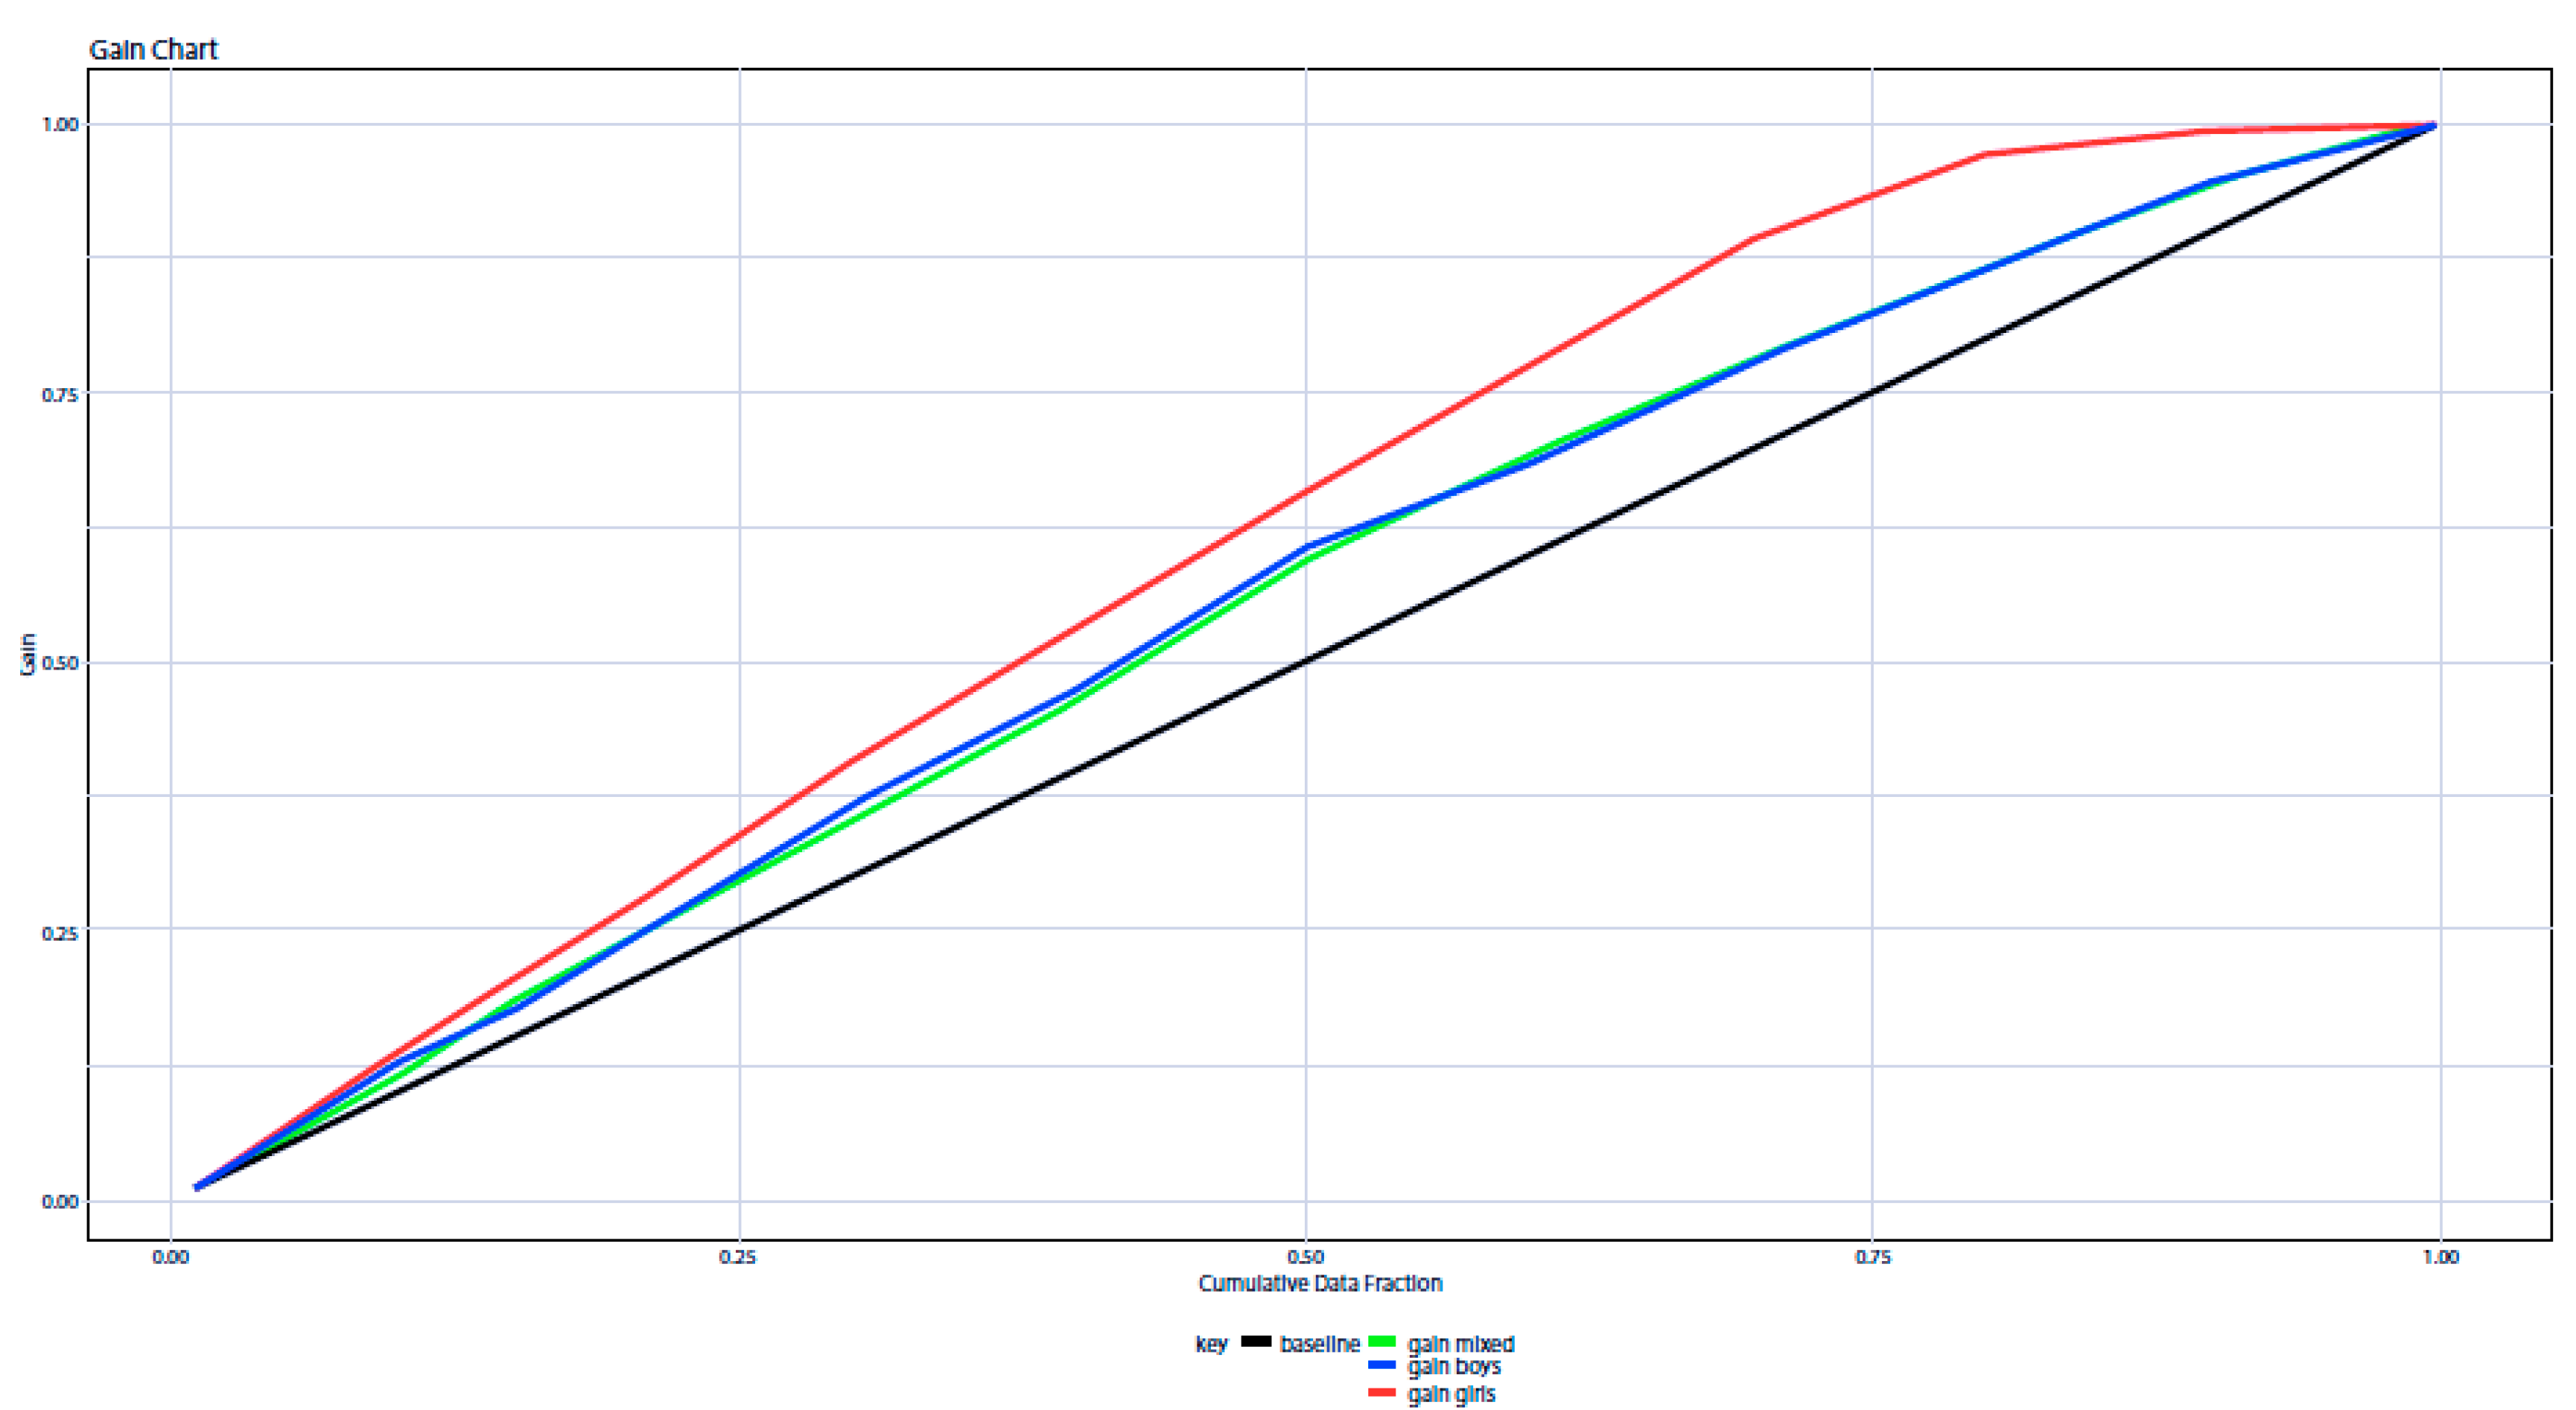
A comparative gender analysis (
Figure 7) showed similar results for the total sample and for the subsample formed by the boys. The explanation for this lies in the nature of the gain model. It selects, from 100 predictive algorithms, the one that best fits the study sample. For the total sample, the optimal algorithm used was “XGBoost”. For the subsample of girls, the optimal algorithm was “Gradient Boosting Machine”, and for the subsample of boys, the optimal algorithm was “Stacked Ensembles”.
It can be seen from
Figure 7 that if a subsample “n” was randomly selected, 25% of both boys and girls would achieve the maximum gain.
Figure 7 shows a difference in favor of girls over boys of 14 percentage points.
The percentages would decrease for both genders if a random subsample of 50% was selected. In that case, girls would achieve a gain of about 33% and boys would maintain the maximum gain of 22%. In this case, the difference between the two genders is 11 percentage points.
In 75% of the subsample, it could be observed that the gain for girls was still high, at around 25%. In contrast, the gain for boys was considerably reduced to 10%. The difference between the two amounts to 15 percentage points, resulting in the highest percentage difference between girls and boys. On the other hand, in this assumption, both genders reach the highest percentage decrease with respect to their own maximum gains. In the case of boys, this is 55% and in the case of girls, it is approximately 31%.
4. Discussion
In this study, it was observed that there are specific actions that have a quantifiable impact on the academic performance of students. Some factors of the dimension “Mathematics Learning” have been analyzed, such as indicators of affinity, teaching, study time, didactic resources employed, study aids, and motivation. As for the dimension “School Environment”, we have collected items from the indicators educational center, classroom, partners, and relationship with teachers.
In the results of the present study, it could be observed that the variables that had a significant influence on the ratings obtained in the second quarter (NST) were TGM, PAV, CLB, and PCA. Among these, the ones with less weight were the perceptions of the climate in the classroom (CLB) and the teacher’s dynamizing role in the classroom (PCA). According to previous methods, the variables of the study that had a more significant impact on the academic performance were positive perceptions of the learning of mathematics (TGM) and the mathematics teaching figure (PAV). The regression Equation (1) allows the weight of each item in the NST variable to be quantified.
This shows that the variable that best explains the scores obtained in NST is TGM and its weight is four times the average of the other variables in the equation. Therefore, a positive perception of the subject is the predictor with the greatest impact on the scores of students in mathematics. The rest of the variables have a similar weight in the equation, of less than 10%.
The scientific literature postulates that the teacher–student relationship significantly influences interest in the subject [
50], conditions the academic trajectory of the students [
36,
37], and affects the academic performance of the students [
33,
34]. This relationship depends on the students’ perception of the subject taught by the teacher and the difficulty perceived by the teacher [
35]. In addition, the influence of the teacher can reduce the differences in opportunities perceived by students at risk of social exclusion [
39].
The effect of the classroom on academic performance is also reflected in the regression Equation (1). Additionally, previous findings have established that the climate and interactions in the classroom between students and teachers condition the teaching–learning process [
25,
26]. Therefore, several authors consider the creation and validation of a scale to be necessary for evaluating the climate in the classroom [
30], because of its influence on the academic performance of students [
31]. These instruments would help evaluate the climate in classrooms and the influence of disruptive students, who are exposed to early school failure [
32]. This assessment is required to articulate interventions for improvement [
27].
Another remarkable aspect of the regression Equation (1) is the combination of items. It is also possible to appreciate a direct relationship between a positive perception towards the subject, the climate in the classroom, and the figure of the teacher. Therefore, the teacher, as a moderating agent of the climate in the classroom, can significantly influence students and encourage a positive perception of mathematics that will result in an improvement in academic results.
Several authors have highlighted the ability of teachers to motivate students through effective intervention strategies [
45]. To do this, teachers must promote good bilateral communication with students to improve their mathematical competence [
18,
40,
41] and stimulate their motivation via a methodological and curricular proposal that is attractive and participatory for students [
46].
On the other hand, there are positive but weak correlations between academic performance and PME (Does your math teacher explain well in class?), LJM (From Monday to Thursday, how many hours do you dedicate to the study of mathematics?), ULT (Do you use the textbook to study mathematics?), UAE (Do you use the notebook or class notes to study mathematics?), and ILS (Do you think your school is a place where you feel protected and safe?). In other words, performance correlates positively with students’ perceptions of the teacher and the educational environment.
These results can be explained by the erroneous perception that students have of mathematics as a subject that is practiced, but not studied. In addition, the fear of making mistakes discourages and limits student participation in class and their learning of mathematics [
10]. Limited learning of mathematics conditions interest in STEM [
13].
On the other hand, there are negative correlations between academic performance and APM (Does your academy or tutor help you to learn mathematics?), MAM (Do your friends motivate you to study mathematics?), MPM (Does your teacher motivate you to study mathematics?), and TCE (Do you learn mathematics by studying with your classmates?). In other words, academic performance in mathematics correlates negatively with external motivation and support.
In relation to the findings of the present study, it is observed that external motivations not sustained over time generate initial expectations that are not very effective in terms of academic performance [
51]. In contrast, the role of internal motivation has a significant impact on students [
19]. In this sense, several authors maintain that the internal motivation of mathematics students modifies their perception of the subject and affects their academic performance [
6]. To this end, the use of appropriate teaching strategies is recommended to awaken the students´ interest and participation in STEM [
52]. These actions would help to reduce the high rate of early school dropouts in the Autonomous City of Melilla [
47].
On the other hand, the Gain Lift algorithm has been used to determine the maximum gain in mathematical performance. To quantify this, the joint effect of the variables set out in
Table 1 was analyzed. The results indicate that if appropriate interventions are employed in the school setting, a greater gain can be obtained. The figures show that the gain decreases from 50% of the chosen random subsample. It was also observed that the performance gain among girls is significantly greater than that among boys for any subsample taken. Similar findings postulate that girls possess a greater capacity to manage and order mathematical knowledge [
17]. In contrast, several authors argue that this competition decreases significantly during adolescence, affected in part by gender stereotypes [
13]. As a result, the number of female students pursuing higher education in STEM is significantly lower than that of males [
13,
53].
Although the linear regression model used is significant, the results indicate that 87.72% of the variation in the second quarter grades cannot be explained by the variables used in this study. In this sense, the mean scores of the gain in the mathematics grades amount to 0.4 points. This is consistent with the results of Timmermans (2018), which state that, although some teachers have substantial effects on students, the overall effects for most students are insignificant. Therefore, there must be other variables that have a significant influence, such as the socioeconomic status, family [
2,
54,
55], or the possible negative [
56,
57] and positive [
58] effects of technologies, on the academic performance of mathematics students.
The main strength of this study, on the other hand, is the use of Gain Lift to predict the maximum gain in mathematics scores if effective interventions are employed in the school environment. Moreover, the regression Equation (1) used for the analysis of the variables allowed us to determine the effect that each has on the grades of mathematics students. Another strength is that the model can be extended to other subjects and educational levels with similar approaches.
On the other hand, some limitations of the present study should be recognized. First, due to its cross-sectional design, no causal conclusions can be drawn. Secondly, the inaccurate nature of the Gain Lift model only predicts the maximum level of the possible gain in the grades of mathematics students.
5. Conclusions
This paper has achieved all the initial objectives proposed and all the research questions raised have been answered.
It is concluded that the grades obtained by students can be optimized if adequate intervention strategies are applied in the classroom. The results empirically confirm that certain pedagogical actions have a positive effect on students and, accordingly, on their academic performance. The innovative character of this study lies in the ability to quantify the maximum level of grade gain with the Gain Lift algorithm. With this instrument, it is observed that the gain in mathematics grades for girls is significantly greater than the gain obtained for boys, regardless of the subsample chosen.
The items focused on the “School Environment” dimension, such as the role of the classroom, and the teacher–student relationship, have had a greater influence on the mathematics grades than the items of the “Mathematics Learning” dimension based on the indicators affinity, teaching, study time, didactic resources used, study aids, and motivation. However, the low rates of gain indicate that there are other important factors affecting the performance of students in mathematics which are not covered in this study. Therefore, other variables, such as socioeconomic, family, or technological status, which may affect mathematics students, should be analyzed. Considering this, a wide range of lines of research should be pursued in order to delve deeper into strategies that can be applied to analyze school failure, especially linked to the area of mathematics, which is of great concern to the educational community worldwide.

 ,
, 


