Article

Fast Search Method Based on Vector Quantization for Raman Spectroscopy Identification

1
Safety System R&D Group, Korea Institute of Industrial Technology, Dague 31056, Korea
2
Department of Electronics Engineering, Chonnam National University, Gwangju 61186, Korea
*
Authors to whom correspondence should be addressed.
Mathematics 2020, 8(11), 1970; https://doi.org/10.3390/math8111970
Submission received: 9 September 2020 / Revised: 30 October 2020 / Accepted: 1 November 2020 / Published: 6 November 2020

Abstract

:
In spectroscopy, matching a measured spectrum to a reference spectrum in a large database is often computationally intensive. To solve this problem, we propose a novel fast search algorithm that finds the most similar spectrum in the database. The proposed method is based on principal component transformation and provides results equivalent to the traditional full search method. To reduce the search range, hierarchical clustering is employed, which divides the spectral data into multiple clusters according to the similarity of the spectrum, allowing the search to start at the cluster closest to the input spectrum. Furthermore, a pilot search was applied in advance to further accelerate the search. Experimental results show that the proposed method requires only a small fraction of the computational complexity required by the full search, and it outperforms the previous methods.

1. Introduction

Spectroscopy techniques, such as infrared and Raman spectroscopy, are increasingly being used to measure and analyze the physical and chemical properties of materials. There are two types of analysis methods related to this technique. The first is to identify the constituents of a given spectrum, and the second is to identify the spectrum itself by comparing it directly to other known spectra in the database [1,2]. The second type of analysis is addressed in this study.
Spectral identification methods can be divided into two categories: classification methods based on machine learning (ML) and algorithms based on the similarity evaluation [3]. The first methods show good classification performance through an optimal learning model by training a given database with a ML-based algorithm. Conventionally, k-nearest neighbor (KNN) [4], random forest (RF) [5] and artificial neural network (ANN) [6] methods have been proposed, and various 1D-convolutional neural network(CNN) models based on deep learning have recently been proposed [7,8]. Good identification performance is expected from these methods if a sufficient number of samples in each spectrum is obtained.
However, most existing Raman libraries provide one sample for each type, such that ML methods require significant time to build up sufficient samples of the target material. The other methods are more suitable for utilizing existing Raman libraries. Representative methods include correlation search [9] and cosine similarity, the Hit-quality index (HQI) [10], and the Euclidean distance (ED) search [11,12]. These methods are intuitive and have often been used for identifying different types of Raman spectra. In recent years, methods have been proposed that improve identification performance in various applications along with the moving window technique [13,14].
The spectral database is growing exponentially, and therefore, searching for similar spectra is significantly more demanding. Further, larger databases are being built, as existing databases can be merged and reused along with technologies that complement the characteristics of measurement equipment [9,15], making high-speed search an essential and demanding task. A highly viable, fast search method is particularly important in embedded systems with limited computing power, such as handheld spectrometer systems [16,17,18]. These portable Raman spectrometers are often used at accident sites, crime scenes or terrorist threat sites due to their advantages such as portability and maneuverability [19]. In particular, applications that detect hazardous substances such as explosives and poisons require fast and accurate solutions [20].
A more suitable identification method for the above fast search applications is the similarity evaluation methods. The first methods require significant calculations in the learning process depending on the volume of the database and the number of samples of the data. To introduce the ML methods to Raman systems with limited computing power, such as handheld Raman spectroscopy, hardware technologies such as the field-programmable gate array (FPGA) must be incorporated [21,22]. These methods are currently showing remarkable achievements owing to the breakthroughs in hardware. Meanwhile, because the identification method based on similarity evaluation can be applied even if there is only one sample representing the data type, there is no difficulty in applying it to the existing Raman library. Furthermore, there is no separate learning process, and it has the advantage of simply configuring an identification system.
The simplest and most commonly applied comparison method for spectral identification is to calculate and compare the ED between a given spectrum and the spectrum in the database, i.e., the reference spectra. This method has a structure very similar to the HQI method and determines the spectrum with the closest distance to the input spectrum as the identity of the input material.
Several fast search methods have been proposed in the context of vector quantization (VQ). However, the Raman spectrum is generally higher dimensional than the image covered by VQ, and hence, an appropriate method is required to solve this problem. Therefore, to introduce the major algorithms of VQ into the Raman identification system, it is necessary to analyze the mathematical modelling methods and key characteristics of each algorithm.
The conventional fast ED comparison methods can be classified into two groups. The methods of the first group do not solve the nearest neighbor problem itself; however, these methods find approximately the same solutions in terms of the mean squared error. These methods generally rely on the use of data structures such as K-dimensional trees and other types of structures that facilitate the fast search of reference data [23,24]. These methods are very fast, but they are not considered in this study because an exact solution, and not an approximate one, is required.
Conversely, the methods provided in the second group deal with exact solutions to the nearest neighbor search problem. These typically include the partial distance search (PDS) and projection-based search algorithms. A very simple but effective approach is the PDS method reported by Bei and Gray [25]. In this method, when the cumulative sum of the EDs between the reference data and the input signal is larger than the distance of the current closest candidate, the distance calculation is terminated to reduce computational costs [26,27]. This method does not require memory overhead; however, the reduction in computational cost is limited.
Projection methods without transformation of input data such as the equal-average nearest neighbor search (ENNS) and its variants [28,29,30] reduce unnecessary searches by using the mean of the input data. These methods provide a significant reduction in computational time compared to the full search method. However, they have their own weakness in that the performance gain is not significant unless the mean of the data is not distinctly different. To overcome the weakness of these methods, the mean pyramid search (MPS) method [31,32] was proposed. This method could avoid the weakness by using a local segment mean. It generally performs better than the ENNS.
Projection methods have likewise been proposed to transform the input data using singular value decomposition (SVD), discrete wavelet transform (DWT), and Karhunen–Loeve Transform (KLT) also known as principal component transformation (PCT). One of the most important properties of these transformations is that most of the data energy can be stored using very few coefficients [33,34]. Based on these advantages, improved search methods combined with existing fast algorithms have been proposed, providing faster search capabilities.
Apart from data transformation, our method adopted a cluster structure to reduce the search area. Spectra from the database to be compared were pre-clustered into hierarchical cluster groups based on similarity. In the proposed method, the spectra were sequentially tested in the order of cluster distance, starting with the reference spectrum belonging to the nearest clusters, which helped to quickly find the nearest spectrum. The search process was further accelerated using a pilot search with fewer dimensions of the transformed data to find the closest candidates as quickly as possible.
The remainder of this paper is organized as follows. In Section 2, the main methods in the existing VQ field were reviewed and compared. In Section 3, a novel fast search algorithm is described. To confirm the applicability of our method, the simulation results of the proposed method are compared with those of existing methods in Section 4. Finally, a brief conclusion is presented.

2. Previous Methods

2.1. Full Search and PDS

The full search method finds a vector y m i n with the smallest ED between an input vector x = ( x 1 , x 2 , , x N ) and vectors in a database, C = ( y i | i = 1 , 2 , , M ) . This method is expressed by Equation (1), where y i = ( y i 1 , y i 2 , , y i N ) is a reference spectrum of one material in the database and d 2 ( x , y i ) is the ED between an input spectrum x and a reference spectrum y i , which is expressed by Equation (2).
y m i n = argmin y i C d 2 ( x , y i )
d 2 ( x , y i ) = k = 1 N ( x k y i k ) 2
This method sequentially searches the entire database to determine the spectrum closest to the input data. Therefore, assuming that the dimension of an input spectrum is N and the number of spectra in the database is M, N M multiplications, M ( 2 N 1 ) additions, and M 1 comparisons are required.
PDS is a very simple way to reduce the amount of computation by allowing only a few dimensions of the input data to be used to avoid unnecessary distance calculations. Assume the current minimum distance is d m i n 2 in the search process. For the next y i , if the cumulative sum from y i 1 to y i q is larger than d m i n 2 as in Equation (3) where 1 q N , the distance calculation is terminated. Therefore, this method reduces ( N q ) multiplications and 2 ( N q ) additions.
k = 1 q ( x k y i k ) 2 d m i n 2

2.2. ENNS and MPS

ENNS uses hyperplanes orthogonal to the central line to partition search space. Each point on the fixed hyperplane that intersects the central line has the same mean as P m = ( m , m , , m ) . The hyperplane is called an equal average hyperplane. ENNS calculates the mean m x for input data x = ( x 1 , x 2 , …, x N ) first. Then a reference spectrum y is found, having the minimum mean difference to x . d ( x , y ) is computed and set to the current minimum distance d m i n . It is obvious that any reference spectra close to x is inside the hyperplane centered around x with the radius d m i n . By projecting the input data on the central axis, two boundary projection points, P m a x = ( m m a x , m m a x , …, m m a x ) and P m i n = ( m m i n , m m i n ,…, m m i n ) can be found, where
m m a x = m x + d m i n / N , m m i n = m x d m i n / N .
The search space is now bounded by the equal-average hyperplanes intersecting the above two points. Hence, it is sufficient to search only those spectra having mean values raging from m m i n to m m a x . During the search process, a more similar reference spectrum that is found leads to a larger decrease in d m i n , and the search area decreases further.
MPS based on the local segment mean and its structure were proposed to further accelerate the search process. It showed better performance than ENNS and its variants. It is based on a two dimensional mean pyramid structure and is mainly applied to image coding, so it is not suitable for one dimensional spectra in its original form. However, this technique can be applied to one dimensional cases with minor modifications. We modified the MPS as follows. Let m x , m / n be the sub-mean of x as Equation (5).
m x , m / n = ( x N ( m 1 ) / n + 1 , x N ( m 1 ) / n + 2 , , x N m / n )
For simplicity, the modified one dimensional MPS (MPS1D) for three layers can be represented as follows.
d 2 ( x , y ) N / 2 2 ( m x , 1 4 m y , 1 4 ) 2 + N / 2 2 ( m x , 2 4 m y , 2 4 ) 2 + N / 2 2 ( m x , 3 4 m y , 3 4 ) 2 + N / 2 2 ( m x , 4 4 m y , 4 4 ) 2 N / 2 ( m x , 1 2 m y , 1 2 ) 2 + N / 2 ( m x , 2 2 m y , 2 2 ) 2 N ( m x m y ) 2 .
The method first verify with the given y if the lowest right term in the above is larger than d m i n 2 . If y passes the test, then the second right term is checked along with the first. If y passes all tests, y could be closer than the current closest spectrum; hence, d ( x , y ) is calculated. Otherwise, it is discarded. As expected, these tests reduce the search area more effectively than ENNS. However, this method also shares the same problem with ENNS because it relies on the mean of the given data at the lower level. To overcome this limitation, methods using the coordinate transformation were proposed.

2.3. PCT

The principal component analysis is a type of multivariate analysis that reduces the dimension of data while maintaining the information of the original dataset [35]. Assume thet an N × M matrix Y consists of M number of N dimensional spectra. The N × N correlation matrix R can be decomposed as in Equation (7), where λ 1 λ 2 λ N . Transformed coefficients known as principal components (PCs) can be calculated using Equation (8).
R = Y Y T = V Λ V T = v 1 , v 2 , , v N λ 1 0 0 0 λ 2 0 0 0 λ N v 1 T v 2 T v N T
W = V T Y
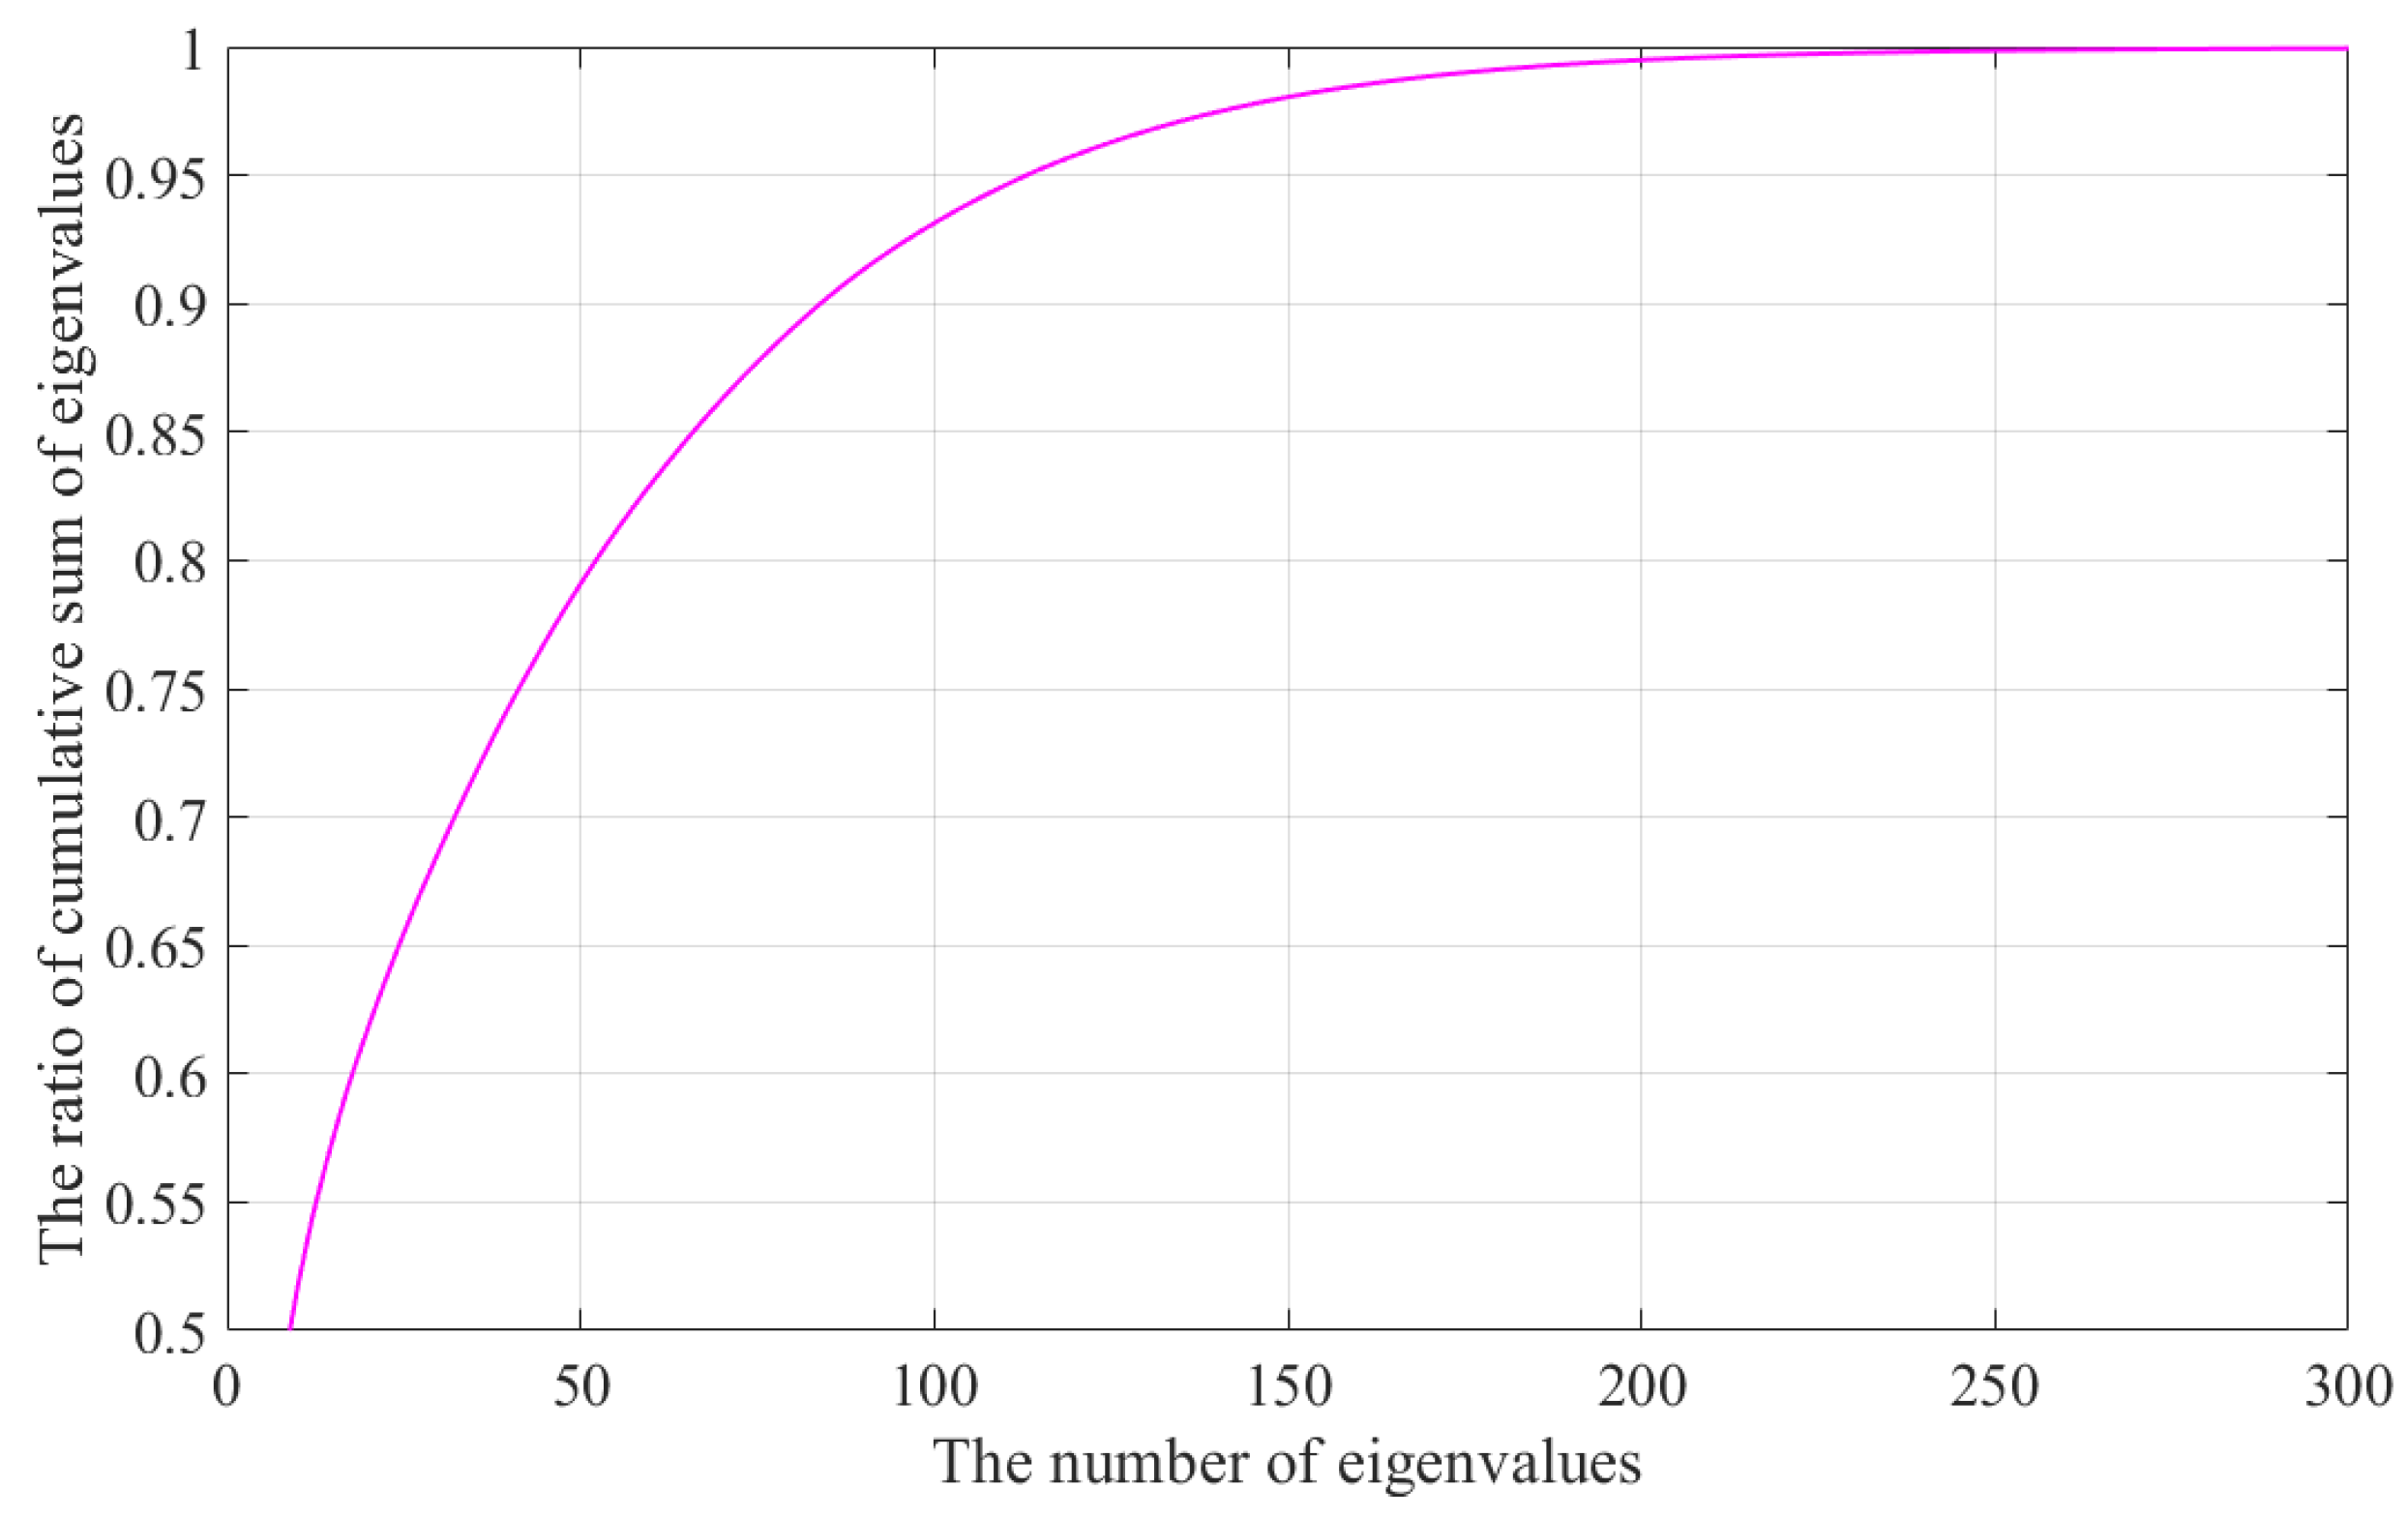
PCT is known to be effective at compressing information of data into the first few PCs. The degree of compression effect can be determined by calculating the percentage of the cumulative sum of eigenvalues, as shown in Equation (9). The calculated results using experimental Raman spectra are shown in Figure 1.
C R ( K ) = i = 1 K λ i / i = 1 N λ i
The cumulative ratio saturates on a small number of PCs and reaches nearly one on approximately 250 PCs. This indicates that 250 PCs yield approximately the same results as 3300 dimensional data from the original domain. The 250 × 3300 calculations are significantly smaller than 3300 × 3300 calculations for the transformation; however, calculating 250 PCs for a given input spectrum is still considered a high computational overhead. This computational overhead can be further reduced by using an existing PDS. In this same context, MPS + PDS can also be considered. The performance of these methods is reported in Section 4 along with the performance of the proposed method.

3. Cluster Search with a Pilot Search

3.1. Hierarchical Clustering

Hierarchical clustering (HC) is an algorithm that links similar data into groups called clusters [36]. To perform HC analysis, the similarity between data is measured first. The similarity measurement generally uses a distance value, and for a data set consisting of M spectra, M ( M 1 ) / 2 distance values are obtained. Using the calculated distance values, data close to each other are linked to the same cluster.
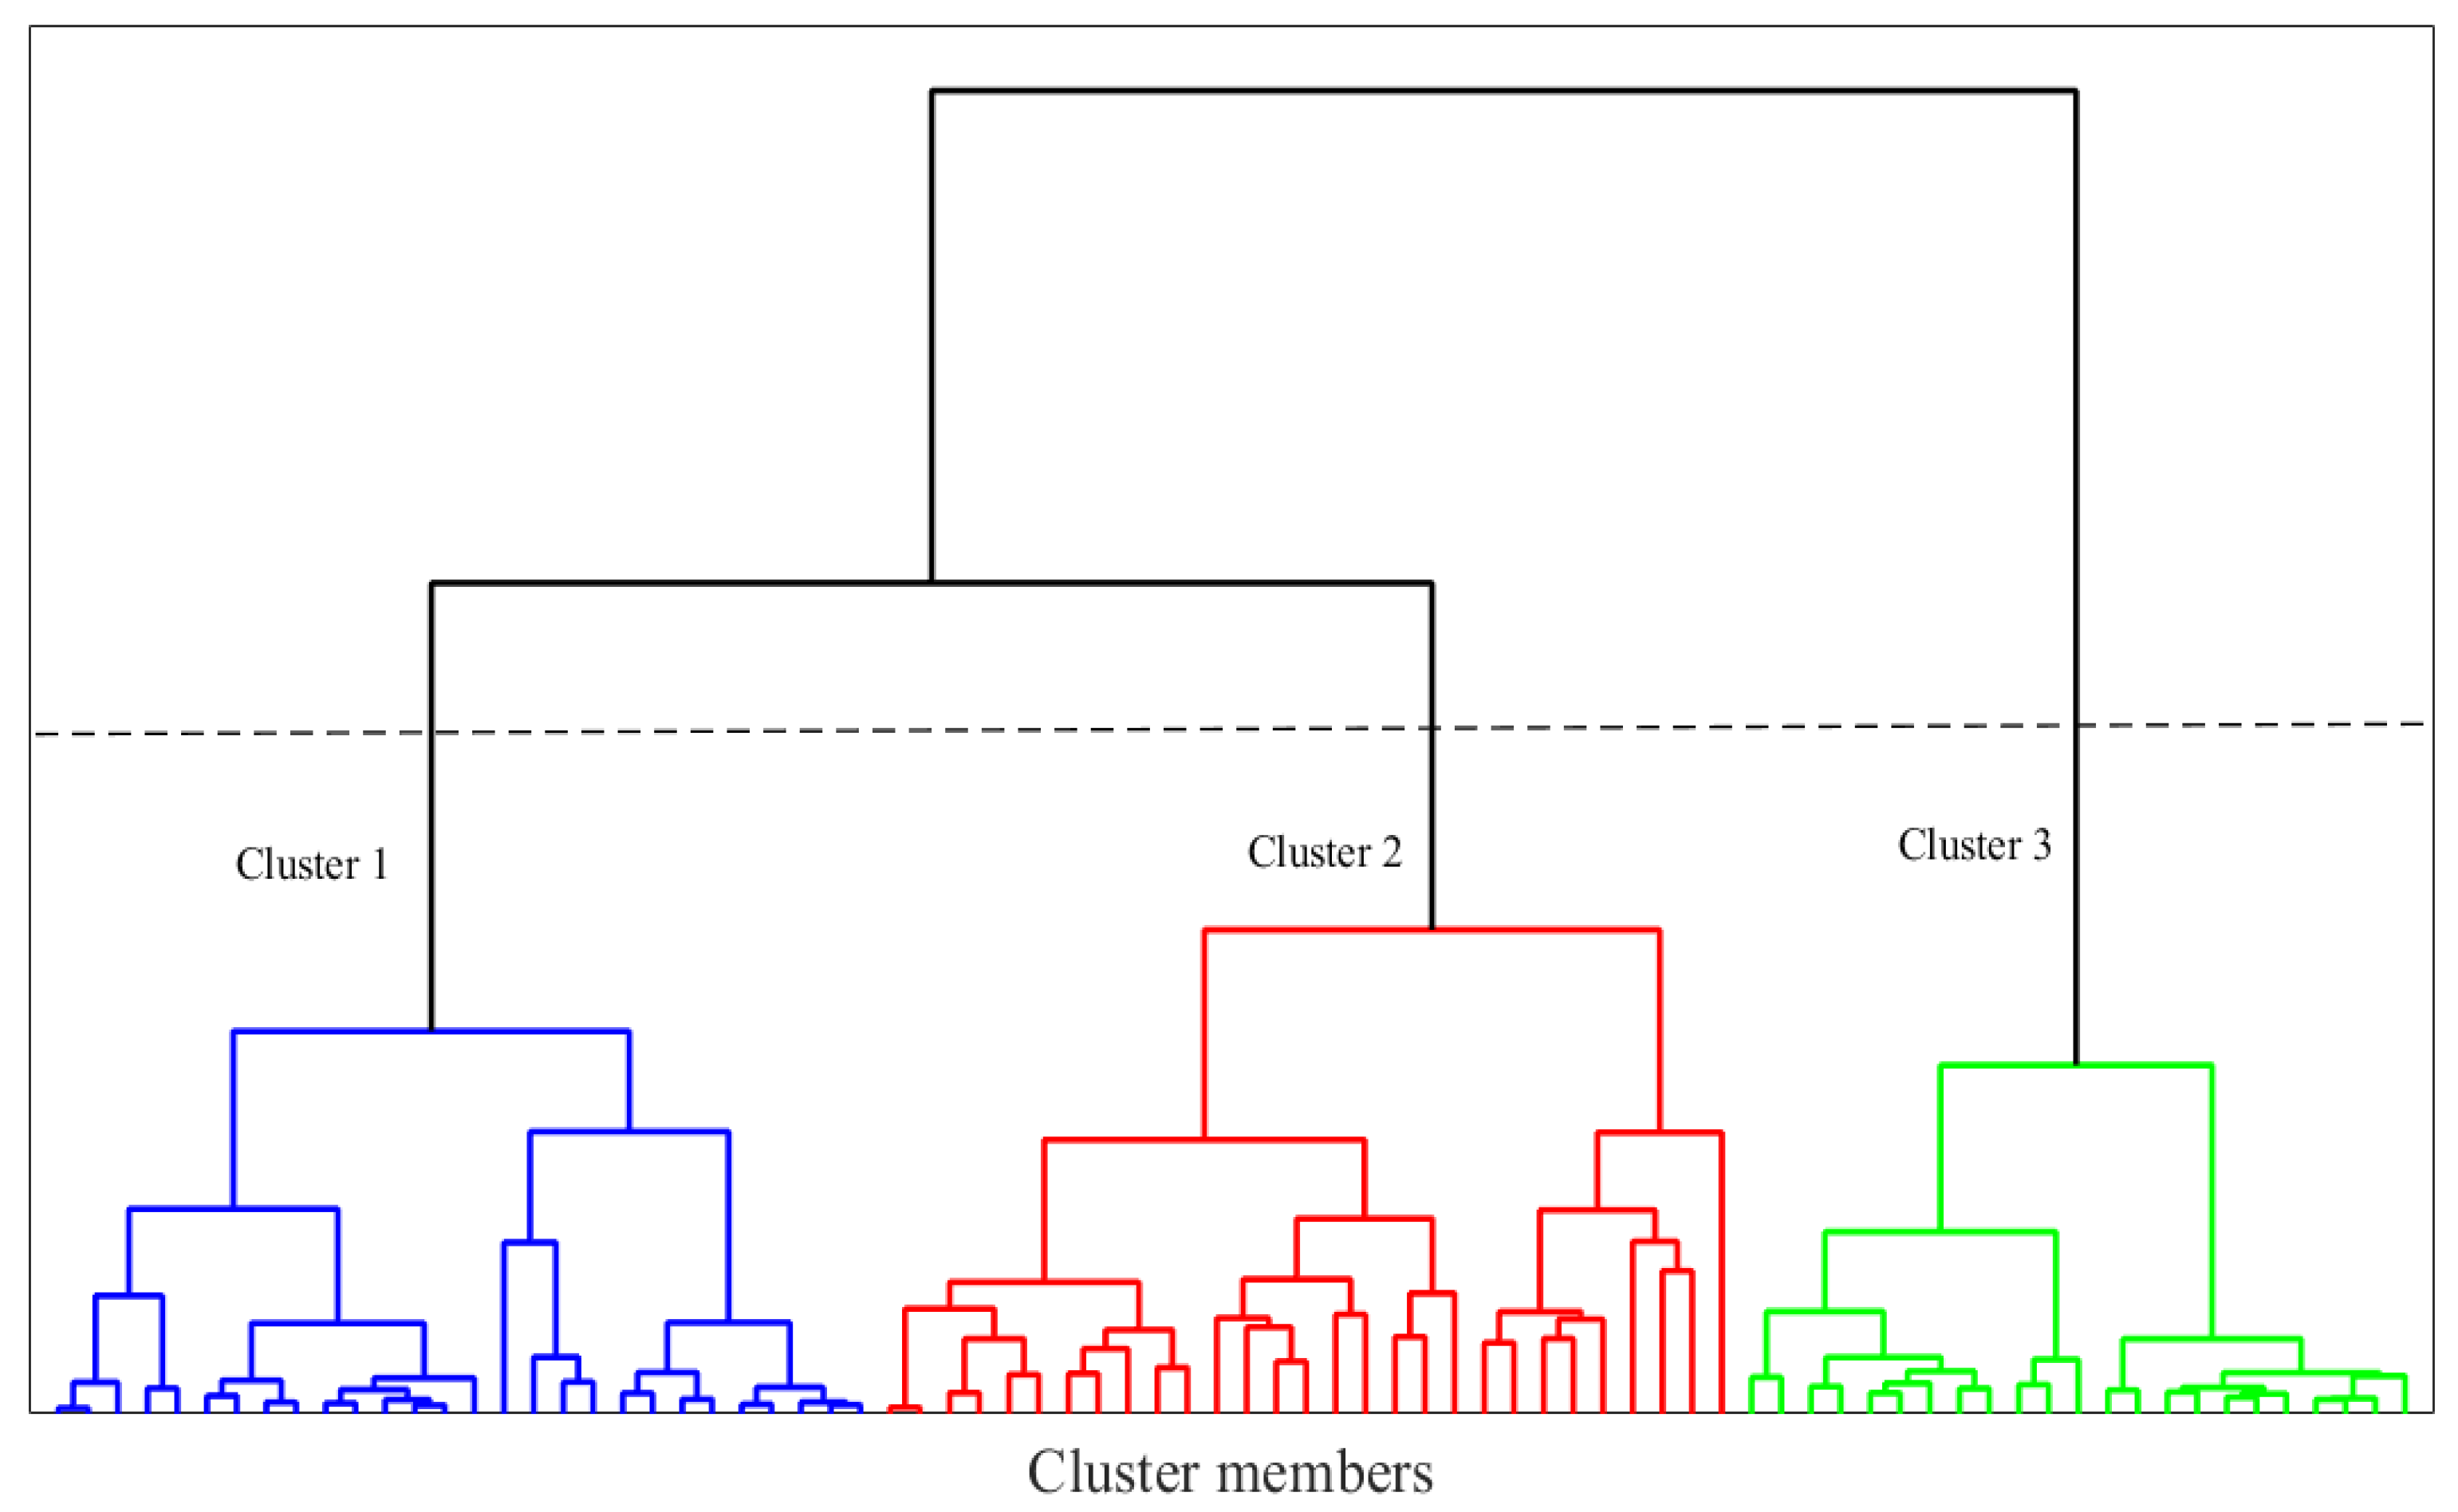
HC is divided into two types, divisive and agglomerative. Of the two methods, the divisive method was chosen because it requires less computation and allows clusters to be divided according to certain criteria, such as the maximum cluster distance or the sum of distances within the cluster. This method, unlike K-means clustering, can perform training without predetermining the number of clusters [37]. Thus, after the structure is complete, the desired number of clusters can be decided. Figure 2 is an example of HC using 100 Raman spectra.
In general, the computational complexity of HC is larger than that of the K-means clustering. However, because the clusters are precomputed and determined, the real-time search speed is not affected. After finding the center of each cluster, the data closest to the center of each cluster is set as the practical center of the cluster to minimize unnecessary computation. Then, the distance between the center and all data in that cluster is stored, and the farthest distance from the center is set as the cluster size.

3.2. Cluster Search (CS)

First, we calculate the distances between the centers of all clusters and the input spectrum x and sort all clusters in ascending order. Then, we find the center of the cluster closest to the input spectrum x . The distance between the center of that cluster and x as d ( x , c ) is denoted and set to the current d m i n . The closest cluster is most likely to contain the closest spectrum; hence, the search starts from that cluster. When examining a specific cluster, if the difference between d ( x , c ) and d ( y , c ) is lager than the current d m i n , then all members of that cluster are excluded from the closest candidate by the following inequality.
d ( x , c ) d ( y , c ) > d m i n
If the above inequality is not true, then the spectra of the cluster must be searched in turn. The order in which the spectra were searched was determined in the order far from the center. This is because when a specific member satisfies the above inequality, all remaining members can be excluded. Combining PDS into the process can further avoid unnecessary calculations. The loop is repeated for all N clusters in ascending order to finally locate the spectrum closest to the input vector. Ultimately, the proposed method significantly reduces computational complexity because partial or all spectra of the cluster are excluded from the candidate by the inequality (10) and PDS.

3.3. Pilot Search (PS)

Applying a coarse-to-fine strategy to the above method can further reduce the computational overhead. It is an approach that first finds a relatively close spectrum, and subsequently finds the closest spectrum based on it. A relatively close spectrum can be found using a pilot search with few PCs, the pilot search does not guarantee the same results as the full search. However, if a sufficiently close spectrum is found, the closest spectrum can be found quickly, making the overall search much faster.
For the pilot search, previously built clusters or newly built clusters can be used. New clusters require additional memory, so the same previously built clusters are used in this study. The number of PCs to use for the pilot search is discussed in the experimental section. The pseudo-code of the proposed method is given in Agorithm 1.
Algorithm 1: Proposed algorithm
Mathematics 08 01970 i001

4. Experimental Section

A total of 40 chemicals and 12 explosives were prepared using ≥ 99% concentration standard from Sigma-Aldrich (St. Louis, MO, USA) and the materials were measured using three Raman instruments. They merged with a commercial Raman library (Thermo Fisher Scientific) of 14,033 spectra to form a Raman database of 14,085 spectra. The Raman database consists of one template for each material. Table 1 shows the detailed specifications of the four Raman spectroscopy systems used to measure the spectrum.
All spectra were adjusted to have a resolution of 201–3500 cm 1 by resampling and were preprocessed with additive noise reduction and background noise removal [38,39]. Figure 3 shows an example of Raman spectra after preprocessing. The types of chemicals are acetonitrile, benzene, cyclohexane, and toluene.
To analyze the performance of the algorithm, 2817 types of the Raman spectrum, which is 20% of the database, was searched from all 14,085 types of the Raman spectrum. Similar to the real spectrum, noise of approximately 15, 20, and 25 dB was added to the input spectrum. The factor influencing the identification performance of the proposed method is the noise of the input spectrum used in the experiment. The identification performance of the spectrum acquired under harsh noise conditions is expected to be relatively low, and the well-removed spectrum can be expected to have good identification performance. Therefore, it is important to introduce suitable noise reduction methods and find optimal parameters.
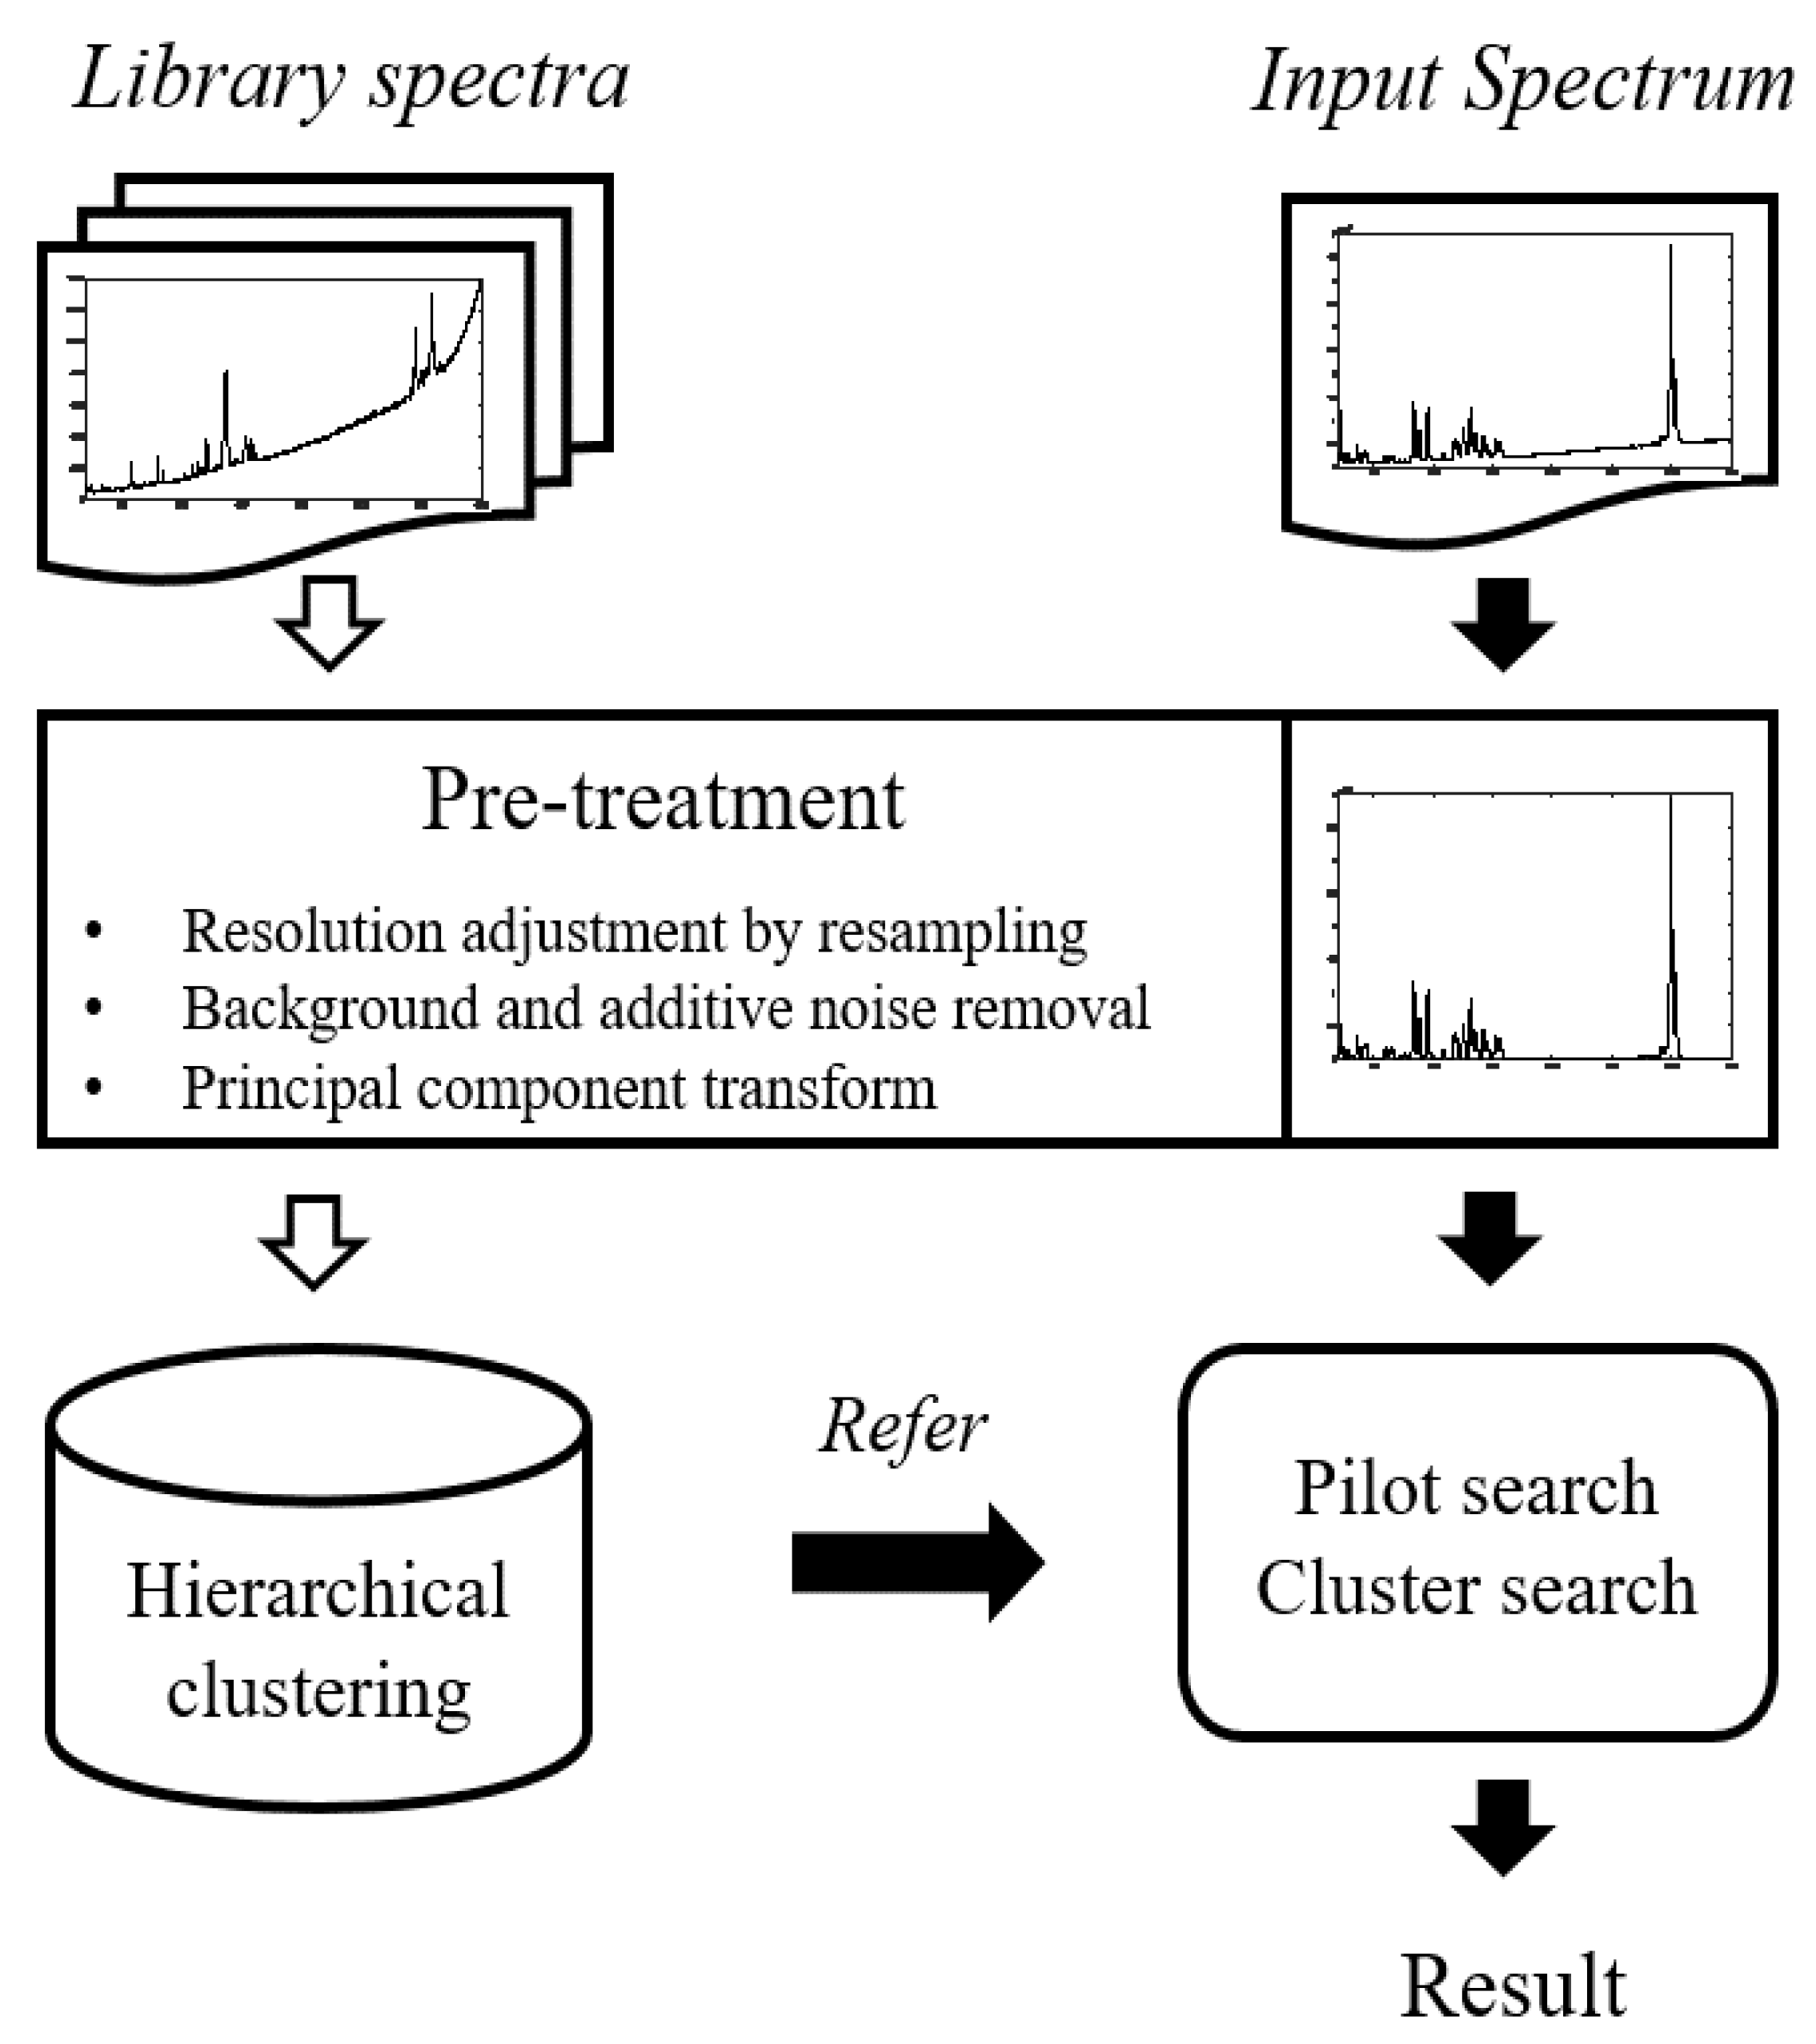
However, the VQ method has no effect on the identification performance of the full search method, which is the reference identification algorithm. Therefore, to focus on the aim of this study, the main content of this paper is limited to the VQ issue. Figure 4 depicts a flowchart of the proposed method including preprocessing. Black arrows on the right indicate real-time processes, while white arrows indicate previously calculated processes.

5. Results and Discussion

There are several ways to evaluate the computational complexity of an algorithm. Among them, the execution speed depends on various aspects of the CPU, such as the instruction mix, pipeline structure, cache memory, and the number of cores, thus rendering it difficult to find an explicit relationship between the search speed and execution time. Therefore, in this study, the number of necessary additions and multiplications was chosen as a criterion for evaluating the search speed.
In general, the fast search technique in VQ presumes the same identification performance as the full search technique, which uses the entire dimension of the input data. Therefore, all experimental results were compared focusing only on the computational complexity, under the same identification performance conditions as the full search.
Preliminary experiments were conducted to determine the appropriate number of clusters and PCs. Table 2 shows the results of the PTC + PDS method according to the number of PCs. This method showed the least computational complexity when 150 PCs were used. In Section 2, it was discussed that 250 PCs contain almost all the information from the 3300 raw data points. However, this does not indicate that it is the best parameter. Based on this result, we determined the optimal number of clusters. Table 3 shows the number of multiplications and additions according to the number of clusters in CS using 150 PCs.
According to Table 3, the computational complexity decreases as the number of clusters increases. However, once the number of clusters exceeds 80, the computational complexity increases again. Therefore, the number of clusters was set at 80 in this study.
Subsequently, the number of clusters was fixed at 80, and the computational complexity, cluster skip, and element skip according to the number of PCs were analyzed. The results are presented in Table 4.
Cluster skip refers to the exclusion of all cluster members from the candidates. In contrast, element skip implies excluding some data in the cluster from the candidates. As the number of PCs increases, the number of cluster skips increases, as information regarding the spectrum that can be used in Equation (10) increases. Therefore, more clusters can be excluded than when the number of PCs is small. However, the overall computational complexity must be considered, as converting more PCs requires additional computation. According to Table 4, the best results are obtained using 80 PCs. For all PCs considered in the experiment, the sum of the number of cluster and element skips approximates the number of total clusters 80. Hence, it can be confirmed that the cluster structure effectively excludes spectra that cannot be candidates.
Finally, the pilot search was applied to further speed up the search. Table 5 shows the experimental results obtained while investigating the effect of the number of PCs used in the pilot search. The results show typical trade-off characteristics. As the number of PCs for the pilot search increases, the computational amount of the pilot search decreases, while the computational amount of CS increases. Due to these characteristics, the total number of calculations is similar. This means that the pilot test reliably helps improve the performance. In the following experiments, we chose 40 as the number of PCs for the pilot search.
To analyze the performance of each algorithm, including the proposed method, 2817 Raman spectra were assessed, and the results are listed in Table 6. PDS significantly reduces the number of additions. In contrast, MPS is more effective in reducing the number of multiplications. This is because MPS relies on the segmental mean, which reduces the need for addition rather than multiplication. The overall performance depends on the characteristics of the data. If the data are not distributed around the mean, the benefit decreases. This is the reason for introducing the CS.
The combination of MPS1D and PDS reduces the overall computation complexity compared to the case of using only MPS1D. The MPS1D_sort method sorts the reference spectra according to the mean in advance. If the difference between the mean is more than K times the minimum distance, further search is not needed as in ENNS, which speeds up the search. This method showed a performance improvement of approximately 55.2 % compared to the MPS1D + PDS.
Subsequently, PCT with PDS shows a reduction of approximately 63.56 % in computational complexity compared to MPS1D_Sort + PDS. The proposed method, CS, showed an improvement of approximately 36.34 % when using the same number of PCs as PCT + PDS, and nearly 47.57 % when using the optimal number of PCs. From these results, it was confirmed that pre-determining the cluster structure of the database is effective for fast search. These properties are not just found in CS. MPS1D, a method of determining the search structure in advance through database analysis, also showed faster search speed compared to the method without structure. Determining an appropriate search structure is a critical issue as this structure is created in advance and does not affect the real-time search.
Finally, the introduction of the pilot search reduced the computational amount by approximately 34.78 % compared to CS (80 PCs). This result corresponds to a computational complexity equivalent to 0.48 % that of the full search. The overall average results of the major algorithms are shown in Figure 5 for convenience.

6. Conclusions

In this paper, we proposed a novel search method that speeds up the search for the identification of Raman spectra. The principal component transformation was introduced along with the cluster structure. The reduced number of data dimensions reduces the computational complexity of distance calculations, and the cluster structure combines the well-known trigonometric inequality with PDS to exclude numerous spectra that cannot be the candidate from the search. Finally, the pilot search was applied to further speed up the search. Optimal parameters of the proposed method were investigated and determined experimentally.
Moreover, various algorithms in the VQ field were modified and introduced into structures suitable for 1D signals and compared with the proposed method. From the results of the experiments, it was found that the proposed method significantly surpassed the existing method in terms of the required number of additions and multiplications.
The proposed method is particularly suitable for systems with relatively limited computing power, such as portable Raman spectroscopy and the compact Raman spectrometer. In addition, applications such as hazardous substance detection require fast and accurate detection, and the search time is particularly long for the large database of 14085 considered in the paper, so the proposed technique can be used appropriately. We expect that the proposed method and its variants will be a promising alternative to the spectral search problems in the above-mentioned applications.

Author Contributions

Conceptualization, J.-K.P. and S.-J.B.; Data curation, J.-K.P and A.P.; Formal analysis, J.-K.P. and S.-J.B.; Funding acquisition, S.L.; Investigation, A.P.; Methodology, J.-K.P. and S.-J.B.; Project administration, S.L.; Resources, A.P.; Software, A.P.; Supervision, S.L. and S.-J.B.; Validation, J.-K.P., S.L. and S.-J.B.; Visualization, A.P.; Writing – original draft, J.-K.P.; Writing – review and editing, S.L. and S.-J.B. All authors have read and agreed to the published version of the manuscript.

Funding

This research received no external funding.

Acknowledgments

This research was supported by Basic Science Research Program through the National Research Foundation of Korea (NRF) funded by the Ministry of Education (2017R1A2B4012450). This study has been also conducted with the support of the Korea Institute of Industrial Technology as “Development of color/light-emitting textile products for detection of industrial harmful materials and prevention of danger (kitech EO-20-0006)”.

Conflicts of Interest

The authors declare no conflict of interest.

References

  1. Loethen, Y.L.; Kauffman, J.F.; Buhse, L.F.; Rodriguez, J.D. Rapid screening of anti-infective drug products for counterfeits using Raman spectral library-based correlation methods. Analyst 2015, 140, 7225–7233. [Google Scholar] [CrossRef]
  2. Li, J.; Chu, X.; Tian, S.; Lu, W. The identification of highly similar crude oils by infrared spectroscopy combined with pattern recognition method. Spectrochim. Acta Part A 2013, 112, 457–462. [Google Scholar] [CrossRef]
  3. Mozaffari, M.H.; Tay, L.L. A Review of 1D Convolutional Neural Networks toward Unknown Substance Identification in Portable Raman Spectrometer. arXiv 2020, arXiv:2006.10575. [Google Scholar]
  4. Madden, M.; Ryder, A.G. Machine learning methods for quantitative analysis of Raman spectroscopy data. Int. Soc. Opt. Photonics 2003, 4876, 44–49. [Google Scholar]
  5. Sevetlidis, V.; Pavlidis, G. Effective Raman spectra identification with tree-based methods. J. Cult. Herit. 2019, 37, 121–128. [Google Scholar] [CrossRef]
  6. Acquarelli, J.; Van Laarhoven, T.; Gerretzen, J.; Tran, T.N.; Buydens, L.M.; Marchiori, E. Convolutional neural networks for vibrational spectroscopic data analysis. Anal. Chim. Acta 2017, 954, 22–31. [Google Scholar] [CrossRef] [Green Version]
  7. Liu, J.; Osadchy, M.; Ashton, L.; Foster, M.; Solomon, C.J.; Gibson, S.J. Deep convolutional neural networks for Raman spectrum recognition: A unified solution. Analyst 2017, 142, 4067–4074. [Google Scholar] [CrossRef] [PubMed] [Green Version]
  8. Lussier, F.; Thibault, V.; Charron, B.; Wallace, G.Q.; Masson, J.F. Deep learning and artificial intelligence methods for Raman and surface-enhanced Raman scattering. Trends Anal. Chem. 2020, 124, 115796. [Google Scholar] [CrossRef]
  9. Park, J.K.; Park, A.; Yang, S.K.; Baek, S.J.; Hwang, J.; Choo, J. Raman spectrum identification based on the correlation score using the weighted segmental hit quality index. Analyst 2017, 142, 380–388. [Google Scholar] [CrossRef] [PubMed]
  10. Rodriguez, J.D.; Westenberger, B.J.; Buhse, L.F.; Kauffman, J.F. Standardization of Raman spectra for transfer of spectral libraries across different instruments. Analyst 2011, 136, 4232–4240. [Google Scholar] [CrossRef] [PubMed]
  11. Howari, F.M. Comparison of spectral matching algorithms for identifying natural salt crusts. J. Appl. Spectrosc. 2003, 70, 782–787. [Google Scholar] [CrossRef]
  12. Wierzba, P.; Kwiatkowski, A.; Smulko, J.; Gnyba, M. Algorithms of chemicals detection using Raman spectra. Metrol. Meas. Syst. 2010, 549–559. [Google Scholar]
  13. Chu, X.L.; Xu, Y.P.; Tian, S.B.; Wang, J.; Lu, W.Z. Rapid identification and assay of crude oils based on moving-window correlation coefficient and near infrared spectral library. Chemom. Intell. Lab. Syst. 2011, 107, 44–49. [Google Scholar] [CrossRef]
  14. Park, J.; Lee, S.; Park, A.; Baek, S.J. Adaptive Hit-Quality Index for Raman spectrum identification. Anal. Chem. 2020, 92, 10291–10299. [Google Scholar] [CrossRef]
  15. Choquette, S.J.; Etz, E.S.; Hurst, W.S.; Blackburn, D.H.; Leigh, S.D. Relative intensity correction of Raman spectrometers: NIST SRMs 2241 through 2243 for 785 nm, 532 nm, and 488 nm/514.5 nm excitation. Appl. Spectrosc. 2007, 61, 117–129. [Google Scholar] [CrossRef]
  16. Hajjou, M.; Qin, Y.; Bradby, S.; Bempong, D.; Lukulay, P. Assessment of the performance of a handheld Raman device for potential use as a screening tool in evaluating medicines quality. J. Pharm. Biomed. Anal. 2013, 74, 47–55. [Google Scholar] [CrossRef]
  17. Farber, C.; Kurouski, D. Detection and identification of plant pathogens on maize kernels with a hand-held Raman spectrometer. Anal. Chem. 2018, 90, 3009–3012. [Google Scholar] [CrossRef] [Green Version]
  18. Sanchez, L.; Farber, C.; Lei, J.; Zhu-Salzman, K.; Kurouski, D. Noninvasive and nondestructive detection of cowpea bruchid within cowpea seeds with a hand-held Raman spectrometer. Anal. Chem. 2019, 91, 1733–1737. [Google Scholar] [CrossRef]
  19. Moore, D.S.; Scharff, R.J. Portable Raman explosives detection. Anal. Bioanal. Chem. 2009, 393, 1571–1578. [Google Scholar] [CrossRef]
  20. Izake, E.L. Forensic and homeland security applications of modern portable Raman spectroscopy. Forensic Sci. Int. 2010, 202, 1–8. [Google Scholar] [CrossRef] [PubMed]
  21. Zhang, C.; Wu, D.; Sun, J.; Sun, G.; Luo, G.; Cong, J. Energy-efficient CNN implementation on a deeply pipelined FPGA cluster. In Proceedings of the 2016 International Symposium on Low Power Electronics and Design, San Francisco, CA, USA, 8–10 August 2016; pp. 326–331. [Google Scholar]
  22. Bai, L.; Zhao, Y.; Huang, X. A CNN accelerator on FPGA using depthwise separable convolution. IEEE Trans. Circuits Syst. Express Briefs 2018, 65, 1415–1419. [Google Scholar] [CrossRef] [Green Version]
  23. Gray, R.M.; Neuhoff, D.L. Quantization. IEEE Trans. Inf. Theory 1998, 44, 2325–2383. [Google Scholar] [CrossRef]
  24. Moayeri, N.; Neuhoff, D.L.; Stark, W.E. Fine-coarse vector quantization. IEEE Trans. Signal Process. 1991, 39, 1503–1515. [Google Scholar] [CrossRef]
  25. Bei, C.D.; Gray, R. An improvement of the minimum distortion encoding algorithm for vector quantization. IEEE Trans. Commun. 1985, 33, 1132–1133. [Google Scholar]
  26. Ramasubramanian, V.; Paliwal, K.K. Fast k-dimensional tree algorithms for nearest neighbor search with application to vector quantization encoding. IEEE Trans. Inf. Theory 1992, 40, 518–531. [Google Scholar] [CrossRef] [Green Version]
  27. Moayeri, N.; Neuhoff, D.L. Theory of lattice-based fine-coarse vector quantization. IEEE Trans. Inf. Theory 1991, 37, 1072–1084. [Google Scholar] [CrossRef]
  28. Ra, S.W.; Kim, J.K. A fast mean-distance-ordered partial codebook search algorithm for image vector quantization. IEEE Trans. Circuits Syst. Analog. Digit. Signal Process. 1993, 40, 576–579. [Google Scholar] [CrossRef]
  29. Guan, L.; Kamel, M. Equal-average hyperplane partitioning method for vector quantization of image data. Pattern Recognit. Lett. 1992, 13, 693–699. [Google Scholar] [CrossRef]
  30. Baek, S.; Bae, M.; Sung, K.M. A fast vector quantization encoding algorithm using multiple projection axes. Signal Process. 1999, 75, 89–92. [Google Scholar] [CrossRef]
  31. Lin, S.J.; Chung, K.L.; Chang, L.C. An improved search algorithm for vector quantization using mean pyramid structure. Pattern Recognit. Lett. 2001, 22, 373–379. [Google Scholar] [CrossRef]
  32. Lee, C.H. A fast encoding algorithm for vector quantization using difference pyramid structure. IEEE Trans. Commun. 2007, 55, 2245–2248. [Google Scholar] [CrossRef]
  33. Tai, S.C.; Lai, C.C.; Lin, Y.C. Two fast nearest neighbor searching algorithms for image vector quantization. IEEE Trans. Commun. 1996, 44, 1623–1628. [Google Scholar] [CrossRef]
  34. Baek, S.; Sung, K.M. Two fast nearest neighbor searching algorithms for vector quantization. IEICE Trans. Fundam. Electron. 2001, 84, 2569–2575. [Google Scholar]
  35. Jolliffe, I.T.; Cadima, J. Principal component analysis: A review and recent developments. Philos. Trans. R. Soc. Math. Phys. Eng. Sci. 2016, 374, 1–16. [Google Scholar] [CrossRef]
  36. Johnson, S.C. Hierarchical clustering schemes. Psychometrika 1967, 32, 241–254. [Google Scholar] [CrossRef]
  37. Ding, C.; He, X. K-means clustering via principal component analysis. In Proceedings of the Twenty-First International Conference on Machine Learning, Banff, AB, Canada, 4–8 July 2004; Volume 2004, pp. 225–232. [Google Scholar]
  38. Press, W.H.; Flannery, B.P.; Teukolsky, S.A.; Vetterling, W.T. Numerical Recipes in C; Cambridge University Press: New York, NY, USA, 1988. [Google Scholar]
  39. Baek, S.-J.; Park, A.; Ahn, Y.-J.; Choo, J. Baseline correction using asymmetrically reweighted penalized least squares smoothing. Analyst 2015, 140, 250–257. [Google Scholar] [CrossRef] [Green Version]
Figure 1. Ratio of cumulative eigenvalues for experimental data.
Mathematics 08 01970 g001
Figure 2. Example of Raman cluster groups.
Mathematics 08 01970 g002
Figure 3. Four examples from experimental Raman spectra.
Mathematics 08 01970 g003
Figure 4. Flowchart of proposed method.
Mathematics 08 01970 g004
Figure 5. Average number of multiplications and additions operations of major algorithms.
Mathematics 08 01970 g005
Table 1. Mechanical specifications of four instruments.
SpectrometerLaser Power (mW)Excitation Wavelength (nm)Resolution (cm 1 )
FT-Raman spectrometer400–6001064 1.93
Renishaw 2000 1.0 514.5 4
In Via 1.0 632.8 1
In Via 1.0 785.0 1
Table 2. Computational complexity of PCT + PDS method according to number of PCs.
Number of PCsMultiplicationAdditionTotal
303,273,9176,432,7429,706,659
601,491,5342,770,3814,261,916
90931,5571,551,7562,483,313
120831,1301,251,9592,083,090
150822,1301,135,9481,958,565
180876,7101,145,1222,021,832
210959,9131,212,5052,172,418
2501,086,4001,333,4422,419,842
Table 3. Computational complexity according to number of clusters.
Number of ClustersMultiplicationAdditionTotal
20632,883763,4421,396,325
40602,683703,1781,305,861
60588,113673,9751,262,088
80581,968661,8001,243,768
100586,407669,7251,256,132
Table 4. CS results according to number of PCs.
Number of PCs20406080100120150
Multiplication1,819,135782,677511,867433,801456,492494,360581,968
Addition3,535,6981,409,010810,673593,138574,391584,993661,800
Total5,354,8332,191,6871,322,5401,026,9391,030,8831,079,3531,243,768
Cluster skip5.87818.41433.22443.91549.59252.39854.501
Element skip71.43760.32646.19435.81630.26727.51325.444
Table 5. Average number of multiplications and additions according to number of PCs.
Pilot SearchCS
MultiplicationAdditionMultiplicationAdditionTotal
CS (80 PCs)00433,801593,1381,026,939
PS (5 PCs) + CS (80 PCs)58,64860,183274,026290,293683,150
PS (10 PCs) + CS (80 PCs)72,12576,495257,469273,685679,774
PS (20 PCs) + CS (80 PCs)102,251109,281225,152242,060678,744
PS (30 PCs) + CS (80 PCs)130,474140,501192,393209,552672,920
PS (40 PCs) + CS (80 PCs)158,978171,389160,586178,948669,721
PS (50 PCs) + CS (80 PCs)190,741206,155130,535151,853679,284
Table 6. Average number of multiplication and addition operations of each algorithm.
MethodMultiplicationAdditionTotal
Full Search46,480,50092,946,915139,427,415
Full Search + PDS8,846,89417,679,70426,526,598
MPS1D3,582,50450,501,33354,083,837
MPS1D + PDS1,210,60211,012,97212,223,574
MPS1D_Sort + PDS853,7734,520,6425,374,415
PCT + PDS (150 PCs)822,6171,135,9481,958,565
CS (150 PCs)581,968661,8001,246,768
CS (80 PCs)433,801593,1381,026,939
PS (40 PCs) + CS (80 PCs)319,385350,336669,721
Publisher’s Note: MDPI stays neutral with regard to jurisdictional claims in published maps and institutional affiliations.