Abstract
The stability of receiver operating characteristic in context of random split used in development and validation sets, as compared to the full models for three inflammatory ratios (neutrophil-to-lymphocyte (NLR), derived neutrophil-to-lymphocyte (dNLR) and platelet-to-lymphocyte (PLR) ratio) evaluated as predictors for metastasis in patients with colorectal cancer, was investigated. Data belonging to patients admitted with the diagnosis of colorectal cancer from January 2014 until September 2019 in a single hospital were used. There were 1688 patients eligible for the study, 418 in the metastatic stage. All investigated inflammatory ratios proved to be significant classification models on both the full models and on cross-validations (AUCs > 0.05). High variability of the cut-off values was observed in the unrestricted and restricted split (full models: 4.255 for NLR, 2.745 for dNLR and 255.56 for PLR; random splits: cut-off from 3.215 to 5.905 for NLR, from 2.625 to 3.575 for dNLR and from 134.67 to 335.9 for PLR), but with no effect on the models characteristics or performances. The investigated biomarkes proved limited value as predictors for metastasis (AUCs < 0.8), with largely sensitivity and specificity (from 33.3% to 79.2% for the full model and 29.1% to 82.7% in the restricted splits). Our results showed that a simple random split of observations, weighting or not the patients with and whithout metastasis, in a ROC analysis assures the performances similar to the full model, if at least 70% of the available population is included in the study.
1. Introduction
The receiver operating characteristic (ROC) has been introduced in medicine as a methodological tool used for the investigation of signal detection [1,2,3]. The method uses the probability of correct detection (as a binary outcome) against the probability of a false positive outcome. The ROC detection method has been widely adopted in medicine and it is used to confirm (rule-in) or exclude (rule-out) the presence of a disease, as instruments of triage, monitorization, prognosis or screening [4]. The ROC analysis is particularly used in laboratory medicine to identify the threshold able to discriminate pathological versus normal values of biomarkers [5,6,7,8], images in radiology [9,10,11,12] or accounts in bioinformatics [13,14,15]. The methodology of ROC analysis is extensively described in the scientific literature, with emphasize on the need of a gold standard method in order to certify the presence/absence of the disease, to understand the effects of verification bias (application of the test only on those with known disease status [16,17]) or to verify indices and metrics of accuracy (also known as classification performances) [4,9,18,19,20,21]. A gold standard or reference test is defined as the best available method able to classify the subjects as presenting or not a certain disease [22]. Most of the time, the available reference method is not necessarily a perfect method of classification, so we have an imperfect standard [23] and the effects of the measurement errors have already been evaluated [24,25]. Latent class models (LCM), which combined multiple test results to estimate the accuracy of a test in the absence of a reference standard have also been proposed and their utility proved [26,27,28].
The concept of big data provides the input data for uni- and multivariate association towards precision medicine [29]. New methods and learning algorithms emerged for analysis, medical data interpretation [30] and the main challenges are validation and replication. The classification model is identified in a training or development set and validated on a validation set [31]. The cross-validation, repeatedly randomised division of a dataset into development and validation sets, is applied to test the efficiency of the model on validation of external data [31,32,33]. Several cross-validation approaches, such as leave-one-out (LOO—one observation is left out of the development set) [34], leave-p-out (p observations are left out of the development set) [35], k-fold (the sample is split in k equal size sub-samples and one sub-sample is being repeated k-times, the one used for validation) [36], bootstrap method [37] or holdout method (also known as random splitting—observations are randomly split into two sets, development and validation set) [38] are used.
Colorectal cancer is the third most common type of cancer in men and second in women. The death rate from colorectal cancer is 8.5%. Surgical resection remains the only curative option for these patients, although a number of them develop metastases in the first five years after surgery [39]. Tumour size, tumour location, venous invasion, degree of differentiation proved valuable abilities to correctly predict local recurrences, metastasis and survival rate of colorectal cancer patients [40]. New biomarkers, such as chemokine ligand 7 (CXCL7) serum concentration have been tested for diagnostic accuracy [41], but the costs of such new biomarkers are generally higher than the conventional ones and health insurance systems do not support them. Consequently, a low-cost and time-bound predictor would be desirable. Pine et al. showed that tumour progression and prognosis are bound to tumour characteristics, as well as to the inflammatory response [42]. The inflammatory response is reflected by the level of neutrophils, lymphocytes, platelets, albumin and C-reactive protein, their measurement being current practice. Neutrophil-to-lymphocyte ratio (NLR), platelet-to-lymphocyte ratio (PLR), lymphocyte-to-monocyte ratio (LMR) along with others, proved predictors for survival of patients with colorectal cancer [43,44,45]. Xia et al. reported NLR (cut-off = 2.8, AUC (Area Under the Curve) = 0.711, p = 0.007), LMR (cut-off = 3.9, AUC = 0.679, p = 0.023) and PNI (Prognostic Nutritional Index, cut-off = 47.1, AUC = 0.746, p = 0.002) as predictors for post-operative complications in patients with T1-T2 rectal cancer [46]. NLR (cut-off = 2.15, AUC = 0.790, 95% CI (0.736 to 0.884), CI = confidence interval) and PLR (cut-off = 123, AUC = 0.846, 95% CI (0.801 to 0.891)) presented performance as diagnostic markers for colorectal cancer as reported by Stojkovic Lalosevic [47]. Different cut-off values of the biomarkers are reported in the range from moderate to low performances [43,44,45,46,47,48,49,50]. In the light of the state-of-the-art, our goals were two-folded, first to evaluate the performances of ROC models using three ratios associated with metastasis on unrestricted and restricted random cross-validation and secondly, to demonstrate the impact of these two randomizations approaches on the performances of the classification models.
2. Materials and Methods
The study was conducted according to the principles of the Declaration of Helsinki. It was approved by the Ethical Committee of “Iuliu Hațieganu” University of Medicine and Pharmacy Cluj-Napoca (approval no. 492/21.11.2019) and the Ethical Committee of “Prof. Dr. Octavian Fodor” Regional Institute of Gastroenterology and Hepatology Cluj-Napoca (approval no. 17517/20.12.2019). All participants signed the written informed consent before enrolment in the study.
2.1. Dataset
The dataset was represented by a retrospective collection of absolute neutrophil, lymphocyte, leucocyte, platelet counts of patients amitted at Third Surgical Clinic, “Prof. Dr. Octavian Fodor” Regional Institute of Gastroenterology and Hepatology Cluj-Napoca with the diagnosis of colorectal cancer from January 2014 until September 2019. The presence of metastasis was the outcome variable in this study. The metastatic stage was documented by imaging explorations, namely computer tomography (CT), magnetic resonance imaging (MRI) or contrast enhanced ultrasound. Raw data belonging to the patients with histopathological diagnosis of colorectal cancer were evaluated. Records with incomplete data (e.g., laboratory results, TNM classification of the disease—T size or extent of the primary tumor, N degree of spread to regional lymph nodes, and M presence of distant metastasis) were excluded.
The absolute counts were the input data for calculation of the following ratios, used as predictors of metastasis in this study:
where NLR neutrophil-to-lymphocyte ratio, dNLR = derived neutrophil-to-lymphocyte ratio and PLR = platelet-to-lymphocyte ratio.
NLR = (absolute neutrophil count)/(absolute lymphocyte count)
dNLR = (absolute neutrophil count)/[(absolute leucocyte count) − (absolute neutrophil count)]
PLR = (absolute platelet count)/(absolute lymphocyte count)
2.2. Methods
The receiver operating characteristic (ROC) analysis was conducted using three scenarios to test the classification abilities of the predictive models incorporating the studied ratios, which are presented in Equations (1)–(3) regarding the presence of metastasis (Figure 1):
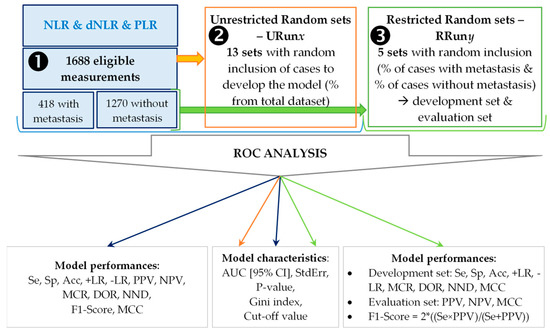
Figure 1.
Flowchart of the applied methodology. NLR = neutrophil-to-lymphocyte ratio; dNLR = derived neutrophil-to-leucocyte ratio; PLR = platelet-to-lymphocyte ratio; Se = sensitivity; Sp = specificity; Acc = accuracy; +LR = positive likelihood ratio; +LR = negative likelihood ratio; PPV = positive predictive value; NPV = negative predictive value; MCR = miss-classification rate; DOR = diagnostic odds ratio; NND = number needed to diagnose; MCC = Matthews correlation coefficient; AUC = area under the curve; [95%CI] = lower bound to upper bound of the AUC 95% confidence interval; StdErr = standard error.
- First scenario (➊): the whole sample was used to generate the classification model, the control model.
- Second scenario (➋): thirteen random sets were generated (1688 patients) by specifying the desired percentage of subjects and used to identify the classification models. No restrictions were imposed regarding the percentage of patients with and without metastasis and for this reason the generated sets were named unrestricted (URunx, where 1 ≤ x ≤ 13). The following percentages were used: 70% for URun01, 65% for URun02, 60% for URun03, 55% for URun04, 50% for URun05, 45% for URun06, 40% for URun07, 35% for URun08, 30% for URun09, 25% for URun10, 20% for URun11, 15% for URun12, 10% for URun13.
- Third scenario (➌): five sets, each with a development and validation group were randomly generated by weighting the percentage of patients with and without metastasis. These sets were name restricted (RRuny, 1 ≤ y ≤ 5; with 70% in development set & 30% in validation set). The model was generated using the development set (Se, Sp, Acc-Accuracy) and tested on validation set (PPV—Positive Predictive Value and NPV—Negative Predictive Value).
The performances of the models were evaluated whenever the AUC proved statistically significant and the Gini index (GI) was higher than 0 (GI equal with 0 indicates a random model). Ten metrics (see Figure 1) were used to prove the accuracy of a classification model. The sensitivity and specificity, important metrics widely used to show models accuracy [4,5,11,14,51,52]. The F1-score (2 × ((Se × PPV)/(Se + PPV))) was calculated by combining the performances in the development set with those in the validation set in restricted runs. Matthews correlation coefficient (MCC = (TP × TN − FP × FN)/√[(TP + FP) × (TP + FN) × (TN + FP) × (TN + FN)]) confers a more suitable balance to all four confusion matrix categories (TP—true positive, TN—true negative, FP—false positive, FN—false negative) and it is considered a more specific score [53], compared to the model accuracy or F1-Score, which are overoptimistic estimators [54].
The ROC analysis was conducted with SPSS v. 26 (trial version) under the non-parametric assumptions. The cut-off value for each biomarker in each run was used to create a derivate dichotomial variable (presence of metastasis for values equal to or higher than the cut-off). Youden’s index (J = max), which maximizes the distance from the diagonal (random classification model) [55] was used to identify the cut-off values. The tangent method (d = √((1 − Se)2 + (1 − Sp)2)), d = min) [56] was also used to identify the cut-off values in the control model. The observed confusion matrix was generated and the true positive (TP), false positive (FP), false negative (FN) and true negative (TN) values were used to calculate the performances of the models using the following online resource: https://statpages.info/ctab2x2.html (accessed 3 August 2020). Clinical utility index (CUI) was calculated for the control model using the online resource available at http://www.clinicalutility.co.uk/ (accessed 30 September 2020). A fair utility for case-finding (+CUI) or screening (-CUI) is seen if 0.49 ≤ CUI < 0.69, a good utility if 0.69 ≤ CUI < 0.81 and an excellent utility if CUI ≥ 0.81 [57].
3. Results
3.1. First Scenario: Full Predictive Models
Significant contribution in identifying the presence of metastasis (AUC significantly different by 0.5) was identified for all investigated ratios, when the whole sample was used (Table 1).

Table 1.
Characteristics of the full (control) models.
The performances metrics of the control models showed modest or low classification abilities of the investigated ratios (Table 2), NLR being the most performant biomarker for metastasis.
Table 2.
Performances of the (control) models (reported in Table 1).
3.2. Second Scenario: Unrestricted Random Samples
At least one unrestricted random sample retrieves the same Youden’s cut-off value for each investigated ratios as the full predicted model (URun01 for NLR and dNLR; URun02 for dNLR; URun05 for PLR; see Table 1 and Table 3).
Table 3.
Number of total subjects in the run, distribution among those with and without metastasis, cut-off values and models characteristics for unrestricted random samples.
3.3. Third Scenario: Restricted Random Samples
The classification models in cross-validation, with 70% of the available data in the development set and 30% in the validation set, showed similar performances of AUCs for NLR and dNLR (p-values in the same range), but with AUCs close to 0.5 for PLR (in all RRuny, Table 4).
Table 4.
Models characteristics in restricted random samples.
The true positive, true negative, false positive and false negative in restricted random samples varied in the same way in the development and validation sets (Table 5). The above-mentioned values varied between runs in different amounts, ranging, for example, in the case of true positives from a difference between maximum and minimum form of 3.4% observed for PLR and 46.2% observed for AGR (Table 5).
Table 5.
Number and frequencies of true positive, true negative, false positive and false negative in the restricted random samples according to run.
The cross-validation ROC analysis applied on restricted random samples identified the NLR and dNLR as the most potent markers for metastasis according to the highest F1-Score (Table 6). However, better performances are obtained when the whole sample was investigated for NLR and dNLR, while on the opposite, better performances are obtained in cross-validation for PLR, all of them showing the instability of the classification model dictated by the input data (Table 2 and Table 6).
Table 6.
Models performances in restricted random samples according to run.
The visual representation of the AUCs for each scenario related to the full model for NLR, dNLR, and PLR showed higher variability in the case of unrestricted random samples (Figure 2). The AUC representation of each run as compared to the full model is available in the Supplementary Material (Figures S1–S3).
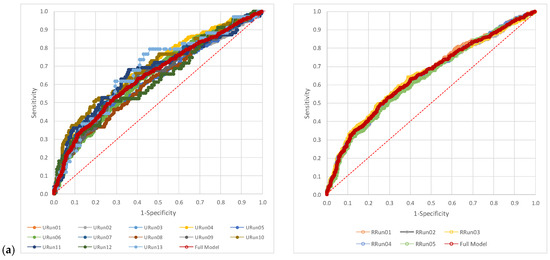
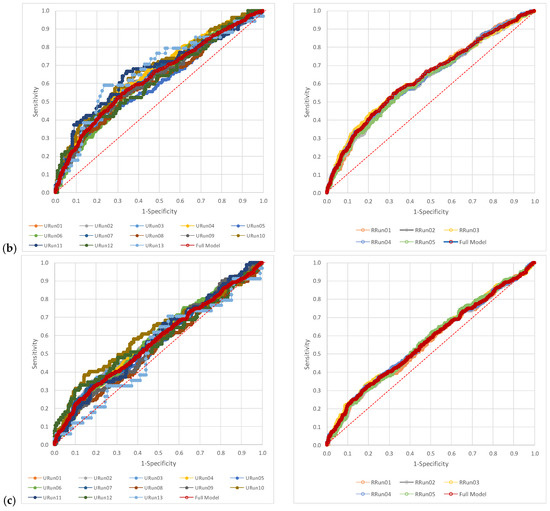
Figure 2.
The pattern of the AUCs: (a) neutrophil-to-lymphocyte ratio (NLR), (b) derived neutrophil-to-leucocyte ratio (dNLR), and (c) platelet-to-lymphocyte ratio (PLR). URun refers to unrestricted cross-validation, RRun refers to restricted cross validation.
4. Discussion
4.1. Summary of Main Findings
Cross-validation with random split of the data set under restrictions, namely respecting the proportion of those with and without metastasis, showed that the ROC classification models of the investigated ratios had low variability reported to the full mode. The variability of ROC classification models in the unrestricted samples is very similar to the full model, when almost 70% of cases are in the development set with identical cut-off for 4/5 ratios (excepting PLR). For all other unrestricted samples, higher variability of the AUC was observed as compared to the restricted samples (Figure 2, Figures S1–S3).
4.2. Findings Discussion
The cut-off values are different, when different methods are used (Table 1), as expected and this affects the number of absolute frequencies in the confusion matrix. The Youden index maximizes both sensitivity and specificity and retrives higher cut-off values for our dataset, as compared to minimization of the distance to the point with (0,1) coordinates. The number of false positives increases and the number of false negatives decreases, when the cut-off values are identified by the Tanget method as compare with the Youden’s index, which reflectes on both Se (increases) and Sp (decreases), but without significant effects on the LRs or CUIs (Table 2). Even if the Tangent method showed superiority in identification of the true cut-off value [58], this was not observed in our sample. Despite the method used to define the threshold values, there are very poor case-findings. NLR and dNLR are fair for screening, while PLR is poor for screening (Table 2). On the other hand, they are not recommended as biomarkers for metastatis in patients with colorectal cancer.
As expected, different cut-off values were observed with few exceptions in both restricted and unrestricted cross-validation approaches (Table 1, Table 3 and Table 4). Generally, not only for the unrestricted, but also for the restricted cross-validation, the cut-off values were lower than those of the full model. It resulted exactly the opposite for dNLR and PLR. Different cut-off values reported in cross-validation (Table 3 and Table 4) indicate a variability, most probably caused by the characteristics of the included observations (the input data) and it has been observed in previously reported researches on patients with colorectal cancer [47,48,49,50].
The characteristics of the models were similar for both scenarios, with the AUCs values confined in the confidence interval of the AUC of the full model, without exception and with the AUC of the full model confined in the confidence interval of each individual classification model, regardless of the approach applied (Table 1, Table 3 and Table 4). Opposite significances of the AUCs in unrestricted cross-validation in comparison to the full model was observed for PLR (2/13 classification models, one model that included 35.4% subject from the cohort and the other one that included 15.4%). The consistency of the significance across different samples indicates the stability of the classification models for the investigated ratios and the presence of metastasis as the outcome.
The cut-off values for 4/5 ratios were identical with those of the full model for the first unrestricted run, with almost 70% of subjects randomly selected for the development set. The relative value of the cut-off value from the full model ((Cut-Offmodel-Cut-Offfull-model)/Cut-Offfull-model × 100) was generally lower for the restricted models as compared to the unrestricted model. It can be explained by the small differences for those runs with ~70% of observations in the development sets. A pattern is observed, when the cut-off values are investigated. There are lower cut-off values in the majority of the cases for NLR (61.5% in the unrestricted and 80% in the restricted) and higher cut-off values for dNLR (61.5% in the unrestricted runs and 100% in the restricted runs) or PLR (53.8% in the unrestricted runs and 80% in the restricted runs). The cut-off values are reflected in the number of TP, TN, FN and FN and thus in the performances of the classification model (Table 2 and Table 6). The evaluation of the full model performances showed that none of the investigated ratios is a good predictor for metastasis on patients with colorectal cancer (Table 2), with low +LR, high -LR, a relatively high misclassification rate and MCC values less than 0.25. The low performances of the classification model are also observed on restricted cross-validation (Table 6), supporting the results reported by Martens et al. [59], namely that small changes in AUCs bring small changes in performances of the classification model. The ROC analysis is used to overcome this shortcoming, namely poor correlation of one predictor with a certain outcome, in order to find the threshold for classification and, based on the threshold, to consecutively identify a multivariable predictive model [42,43,44,45,46,47,48,49,50,60,61]. A small number of articles reported the threshold for the investigated inflammatory ratios on patients with colorectal cancer regarding metastasis as the outcome. Anuk and Yıldırım reported a cut-off value for PLR equal to 194.7 for liver metastasis (Se = 74.5.%, Sp = 72.7%) and of 163.95 (Se = 56.8%, Sp = 56.3%) for lymph node tumour cells invasion [62] on a sample of 152 patients. The thresholds for PLR reported in this study are higher than those reported by Anuk and Yıldırım [62], nonetheless the specificity is higher at the expense of sensitivity (Table 2 and Table 6). In our study we did not devided into the type of metastasis, but the differences in thresholds and Se(s) are important and could be possible explained by the characteristics of the target population. Guo et al. showed a large variability of PLR (25.4 to 300) thresholds in the evaluation of survival of the patients with colorectal cancer [45]. High PLR was associated with poor overall survival and high LMR was associated with favourable overall survival. The different cut-off values reported by Guo et al. should be explain by different population included in the analysis of the primary researches [45]. This explanation is also supported by the results reported by Xia et al. on a sample of 154 patients with T1-2 rectal cancer with cut-off of 2.8 for NLR and of 140.0 for PLR, when the primary outcome was considered death and the secondary one it was the occurrence of postoperative complications [46]. Peng et al. reported the optimal cut-off values of 4.63 for NLR (AUC = 0.568, 95%CI (0.477 to 0.660), p = 0.152) and 150.17 for PLR (AUC = 0.518, 95%CI (0.424 to 0.611), p = 0.707) on patients with colorectal cancer liver metastasis only [63]. The optimal cut-off values reported in this study are different by the those previously reported in the scientific literature. However, larger studies are needed to find the explanation for the reported thresholds and models performances.
The use of area under the ROC curve (AUC) in the assessment of classification model performances is known to be biased especially for small samples [64,65,66,67,68] and different cross-validation approaches have been proposed for model validation. The cross-validation approaches are usually used when computer algorithms are applied to identify the best performing classification model [64,65,66,67,68,69]. Moreover, leave-pair-out (LPO) cross-validation showed low bias in AUC estimation [70]. In our study, we applied cross-validation outside the computer algorithm in identification of the classification model and the unrestricted random sample with 70% of observations in the development set and it proved similar performances with the restricted cross-validation also with 70% of observations in the development set (Table 1, Table 2, Table 3 and Table 5, Figures S1–S3). Our result supports thus the conclusion that, for large samples, an appropriate random sample with inclusion in the study of 70% of eligible subjects will closely reflect the target available population. Similarly, for large samples, the experimental design is the key factor for a valid ROC classification model, so the dictum “Garbage in, garbage out” seems true even for large data sets [71].
4.3. Study Limitations
Despite of a rigorous experimental design we need to list some limitations of our study. First limitation refers to the cross-validation methods used. The unrestricted cross-validation method was applied using the options of the program and unfortunately, the split was not saved, thus the performances of the models could not be reported. The simple random sampling proved its ability of appropriate splitting of a dataset in development (training) and validation (test) set, in the context of a predictive liniar multivariate regression model [72]. Furthermore, only two cross-validation methods were applied and the use of other cross-validation methods (e.g., minimum of p-value on the confusion matrix [73], max(Se × Sp) [74], min(|Se − Sp| [75]) could retrieve different cut-off values and thus different performances of classification models. However, since simple random splitting in development and validation sets with ~70% of the observations in the development set and the restricted cross-validation (that also included 70% of the observations in the development sets) perform closely to the full model, no significant changes in terms of clinical utility are expected. Second limitation refers to the number of runs for each scenario, a higher number of runs being able to better reflect the reality. As it could be observed, we decided to report the performances in individual runs, not only to present an average of the performances, which is a common practice, but also to closely monitor at what length the performances differ from each other. Nevertheless, since the classification models showed stability in both restricted and unrestricted cross-validations, we are not expecting significant add-on with the increase in the number of runs. Third limitation is related to the considered outcome. We did not separately evaluated different types of colorectal cancer metastasis (e.g., liver, lung, brain, peritoneum, distant lymph nodes) and it can be expected that the thresholds of the investigated ratios to vary with the type of metastasis. However, for such evaluation we need to expand the time frame for the retrospective evaluation, in order to assure a sufficient number of observations for each type of metastasis. Fourth limitation is related to the investigated inflammatory ratios. Investigation of the behaviour of other inflammatory ratios, such as lymphocyte-to-monocyte ratio, systemic immune inflammation index or prognostic nutritional index is also of interest. All these markers are taken into consideration by our research team and they will be tested for prediction abilities and proof of clinical utility.
5. Conclusions
The investigated ratios proved low clinical utility in predicting metastasis on patients with colorectal cancer. The full models showed fair clinical utility in screening, but the values of positive and negative likelihood ratios did not support their application in clinical settings. The classification models identified in the development sets, regardless of the use of unrestricted or restricted (percentage of patients with and whithout metastasis) random split, showed characteristics and performances similar to the full models. Our results showed that a simple random split of observations, weighting or not the patients with and whithout metastasis, in a ROC analysis assures the performances similar to the full models when at least 70% of the available population is included in the evaluation. Moreover, the sample size of the development set in the case of ROC classification analysis of investigated inflammatory ratios, considered as predictors for metastasis on patients with colorectal cancer, had little interest, in most of the cases, either on the models characteristics or on the models performances. The cut-off values of the investigated scenarios should probably be explained by the characteristics of the input data and are, most likely, linked to the percentage of correct and false classification, but without a significant impact on the models characteristics or performances. This behaviour supports the stability of the classification models in the context of a proper experimental design.
Supplementary Materials
The following are available online at https://www.mdpi.com/2227-7390/8/10/1741/s1, Figure S1: “AUCs of neutrophil-to-lymphocyte ratio (NLR) in unrestricted (URun) and restricted (RRun) cross-validation related to the full model”, Figure S2: “AUCs of derived neutrophil-to-leucocyte ratio (dNLR) on unrestricted (URun) and restricted (RRun) cross-validation related to the full model.”, Figure S3: “AUCs of platelet-to-lymphocyte ratio (PLR) on unrestricted (URun) and restricted (RRun) cross-validation related to the full model”.
Author Contributions
Conceptualization, A.C. and S.D.B.; methodology, S.D.B.; validation, R.A.C., F.G. and V.C.O.; formal analysis, S.D.B.; investigation, A.C., R.A.C.; resources, N.A.H.; data curation, A.C.; writing—original draft preparation, A.C., R.A.C. and S.D.B.; writing—review and editing, A.C., F.G., V.C.O.; visualization, A.C. and F.G.; supervision, S.D.B.; project administration, A.C., N.A.H. and S.D.B. All authors have read and agreed to the published version of the manuscript.
Funding
AC was funded by the Doctoral School of the “Iuliu Hațieganu” University of Medicine and Pharmacy, grant number 2461/8/22/17.01.2020.
Acknowledgments
We gratefully acknowledge the support of the University of Medicine and Pharmacy “Iuliu Hațieganu” Cluj-Napoca, Romania for administrative and technical support.
Conflicts of Interest
The authors declare no conflict of interest.
References
- Egan, J.; Schulman, A.I.; Greenberg, G.Z. Operating Characteristics Determined by Binary Decisions and by Ratings. J. Acoust. Soc. Am. 1959, 31, 768. [Google Scholar] [CrossRef]
- Emmerich, D.S. ROCs obtained with two signal intensities presented in random order, and a comparison between yes-no and rating ROCs. Percept. Psychophys. 1968, 3, 35–40. [Google Scholar] [CrossRef]
- Lusted, L.B. Signal Detectability and Medical Decision-Making. Science 1971, 171, 1217–1219. [Google Scholar] [CrossRef] [PubMed]
- Bolboacă, S.D. Medical Diagnostic Tests: A Review of Test Anatomy, Phases, and Statistical Treatment of Data. Comput. Math. Methods Med. 2019, 2019, 1891569. [Google Scholar] [CrossRef] [PubMed]
- Campbell, G. General methodology I: Advances in statistical methodology for the evaluation of diagnostic and laboratory tests. Stat. Med. 1994, 13, 499–508. [Google Scholar] [CrossRef]
- Li, W.; Luo, S.; Zhu, Y.; Wen, Y.; Shu, M.; Wan, C. C-reactive protein concentrations can help to determine which febrile infants under three months should receive blood cultures during influenza seasons. Acta Paediatr. 2017, 12, 106. [Google Scholar] [CrossRef] [PubMed]
- Kampfrath, T.; Levinson, S.S. Brief critical review: Statistical assessment of biomarker performance. Clin. Chim. Acta 2013, 419, 102–107. [Google Scholar] [CrossRef]
- Wolk, D.M. Clinical and Evidence-Based Research in the Clinical Laboratory. In Clinical Laboratory Management; Garcia, L.S., Ed.; ASM Press: Washington, DC, USA, 2013; pp. 832–848. [Google Scholar] [CrossRef]
- Swets, J.A. ROC Analysis Applied to the Evaluation of Medical Imaging Tests. Investig. Radiol. 1979, 14, 109–121. [Google Scholar] [CrossRef]
- Obuchowski, N.A. Receiver operating characteristic curves and their use in radiology. Radiology 2003, 229, 3–8. [Google Scholar] [CrossRef]
- Gatsonis, C.A. Receiver Operating Characteristic Analysis for the Evaluation of Diagnosis and Prediction. Radiology 2009, 253, 593–596. [Google Scholar] [CrossRef]
- Crivellaro, C.; Landoni, C.; Elisei, F.; Buda, A.; Bonacina, M.; Grassi, T.; Monaco, L.; Giuliani, D.; Gotuzzo, I.; Magni, S.; et al. Combining positron emission tomography/computed tomography, radiomics, and sentinel lymph node mapping for nodal staging of endometrial cancer patients. Int. J. Gynecol. Cancer 2020, 30, 378–382. [Google Scholar] [CrossRef] [PubMed]
- Lasko, T.A.; Bhagwat, J.G.; Zou, K.H.; Ohno-Machado, L. The use of receiver operating characteristic curves in biomedical informatics. J. Biomed. Inf. 2005, 38, 404–415. [Google Scholar] [CrossRef] [PubMed]
- Vihinen, M. How to evaluate performance of prediction methods? Measures and their interpretation in variation effect analysis. BMC Genom. 2012, 13, S2. [Google Scholar] [CrossRef] [PubMed]
- Pahari, S.; Li, G.; Murthy, A.K.; Liang, S.; Fragoza, R.; Yu, H.; Alexov, E. SAAMBE-3D: Predicting Effect of Mutations on Protein–Protein Interactions. Int. J. Mol. Sci. 2020, 21, 2563. [Google Scholar] [CrossRef] [PubMed]
- Fluss, R.; Reiser, B.; Faraggi, D.; Rotnitzky, A. Estimation of the ROC Curve under Verification Bias. Biom. J. 2009, 51, 475–490. [Google Scholar] [CrossRef]
- Alonzo, T.A. Verification Bias—Impact and Methods for Correction when Assessing Accuracy of Diagnostic Tests. Revstat. Stat. J. 2014, 12, 67–83. [Google Scholar]
- Metz, C.E. Basic principles of ROC analysis. Semin. Nucl. Med. 1978, 8, 283–298. [Google Scholar] [CrossRef]
- Shapiro, D.E. The interpretation of diagnostic tests. Stat. Methods Med. Res. 1999, 8, 113–134. [Google Scholar] [CrossRef]
- Zou, K.H.; O’Malley, A.J.; Mauri, L. Receiver-Operating Characteristic Analysis for Evaluating Diagnostic Tests and Predictive Models. Circulation 2007, 115, 654–657. [Google Scholar] [CrossRef]
- Fawcett, T. An introduction to ROC analysis. Pattern Recognit. Lett. 2006, 27, 861–874. [Google Scholar] [CrossRef]
- Versi, E. “Gold standard” is an appropriate term. BMJ 1992, 305, 187. [Google Scholar] [CrossRef] [PubMed]
- Valenstein, P.N. Evaluating diagnostic tests with imperfect standard. Am. J. Clin. Pathol. 1990, 93, 252–258. [Google Scholar] [CrossRef] [PubMed]
- Phelps, C.E.; Hutson, A. Estimating diagnostic test accuracy using a “fuzzy gold standard”. Med. Decis. Mak. 1995, 15, 44–57. [Google Scholar] [CrossRef] [PubMed]
- Johnson, W.O.; Gastwirth, J.L.; Pearson, L.M. Screening without a “gold standard”: The Hui-Walter paradigm revisited. Am. J. Epidemiol. 2001, 153, 921–924. [Google Scholar] [CrossRef] [PubMed]
- Van Smeden, M.; Naaktgeboren, C.A.; Reitsma, J.B.; Moons, K.G.M.; de Groot, J.A.H. Latent class models in diagnostic studies when there is no reference standard—A systematic review. Am. J. Epidemiol. 2014, 179, 423–431. [Google Scholar] [CrossRef]
- Haaksma, M.L.; Calderón-Larrañaga, A.; Olde Rikkert, M.G.M.; Melis, R.J.F.; Leoutsakos, J.M.S. Cognitive and functional progression in Alzheimer disease: A prediction model of latent classes. Int. J. Geriatr. Psychiatry 2018, 33, 1057–1064. [Google Scholar] [CrossRef]
- Wiegand, R.E.; Cooley, G.; Goodhew, B.; Banniettis, N.; Kohlhoff, S.; Gwyn, S.; Martin, D.L. Latent class modeling to compare testing platforms for detection of antibodies against the Chlamydia trachomatis antigen Pgp3. Sci. Rep. 2018, 8, 4232. [Google Scholar] [CrossRef]
- Hulsen, T.; Jamuar, S.S.; Moody, A.R.; Karnes, J.H.; Varga, O.; Hedensted, S.; Spreafico, R.; Hafler, D.A.; McKinney, E.F. From Big Data to Precision Medicine. Front. Med. 2019, 6, 34. [Google Scholar] [CrossRef]
- Cawley, G.C.; Talbot, N.L.C. On Over-fitting in Model Selection and Subsequent Selection Bias in Performance Evaluation. J. Mach. Learn. Res. 2010, 11, 2079–2107. [Google Scholar]
- Bradley, A.P. The use of the area under the ROC curve in the evaluation of machine learning algorithms. Pattern Recognit. 1997, 30, 1145–1159. [Google Scholar] [CrossRef]
- Stone, M. Cross-Validatory Choice and Assessment of Statistical Predictions. J. R. Stat. Soc. Ser. B 1974, 36, 111–147. [Google Scholar] [CrossRef]
- Tao, K.; Bian, Z.; Zhang, Q.; Guo, X.; Yin, C.; Wang, Y.; Zhou, K.; Wane, S.; Shi, M.; Bao, D.; et al. Machine learning-based genome-wide interrogation of somatic copy number aberrations in circulating tumor DNA for early detection of hepatocellular carcinoma. EBioMedicine 2020, 56, 102811. [Google Scholar] [CrossRef] [PubMed]
- Hong, X.; Mitchell, R.J. Backward elimination model construction for regression and classification using leave-one-out criteria. Int. J. Syst. Sci. 2007, 38, 101–113. [Google Scholar] [CrossRef]
- Shao, J. Linear model selection by cross-validation. J. Am. Stat. Assoc. 1993, 88, 486–494. [Google Scholar] [CrossRef]
- Geisser, S. The predictive sample reuse method with applications. J. Am. Stat. Assoc. 1975, 70, 320–328. [Google Scholar] [CrossRef]
- Xie, J.; Qiu, Z. Bootstrap technique for ROC analysis: A stable evaluation of Fisher classifier performance. J. Electron. 2007, 24, 523–527. [Google Scholar] [CrossRef]
- Arlot, S.; Celisse, A. A survey of cross-validation procedures for model selection. Stat. Surv. 2010, 4, 40–79. [Google Scholar] [CrossRef]
- Torre, L.A.; Bray, F.; Siegel, R.L.; Ferlay, J.; Lortet-Tieulent, J.; Jemal, A. Global cancer statistics, 2012. CA Cancer J. Clin. 2015, 65, 87–108. [Google Scholar] [CrossRef]
- Ferlay, J.; Soerjomataram, I.; Dikshit, R.; Eser, S.; Mathers, C.; Rebelo, M.; Parkin, D.M.; Forman, D.; Bray, F. Cancer incidence and mortality worldwide: Sources, methods and major patterns in GLOBOCAN 2012. Int. J. Cancer 2015, 136, 359–386. [Google Scholar] [CrossRef]
- Li, L.; Zhang, L.; Tian, Y.; Zhang, T.; Duan, G.; Liu, Y.; Yin, Y.; Hua, D.; Qi, X.; Mao, Y. Serum Chemokine CXCL7 as a Diagnostic Biomarker for Colorectal Cancer. Front. Oncol. 2019, 9, 921. [Google Scholar] [CrossRef]
- Pine, J.K.; Morris, E.; Hutchins, G.G.; West, N.P.; Jayne, D.G.; Quirke, P.; Prasad, K.R. Systemic neutrophil-to-lymphocyte ratio in colorectal cancer: The relationship to patient survival, tumour biology and local lymphocytic response to tumour. Br. J. Cancer 2015, 113, 204–211. [Google Scholar] [CrossRef] [PubMed]
- Azab, B.; Mohammad, F.; Shah, N.; Vonfrolio, S.; Lu, W.; Kedia, S.; Bloom, S.W. The value of the pretreatment neutrophil lymphocyte ratio vs. platelet lymphocyte ratio in predicting the long-term survival in colorectal cancer. Cancer Biomark. 2014, 14, 303–312. [Google Scholar] [CrossRef] [PubMed]
- Li, Y.; Wu, H.; Xing, C.; Hu, X.; Zhang, F.; Peng, Y.; Li, Z.; Lu, T. Prognostic evaluation of colorectal cancer using three new comprehensive indexes related to infection, anemia and coagulation derived from peripheral blood. J. Cancer 2020, 11, 3834–3845. [Google Scholar] [CrossRef] [PubMed]
- Guo, Y.H.; Sun, H.F.; Zhang, Y.B.; Liao, Z.J.; Zhao, L.; Cui, J.; Wu, T.; Lu, J.R.; Nan, K.J.; Wang, S.H. The clinical use of the platelet/lymphocyte ratio and lymphocyte/monocyte ratio as prognostic predictors in colorectal cancer: A meta-analysis. Oncotarget 2017, 8, 20011–20024. [Google Scholar] [CrossRef] [PubMed]
- Xia, L.J.; Li, W.; Zhai, J.C.; Yan, C.W.; Chen, J.B.; Yang, H. Significance of neutrophil-to-lymphocyte ratio, platelet-to-lymphocyte ratio, lymphocyte-to-monocyte ratio and prognostic nutritional index for predicting clinical outcomes in T1–2 rectal cancer. BMC Cancer 2020, 20, 208. [Google Scholar] [CrossRef] [PubMed]
- Stojkovic, L.M.; Pavlovic, M.A.; Stankovic, S.; Stojkovic, M.; Dimitrijevic, I.; Radoman, V.I.; Lalic, D.; Milovanovic, T.; Dumic, I.; Krivokapic, Z. Combined Diagnostic Efficacy of Neutrophil-to-Lymphocyte Ratio (NLR), Platelet-to-Lymphocyte Ratio (PLR), and Mean Platelet Volume (MPV) as Biomarkers of Systemic Inflammation in the Diagnosis of Colorectal Cancer. Dis. Markers 2019, 2019, 6036979. [Google Scholar] [CrossRef]
- Haram, A.; Boland, M.R.; Kelly, M.E.; Bolger, J.C.; Waldron, R.M.; Kerin, M.J. The prognostic value of neutrophil-to-lymphocyte ratio in colorectal cancer: A systematic review. J. Surg. Oncol. 2017, 115, 470–479. [Google Scholar] [CrossRef]
- Oflazoglu, U.; Alacacioglu, A.; Somali, I.K.; Yuce, M.; Buyruk, M.A.; Varol, U.; Salman, T.; Taskaynatan, H.; Yildiz, Y.; Kucukzeybek, Y.; et al. Prognostic value of neutrophil/lymphocyte ratio (NLR), platelet/lymphocyte ratio (PLR) and mean platelet volume (MPV) in patients with colorectal carcinoma [Izmir OncologyGroup (IZOG) study]. Ann. Oncol. 2016, 27, 149–206. [Google Scholar] [CrossRef]
- Ying, H.; Deng, Q.; He, B.; Pan, Y.; Wang, F.; Sun, H.; Chen, J.; Liu, X.; Wang, S. The prognostic value of preoperative NLR, d-NLR, PLR and LMR for predicting clinical outcome in surgical colorectal cancer patients. Med. Oncol. 2014, 31, 305. [Google Scholar] [CrossRef]
- Liu, C.; White, M.; Newell, G. Measuring and comparing the accuracy of species distribution models with presence absence data. Ecography 2011, 34, 232–243. [Google Scholar] [CrossRef]
- Powers, D.M.W. Evaluation: From Precision, Recall and F-Score to ROC, Informedness, Markedness & Correlation. J. Mach. Learn. Tech. 2011, 2, 37–63. [Google Scholar]
- Chicco, D.; Jurman, G. The advantages of the Matthews correlation coefficient (MCC) over F1 score and accuracy in binary classification evaluation. BMC Genom. 2020, 21, 6. [Google Scholar] [CrossRef] [PubMed]
- Sokolova, M.; Japkowicz, N.; Szpakowicz, S. Proceedings of Advances in Artificial Intelligence (AI 2006), Lecture Notes in Computer Science, F-Score and ROC: A Family of Discriminant Measures for Performance Evaluation; Springer: Heidelberg, Germany, 2006; p. 4304. [Google Scholar]
- Youden, W.J. Index for rating diagnostic tests. Cancer 1950, 3, 32–35. [Google Scholar] [CrossRef]
- Hwang, Y.-T.; Hung, Y.-H.; Wang, C.C.; Terng, H.-J. Finding the optimal threshold of a parametric ROC curve undera continuous diagnostic measurement. Revstat. Stat. J. 2018, 16, 23–43. [Google Scholar]
- Mitchell, A.J. Sensitivity × PPV is a recognized test called the clinical utility index (CUI+). Eur. J. Epidemiol. 2011, 26, 251–252. [Google Scholar] [CrossRef] [PubMed]
- Rota, M.; Antolini, L. Finding the optimal cut-point for Gaussian and GAMma distributed biomarkers. Comput. Stat. Data Anal. 2014, 69, 1–14. [Google Scholar] [CrossRef]
- Martens, F.K.; Tonk, E.C.M.; Kers, J.G.; Janssens, A.; Cecile, J.W. Small improvement in the area under the receiver operating characteristic curve indicated small changes in predicted risks. J. Clin. Epidemiol. 2016, 79, 159–164. [Google Scholar] [CrossRef]
- Walsh, S.R.; Cook, E.J.; Goulder, F.; Justin, T.A.; Keeling, N.J. Neutrophil-lymphocyte ratio as a prognostic factor in colorectal cancer. J. Surg. Onco. 2005, 91, 181–184. [Google Scholar] [CrossRef]
- Dell’Aquila, E.; Cremolini, C.; Zeppola, T.; Lonardi, S.; Bergamo, F.; Masi, G.; Stellato, M.; Marmorino, F.; Schirripa, M.; Urbano, F.; et al. Prognostic and predictive role of neutrophil/lymphocytes ratio in metastatic colorectal cancer: A retrospective analysis of the TRIBE study by GONO. Ann. Oncol. 2018, 29, 924–930. [Google Scholar] [CrossRef]
- Anuk, T.; Yıldırım, A.C. Clinical Value of Platelet-to-Lymphocyte Ratio in Predicting Liver Metastasis and Lymph Node Positivity of Colorectal Cancer Patients. Turk. J. Colorectal. Dis. 2017, 27, 50–55. [Google Scholar] [CrossRef]
- Peng, J.; Li, H.; Ou, Q.; Lin, J.; Wu, X.; Lu, Z.; Yuan, Y.; Wan, D.; Fang, Y.; Pan, Z. Preoperative lymphocyte-to-monocyte ratio represents a superior predictor compared with neutrophil-to-lymphocyte and platelet-to-lymphocyte ratios for colorectal liver-only metastases survival. OncoTargets Ther. 2017, 27, 3789–3799. [Google Scholar] [CrossRef]
- Airola, A.; Pahikkala, T.; Waegeman, W.; De Baets, B.; Salakoski, T. An experimental comparison of cross-validation techniques for estimating the area under the ROC curve. Comput. Stat. Data Anal. 2011, 55, 1828–1918. [Google Scholar] [CrossRef]
- Parker, B.J.; Gunter, S.; Bedo, J. Stratification bias in low signal microarray studies. BMC Bioinform. 2007, 8, 326. [Google Scholar] [CrossRef] [PubMed]
- Molinaro, A.; Simon, R.; Pfeiffer, R. Prediction error estimation: A comparison of resampling methods. Bioinformatics 2005, 21, 3301–3307. [Google Scholar] [CrossRef] [PubMed]
- Braga-Neto, U.M.; Dougherty, E.R. Is cross-validation valid for small-sample microarray classification? Bioinformatics 2004, 20, 374–380. [Google Scholar] [CrossRef]
- Varma, S.; Simon, R. Bias in error estimation when using cross-validation for model selection. BMC Bioinform. 2006, 7, 91. [Google Scholar] [CrossRef]
- Barlow, H.; Mao, S.; Khushi, M. Predicting High-Risk Prostate Cancer Using Machine Learning Methods. Data 2019, 4, 129. [Google Scholar] [CrossRef]
- Perez, I.M.; Airola, A.; Bostrom, P.J.; Jambor, I.; Pahikkala, T. Tournament leave-pair-outcross-validation for receiver operating characteristic analysis. Stat. Methods Med. Res. 2019, 28, 2975–2991. [Google Scholar] [CrossRef]
- Beam, A.L.; Kohane, I.S. Big data and machine learning in health care. JAMA 2018, 319, 1317–1318. [Google Scholar] [CrossRef]
- Bolboacă, S.D. Assessment of Random Assignment in Training and Test Sets using Generalized Cluster Analysis Technique. Appl. Med. Inform. 2011, 28, 9–14. [Google Scholar]
- Miller, R.; Siegmund, D. Maximally selected chi square statistics. Biometrics 1982, 38, 1011–1016. [Google Scholar] [CrossRef]
- Liu, X. Classification accuracy and cut point selection. Stat. Med. 2012, 31, 2676–2686. [Google Scholar] [CrossRef] [PubMed]
- Unal, I. Defining an Optimal Cut-Point Value in ROC Analysis: An Alternative Approach. Comput. Math. Methods Med. 2017, 2017, 3762651. [Google Scholar] [CrossRef] [PubMed]
© 2020 by the authors. Licensee MDPI, Basel, Switzerland. This article is an open access article distributed under the terms and conditions of the Creative Commons Attribution (CC BY) license (http://creativecommons.org/licenses/by/4.0/).