A Center-Rule-Based Neighborhood Search Algorithm for Roadside Units Deployment in Emergency Scenarios


Abstract
1. Introduction
2. Related Work
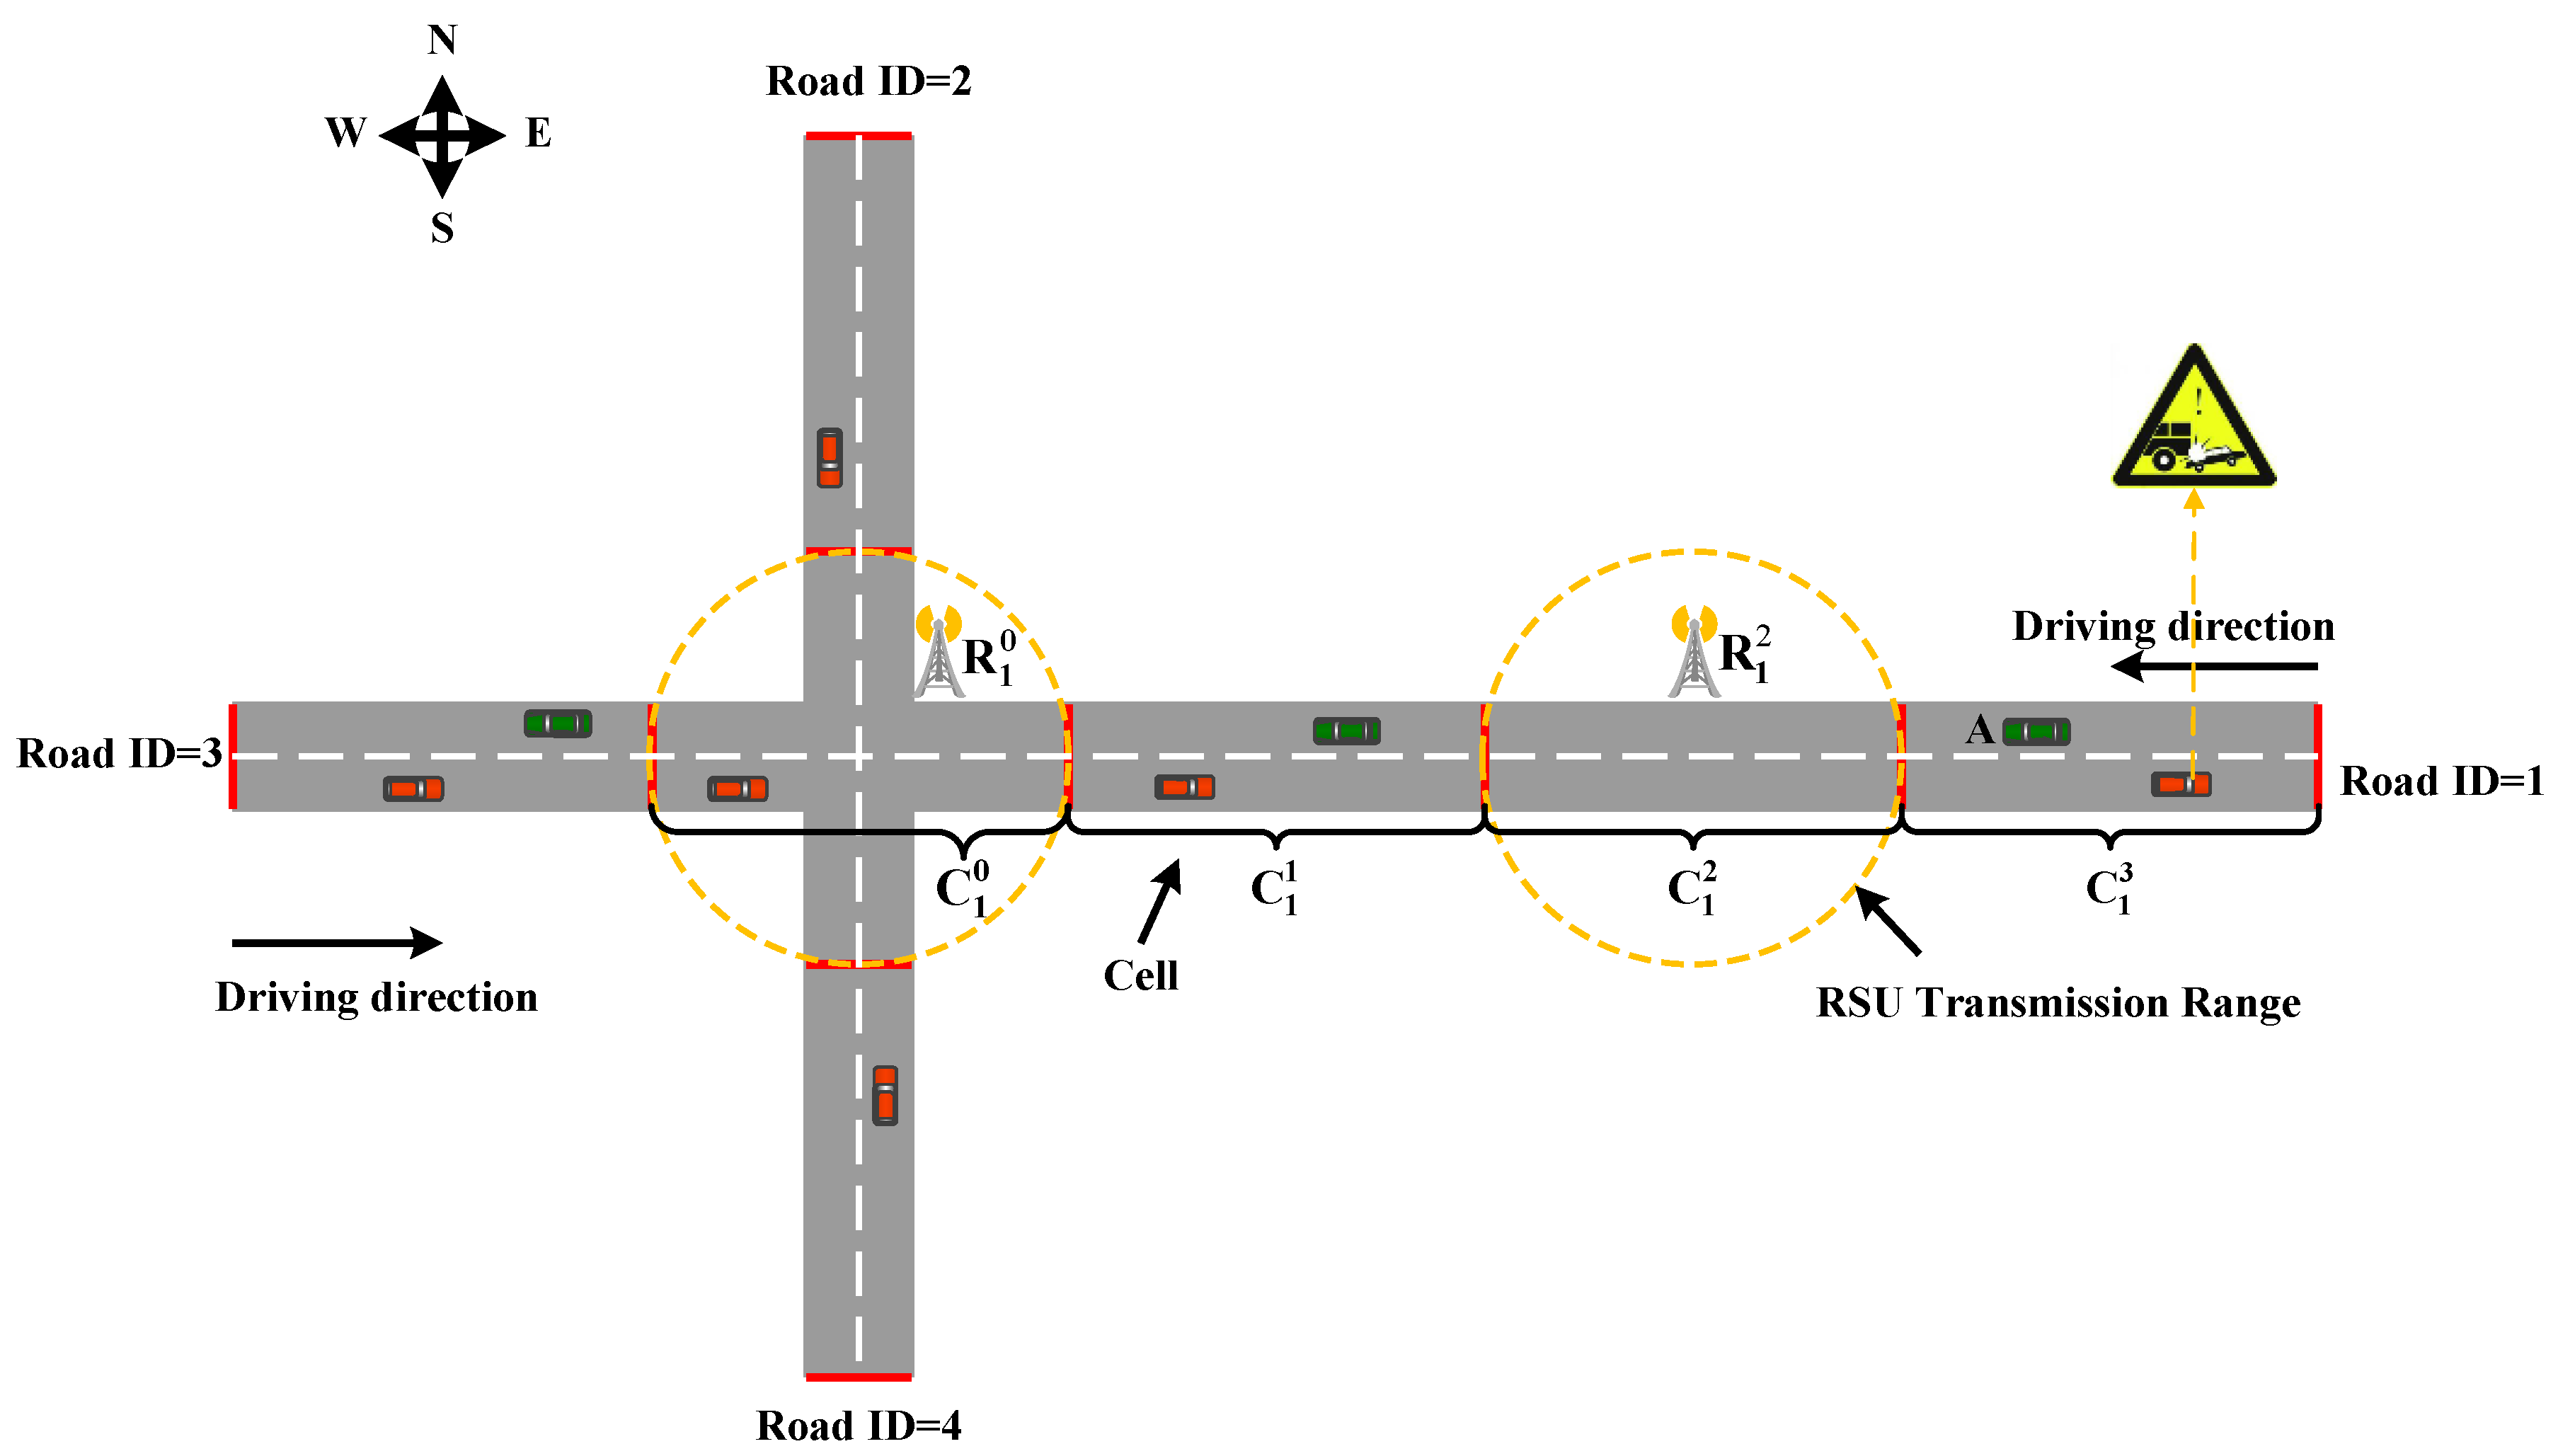
3. Candidate Location Analysis of RSUD
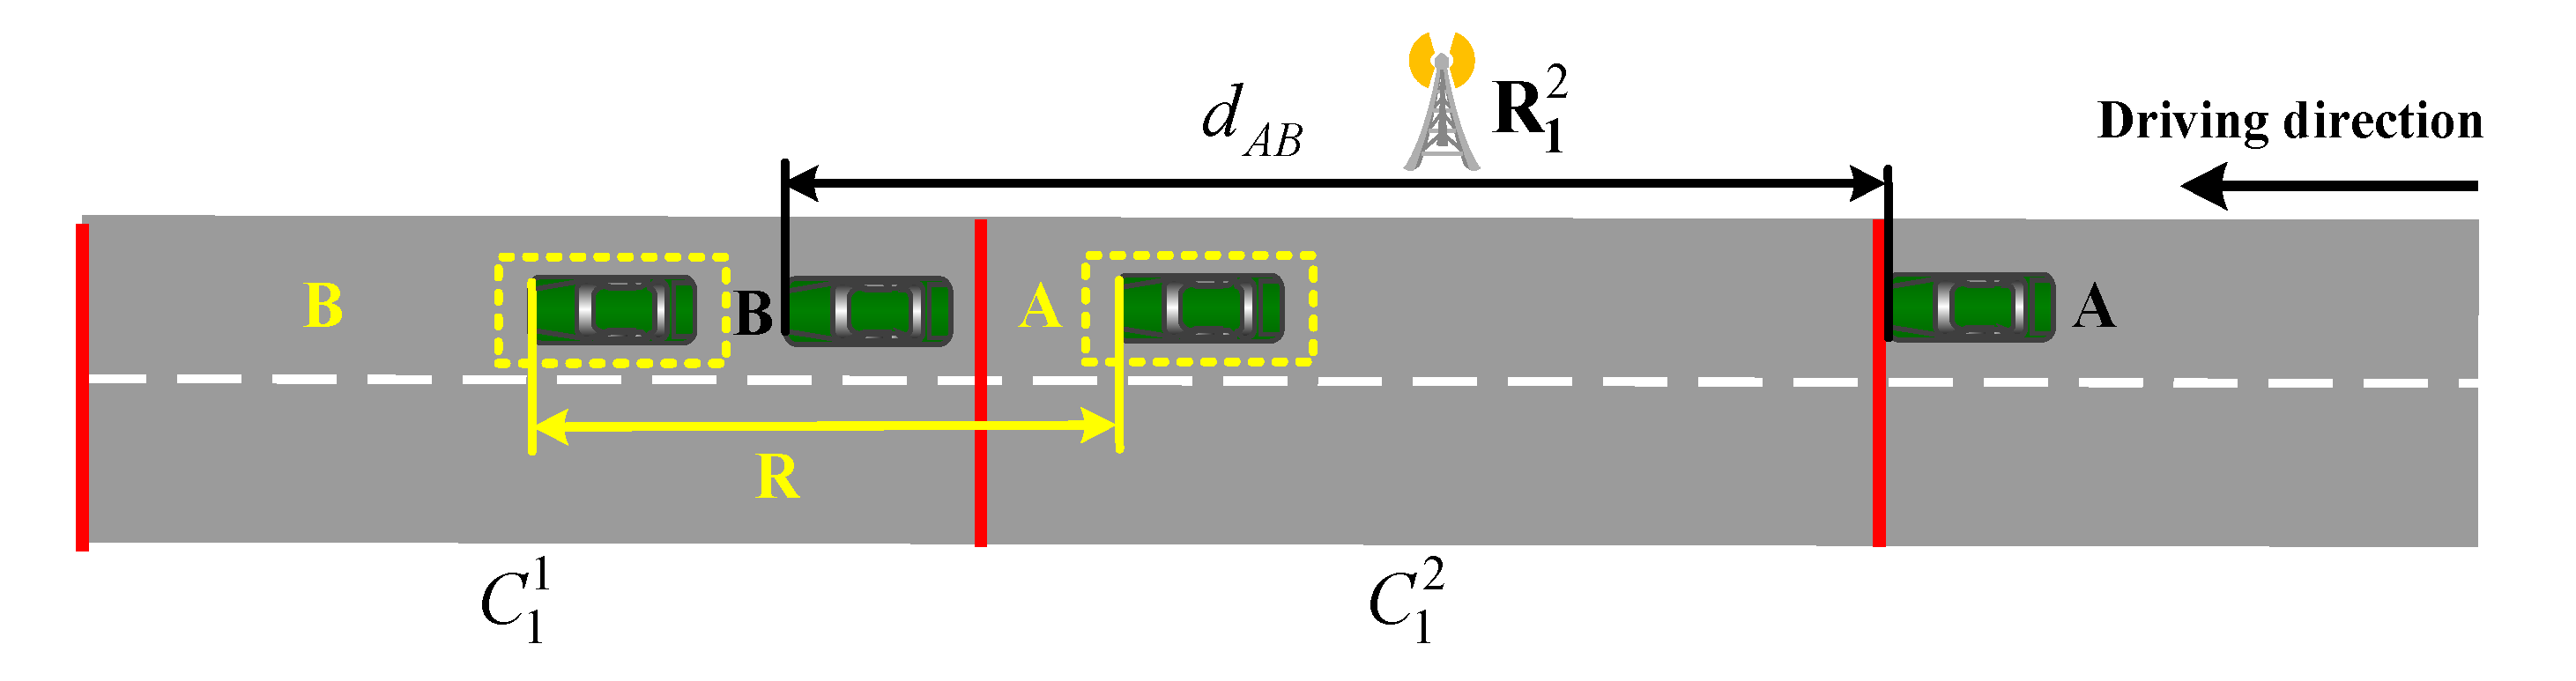
3.1. One RSU in
3.1.1. No vehicles in
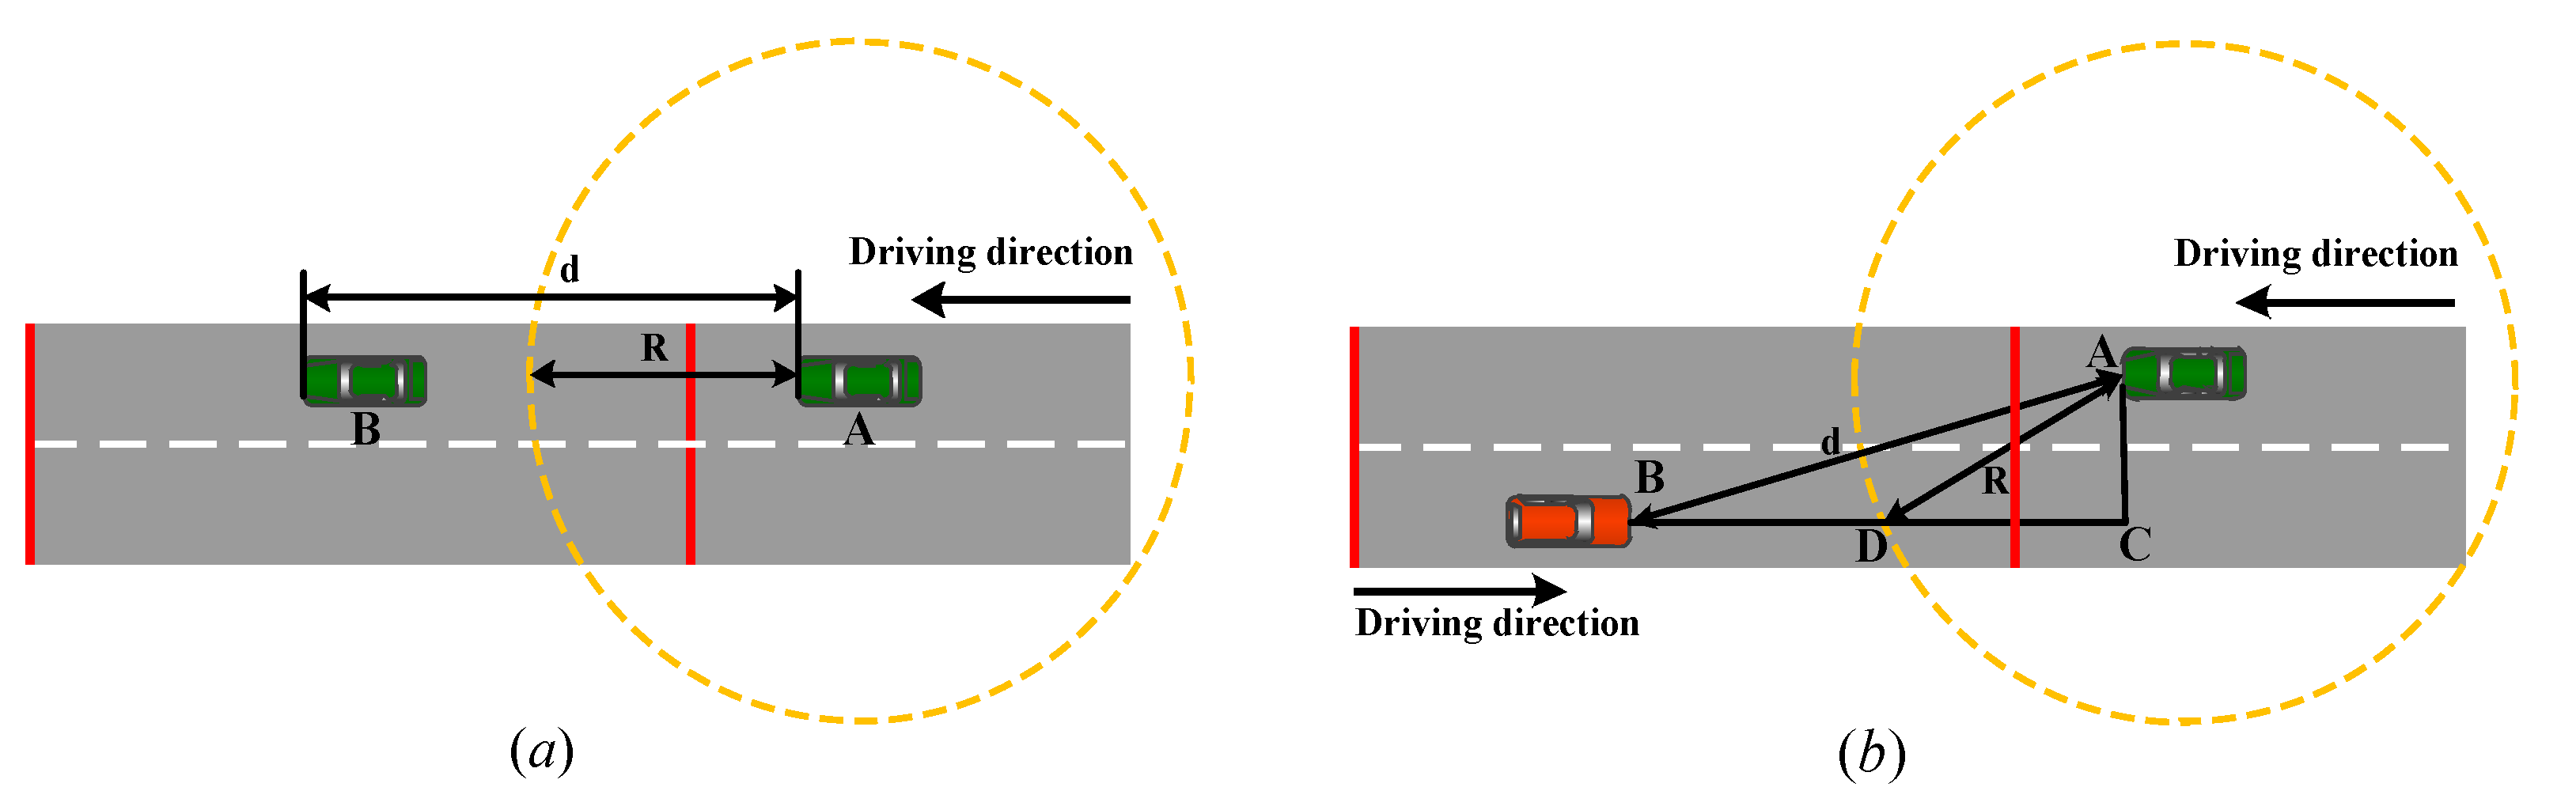
3.1.2. Vehicles in
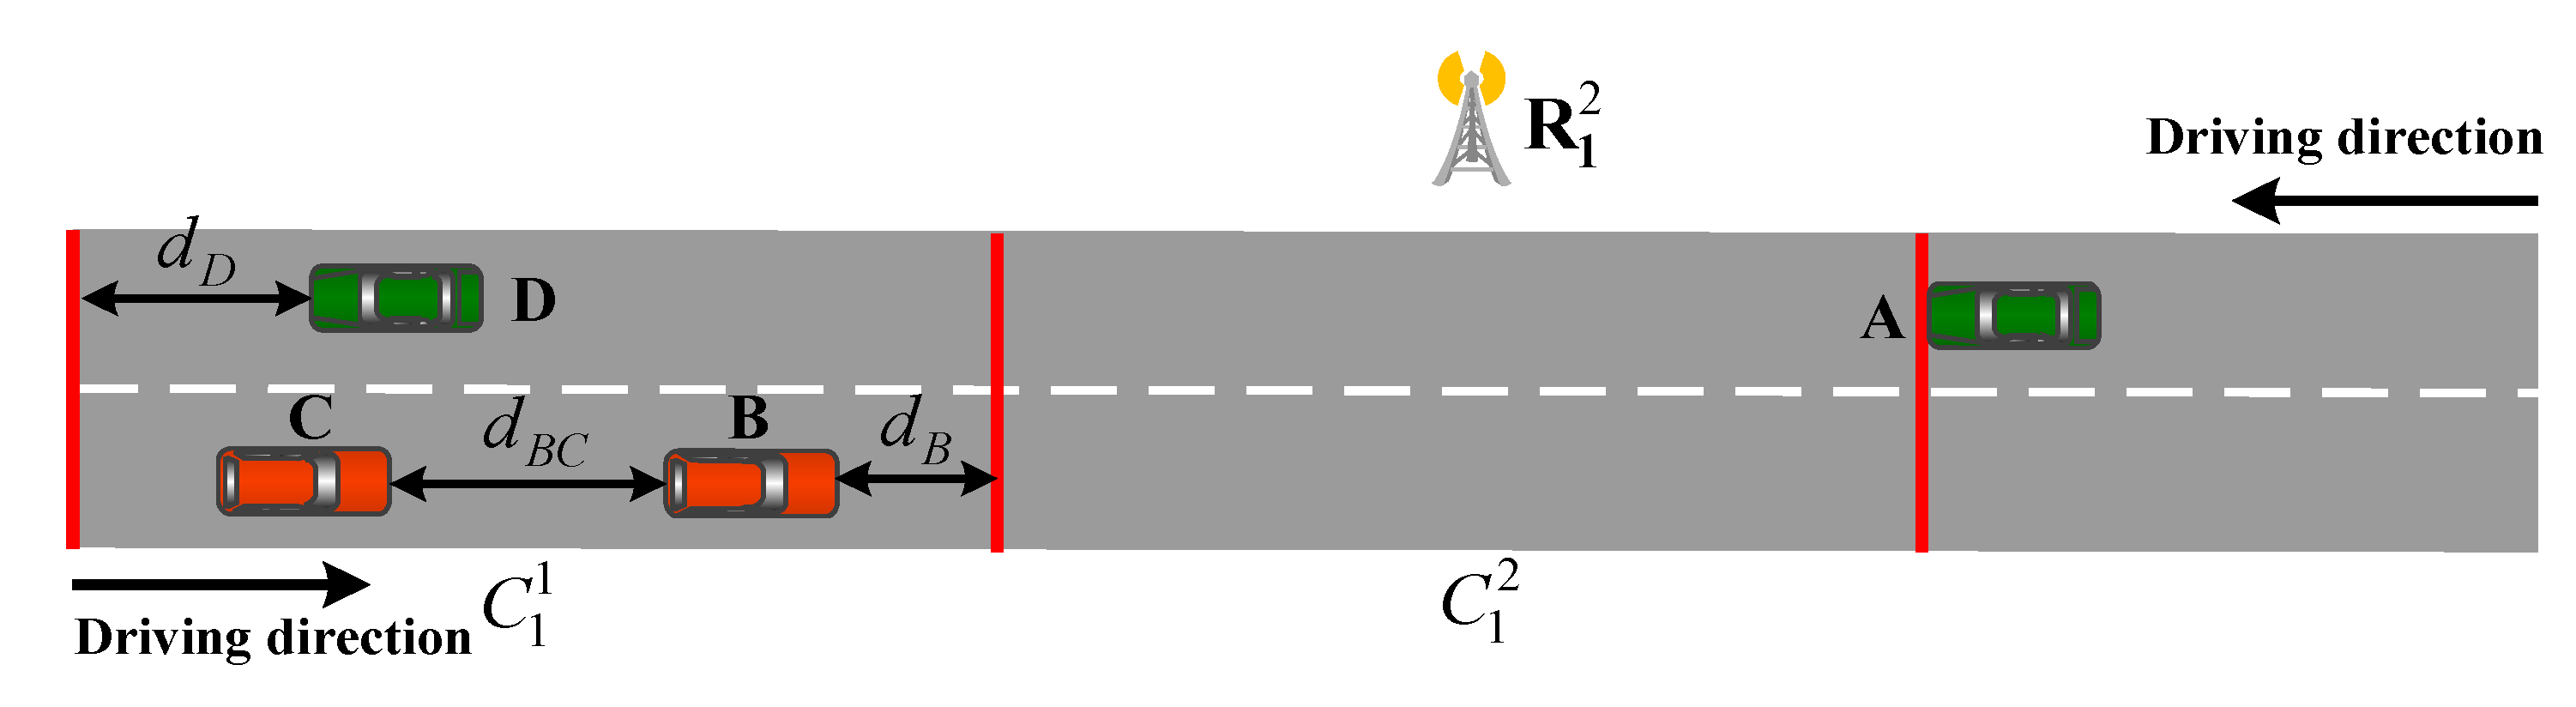
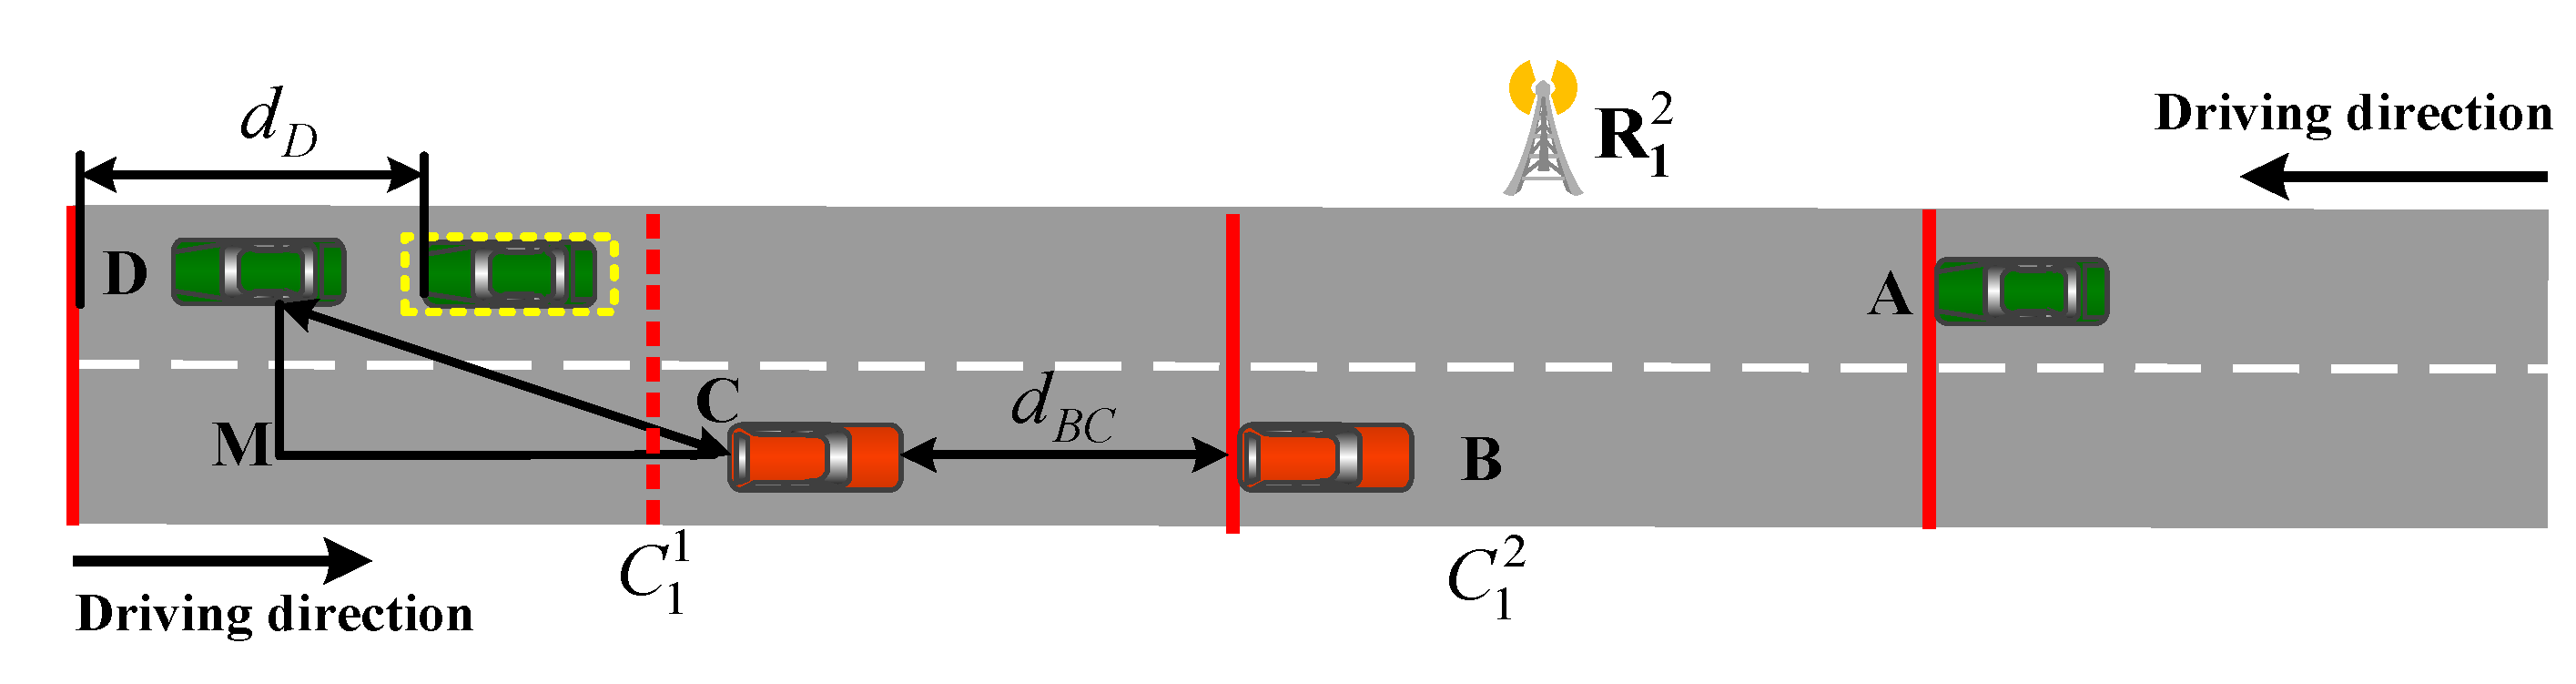
3.2. No RSU in
3.2.1. No vehicles in
3.2.2. Vehicles in
4. Model and Algorithm
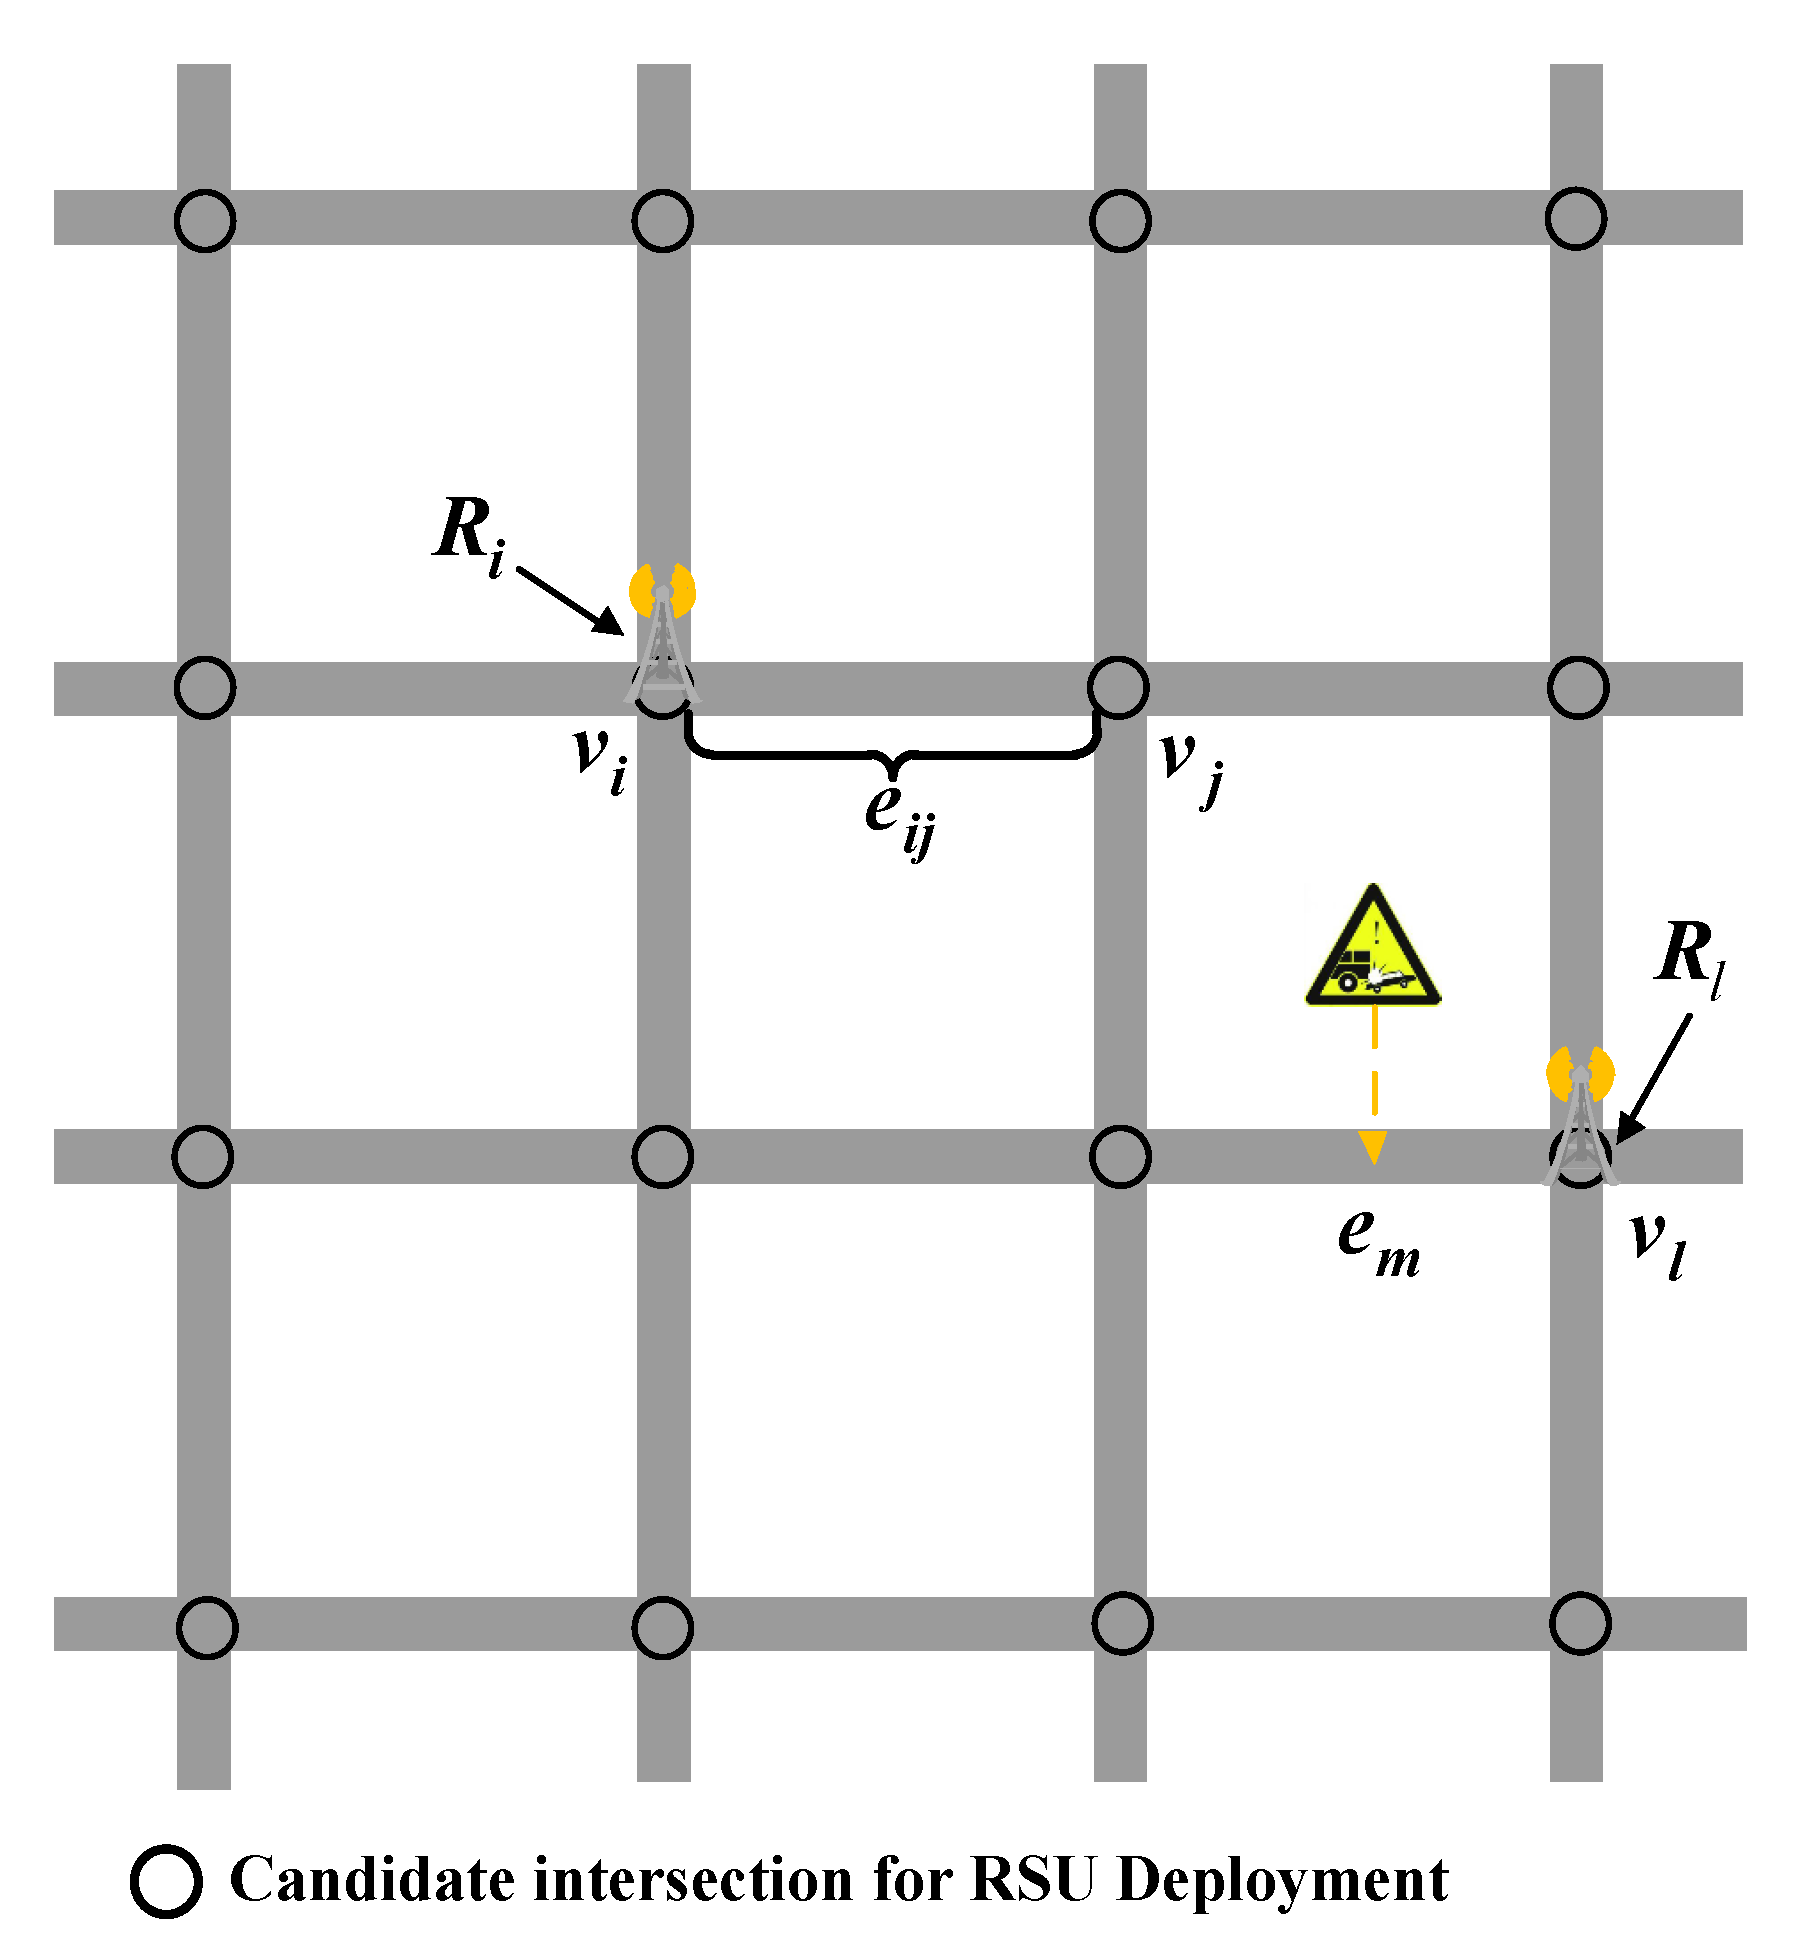
4.1. The Proposed Information Dissemination RSUD Model
| Algorithm 1 Pseudocode for obtaining |
| Input: the of K Output: for i in range(2 × X + 1): | for j in range(2 × X + 1): | | = | | index = 0 | | for k in range(1,K): | | | if then | | | | ; | | | | ; | | | end | | end | | | end end return |
4.2. The Proposed Center-Rule-Based Neighborhood Search Algorithm (CNSA)
| Algorithm 2 Neighborhood Search Algorithm: pseudocode for obtaining the RSUD solution. |
| Input: the initial solutions obtained by using center rule Output: the solution obtained by using our method Search: obtain the of the initial solutions = index = 0 for i in range(1,len()): | if then | | ; | | ; | end end Return Select: obtain the of = index = 0 for i in range(1,len()): | if then | | ; | | ; | end end if then | ; | Repeat ’ Select’ process; end else then | Termination Return |
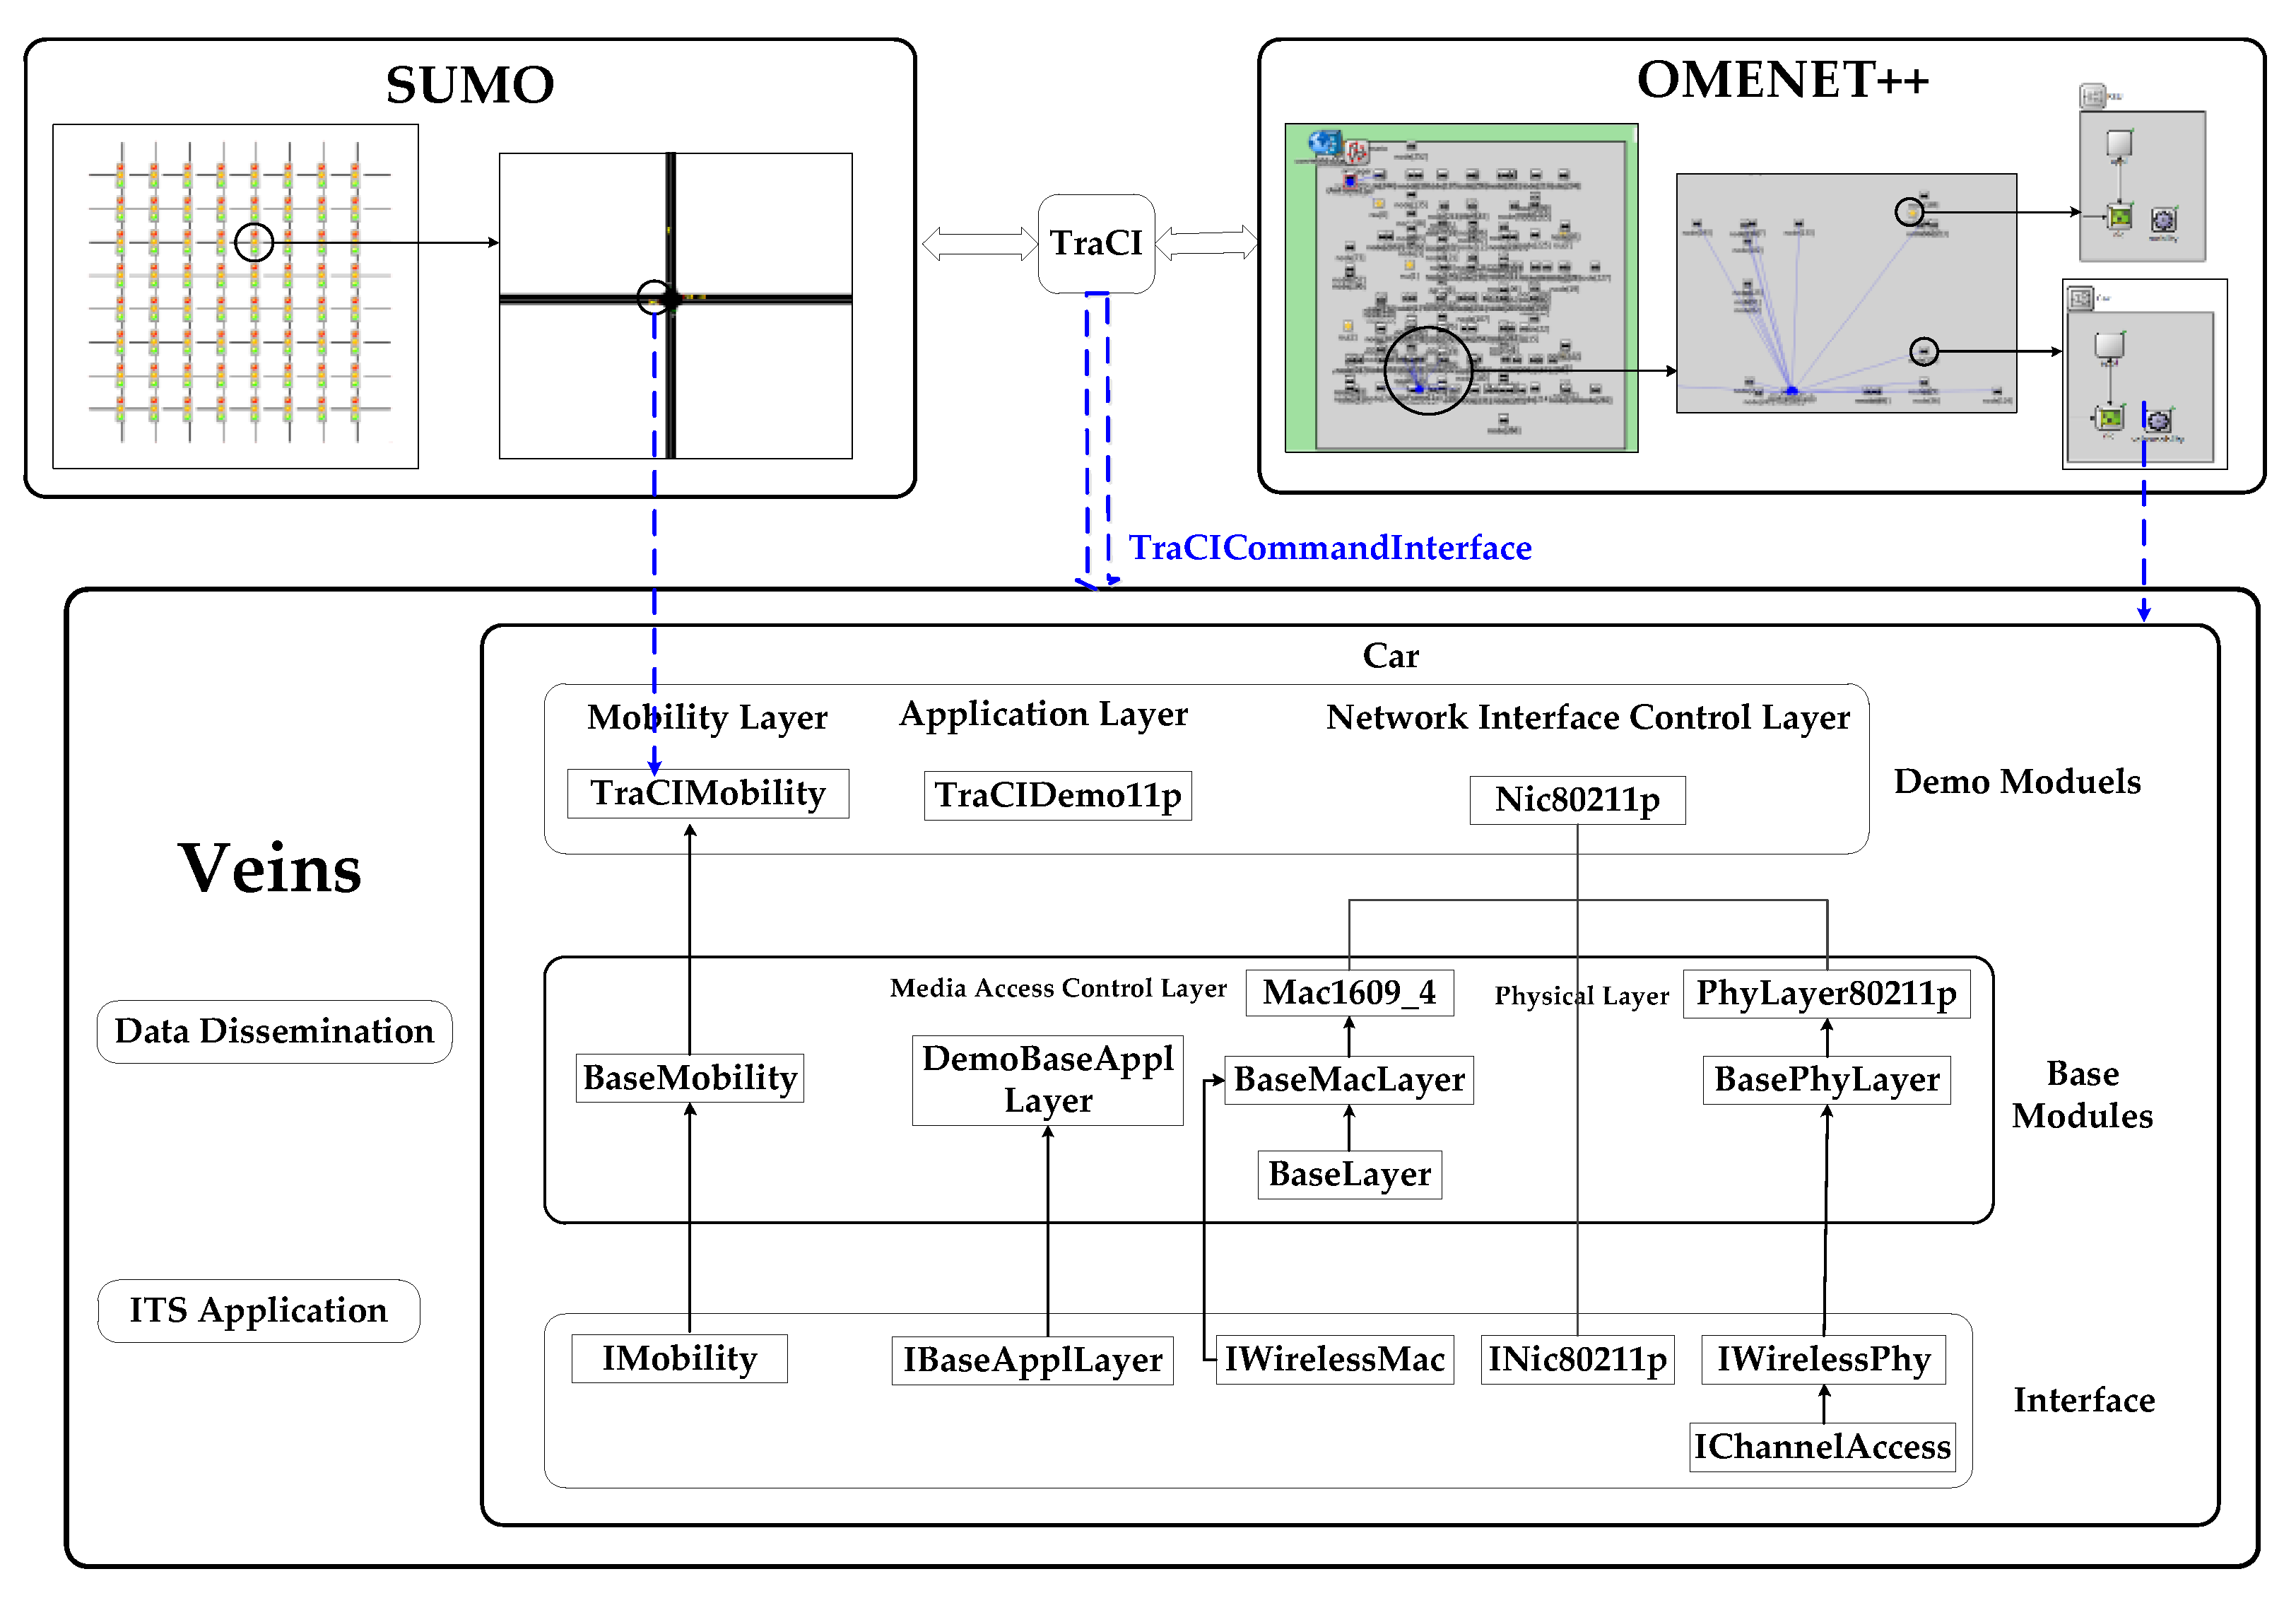
5. Numerical and Simulated Studies
- (1)
- Traffic simulator: road network, road traffic, trips, and routes.
- (2)
- Network simulator: communication protocol stack.
- (3)
- Bidirectionally coupled network and road traffic simulation.
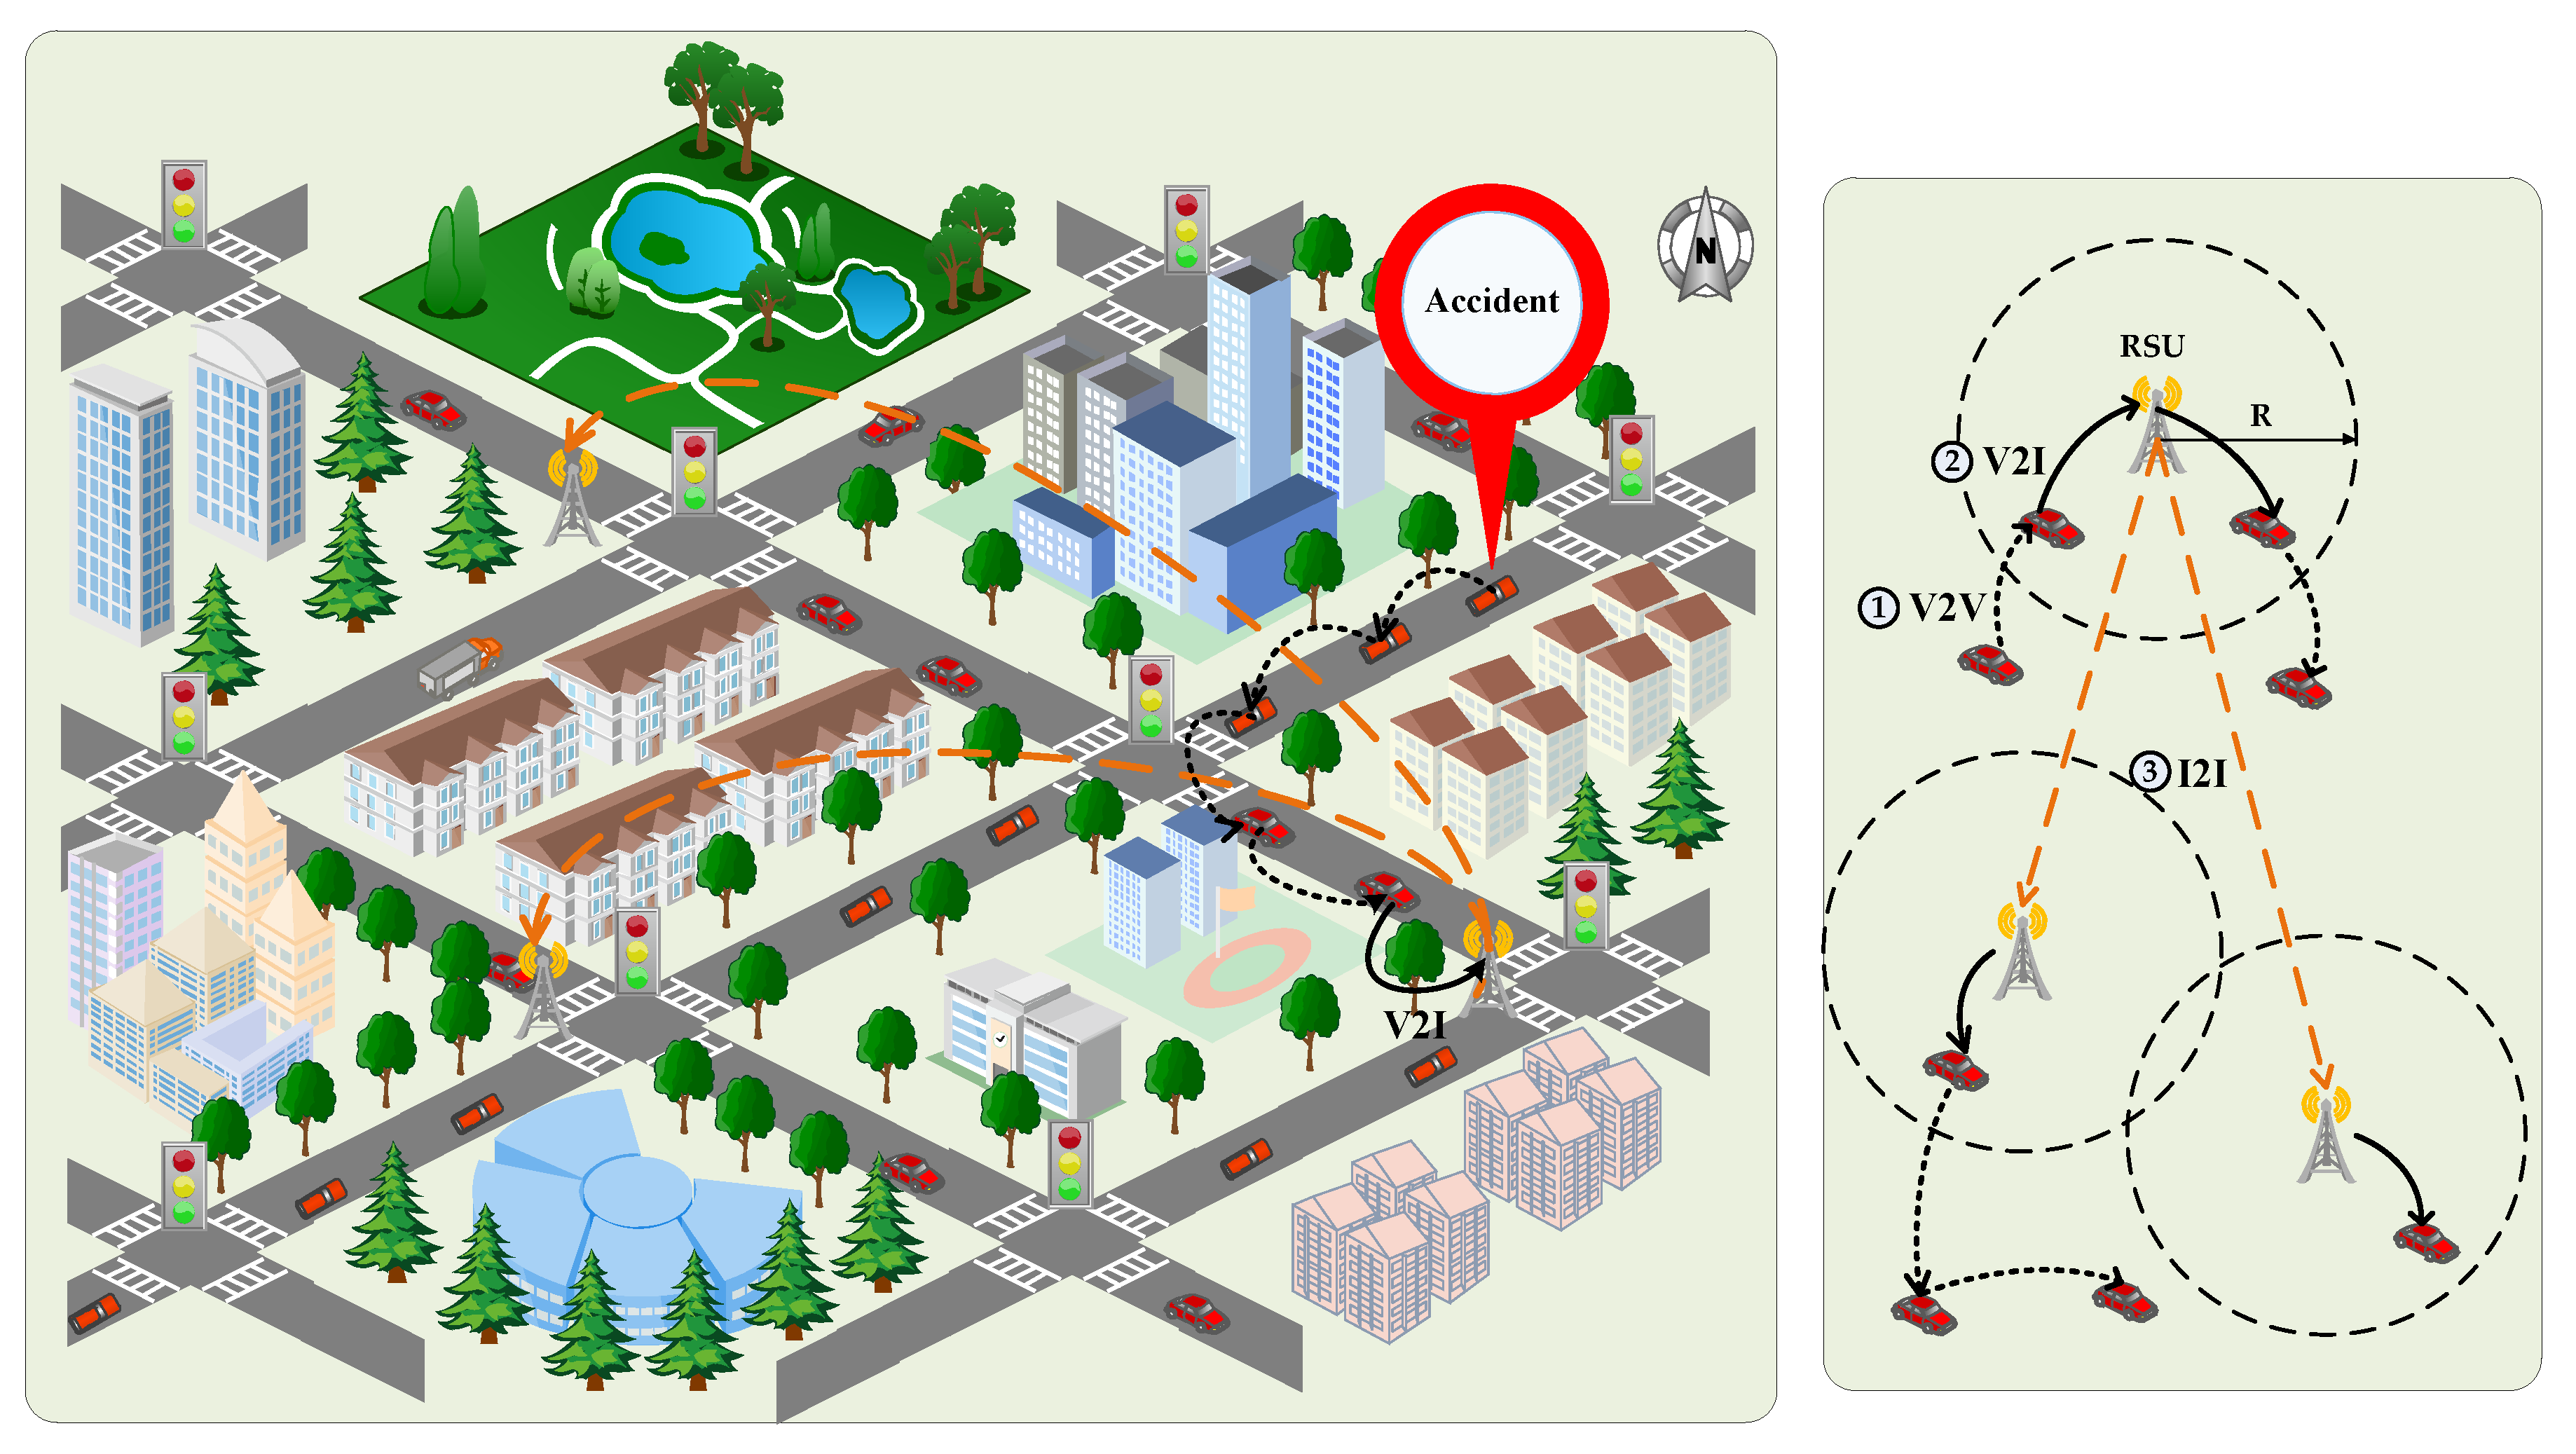
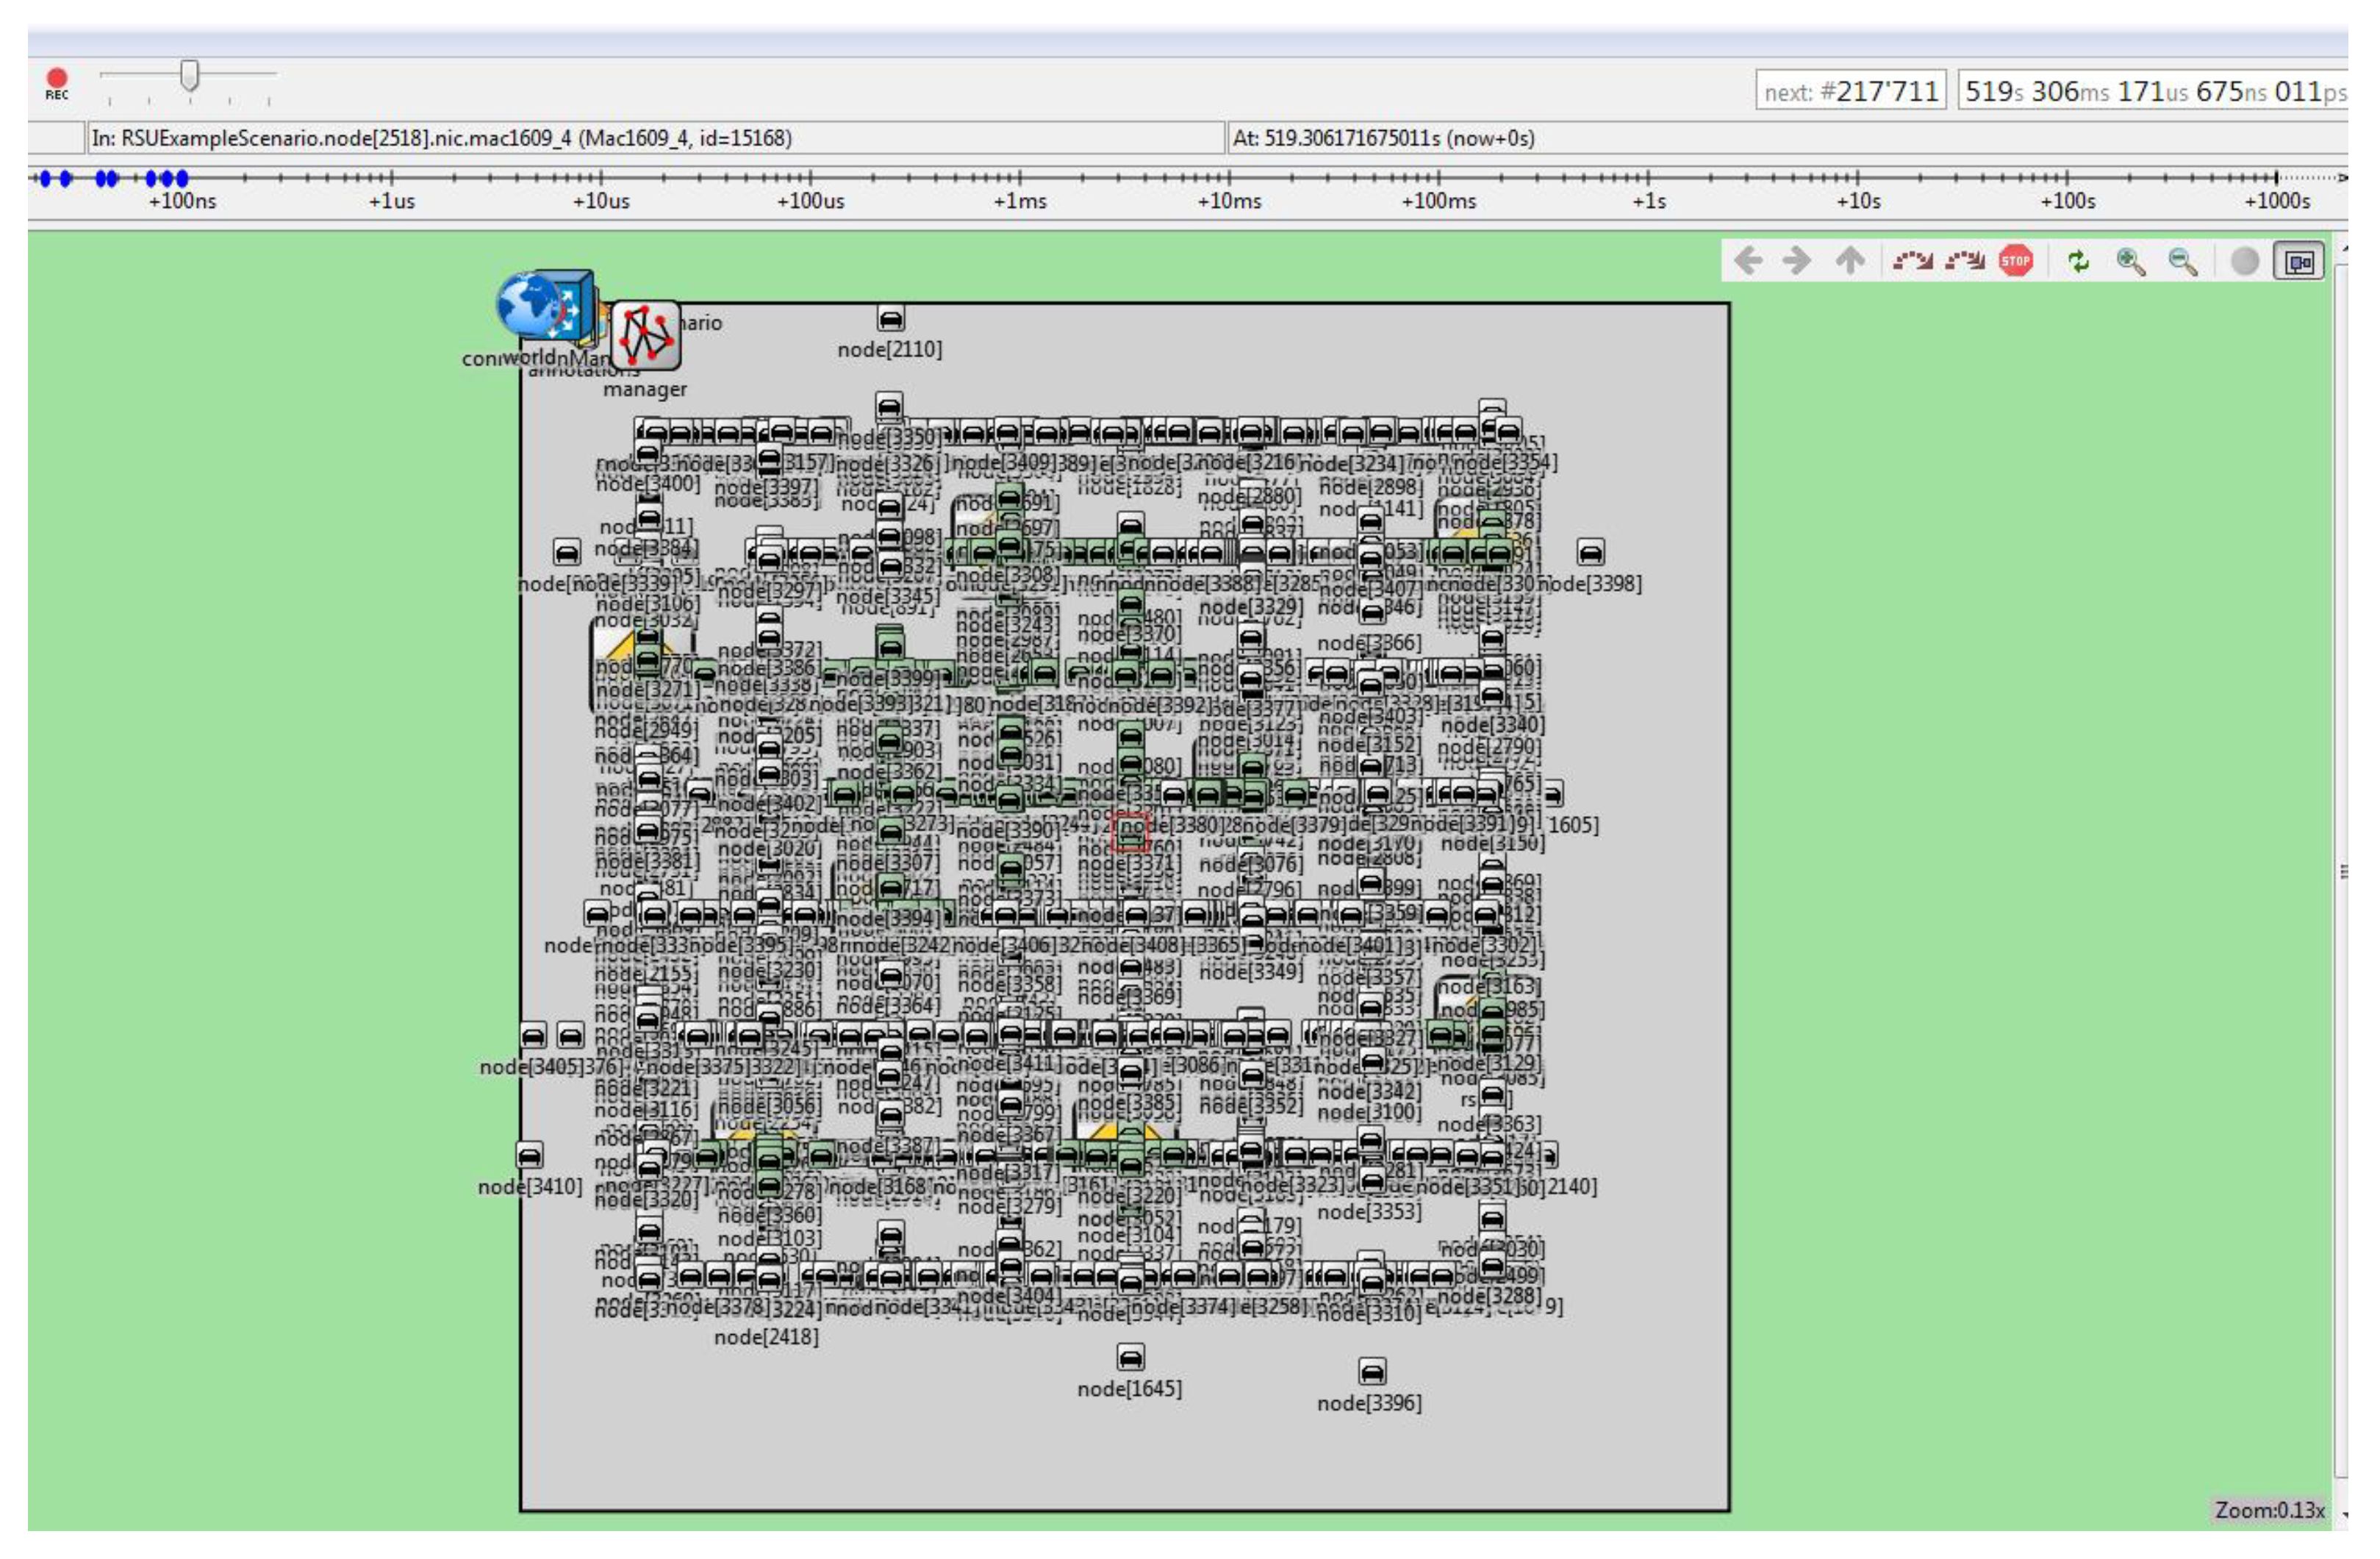
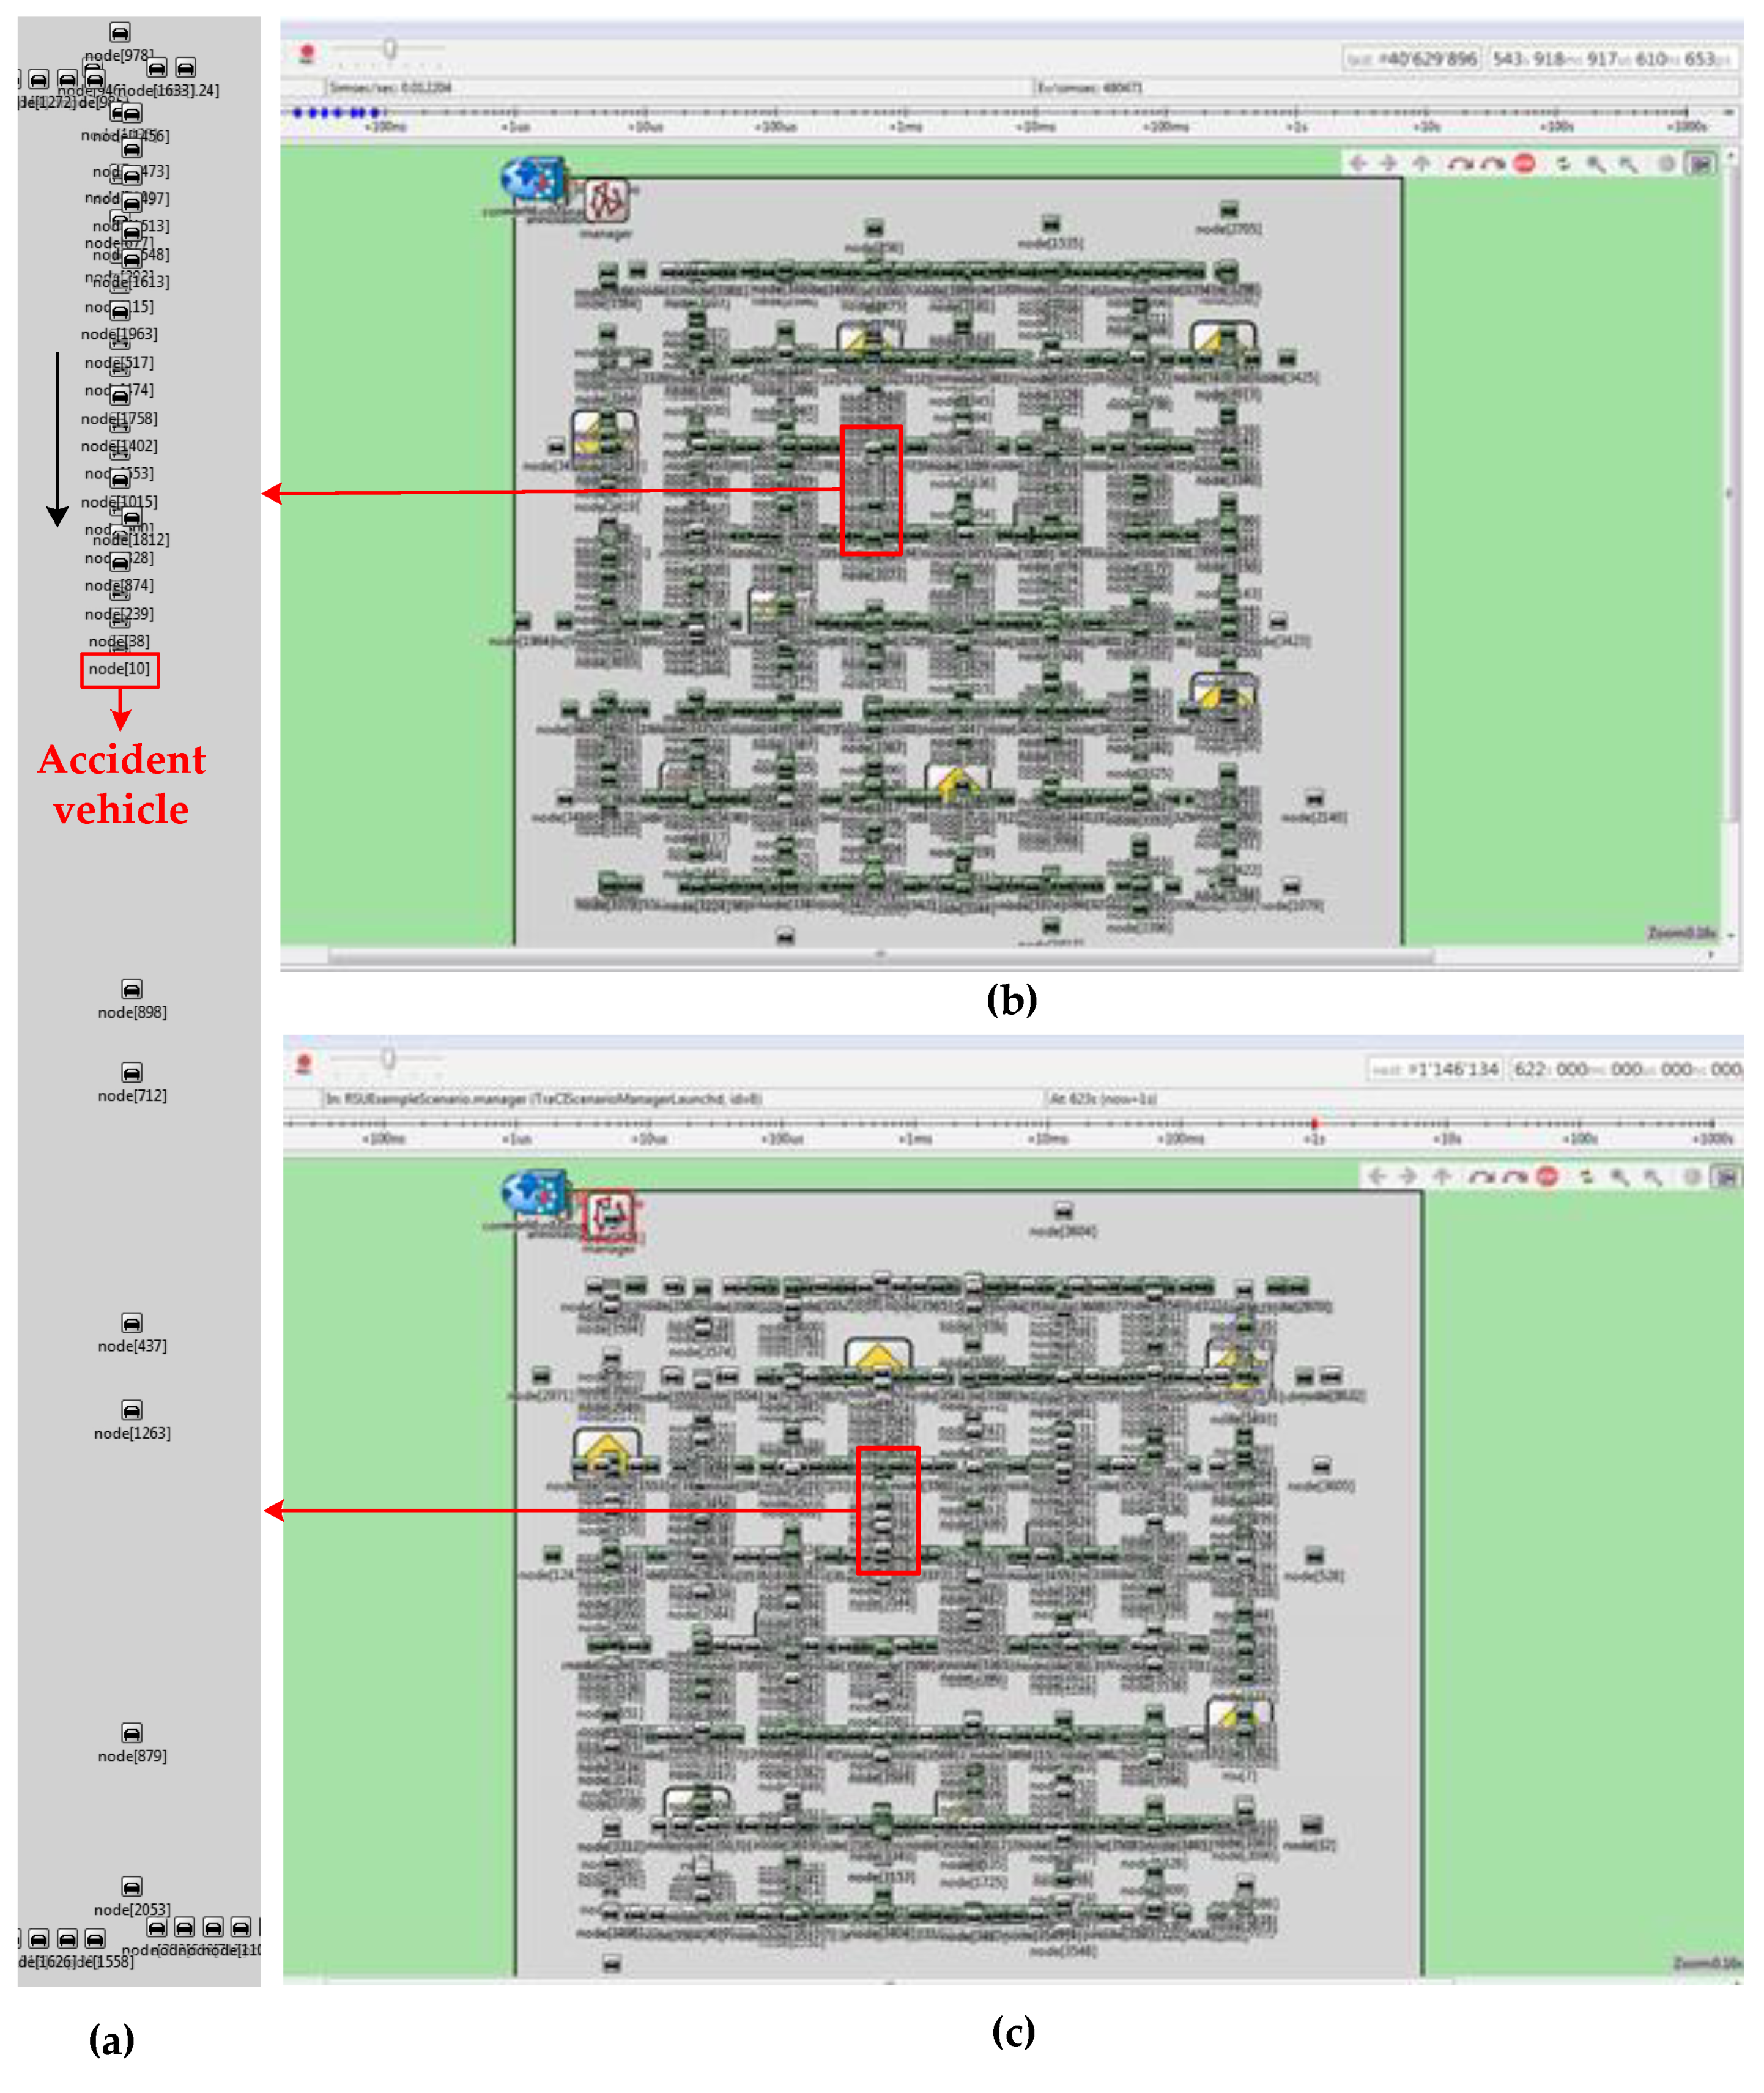
- Connected RSUs. The accident vehicle sends the message and all RSUs are connected via a backbone network. This setting indicates that once one RSU receives the message, other RSUs will receive this message in a short time (negligible) even if they are not within the RSU’s communication range.
- Disconnected RSUs. The accident vehicle sends the message and all RSUs are disconnected, namely other RSUs resort to vehicles within its communication range to receive this message.
- No message. The accident vehicle does not send a message. Messages are blocked on the accident lane.
6. Conclusions
Author Contributions
Funding
Conflicts of Interest
References
- Wu, Q.; Wu, J.; Shen, J.; Yong, B.; Zhou, Q. An Edge Based Multi-Agent Auto Communication Method for Traffic Light Control. Sensors 2020, 20, 4291. [Google Scholar] [CrossRef] [PubMed]
- Saračević, M.; Adamovic, S.; Miskovic, V.; Elhoseny, M.; Macek, N.; Selim, M.; Shankar, K. Data Encryption for IoT Applications Based on Catalan Objects and Two Combinatorial Structures. IEEE Trans. Reliab. 2020. [Google Scholar] [CrossRef]
- Saračević, M.; Adamović, S.; Macek, N.; Elhoseny, M.; Sarhan, S. Cryptographic Keys Exchange Model for Smart City Applications. IET Intell. Transp. Syst. 2020. [Google Scholar] [CrossRef]
- Kim, D.; Velasco, Y.; Wang, W.; Hussain, R. A New Comprehensive RSU Installation Strategy for Cost-Efficient VANET Deployment. IEEE Trans. Veh. Technol. 2017, 66, 4200–4211. [Google Scholar] [CrossRef]
- Merha, S.; Senouci, S.M.; Kies, A.; Zoulikha, A. An Optimized Roadside Units (RSU) Placement for Delay-Sensitive Applications in Vehicular Networks. In Proceedings of the 12th Annual IEEE Consumer Communications and Networking Conference (CCNC), Las Vegas, NV, USA, 9–12 January 2015. [Google Scholar]
- Mershad, K.; Artail, H.; Gerla, M. ROAMER: Roadside Units as message routers in VANETs. Ad Hoc Netw. 2012, 10, 479–496. [Google Scholar] [CrossRef]
- Chen, W.; Lu, X.; Jian, S. Neighborhood trustworthiness-based vehicle-to-vehicle authentication scheme for vehicular ad hoc networks. In Proceedings of the 13th International Conference on Information Security Practice and Experience (ISPEC), Melbourne, Australia, 13–15 December 2017. [Google Scholar]
- Lochert, C.; Scheuermann, B.; Wewetzer, C.; Luebke, A.; Mauve, M. Data Aggregation and Roadside Unit Placement for a VANET Traffic Information System. In Proceedings of the 5th ACM International Workshop on Vehicular Inter-Networking, San Francisco, CA, USA, 15 September 2008. [Google Scholar]
- Xue, L.; Yang, Y.; Dong, D. Roadside Infrastructure Planning Scheme for the Urban Vehicular Networks. Transp. Res. Procedia 2017, 25, 1380–1396. [Google Scholar] [CrossRef]
- Zhu, J.; Huang, C.; Fan, X.; Qin, K.; Fu, B. RSU deployment planning based on approximation algorithm in urban VANET. J. Commun. 2018, 39, 78–89. [Google Scholar]
- Wu, T.J.; Liao, W.; Chang, C.J. A Cost-Effective Strategy for Road-Side Unit Placement in Vehicular Networks. IEEE Trans. Commun. 2012, 60, 2295–2303. [Google Scholar] [CrossRef]
- Frasi, A.; Szczechowiak, P. Optimal Deployment of Road Side Units in Urban Environments. In Proceedings of the International Conference on Connected Vehicles and Expo (ICCVE), Vienna, Austria, 3–7 November 2014. [Google Scholar]
- Whang, G.; Park, S.; Chi, J. Influence Maximized MCL based RSU Deployment. Int. J. Future Gener. Commun. Netw. 2016, 9, 229–238. [Google Scholar] [CrossRef]
- Aslam, F.; Amjad, F.; Zou, C.C. Optimal roadside units placement in urban areas for vehicular networks. In Proceedings of the IEEE Symposium on Computers & Communications, Washington, DC, USA, 1–4 July 2012. [Google Scholar]
- Gao, Z.; Chen, D.; Cai, S.; Wu, H.C. Optimal and Greedy Algorithms for the one-dimensional RSU Deployment Problem With New Model. IEEE Trans. Veh. Technol. 2018, 6, 7643–7657. [Google Scholar] [CrossRef]
- Gao, Z.; Chen, D.; Cai, S.; Wu, H.C. OptDynLim: An Optimal Algorithm for the One-Dimensional RSU Deployment Problem With Nonuniform Profit Density. IEEE Trans. Ind. Inform. 2019, 15, 1052–1061. [Google Scholar] [CrossRef]
- Yang, H.; Jia, Z.; Xie, G. Delay-Bounded and Cost-Limited RSU Deployment in Urban Vehicular Ad Hoc Networks. Sensors 2018, 18, 2764. [Google Scholar] [CrossRef] [PubMed]
- Hwang, S.F.; Chen, W.C.; Dow, C.R.; Nguyen, N.L. Efficient RSU Placement Schemes in Urban Vehicular Ad Hoc Networks*. J. Inf. Sci. Inf. 2019, 35, 1045–1060. [Google Scholar]
- Lu, N.; Zhang, N.; Cheng, N.; Shen, X.; Mark, J.W.; Bai, F. Vehicles Meet Infrastructure: Toward Capacity–Cost Tradeoffs for Vehicular Access Networks. IEEE Trans. Intell. Transp. Syst. 2013, 14, 1266–1277. [Google Scholar] [CrossRef]
- Barrachina, J.; Garrido, P.; Fogue, M.; Martinez, F.J.; Cano, J.C.; Calafate, C.t.; Manzoni, P. Road Side Unit Deployment: A Density-Based Approach. IEEE Intell. Transp. Syst. Mag. 2013, 5, 30–39. [Google Scholar] [CrossRef]
- Fogue, M.; Sanguesa, J.A.; Francisco, J.M.; Marquez-Barja, J.M. Improving Roadside Unit Deployment in Vehicular Networks by Exploiting Genetic Algorithms. Appl. Sci. 2018, 8, 86. [Google Scholar] [CrossRef]
- Zhang, L.; Zhuang, Y.; Pan, J.; Kaur, L.; Zhu, H. Multi-modal message dissemination in vehicular ad-hoc networks. In Proceedings of the IEEE International Conference on Communications, Ottawa, ON, Canada, 10–15 June 2012. [Google Scholar]
- Lan, K.C.; Wu, Z.M. On the feasibility of using public transport as data mules for traffic monitoring. In Proceedings of the IEEE Intelligent Vehicles Symposium, Eindhoven, The Netherlands, 4–6 June 2008. [Google Scholar]
- Cumbal, R.; Palacios, H.; Hincapie, R. Optimum deployment of RSU for efficient communications multi-hop from vehicle to infrastructure on VANET. In Proceedings of the IEEE Colombian Conference on Communications and Computing (COLCOM), Cartagena, Colombia, 27–29 April 2016. [Google Scholar]
- Tinos, R.; Yang, S. Evolution Strategies with q-Gaussian Mutation for Dynamic Optimization Problems. In Proceedings of the 2010 Eleventh Brazilian Symposium on Neural Networks (SBRN 2010), Sao Paulo, Brazil, 23–28 October 2010. [Google Scholar]


| Notations | Descriptions |
|---|---|
| c | The cost of a simple RSU |
| B | Total deployment budget for the area of our interest |
| The time when received the packet from vehicles on lane |
| X | The Number of RSUs | The Number of Tests | Our Solutions and Best Solutions | Average Difference |
|---|---|---|---|---|
| 2 | 1 | 10,000 | 100% | 0 |
| 4 | 1 | 10,000 | 100% | 0 |
| 6 | 1 | 10,000 | 100% | 0 |
| 8 | 1 | 10,000 | 100% | 0 |
| 4 | 2 | 100 | 99% | 0.004% |
| 6 | 2 | 100 | 100% | 0 |
| 8 | 2 | 100 | 93% | 0.020% |
| 10 | 2 | 100 | 97% | 0.005% |
| 12 | 2 | 100 | 87% | 0.015% |
| 14 | 2 | 100 | 91% | 0.013% |
| 16 | 2 | 100 | 80% | 0.016% |
| 4 | 3 | 100 | 97% | 0.034% |
| 6 | 3 | 100 | 80% | 0.095% |
| 8 | 3 | 20 | 70% | 0.098% |
| 10 | 3 | 20 | 70% | 0.070% |
| Simulator | Domain | Parameter | Value |
|---|---|---|---|
| SUMO | road | length of lane | 500 (m) |
| speed | 13.89 (m/s) | ||
| passenger car (traffic flow) | length | 5 (m) | |
| max speed | 12 (m/s) | ||
| depart speed | max speed | ||
| period | 0.2 (s) | ||
| seed | 12 | ||
| taxi (traffic flow) | length | 5 (m) | |
| max speed | 13.89 (m/s) | ||
| depart speed | max speed | ||
| period | 0.5 (s) | ||
| seed | 12 | ||
| traffic light | cycle time | 90 (s) | |
| duration | 42 (s) | ||
| state | GGGGrrrr | ||
| duration | 3 (s) | ||
| state | yyyyrrrr | ||
| duration | 42 (s) | ||
| state | rrrrGGGG | ||
| duration | 3 (s) | ||
| state | rrrryyyy | ||
| Veins | simulation | location update interval | 1 (s) |
| simulation time | 1800 (s) | ||
| playground size (X,Y,Z) | 5000, 5000, 50 (m) | ||
| car | communication range | 250 (m) | |
| start time of the accident | 200 (s) | ||
| duration of the accident | 600 (s) | ||
| header length of data packet | 80 (bit) | ||
| data Length of data packet | 1024 (bit) | ||
| bitrate | 6 Mbps | ||
| RSU | communication range | 250 (m) | |
| header length of data packet | 80 (bit) | ||
| data Length of data packet | 1024 (bit) | ||
| bitrate | 6 Mbps |
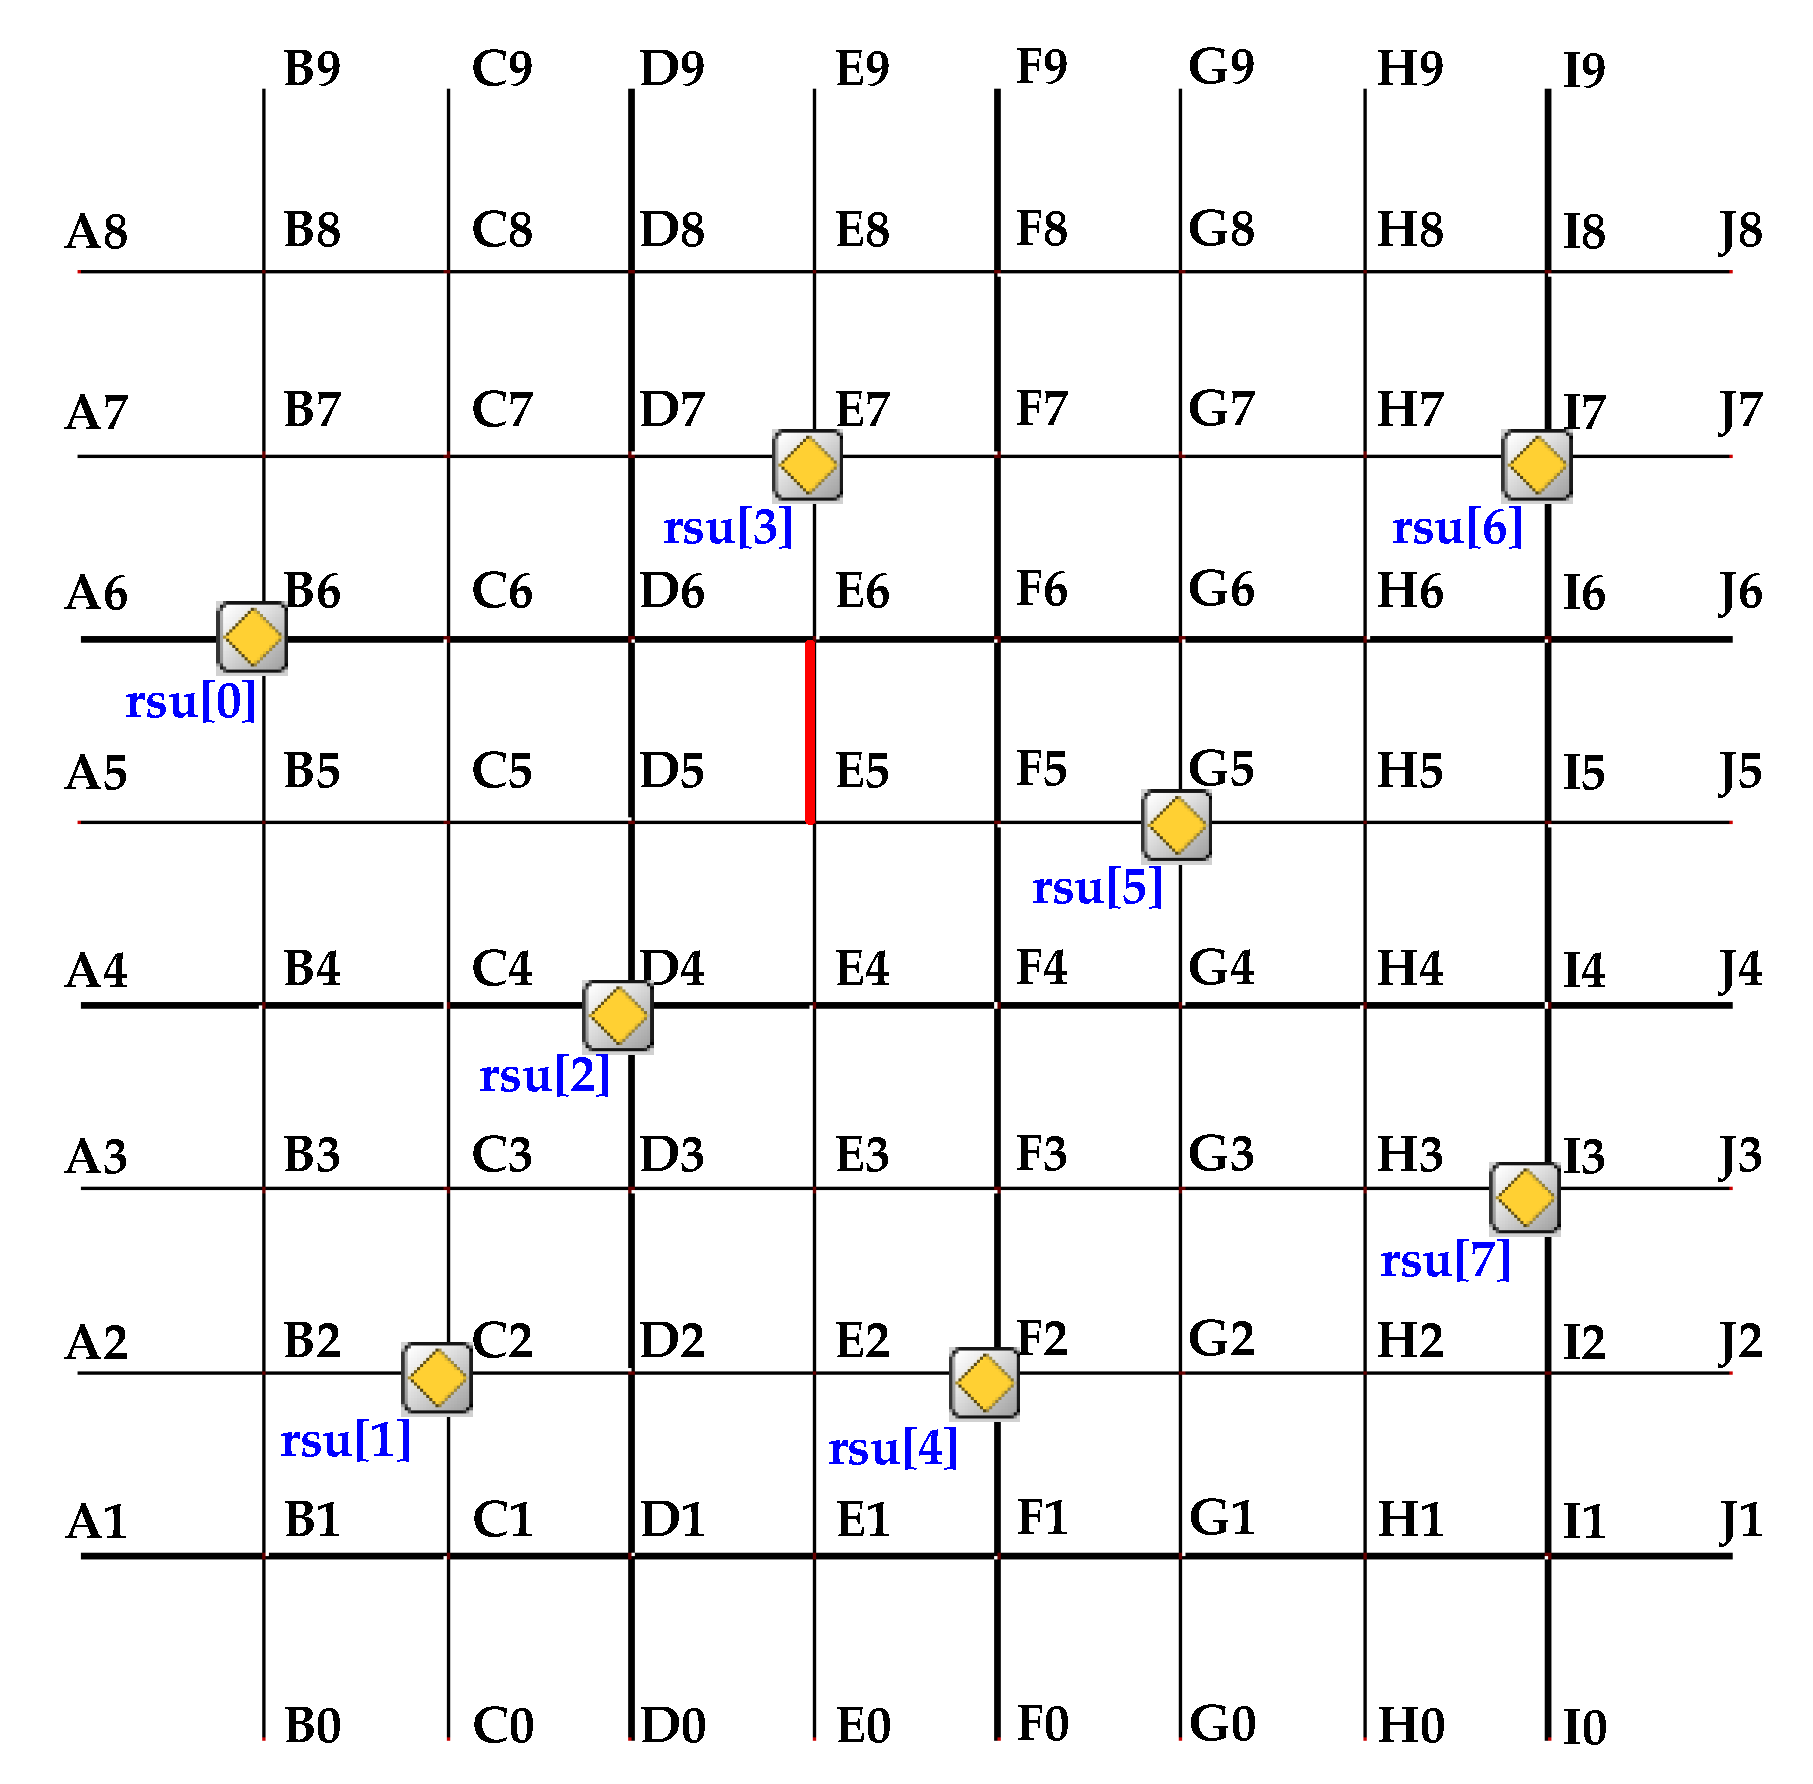
| RSU | Time (Connected RSUs) | Time (Disconnected RSUs) |
|---|---|---|
| rsu [2] | 518.1705 (s) | 531.2697 (s) |
| rsu [7] | 518.1730 (s) | 560.1942 (s) |
| rsu [4] | 518.1742 (s) | 559.7561 (s) |
| rsu [5] | 518.2001 (s) | 531.2236 (s) |
| rsu [6] | 518.2008 (s) | 550.1315 (s) |
| rsu [0] | 518.2058 (s) | 554.6480 (s) |
| rsu [1] | 518.1701 (s) | 559.6947 (s) |
© 2020 by the authors. Licensee MDPI, Basel, Switzerland. This article is an open access article distributed under the terms and conditions of the Creative Commons Attribution (CC BY) license (http://creativecommons.org/licenses/by/4.0/).
Share and Cite
Shi, Y.; Lv, L.; Yu, H.; Yu, L.; Zhang, Z. A Center-Rule-Based Neighborhood Search Algorithm for Roadside Units Deployment in Emergency Scenarios. Mathematics 2020, 8, 1734. https://doi.org/10.3390/math8101734
Shi Y, Lv L, Yu H, Yu L, Zhang Z. A Center-Rule-Based Neighborhood Search Algorithm for Roadside Units Deployment in Emergency Scenarios. Mathematics. 2020; 8(10):1734. https://doi.org/10.3390/math8101734
Chicago/Turabian StyleShi, Yanjun, Lingling Lv, Hao Yu, Liangjie Yu, and Zihui Zhang. 2020. "A Center-Rule-Based Neighborhood Search Algorithm for Roadside Units Deployment in Emergency Scenarios" Mathematics 8, no. 10: 1734. https://doi.org/10.3390/math8101734
APA StyleShi, Y., Lv, L., Yu, H., Yu, L., & Zhang, Z. (2020). A Center-Rule-Based Neighborhood Search Algorithm for Roadside Units Deployment in Emergency Scenarios. Mathematics, 8(10), 1734. https://doi.org/10.3390/math8101734