1. Introduction
European countries face a variety of socio-economic challenges. These challenges are closely linked to the possibility of future development and integration of states. Government institutions charged with sustainable development of the state and their efforts must be directed towards the development of society. Developed countries seek the development of society through direct qualitative changes in the structure and framework of society that help all members of society better achieve their goals and objectives. Developed countries must set an example for other countries. Social development is a process of social change, not just a set of strategies and programs that point to particular outcomes, and this process has gained acceleration in recent decades [
1].
Social and environmental aspects and their levels are important indicators that determine the health and lifestyle of the population. Therefore, different indicators of human development usually correlate with state achievements in health, education and income. The most common indicator of human development is the human development index (HDI) [
2]. Human development is a process of expanding human freedoms and opportunities and improving their biological and psychological well-being throughout their lives [
3]. HDI sends a signal to the world societal participants about the state of this country. However, important social indicators such as HDI are not always strongly correlated with states’ social policies [
4]. In this study, the human development index (HDI) was used as a basic quantitative measure of the state’s human capital and is a key strategic tool for measuring countries according to human capital. Analyzing and matching HDI information with indicators from other countries and making it public can promote positive changes in society. Many researchers suggest combining HDI with other indicators and dimensions. For this reason, researchers have introduced sustainable HDI based on a multidimensional synthesis of other indicators, and have developed new classification methods and clustering methodologies that can be used to monitor sustainable human development.
HDI is widely used in public welfare and countries cost-effectiveness analysis with other factors. There is no clear understanding of how different indicators impact objective calculated weight values. However, the public health legislative setting and politicized decisions evidence-based build public health planning initiatives that objective on a paradigm for countries success [
5]. Public economic wellbeing depends on incentives for community healthy social behavior and an environment, workplaces, schools, and homes that allow healthy behavior to be realized. Strengthened recognition of the importance of incentivizing healthy behavior should pave the way for more concerted countries political action and faster social development [
6]. There exists a paucity of research on optimization-based long-term diseases prevention in public health politics planning. Many research results indicate government policy and interventions aimed at increasing physical activities of citizens [
7].
In the world, there is a tendency interlinking between children’s health-related quality by life quality and their movement behaviors moderated by their country’s human development index [
8].
Positive human behaviors in youth ages have the potential to last into later adulthood [
9]. Children and youth education, and human physical environment are the objects of research and political discussion that help to find the way of countries social development. Identification of countries experience which promoting child and youth physical activity by the coherence of human development can help create the best design way development of the countries [
10].
Physical activity at a young age is being associated with health problems prevention and quality of whole life. Suitable scope and intensity of physical activity help in reducing many risks for a health condition (heart disease, high pressure, oncological diseases, obesity, mental health, cognitive performance, etc.) and improves life well-being.
The pace and extent of development varies according to the stage of development of society, and it is therefore necessary to divide countries into clusters of society development.
The Global Matrix initiative is led by the Active Healthy Kids Global Alliance (AHKGA). AHKGA is an incorporated not-for-profit organization consisting of researchers, public health professionals and government officials who collaborate to advance physical activity in children and youth from around the world [
11]. The relevant clustering of Europe countries and ranking them by the interrelation between HDI and Global Matrix 3.0 physical activity indicators are an urgent task. It remains unclear how physical activity in the country is linked to countries’ HDIs, what indicators are most important, and how the countries under assessment can be clustered to assess the relationship between children’s physical activity and HDI.
It is important to highlight that physical inactivity and sedentary behavior among children and youth is a global problem. This tendency may get worse with the economic growth and development at a global level. It is necessary to change the lifestyle among the current generation of children and youth, create strategies to stimulate physical activity especially among the youth generation [
12].
A wide variety of approaches and evaluation techniques used in the field of countries ranking and clustering, however, there are some gaps in the methodologies. The aim of the present study is to propose a new approach to identify a method of ranking the countries for evaluating the children physical activity in the European countries using such indicator as the human development index.
There is not much research in the literature dedicated to studying HDI and particularly physical activity of children and youth by means of mathematical modelling. Most research related to the separate dimensions of HDI—public health, economic development, and quality of life. The most commonly used methods are various tools of mathematical statistics, i.e., correlation, regression analysis, and some econometric models [
13].
In this research, MADM methods are being applied to solve the problem. MCDM can be divided to the multiple objective decision making (MODM) for designing the best solution and multiple attribute decision making (MADM) for selecting the best alternative. A wide variety of techniques have been developed for MADM by researchers over the last 60 years. A review of 27 existing MADM methods are presented in the book [
14].
Decision making techniques have been widely used in healthcare. The study [
15] systematically reviews the conventional and fuzzy decision-making techniques applied in healthcare and medical problems. The techniques of analytic hierarchy process (AHP) and hybrid approaches were the most frequently implemented decision-making technique in healthcare fields.
In [
16], weighted logistic regression models were employed to examine the predictive utility of independent health behaviors (such as physical activity, dietary behaviors, and other salient health behaviors) associating with reported mental health problems (difficulty concentrating, remembering, or making decisions).
Martin et al. [
17] assessed the impact of obesity treatment interventions (in the areas of diet, physical activity, sedentary behavior and behavioral therapy) on school achievement and cognitive abilities. The authors conclude that school and community-based physical activity interventions as part of an obesity prevention or treatment program can benefit executive functions of children with obesity or overweight specifically. The absolute values of criteria are required for decision making. However, the evaluation of integrated criteria is necessary for making consistent decisions [
18]. Methods, when decision making grounded on a lot of criteria, are used in solving various difficult problems in a wide range of aims management [
19]. This study sought to overcome some of the more common limitations of current evaluation methods, by combining cognitive mapping and the measuring attractiveness by a categorical based evaluation technique (MACBETH), to develop a more informed, coherent and transparent evaluation system.
The study by [
20] uses a multiple-criteria decision-making technique to explain the environmental factors that affect the friendliness of the walking environment. An analytical network process (ANP) approach was performed by 16 experts to determine the weights of the dimensions and indicators.
The purpose of research by [
21] is to investigate influential factors of encouraging the senior citizens participation on recreational sports and relative weights of personal preference and external environment application with a hybrid MCDM model combining DEMATEL (decision making trial and evaluation laboratory) with ANP methods. This study aims to demonstrate how the application of the MCDM model can improve participation and find important factors that can enhance sports and leisure participation.
The article by [
22] investigates the achievements and trends relevant to environmental sustainability ecological footprint (EF) and the environmental performance index (EPI) and quality of life index (QLI) in 15 republics of the former USSR over the past 25 years. The applied method INVAR provided new opportunities for performing the multi-criteria analysis on environmental sustainability and the quality of life.
In the study [
23], a new MCDM method DSC TOPSIS (distance, similarity, and correlation technique for order of preference by similarity to ideal solution) that uses distance, similarity, and correlation measures has been proposed. In the method, Euclidean was used as distance measure, cosine was used as similarity measure, and Pearson correlation was used as relation measure. The proposed method has been tested on the variables showing the development levels of the countries. The results obtained were compared with the human development index (HDI) value.
The paper of [
24] aims to overcome the problem of the rank reversal in MCDM techniques, namely in the human development index (HDI) framework. The proposed methodology, the goal programming benefit-of-the-doubt (GP-BOD), has been applied to the HDI dataset in 2012, and provide consistent and stable rankings. The results show stability in the rankings when different methods of normalization and weighting are applied.
The study by [
25] examines the potential relationship between public health expenditures, logistics performance indices, renewable energy, and ecological sustainability in ASEAN member countries using the SEM (structural equation modeling) model.
The problem of ranking European countries according to interdependence between two groups of criteria (human development and internal security) has been solved in [
26]. Intergroup correlation was applied for establishing priority of the criteria in each group.
The research object of this article is evaluating and ranking European countries according to two groups of indicators: children’s physical activity and countries human development and implementing the clustering procedure of the EU countries by combining the results of several MADM methods. The idea of the research is to apply weight balancing indicator ranks accordance (WEBIRA) method, which is dedicated for solving MCDM problems when the data can be naturally divided to two or more groups of indicators [
27].
The main challenges in MADM tasks are:
Determining priorities for evaluation criteria;
Calculation of criteria weights;
Ranking the alternatives.
Methods of multicriterial components’ analysis permit monitoring of the criteria dynamics. It allows executing control of the substantiated process [
28]. Calculation of criteria priority and weights is the most responsible part of the MADM process. Criteria priority can be determined by various methods, for example, expert evaluation method based on Kemeny median, AHP (analytic hierarchy process), various entropy-based methods, etc. The new interval entropy method is being proposed to solve the problem of criteria prioritization. The main idea is to calculate entropy of the data normalized by different normalization formulas and choose the highest value from the set of obtained entropies. The interval-valued entropies are calculated for this purpose. The next step is data normalization. The corresponding normalization method which maximizes entropy value has been applied to each criterion. In general case, data normalization methods may differ for different criteria. Then, weight balancing method WEBIRA elaborated to determine criteria weights. Finally,
-cuts approach from fuzzy sets theory was used for recursive procedure of ranking the alternatives.
The rest of the article is organized as follows. In
Section 2, the description of indicators and the initial data matrix are given. In
Section 3, criteria weights and ranking results calculated for European countries by WEBIRA method.
Section 4 provides description of three entropy-based MCDM methods for calculation criteria weights.
Section 5 generalizes ranking results obtained by different methods and describes European countries clustering procedure based on four MCDM methods rankings.
Section 6 provides discussion and conclusions.
The novelty of this study is the interval entropy method of prioritization within individual groups of criteria (attributes). The prioritization of criteria has a major impact on the quality of the solution of the MCDM problem. The proposed -cuts approach for ranking the alternatives is a quick and convenient ranking procedure. This approach shows specific thresholds for the inclusion of alternatives at each step, so that, for example, when a new country is included in the study, its ranking is assigned without recalculating the rankings of all countries. To our knowledge, the use of the mentioned innovative procedures for criteria prioritization and alternatives ranking have not yet been described in the scientific literature for solving MCDM problems.
2. Indicators and Their Definition
As was noted before, we analyze two subgroups of indicators—physical activity of children and youth (aged 5–17 years) and countries’ human development.
The Global Matrix 3.0 on physical activity for children and youth contains sociodemographic data identifying characteristics of the 49 world participating countries. Work groups from 49 countries developed their report cards by grading 10 common indicators using the available data. Three scores were regenerated for the analysis: (1) overall score computed as the sum of interval values for all indicators, (2) sources of behavioral score and (3) sources of influence score.
For our study, the data on the 18 European countries have been selected by open data of Global Matrix 3.0. As some variables for European countries have missing values (INC), in our study we were confined to the four behavioral indicators selected from 10 core indicators related to the physical activity of children and youth: ()—overall physical activity (any bodily movement produced by skeletal muscles that requires energy expenditure), ()—organized sport and physical activity (a subset of physical activity that is structured, goal-oriented, competitive and contest-based), ()—active transportation (active transportation refers to any form of human-powered transportation—walking, cycling, using a wheelchair, in-line skating or skateboarding), ()—sedentary behaviors (any waking behavior characterized by an energy expenditure ≤ 1.5 metabolic equivalents, while in a sitting, reclining or lying posture).
The grades by European countries by the Global Matrix 3.0 data:
| 1. Belgium (Flanders): | ()F, ()B, ()C+, ()C; |
| 2. Bulgaria: | ()D+, ()C+, ()B−, ()D; |
| 3. Czech Republic: | ()D, ()B−, ()C+, ()D−; |
| 4. Denmark: | ()D−, ()A−, ()B+, ()D+; |
| 5. England: | ()C−, ()D+, ()C−, ()D+; |
| 6. Estonia: | ()D−, ()C, ()D, ()F; |
| 7. Finland: | ()D, ()C+, ()B+, ()D−; |
| 8. France: | ()D, ()C−, ()C−, ()D−; |
| 9. Germany: | ()D−, ()B, ()C−, ()D−; |
| 10. Lithuania: | ()C−, ()C, ()C−, ()C−; |
| 11. Netherlands: | ()C, ()B, ()B−, ()C−; |
| 12. Poland: | ()D−, ()D, ()C, ()D; |
| 13. Portugal: | ()D, ()B−, ()C−, ()C−; |
| 14. Scotland: | ()F, ()B, ()C, ()F; |
| 15. Slovenia: | ()A−, ()C+, ()C, ()B+; |
| 16. Spain: | ()D, ()B, ()B−, ()B+; |
| 17. Sweden: | ()D+, ()B+, ()C, ()C+; |
| 18. Wales: | ()D+, ()C+, ()D+, ()F. |
The grading system for transition from letters to numbers was done through a harmonized process and the standard grading rubric of the Global Matrix 3.0 study (A+ = 15, A = 14, A− = 13, B+ = 12, B = 11, B− = 10, C+ = 9, C = 8, C− = 7, D+ = 6, D = 5, D− = 4, F = 2) [
29].
The human development index is a summary measure of average achievement in key dimensions of human development: (1) a long and healthy life, (2) knowledge and (3) a decent standard of living. The knowledge dimension consists of two subdimensions: (1) mean of years of schooling for adults aged 25 years and more and (2) expected years of schooling for children of school entering age. The HDI is the geometric mean of normalized indices for each of the three dimensions (see human development indices and indicators, 2018 statistical update). In the present work, four components of HDI are used: the ability to lead a long and healthy life, measured by life expectancy at birth (years) (); the expected years of schooling (); the ability to acquire knowledge, measured by the mean number of years of schooling (); the ability to achieve a decent standard of living, measured by the gross national income (GNI) per capita (PPP $) (). HDI makes an assessment of diverse countries with very different price levels. To compare economic statistics across countries, the data must first be converted into a common currency. For this reason, GNI per capita is measured in purchasing power parity (PPP) international dollars (PPP $) where 1 PPP dollar (or international dollar) has the same purchasing power in the domestic economy of any country as US$1 has in the US economy.
In
Table 1, four children physical activity indicators numerical values (
) and four countries human development indicators numerical values (
) are presented. The next step is criteria priority setting in each group and data normalising.
3. Criteria Weights and Ranking Results for European Countries Calculated by WEBIRA Method
One of the appropriate methods for determining criteria prioritization and their weights is WEBIRA. This method is suitable in the case when initial data matrix consists of two or more subgroups of criteria. We have two natural criteria groups: indicators of children’s physical activity and indicators of countries human development. We will briefly describe WEBIRA method. More information about this method and applications is available in sources. Scheme of WEBIRA method is as follows:
Determining criteria priority separately in each criteria subgroup by interval entropy method;
Setting data normalization method for each criterion;
Calculation elements of decision-making matrix;
Solving optimization problems, i.e., searching for criteria weights which minimize the distance between two alternative rankings according to and groups of criteria;
Ranking European countries using the -cuts method.
3.1. Data Normalization Formulas
In
Table 2, six normalization formulas used in this research are presented. All formulas are for direct normalization when a higher value is considered as better. The positive parameter
is included in each formula, thus Formulas (1)–(6) define six classes of normalisation methods. Let us denote:
In all cases normalized values belong to the interval
For example, calculate normalized values for some indicators of Belgium (Flanders):
3.2. Interval Entropy
Suppose that we have discrete source of information:
| | | … | |
| | | … | |
Its entropy [
30] is calculated by the following formula:
We propose an entropy computation scheme that allows real numbers to differ slightly from each other. In this case, the classical entropy formula will show large entropy values. That is not correct. The modification of entropy formula allows to avoid this problem.
Suppose that
are normalized values of decision-making matrix (see
Table 1). Let’s mark
different values of
and
—their frequencies. Then probabilities
are being replaced by relative frequencies
,
. Entropy of the criterion
is determined as follows:
Initially entropy was introduced as the measure of information amount in the system [
31,
32]. Entropy (7) always acquires maximum value (
, when all the numbers
are different. Of course, this formula does not allow to take into account the fact that some values
can differ very slightly (
). Therefore, the following modification of entropy formula (7) is proposed.
Denote and calculate frequencies as follows:
is the number of values satisfying inequalities …
is the number of values satisfying inequalities …
is the number of values satisfying inequalities
Then the formula for calculating interval entropy is:
Formula (8) gives different entropy values for data normalized in different ways. Therefore, Formula (8) makes it possible to compare different transformations of the data under consideration. The bigger is entropy value, the more information corresponding criterion is accumulating.
3.3. Calculation of Maximum Entropy Values and Criteria Prioritisation
The next step is calculation of interval entropy values (8) for each column of initial data matrix
(
Table 1), normalized by six normalization methods, (1)–(6). Then the highest entropy value will indicate variable having highest priority, having second highest priority, etc. Moreover, we’ll choose the best normalization method for each variable. This process is being executed separately for matrices
and
. Calculation results for matrix
columns are as follows—maximum interval entropy values for all four columns
were achieved for normalisation method 1,
:
As the highest entropy values of indicators
and
coincide, we have two prioritization cases for indicator
columns.
and
. Values of normalised matrices
by Normalization Method 1 and
presented in
Table 3. Matrices columns are arranged in descending order of maximum entropy values.
The biggest impact has (sedentary behavior), next in importance is (organized sport and physical activity), then goes (overall physical activity) and (active transportation).
Calculation results for matrix columns: maximum interval entropy values were reached for in the case of Normalization Method 4, ; for —Normalization Method 5, ; for —Normalization Method 6, ; for —Normalization Method 1, .
Maximum entropy values are as follows:
The priority of matrix columns is unique:
. Values of normalized matrix
, (each column is normalised by respective normalisation method) are provided in
Table 4. Matrix columns are reordered in descending order of maximum entropy values.
Thus, from HDI indicators the biggest impact has (expected years of schooling), the next is (life expectancy at birth), then goes (mean years of schooling) and the last is (GNI per capita).
3.4. Determining Criteria Weights
Suppose that matrix
is composed of two submatrices:
and
are two groups of criteria. Two weighted sums are being calculated for each row of matrix
:
Coefficients
and
satisfy conditions
and
Criteria
(correspondingly
) are arranged in descending order of their priority. For our task criteria weights must satisfy the conditions:
and
The weights satisfying conditions (10)–(11) are being calculated by solving optimization problem
where value
is a certain distance that measures the similarity of ranking the alternatives while using only the first (
) and only the second (
group of criteria.
is the minimum value of a disagreement measure between two alternative rankings. It could be interpreted as the function of assessing the weight balancing quality. It is clear that
Parameter values for investigated initial data matrix (see
Table 1) are:
The WEBIRA method was applied to matrices
and
(see
Table 3 and
Table 4).
After accomplishing weight balancing procedure minimum value of goal function (12) is
This value achieved with such values of weight vectors:
Weighted sums
and
for matrix
have been calculated as follows:
We will notice that in group of criteria sedentary behavior and organized sport and physical activity have equal weights 0.379, while overall physical activity and active transportation have much lower weights: 0.121. In the group of criteria the biggest weight 0.6214 has expected years of schooling, then goes life expectancy at birth with 0.2968 and finally, mean years of schooling having 0.0818. Surprisingly GNI per capita has a zero weight.
The minimum value of goal Function (12) is
The minimum value achieved with the weight vectors:
Weighted sums
and
for matrix
have been calculated as follows:
The most informative indicators in group of criteria—sedentary behavior, organized sport and physical activity—have equal weights 0.3629. Active transportation now has zero weight. Its weight goes to overall physical activity and now is 0.2742. In the group of criteria the biggest influence with weight 0.7188 has expected years of schooling, life expectancy at birth has 0.2379, and mean years of schooling has 0.0433. GNI per capita repeatedly has zero weight.
3.5. -Cuts Approach for Ranking European Countries
Ranking of 18 European countries according to interrelation between two groups of criteria—children’s physical activity in the country and country’s human development, was performed using -cuts recursive procedure of ranking the alternatives.
Let
be a positive number satisfying condition
Denote
—the set of alternatives
which satisfy conditions
We call the -cut of the set of alternatives contains all the alternatives which are the best not only according to the first group attributes, but also according to the second group attributes. The both weighted sum values and are greater or equal than the threshold . It is obvious that -cut contains all alternatives, contrarily, is an empty set, i.e., . Let initial value of be equal to 1. By gradually reducing the value of we’ll obtain -cuts (sets of the alternatives) containing respectively alternatives. Herewith, we’ll immediately get the rank of the relevant alternative (European country).
The WEBIRA method constructs two sums
(see Formula (9)), that are maximally matched with respect to the objective Function (12). These sums provide two rankings of alternatives that need to be combined into one. The simplest, though not the unique method is to rank the alternatives by the sum
. All similar rankings (for example,
,
,
) require some methodological justification. In this paper, we use
-cuts and analyse already constructed sets of alternatives without applying new algebraic operations. All the sums
are compared with the value
(see
Section 3.5.) and the set
is constructed. When
,
contains all alternatives. When
,
is empty set. Decreasing the values of
from 1 to 0 gives a sequence of sets
Since the number of alternatives
is finite, there exists a finite number of
-cuts
That allows to obtain all different sets of alternatives
. These sets naturally define the ranks of alternatives. Rank 1 (maximum) has an alternative
, Rank 2 has an alternative
etc. Thus, the proposed ranking method does not require additional methodological considerations, analyses already obtained information and is best adapted to the WEBIRA method.
In
Table 5, values of threshold
respective
-cuts, containing
alternatives, and ranks of the countries are presented for matrix
in
Table 6—the same information is given for matrix
For example, (see
Table 5) only one country Spain satisfies conditions
, so the single alternative Spain belongs to
-cut
and has Rank 1. By lowering threshold
we obtain that two countries, Spain and Denmark, satisfying conditions
, and therefore, entering the
-cut
, so Denmark has Rank 2. The last country entering the corresponding
-cut is Bulgaria having Rank 18.
Additionally, we calculated ranks of alternatives obtained by WEBIRA-SAW methods R1SAW and R2SAW, see, for example, by summing and ranking corresponding weighted sum values for alternatives
and
. Here values
calculated by Formula (9), criteria weights for matrices
and
set by WEBIRA method are given in the Formulas (13) and (14). Weighted sum values and ranks of the countries by R1SAW and R2SAW methods presented in
Table 7. Observed ranks calculated by R1SAW and R2SAW are very similar. Sets of countries having ranks 1–7 and 14–18 coincide. Further analysis is necessary to compare ranking results of all MADM methods described above.
3.6. Calculations for a New Country
Now we’ll show how new country can be involved and its rank calculated by WEBIRA methods. Calculations for the new country will be based on the formulas received. As we have already calculated criteria weights, we need only raw data for the country. The data for Canada is given in
Table 8.
For the calculations we used Formulas (9), (13) and (14), were coefficients are already calculated without data for Canada. In the case of matrix
for Canada we get:
In the case of matrix
:
Taking advantage of the results in
Table 5 and
Table 6, we get Rank 6 according to method WEBIRA (
) and Rank 10 according to method WEBIRA (
). Methods R1SAW and R2SAW give correspondingly Ranks 8 and 10.
4. EMDCW, CILOS and IDOCRIW Methods for Calculation Criteria Weights
In this section, three entropy-based methods for establishing criteria weights, are introduced. It’s worth to mention that these methods are not related to the criteria prioritization procedure described above. Instead, priority of criteria is ascertained automatically when criteria weights are being calculated. Criteria weights determined for all attributes without dividing the set of criteria to the subsets.
Suppose that
are the elements of decision-making matrix
where
is the number of alternatives (rows),
—the number of evaluating criteria (columns).
EMDCW (entropy method for determining the criterion weight), see [
33], evaluates criteria weights by dependency from their dominating degree, i.e., the extent of data diversification [
34]. The weight of similar data (when the values of the criteria do not differ considerably) obtained by EMCDW is low. The large weight corresponds to the criterion with non-homogeneous data.
The values of criteria are normalized using Equation (15):
Then the entropy of each criterion is calculated:
Entropy weights are calculated using normalized values
:
Weights reflect the degree of data non-homogeneity.
CILOS—method of criteria impact LOSs and determination of objective weights [
35].
The method evaluates the loss of each criterion, until one of the remaining criteria acquires the optimum—the maximum or the minimum value. All the values of inverse criteria have been transformed to direct criteria (when a higher value is considered as better) according to the following equation:
Matrix with data transformed to direct criteria is denoted as
Then, maximum values of each column (criteria) have been calculated:
where
is the number of the row, where the maximum value of
-th criterion is attained.
Then a square matrix
is being defined as follows:
Matrix
is formed from the
-th rows values of matrix
. So, the maximum values of all the criteria will appear in the main diagonal of matrix
Then the matrix of relative losses
is made:
Elements of matrix show relative loss of the -th criterion if the -th criterion is selected as the best one.
Finally, weights
can be calculated from system of equations:
where matrix
defined as follows:
The method based on the criteria significance loss offsets the drawback of the entropy method. Thus, when the values of the criterion do not differ considerably, elements of matrix of the relative loss of the criteria’s impact (17) approach zero, while the respective criterion weight increases and has a great impact on the evaluation. In the case of homogeneity, when the values of one of the criteria are the same in all of the alternatives, all of the relative losses of the criteria, as well as their total loss, are equal to zero. Therefore, the linear system (18) makes no sense because one column of elements in matrix is equal to zero.
IDOCRIW—integrated determination of objective criteria weights.
The idea of aggregating objective weights obtained by different methods to a single overall weight, is used. The entropy weights
and weights
of the criteria impact loss methods, have been connected to the common objective criteria for the assessment of the structure of the array weights
:
These weights will emphasize the separation of the particular values of the criteria (entropy characteristic), but the impact of these criteria decreases due the higher loss in other criteria.
5. European Countries Clustering Solution Based on 7 MCDM Methods Ranking Results
Respective criteria weights calculated by Formulas (16), (18) and (19) for EMDCW, CILOS and IDOCRIW methods are presented below. Recall that these methods deal with matrix as a whole.
Note that EMDCW and IDOCRIW as well as WEBIRA assigned the largest weight to
(sedentary behavior). The two former methods assigned relatively low weight values to all HDI indicators
, while CILOS “ignores” children physical activity indicators
. Meanwhile, WEBIRA results are always balanced. Inclusion of
and
groups criteria is obligatory. Ranking results for 18 countries obtained by all seven methods—WEBIRA (
), WEBIRA (
), EMDCW, CILOS, IDOCRIW, R1SAW and R2SAW, are given in
Table 9. It is difficult to formulate any conclusions about differences and similarities of the rankings only by observing
Table 8 numbers. The Spearman correlation coefficient is a proper similarity measure for different rankings. Spearman correlation coefficients between ranks calculated by WEBIRA (
), WEBIRA (
), EMDCW, CILOS, IDOCRIW, R1SAW and R2SAW methods exposed very strong correlation between European countries ranking results obtained by all seven methods. All coefficients except one are significant at the 0.01 level. The highest Spearman’s
is between both WEBIRA and WEBIRA-SAW method results (0.942–0.981), the lowest—between CILOS and EMDCW rankings (0.639). Results of the correlation analysis presented in
Table 10. Correlation analysis results revealed that all rankings are consistent with each other.
Furthermore, cluster analysis of European countries was performed with ranking results obtained by seven MCDM methods (input data for cluster analysis is in
Table 9) in order to give objective and understandable classification of European countries by both physical activity of children and human development indicators [
36]. K-means cluster analysis procedure with log-likelihood distance measure was applied to the data. The number of clusters was chosen as 4. Cluster analysis results submitted in
Table 11. It is easier to interpret cluster analysis results if we look at weighting sums
and
values in
Table 7.
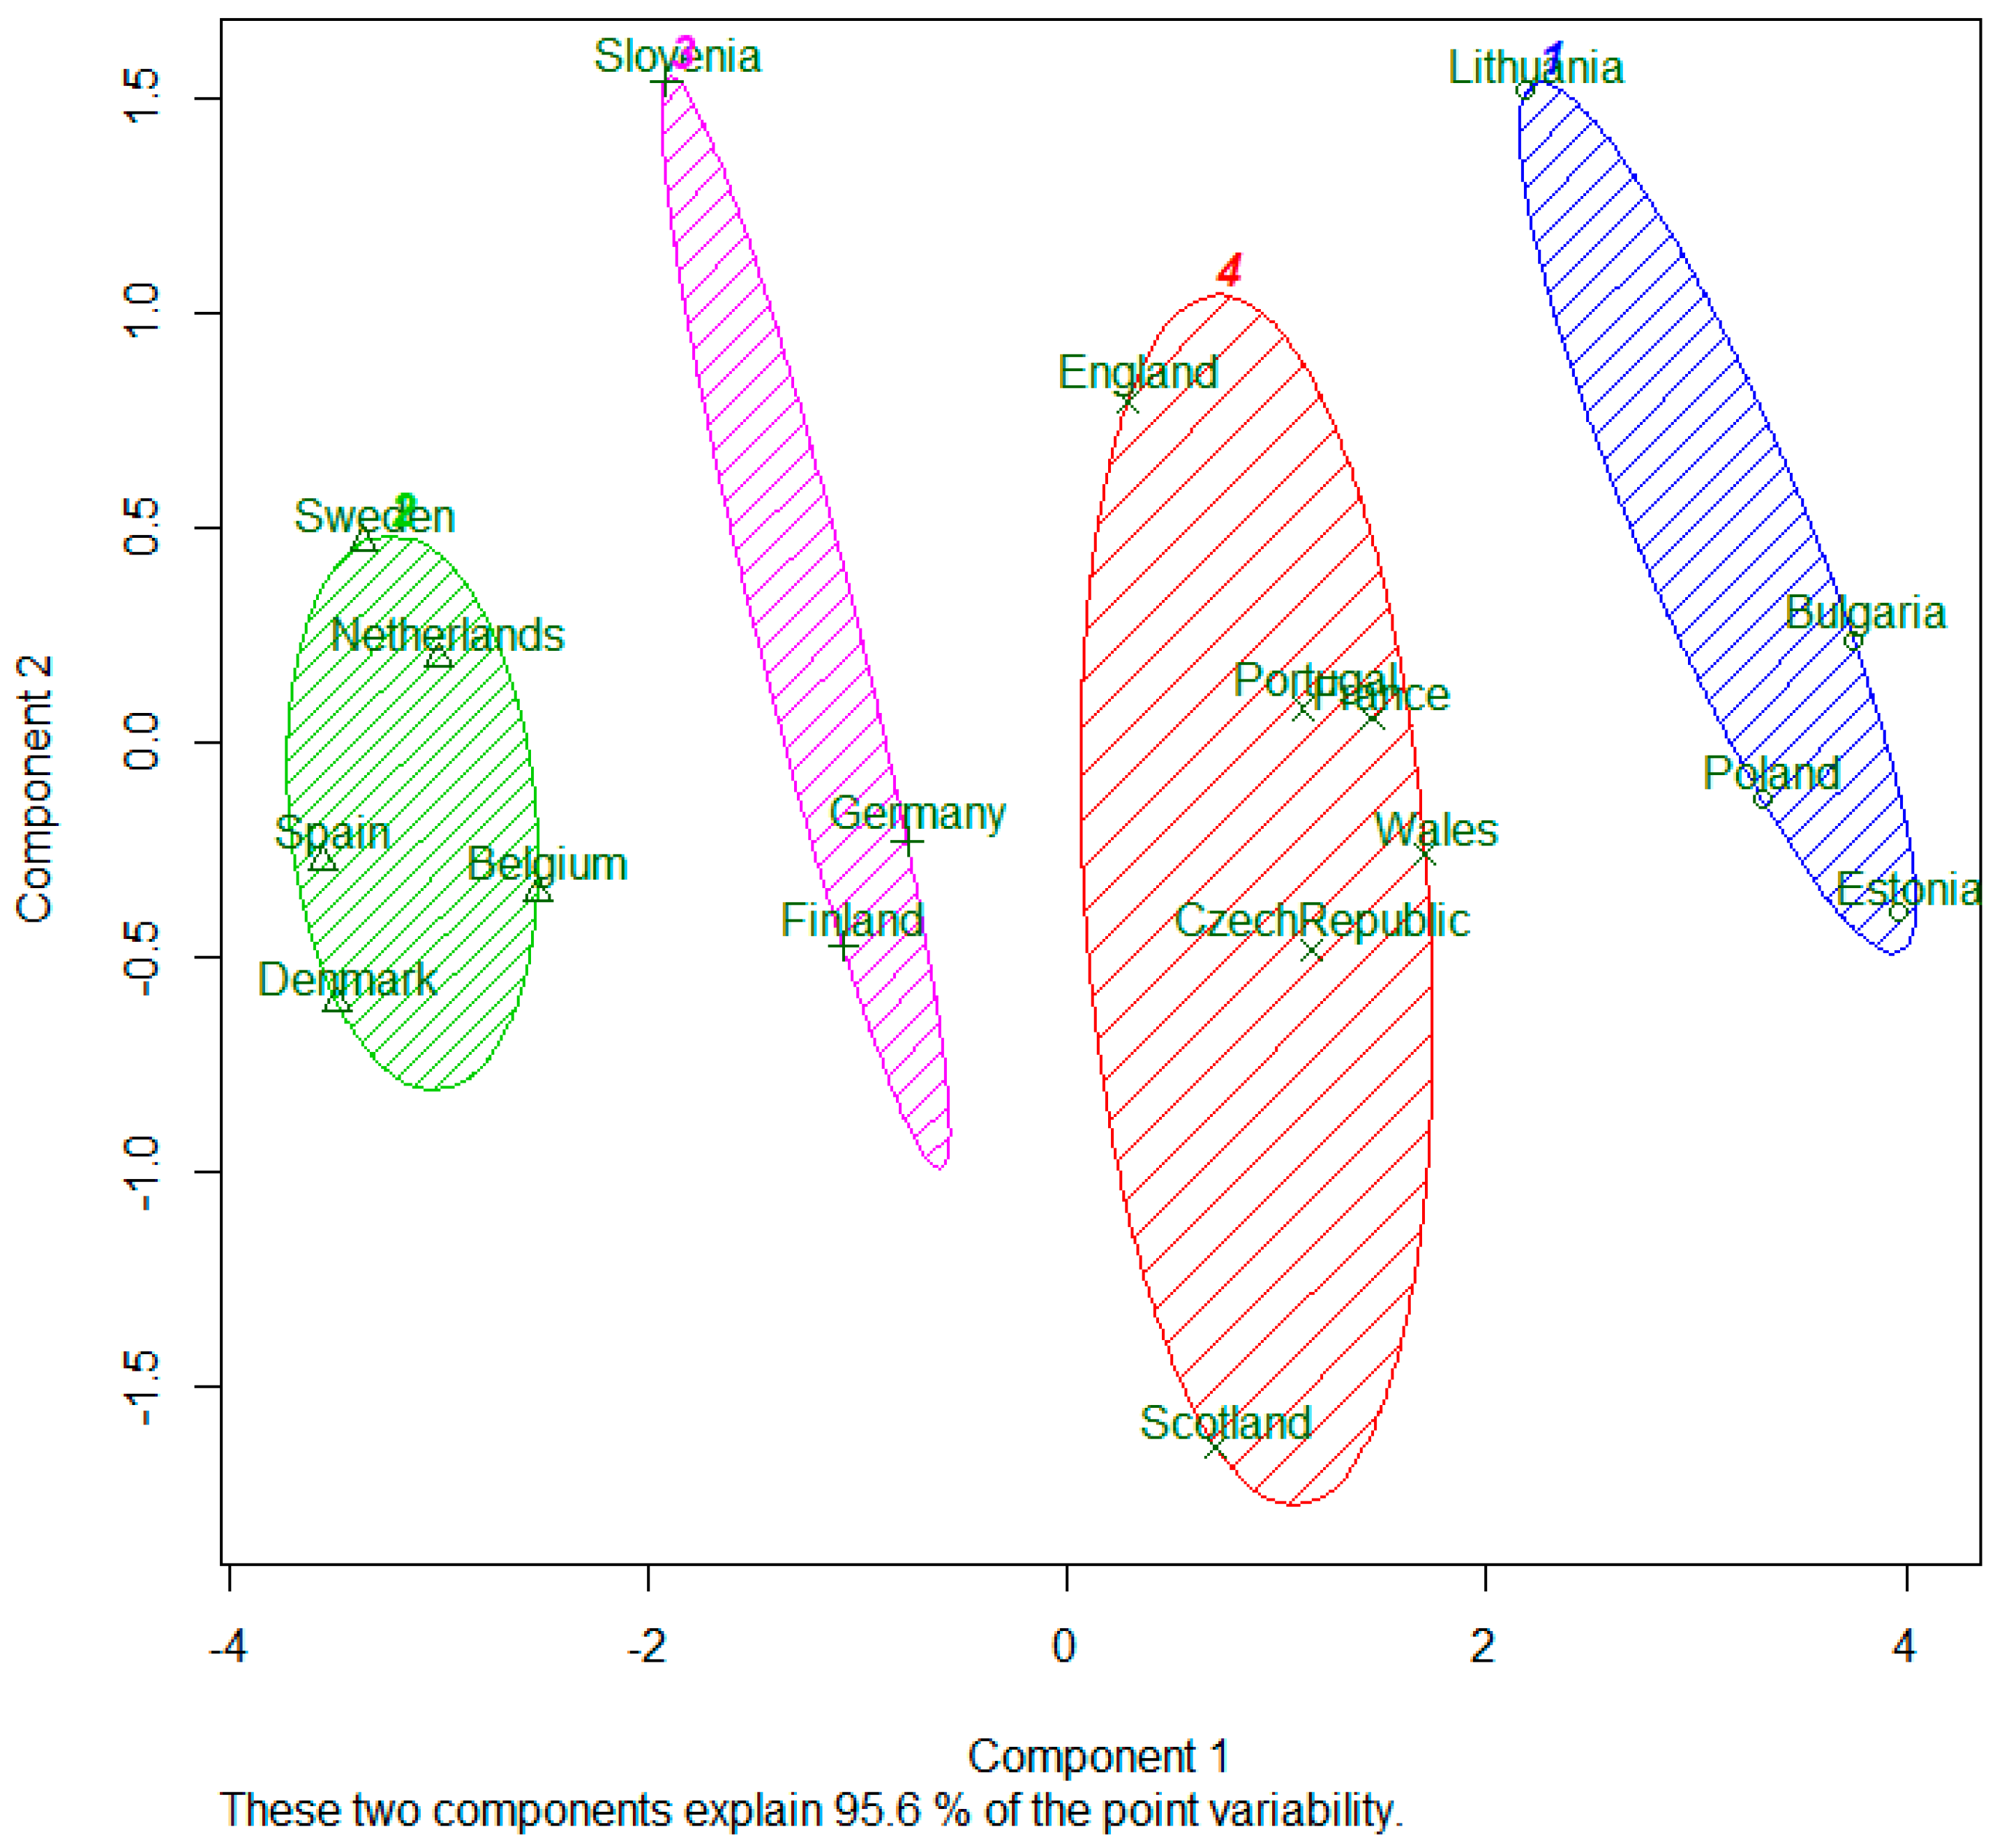
In Cluster 3, the countries strongest in both sets of criteria included, i.e., Belgium, Denmark, Netherlands, Spain and Sweden. Both
and
values for these countries are high. Cluster 3 countries pay great attention for children physical activity and country human development components. Cluster 2 also involves strong countries: Finland, Germany and Slovenia. However, one of the weighted sums for these countries is slightly lower that for Cluster 3 countries. Cluster 1 consists of the weakest countries in the sense of mentioned criteria—Bulgaria, Estonia, Lithuania and Poland. The remaining six of the countries which are in the middle of classification scale, form Cluster 4. The cluster plot against the first two principal components is presented in
Figure 1.
6. Discussion and Conclusions
The multidimensional level of countries’ evaluation can be measured by multicriterial principle ant it can to uncover new aspects of countries’ weaknesses and strengths. The novel methodologies can help government officials and policymakers towards creating effective solutions. HDI is one of the most widely used composite indicators of socio-economic development [
37]. Countries’ experiences promoting child and youth population physical activity and coherence of human development can help to create the best design in development of the countries [
38,
39]. Multicriteria methods are especially important in solving issues related to public health [
40]. Social factors of the different countries differently influence to the youth generation health behaviors and especially their physical activities which increasing their social inequalities [
41]. Usually, society on individuals and families level build wealth and reduce the risks associated with economics but pay few attention to diseases prevention [
42]. Further, that need to ensure healthy lives of youth and children population and promote wellbeing for all society at all ages and reduce inequality within, and among nations. Motor competences of the population significantly correlate with physical activity. Therefore, science studies of youth generation should be considered maintaining high levels of perceived motor competence, as it is a significant factor of all population physical activity. Factors which strongly influence social development of many countries are the most common discussions today in the center of research and political. Positive human behaviors in youth ages have the potential to last into later adulthood [
43]. Children and youth education, and human physical environment are in the center of research and political discussion that help to find the ways of countries social development. Eventually, appropriate children’s physical activities level can let global competitiveness of states in the future [
44,
45]. Physical activity can improve mental health of children’s and adolescents’ population. Such a country’s policy generates cost savings for medical care [
46]. Directives of the European Union are often under criticism for insufficient efforts for the promotion of important decisions for social welfare and development of society [
47]. The operations management/operations research literature is silent pertaining to countries objective ranking according to indicated criteria giving those measured weights. In order to accurately assess all criteria and to give them objective values, it is necessary to identify the strength of relations between the evaluation criteria. We hope that the result of this research will encourage and stimulate policymakers to take physical activity more seriously in strategic level and should help the countries to focus on the WHO target to achieve a reduction by 10% in physical inactivity by 2025 [
48]. Surveillance of public physical activities worldwide needs to be maintained and information about public health research and practice experience need to be shared. Moreover, physical activity needs to be incorporated into multiple decision-maker systems that include researchers, public health practitioners and government structures delegates. Progressive countries stimulate public physical activities experience creating a friendly environment for the society and there public health is more effective [
49].
In this article, four MADM methods were applied to solve the task of ranking 18 European countries according to children’s physical activity and human development indicators. All compared methods are being entropic by their nature, i.e., use the idea of entropy. The article introduced some new ideas:
Interval entropy for criteria prioritization;
Application of different normalization formulas that maximize interval entropy value of corresponding criteria;
Using -cuts procedure for countries ranking.
We apply the WEBIRA method and use the concept of entropy to sort the criteria and (to set priorities; see Formula (10)). In the sums (see Formula (9)), the higher weighting coefficients are obtained by the criteria with higher entropies. The weighting coefficients themselves are found in solving the optimization problem (12) and do not use the previously calculated entropies. This is the fundamental difference between WEBIRA and other entropy-based methods used in this article. These methods directly use entropy values to calculate weighting coefficients. The WEBIRA method allows to better match the ranks of sorted objects according to the criteria and .
Note that classical entropy is defined for the discrete source of information, i.e., probabilistic distribution , and the values themselves are not needed to calculate the entropy. When is the result of certain measurements, the classical entropy can be very “sensitive” to small changes in the data. For example, due to measurement errors, all are different. Then the value of classical entropy gains its maximum. However, if the values are rounded, the entropy may decrease to the minimum values. For this reason, it is sometimes not possible to unambiguously sort the criteria in the WEBIRA method, as some of them have the same priorities. For example, several prioritizations of criteria were obtained and the same number of relevant optimization tasks were addressed. Clearly, this reduces the effectiveness of the WEBIRA method.
Considerations above on classical entropy encouraged us to define interval entropy in this paper. In this case, the values are grouped into intervals and therefore they become necessary for the calculation of entropy. When all values are different but very close, the interval entropy will no longer achieve the maximum value and it is more suitable for sorting the criteria in the WEBIRA method. Thus, the article proposes a modification of the entropy-based WEBIRA method and this is a novelty of the research presented in the article. Note that the article deals with the division of the interval into subintervals when is the length of the data vector. Dividing the interval into another number of subintervals is the subject of our further research.
All seven MADM methods ranking results are highly correlated with each other. The results of cluster analysis are basically consistent with WEBIRA ranking of countries. WEBIRA’s advantage over other methods is that it allows countries to be evaluated and ranked according to the interdependence of the two criteria groups. Meanwhile, other entropy-based methods deal with attributes (criteria) as a whole without dividing it into subgroups. For this reason, the impact of one group of criteria is practically negligible. CILOS “ignored” all criteria of physical activity of children and youth group, EMDCW and IDOCRIW assigned practically zero weights to human development indicators. WEBIRA-based methods exhibited that they are well-suited for the task of evaluating alternatives according to interrelation of two or more groups of criteria. Criteria prioritization procedure of WEBIRA detected most informative group indicators—sedentary behavior, organized sport and physical activity—having equal weights, while in group of criteria the highest weight has expected years of schooling, then goes life expectancy at birth. Mean years of schooling impact is negligible and GNI per capita has zero weight. We see, that last two indicators are redundant. It is surprising in the case of GNI per capita, since this indicator is very popular in scientific literature. It is possible, that mean years of schooling indicator was “removed” regarding to its high correlation with expected years of schooling. Thus, when addressing MADM tasks with two or more naturally related sets of criteria, it is appropriate to apply criteria adapted for that purpose, such as WEBIRA.


