Article

A Case Study of a Lesson on the Sample Mean for Prospective Mathematics Teachers

Department of Mathematics Education, Inha University, Incheon 22212, Korea
Mathematics 2020, 8(10), 1706; https://doi.org/10.3390/math8101706
Submission received: 8 September 2020 / Revised: 26 September 2020 / Accepted: 28 September 2020 / Published: 3 October 2020

Abstract

:
In statistical inference, many students have a difficult time learning the sample mean, sampling distribution, and the central limit theorem, even though these are key concepts in statistics. This study aimed to identify and correct prospective mathematics teachers’ misconceptions about the sample mean and sampling distribution during the statistical inference process in an introductory statistics course at two Korean universities. It also aimed to develop an exploratory lesson by applying Keller’s ARCS (attention, relevance, confidence, and satisfaction) model so that the prospective teachers could better understand the sample mean and sampling distribution and correct their misconceptions. The exploratory lesson was implemented, observed, and analyzed. The findings showed that the exploratory lesson had positive effects on prospective teachers’ attention, relevance, confidence, and satisfaction. In addition, through communication and discussion with their peers, they could better understand the concepts, discover new facts, and correct their misconceptions in the exploration process of the lesson. Thus, this study provided empirical evidence to show that an exploratory statistics lesson using Keller’s ARCS model can be an effective lesson model for teaching statistical inference.

1. Introduction

Recent interest in teaching methods for the development of statistical literacy has grown amid attempts to understand data science and the development of artificial intelligence [1,2,3,4]. In statistical inference, the sample mean and the central limit theorem (CLT) are the key concepts [5,6]. However, students taking introductory statistics courses face difficulties [7] when the class content progresses from the sample mean and sampling distribution to the CLT in the statistical inference section [8,9,10,11,12]. This begs the following question: What is an effective way to teach the sample mean to students?
Teaching statistics is different from teaching mathematics. In a statistics class, students learn the differentiated properties of statistical thinking based on inductive reasoning while actively applying and relating the properties to real life through mathematical modeling. In contrast, mathematics classes are taught based on axioms, which are the starting point of mathematical thinking. In a mathematics class, students learn new definitions and deductive thinking based on a premise. A mathematics class consists of processes of proving and inventing a new theorem.
Most students may be able to do the calculations needed in statistical estimation while studying statistics and probability, but they may often be unable to understand the underlying process or properly interpret the results of these calculations [8]. For example, the students do not understand that the sampling distribution of the sample mean, an important statistic, tends to have the shape of a normal distribution, even if they are able to calculate the sample mean. Such students may have misconceptions about the sampling process. Sampling distribution is an abstract and profound concept that can be grasped only after a clear understanding of basic concepts such as sample, population, variability, sampling, statistics, random variable, and random sample has been developed. Therefore, students may struggle to understand the basic properties of the sample mean and the sampling distribution in statistical data analysis and statistical inference, even though they do a good job with mechanical calculations in statistics as they do in mathematics. Moreover, giving theory-focused lectures from a mathematical point of view during a statistics course discourages students from actively participating in the class.
To overcome these challenges, previous studies on sampling distribution in statistics education have suggested using computer simulations and presented teaching methods using technology [8] (p. 295). The development of various statistics software is still in progress, and there are many studies that have reported a positive effect on students who used computer simulations to learn statistics. The computer simulation methods positively influenced the students’ affective domain, such as interest and attitude [13]. Upon discovering that the content of sampling distribution is hard for high school students to understand, Saldanha and Thompson [14] conducted an experiment using computer simulations for teaching. The simulations helped the students understand the properties of the sampling distribution. However, it was observed that computer simulation was not sufficient, because students still had difficulty understanding sampling distribution in depth. It is hard to find studies on the effect of implementing various class activities without using any technology, such as computer simulations, to teach intuitive understanding of sampling distribution to students. Hancock and Rummerfield [15] examined the effect of including hands-on simulation prior to computer simulation on students’ understanding of sampling distributions. In an introductory statistics course of university, one group of students experienced hands-on simulation using dice, cards, or tickets prior to computer-simulated activities, and the other group of students experienced computer simulation alone with the same time-on-task. The researchers found significant evidence that the students who participated in a hands-on activity before computer simulation showed greater improvement in their exam scores from the first midterm to the final exam, on average, compared to those who only did computer simulations. The study thus indicated that hands-on activity can be helpful and important for a deep understanding of sampling distribution.
This study aimed to design and apply an exploratory lesson for students to experience “doing mathematics” instead of resorting to the computer-simulated technology. This study proposes an exploratory lesson model that applies Keller’s ARCS (attention, relevance, confidence, and satisfaction) model of motivational design theory [16] as a solution to remedy the shortcomings of the preceding studies that used computer simulations in an introductory statistics course for prospective mathematics teachers. Through this exploratory lesson, the students can discover and perceive the concept and properties of sampling distribution and identify and correct their misconceptions, even if it takes them longer to do so than if they had used technology. Thus, the purpose of this study is to provide empirical evidence to show how the exploratory lesson can be effective for teaching sampling distribution. The research questions are listed below:
  • What are the students’ misconceptions regarding the sample mean that are revealed when the exploratory lesson is performed?
  • What do students gain through the exploratory lesson that implements Keller’s ARCS model of motivational design theory?

2. Theoretical Background

Harry Wong and Rosemary Wong [17] said in their book The First Days of School: How to Be an Effective Teacher that teachers undoubtedly influence their students. Their book provides practical guidelines for teachers to answer the question “How can I be an effective teacher?” They also emphasize that teachers should have professionalism to evoke students’ curiosity, build students’ confidence, and motivate and inspire students to pursue a better future.
When it comes to improving the professionalism of prospective mathematics teachers by teaching them the concept of sample mean in a statistical inference class, a special class design is essential. This study applies Keller’s ARCS model of motivational design theory [16] to an introductory statistics class to provide the prospective mathematics teachers with the motivation and stimulation to learn statistics on their own. The following approaches were taken as a theoretical foundation. First, this study conducted a brief analysis of the instructional content and misconceptions about the sample mean and the sampling distribution in the statistical inference process. Second, this study investigated Keller’s ARCS model of motivational design theory as a theoretical framework for the introductory statistics classes. In this chapter, these two approaches will be discussed.

2.1. Key Concepts Concerning the Sample Mean and the Sampling Distribution

First, it is necessary to define what the sample mean and sampling distribution are. In general, given a sample size n , consider n independent random samples Χ 1 ,   Χ 2 , ,   Χ n . Each of these samples has the distribution of the population identically, with mean μ and standard deviation σ . The sample mean is defined to be Χ ¯ =   1 n ( Χ 1 + Χ 2 + + Χ n ) . A sampling distribution of a statistic such as the sample mean is the probability distribution that specifies probabilities for the possible values the statistic can take. The sampling distribution of the sample mean is approximately normal, and it is often called the central limit theorem (CLT). In other words, the CLT states that for random sampling with a large sample size n , the sampling distribution of the sample mean Χ ¯ is approximately a normal distribution with mean μ and variance σ 2 n [18].
To investigate how to teach the concept of the sample mean and the sampling distribution in an introductory statistics course, the study of Chance, delMas, and Garfield [8] (p. 295) can be used as a helpful reference. Their study focused on students’ difficulties in learning about sampling distribution and indicated the students’ prior knowledge for learning sampling distribution and misconceptions of the sampling distribution. The following list in Table 1 shows the key concepts and topics of prerequisite knowledge necessary for learning the properties of sampling distributions. The contents of Table 1 encompass the basic concepts and ideas in basic statistics, which take sufficient time to be acquired. As the field of mathematics is characterized by stratified knowledge, possessing prior knowledge of a mathematical concept becomes very important to the learner. In other words, a lack of prior knowledge poses a serious obstacle to the learner’s next step of knowledge acquisition.
Table 2 shows the specific knowledge essential for understanding sampling distributions [8]. It describes what students should understand about sampling distributions. It comprises the concepts that should be taught to students to lead them into and verify the CLT, which is the most fundamental theorem in inference statistics.
In general, students tend to form misconceptions when they confuse the mathematical or statistical concepts with everyday terms or when there is a discrepancy between their intuitive ideas and statistical facts in the process of abstracting the essence of a certain condition. The contents of Table 3 are the research findings of Chance, delMas, and Garfield [8] regarding the misconceptions that are frequently observed in students attending an introductory statistics course.
As previously stated, in order to fully understand sampling distributions, students should have prerequisite knowledge for learning the sampling distributions and/or correct their misconceptions about the sampling distributions. Therefore, it is important to devise a lesson that enables instructors to identify what students know and correct the students’ misconceptions about sampling distributions in an introductory statistics course.

2.2. Keller’s ARCS Model of Motivational Design Theory

In an introductory statistics course at the college level, stimulating students’ motivation and engaging them to actively participate and ask questions can result in an exceptional experience in which the students fully enjoy their intellectual freedom and responsibility. Thus, a well-designed lesson plan that increases students’ motivation to learn introductory statistics is essential.
Keller [20] indicated that “motivation is generally defined as that which explains the direction and magnitude of behavior, or in other words, it explains what goals people choose to pursue and how actively or intensely they pursue them” [20] (p. 4). He presented the ARCS model of motivational design theory and designated attention, relevance, confidence, and satisfaction as the four essential components for the motivation for learning. The theory proposes methods of designing an engaging class while describing each component in terms of direction and magnitude.
The theory was built on the following standards that define and observe students’ motivation [21]:
  • The motivation for learning is defined in a way to enable the teachers to observe actual changes by their measures.
  • The motivation for learning is defined in a way that can be easily understood by other teachers or class designers.
  • The motivation for learning enables the teachers to manipulate the motivation for learning.
The ARCS model was developed to better understand the major influences on learning motivation and to ascertain systematic ways to identify and solve problems with learning motivation [16]. Through the ARCS model, teachers or class designers may have the confidence to influence their students’ motivation for learning and can promote their own understanding of and access to better teaching methods by analyzing the learning motivation. Keller’s ARCS model consists of four categories—attention, relevance, confidence, and satisfaction—and these categories provide an overview of the main dimensions of human motivation, especially in learning motivation. In addition, these categories are used as a framework of how to create strategies to prompt and sustain motivation in each of the four areas [20].
The first category, attention, is about capturing the interest of learners and stimulating their curiosity to learn. The strategies for grabbing students’ attention include perceptual arousal, inquiry arousal, and variability. The next category is relevance, which is about meeting the personal needs and goals of the learner to affect a positive attitude. Strategies for establishing relevance include goal orientation, motive matching, and familiarity. The third category, confidence, is about helping the learners believe and feel that they will succeed and control their success. Strategies for building students’ self-confidence include learning requirements, success opportunities, and personal control. The last category is satisfaction, which is about reinforcing accomplishment with rewards (internal and external). Strategies for increasing satisfaction include natural consequences, positive consequences, and equity [20]. Table 4 shows the descriptions of the strategies for the four categories.
As shown above, Keller’s ARCS model [20] provides insight into what teachers or class designers should consider and what strategies should be used in order to design lessons in an introductory statistics course that promote students’ motivation to learn and active participation with inquiry and curiosity. For prospective teachers, the experiences of motivational lessons applying the ARCS model will serve as a cornerstone for improving their ability to design and teach motivational lessons in the future.

3. Methodology

3.1. Participants and Context

In this study, a 2–3-h exploratory lesson, based on Keller’s ARCS model, on the sample mean and sampling distribution was given to 59 prospective teachers (PTs) (34 and 25 third- or fourth-year students from the Department of Mathematics Education in University A and University B in Korea, respectively) and was taught by the same instructor during the fall semester in 2018 and the spring semester in 2019, respectively. In Korea, the PTs usually become middle or high school mathematics teachers after passing the national certification exam. Taking an introductory statistics course is compulsory in order to graduate, and the PTs from both universities took similar introductory statistics courses as well as coursework about mathematics education, so they had similar background knowledge about basic statistics.
The first step in designing an exploratory lesson on the sample mean and sampling distribution was to investigate a learning hierarchy of the research topic, the sample mean, and sampling distribution and then developed a class activity with a worksheet based on the ARCS model. The exploratory lesson consisted of a class activity with dice, a group discussion, and a presentation in which PTs could discover the properties of the sample mean and sampling distribution for themselves by inferring the knowledge of the sample mean and the probability sample. In addition, they could reveal their misconceptions about population, sample, sample mean, and sampling distribution and self-correct these misunderstandings by participating in a group discussion.

3.2. Data Collection

3.2.1. Learning Hierarchy for Sample Mean and Sampling Distribution

Lipson constructed expert maps for the sampling distribution, hypothesis testing, estimation, and statistical inference (Figure 1) and identified certain key propositions that summarized both the knowledge domain and the connections between aspects of knowledge and characterized a connected schema (Table 5) [2] (pp. 274–275). The learning hierarchy and the prior knowledge shown in Lipson’s expert map for sampling distribution indicate that students should learn sampling distribution after learning all the basic concepts in an introductory statistics course such as population, sample, sample statistics, and sampling variability [2].
This concept map could prompt an exploratory lesson entailing the rolling of dice in an answer to the following question: “How can prospective teachers reach knowledge about the sample mean and sampling distribution?” Through this exploratory lesson, the PTs can experience what the population and sample are and how to perform the sampling process in a concrete and condensed situation.

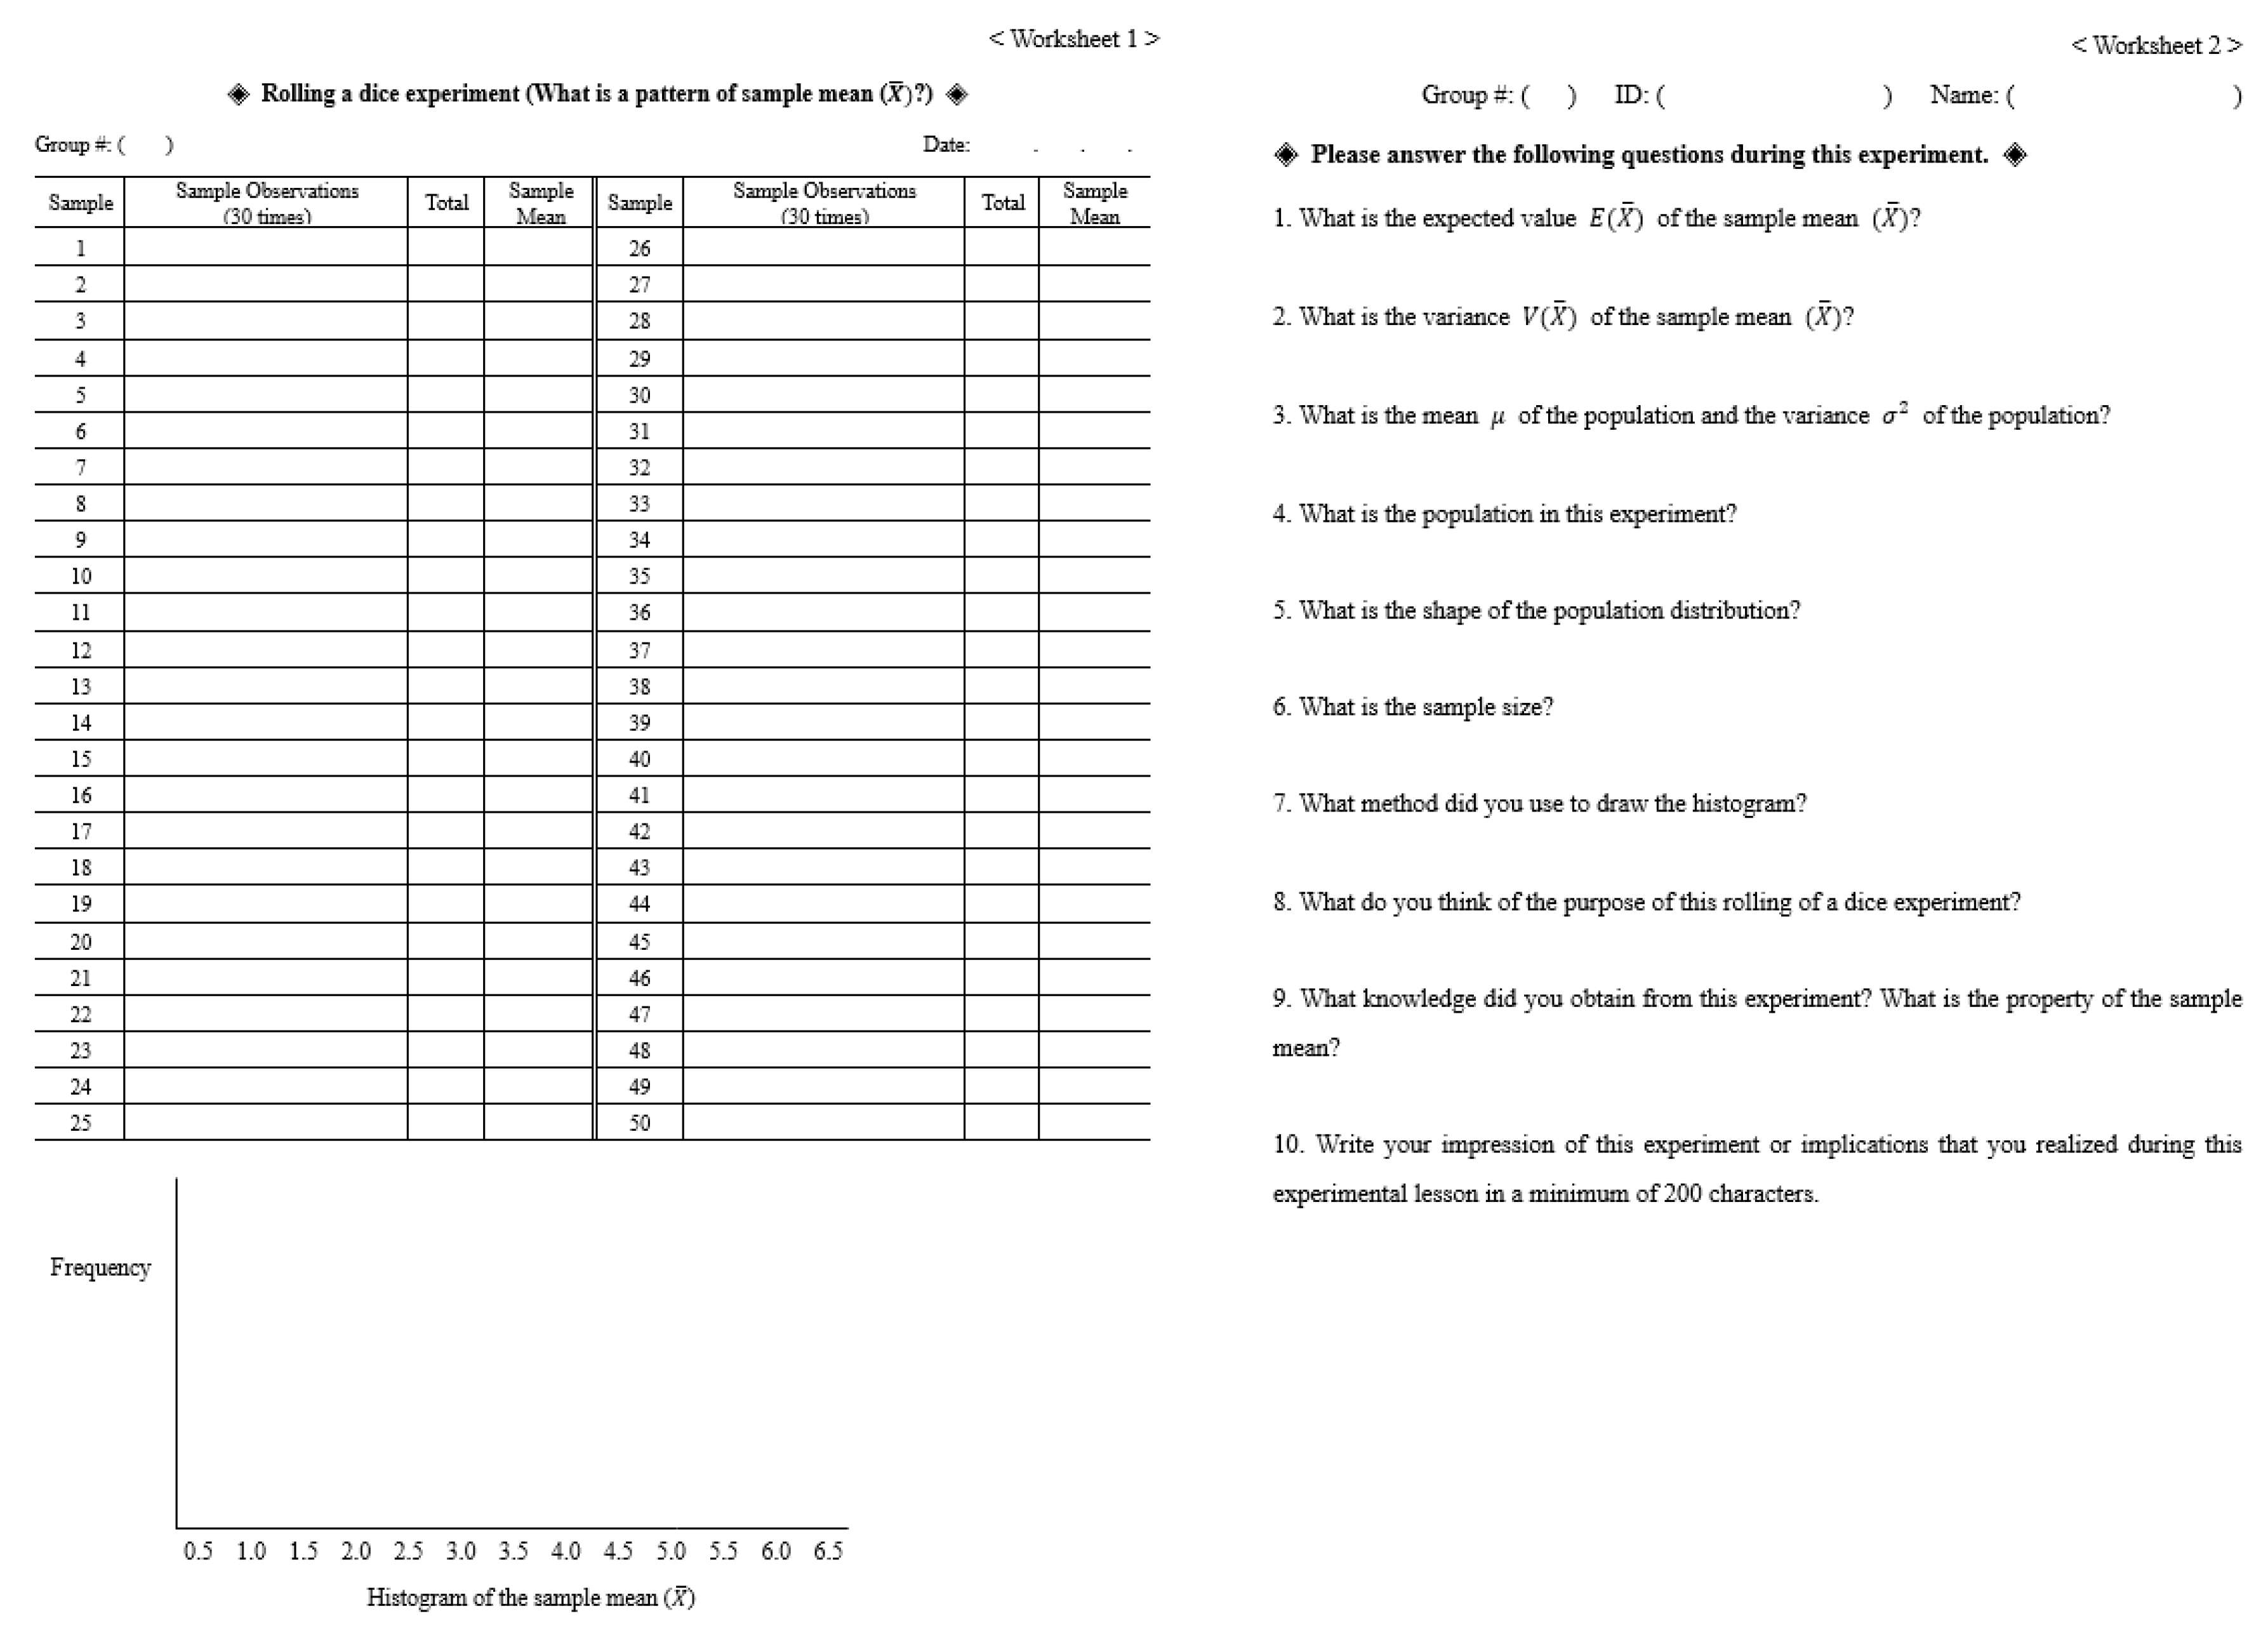
3.2.2. Design of Exploratory Lesson Using Strategies of Keller’s ARCS Model

Table 6 shows the exploratory lesson design integrating strategies of attention, relevance, confidence, and satisfaction based on Keller’s ARCS model while taking the learning hierarchy into consideration.
First, the introduction of the exploratory lesson was designed to grab PTs’ attention. As an inquiry arousal strategy of attention, questions about the topic to be covered that day are posed to the PTs to pique their curiosity. For example, they are asked, “Among the commonly known means and variances in the field of statistics, can you name all the types of means?” This question stimulates curiosity and surprise among PTs and leads them to ask themselves, “What are the various types of means?” Then, the instructor can help the PTs recall arithmetic mean, geometric mean, harmonic mean, weighted mean, trimmed mean, population mean, and moving average, while arousing their curiosity about sample mean, which is a new concept to them.
After arousing the PTs’ curiosity about the sample mean, the instructor introduces the sample mean with background knowledge on subjects such as population, sample, and sample statistics and engages the PTs in a group discussion and an exploration to sustain their interest. Thus, posing challenging questions to PTs plays a crucial role in helping them think about different types of means, including the sample mean.
In the second stage, exploration, the PTs do a dice-rolling activity. This is a group activity for discovering the distribution of sample mean. Each group contained a random selection of 4–5 PTs. Each group rolls the dice 30 times and calculates the total sum and mean and then repeats this process 50 times, resulting in rolling the dice a total of 1500 times. Then, each group collects the results by filling in a worksheet (Figure 2). That is, the PTs in each group roll a dice separately, records the means in the table, and then gathers the results and draws a histogram as a schematic diagram showing the distribution of the sample mean. After the dice-rolling exploration, the PTs answer 10 questions in worksheet 2. The questions cover what the expected value and variance of the sample mean are, what the population in this exploration is, what the mean and variance of population are, what the shape of the population distribution is, and what the property of the sample mean is. The last prompt is for PTs to write their impressions or the implications of this exploration that they realized.
In this stage, by experiencing the sampling process in person, the PTs can learn what the population, sample, sample mean, sampling variability, and sampling distribution exactly are. In addition, the dice-rolling exploration can be considered an application of the variability strategy of attention because performing a different type of activity such as this exploration with dice is helpful for stimulating PTs’ attention (Figure 3). In terms of the relevance, the familiarity and motive matching strategies are used to increase the PTs’ motivation. In the exploration, the PTs used dice, which are familiar manipulates to them, and the hands-on activity using dice can match or satisfy PTs’ learning styles and make them feel comfortable. Since the worksheets also provide what is expected of them, what they would learn, or what would be evaluated during the exploration, the learning requirements strategy of confidence is used. As a personal control strategy, the PTs can have control in the exploration while producing their own outcomes by their hand with dice.
Third, in the development stage of the exploratory lesson, all group representatives present their results to the class using a histogram. When they see the similarity in the histograms of each group, they can come to the realization, “There must be a hidden principle or property. This is what it feels like to discover a property of statistic and verify it with my own eyes!” The instructor leads them to discover the pattern and the hypothesis (i.e., the approximate image of CLT) through discussion and visual verification. This provides the PTs with an eye-opening experience of inferring and discovering the pattern of distribution of the sample mean.
In addition, by sharing and comparing their answers to 10 questions, the PTs can have opportunities to think about what population, sample size, or sampling distribution is exactly and reveal their misconceptions about them. In this stage, the PTs can expand their knowledge about sample mean and sampling distribution to CLT. The strategies used in this stage are success opportunities (confidence) and natural consequences (satisfaction). When presenting and discussing the exploration results and answers to the 10 questions in the worksheet, the PTs experience successes. The PTs can discover or acquire new knowledge about the sample mean and sampling distribution through their discussions so that they can maintain their intrinsic enjoyment in learning.
In the ending stage, the instructor summarizes the exploration results from all groups and what they discovered from the exploration. If the PTs reveal their misconceptions about the content, the instructor can pose appropriate questions to correct their misconceptions. By summarizing what the PTs learned and correcting their misconceptions, the instructor gives the PTs meaningful opportunities to learn introductory statistics. Thus, the natural consequences strategy of satisfaction is used.
The dice-rolling exploration, presentation, and discussion in this exploratory lesson were video-recorded, and the PTs’ worksheets and written feedback about the exploratory lesson were collected. Based on these collected responses, I categorized the misconceptions the PTs had and what they learned from the exploratory lesson and describe them in the next chapter.

4. Findings

Based on the PTs’ activities and written material collected from the exploratory lesson, I analyzed their understandings and misconceptions about population, sample mean, and sampling distribution. In this chapter, I describe and discuss their impressions and feedback about the exploratory lesson.

4.1. Identifying the Misconceptions of Prospective Teachers

4.1.1. Misconceptions about the Population in the Dice-Rolling Exploration

The first misconception the PTs commonly held was about the population in the dice-rolling exploration. In this exploration, the PTs rolled the dice 30 times, found the mean of the numbers, and then repeated this 50 times. That is, they rolled the dice 1500 times in total. In this process, some PTs had a misconception about the population, as they failed to consider the nature of the population distribution. For example, most PTs could not easily answer the following question:
“In this rolling-a-dice exploration, can you describe what the population is and what its distribution looks like?”
After waiting for their responses, the instructor showed them about 50 dice in a see-through pouch, which they used in the exploration (Figure 3). By taking one dice out of the pouch as a sample and showing the number on the dice, the instructor helped the PTs realize that only one number out of a set {1, 2, 3, 4, 5, 6} was sampled as an individual of the population. When the instructor asked them what the population in this dice exploration was and what the composition of the population was, the PTs came to the realization that the numbers one through six were evenly distributed with the same proportion, saying, “Aha! The population is the numbers one through six (1, 2, 3, 4, 5, 6) that are evenly distributed regardless of a dice itself or the number of dice in the pouch!” In addition, they realized that the population was forming a uniform distribution, with an even distribution of each number.
Then, the PTs also discovered that even though this distribution of the population had a uniform distribution, the distribution of the sample mean had a convex and symmetrical distribution in the middle, similar to a bell shape, which is different from the population. This discovery surprised the PTs. Using common sense, people assume that the population and the sample resemble each other because the population is an entire set, and the sample is a subset representing the population. So, they think that the distribution of the sample mean would also be similar to the population. However, the actual results of the exploration showed that the distributions of the population and the sample mean were different. The PTs observed the bell-shaped sampling distribution of the sample mean as a new discovery about the property of the sample mean. Such a discovery enabled the PTs to intuitively understand that the sample mean distribution of a large sample was close to a normal distribution, regardless of the population distribution, which is the main concept of the CLT. Thus, this discovery enabled them to later learn a new concept.

4.1.2. Misconception about the Sample Size in the Dice-Rolling Exploration

The second misconception of the PTs was about the sample size in the dice-rolling exploration. During the exploration, the PTs were asked to calculate a sample mean using the result of rolling the dice 30 times and to record the value after calculating a sample mean 50 times. In the end, the PTs rolled the dice 1500 times altogether. Then the instructor asked them the following question:
“What do you think the sample size is in this rolling-a-dice exploration?”
Surprisingly, many PTs’ answers were 50. Very few PTs gave the correct answer of the sample size, which was 30. This showed the PTs’ misconception that the sample size in this exploration was the number of times the sample mean was calculated. That is, they thought the calculation process to find the sample mean, which was repeated 50 times, was the sample size. There are three possible reasons why the PTs showed this misconception: First, they did not clearly recognize the definition of the sample size. The number of the individuals in the sample collected from the population is a sample size. Second, the PTs lacked a proper understanding of the sample mean as a statistic. Third, the PTs had no experience sampling and calculating the statistic on the spot.
PTs’ misconceptions about the sample size were corrected as follows: First, the instructor reminded them that the definition of sample size is the total number of subjects in the sample and the process of calculating the value of the desired statistic. Second, through repeated Q&A sessions with the instructor, the PTs explained what the sample size was to each other and helped themselves realize that the total number of subjects obtained in one sampling was the sample size. Third, the PTs reflected on the exploration process overall.

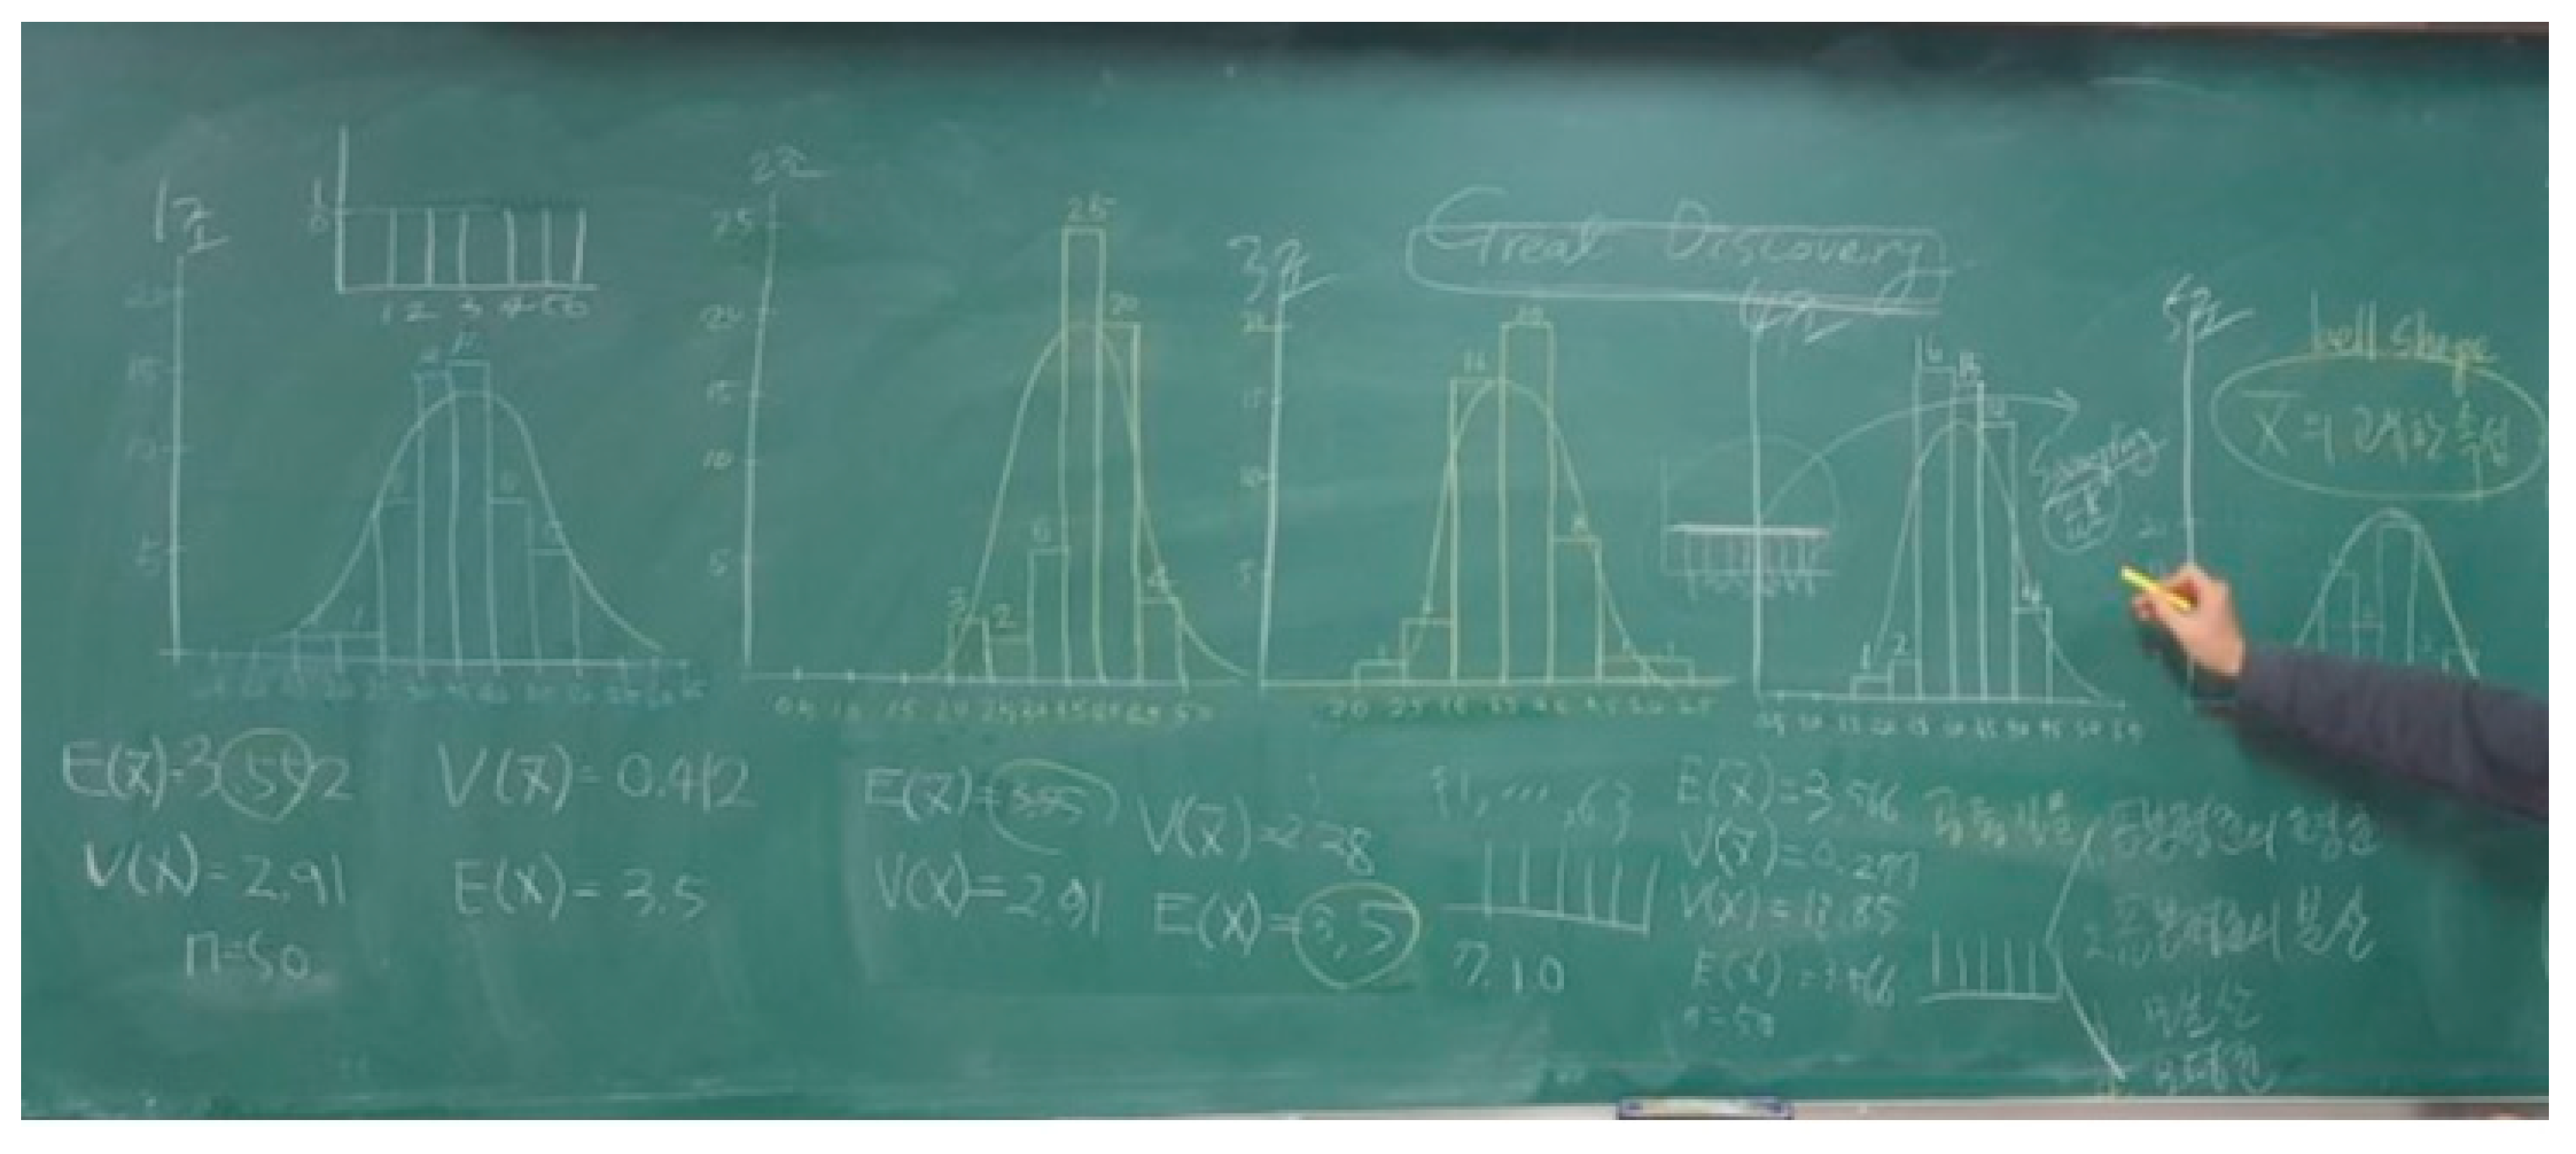
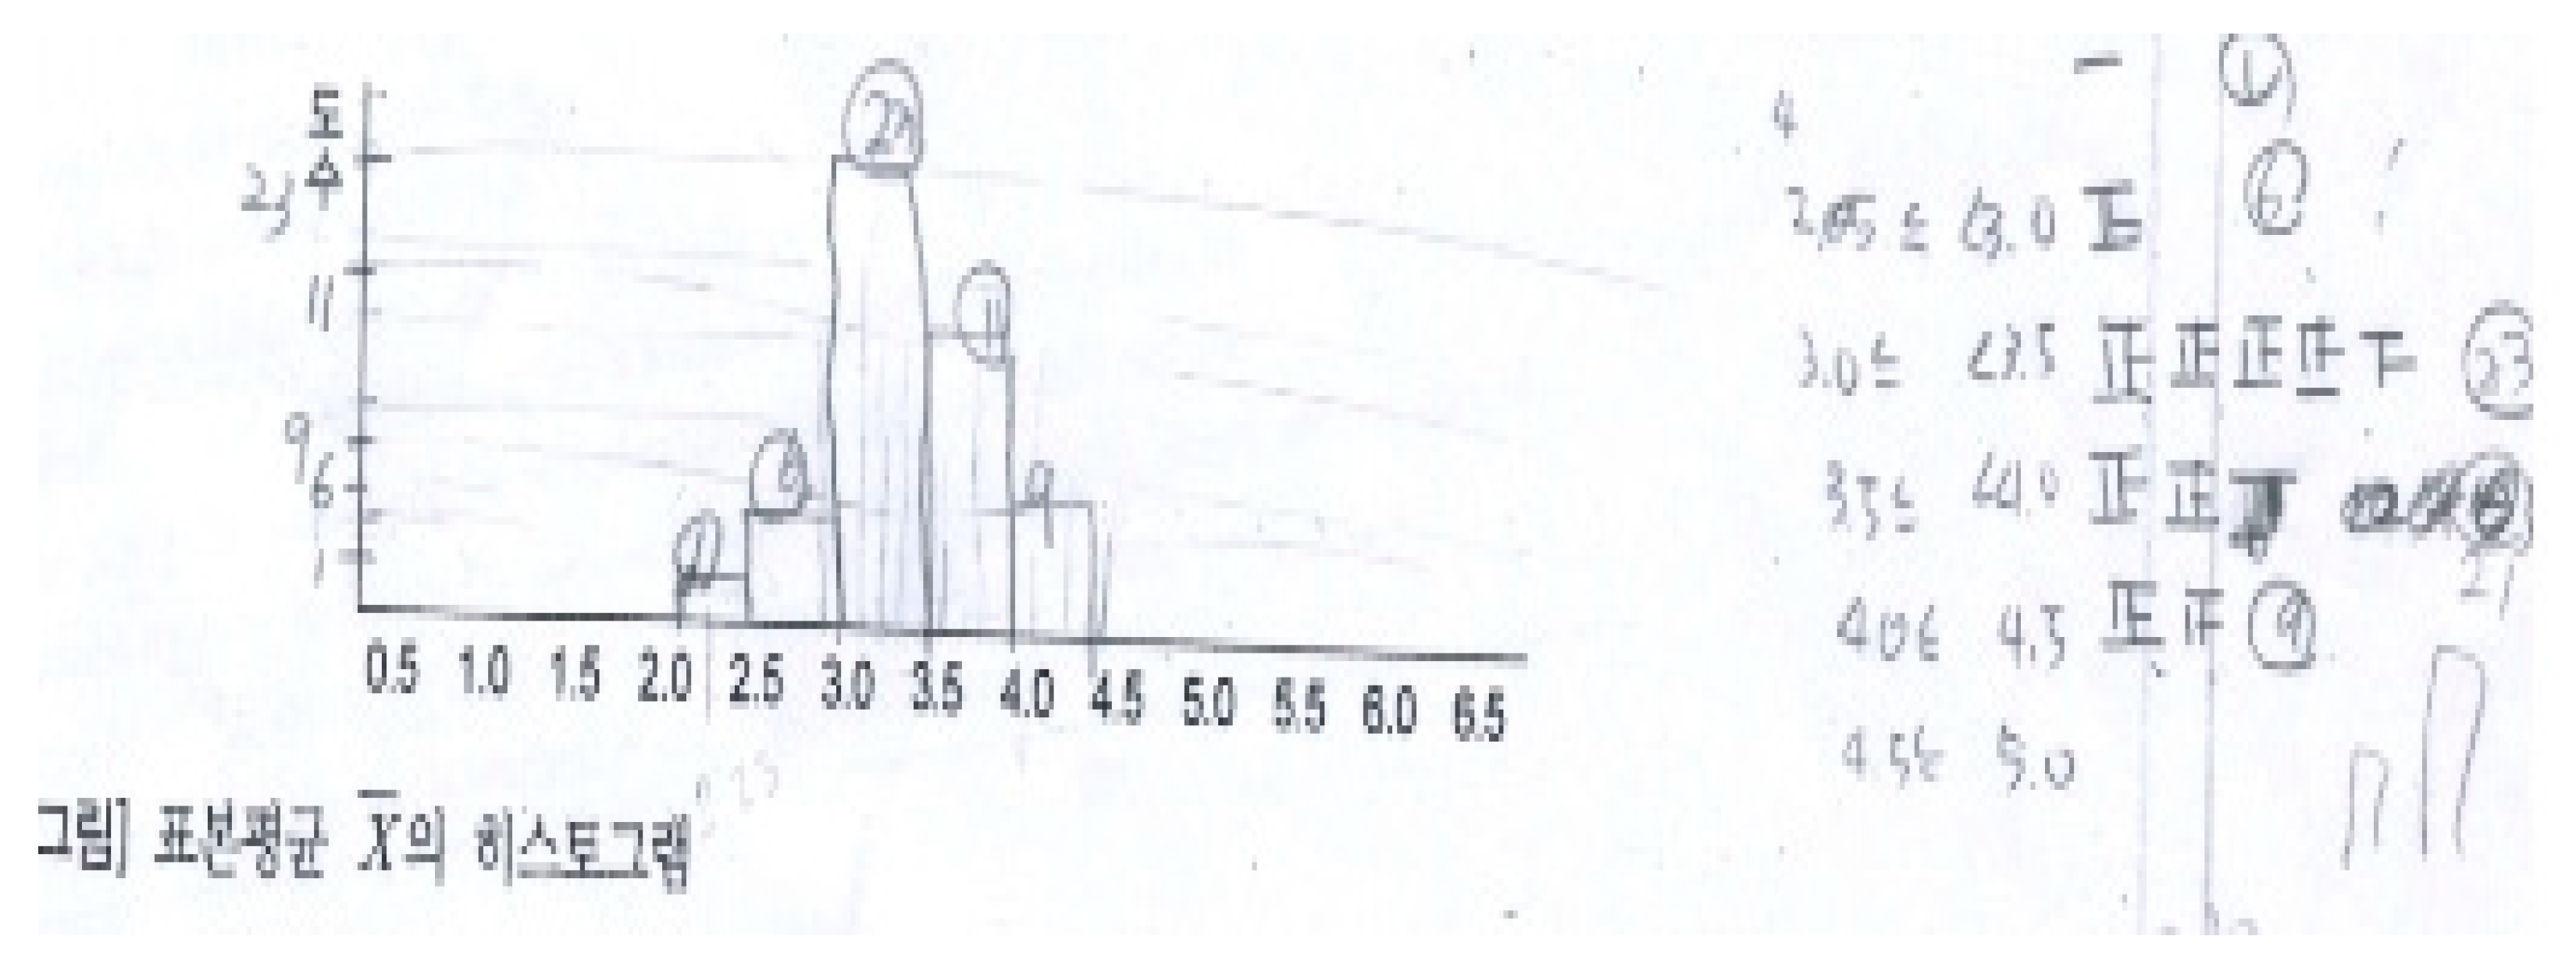
4.2. An Anecdote about Discovering the Property of Sample Mean Distribution

After the dice-rolling exploration was conducted by each group of PTs, the written responses were collected. Feedback from several PTs was selected from among the collected responses as examples of what they felt and realized from the exploratory lesson. Through analysis of PTs’ responses, I found a few features that are worth noting.
First, the exploratory lesson influenced the PTs’ attention. Prospective teacher 1 (PT1) wrote that “When I first rolled the dice during the exploration, I wondered what the purpose of this activity is.” PT2 stated that “When the professor told us to roll the dice 50 times, I doubted its usefulness in learning. Nonetheless, it [conducting the dice-rolling exploration] helped me understand the CLT, as well as the population mean, population variance, sample mean, sample variance and sample size much easier than writing.” In addition, PT3 mentioned that “In other college classes, I always acquired knowledge through three stages: theorem, proof, and example. However, in this class, the dice exploration was conducted in the order of short introduction, exploration, results collection, conjecture, and theorem presentation. It made me think to myself, ‘Why this? How? And what next?’ during the exploration, and I could understand the theorem [CLT] much better when it was presented after the exploration.” As stated above, PTs indicated that the dice-rolling exploration stimulated their curiosity and captured their attention because it was different from ordinary class activities. The exploration consisted of a short introduction, an exploratory activity, collecting and presenting results, and making and confirming conjectures, so PTs sustained their attention and motivation to learn during the exploratory lesson. Thus, the exploratory lesson could grab the PTs’ attention.
Second, the exploratory lesson influenced the prospective teachers in terms of relevance. PT4 stated that “I thought it was a great exploration because deriving the theorem from simple and easy activities rather than being told the facts leading to the theorem was very rewarding and memorable.” PT5 mentioned that “I found the property of the sample mean fascinating. I was only simply following the exploration instruction; then I suddenly arrived at the CLT. It was nice to grasp the concept through the class activity, and the activity made it easier to understand the concept of CLT than learning it only based on a formula. It will be hard to forget the concept of CLT for a while.” PT2 also wrote that “I realized that participating in the hands-on exploration helped me retain the concept for a long time.” The PTs indicated that learning the properties of sample mean and sampling distribution as well as the CLT from the dice-rolling exploration was easier to understand and helpful for remembering it for a long time, as opposed to learning by being told or by memorizing the formulas. This exploratory activity matched the PTs’ motive structures and learning styles, so they could better understand and remember the concepts. Therefore, the exploratory lesson established relevance.
Third, the exploratory lesson influenced the PTs’ confidence. Figure 4 shows each group’s blackboard presentation of their findings from the dice-rolling exploration. The presentation was intended to elicit PTs’ surprise upon discovering the property of the sample mean after noticing the common pattern in the analysis results when all groups had finished sharing their results. All PTs were fascinated to see that each group’s histogram of the sample mean presented a similar distribution pattern shaped like a bell, even though the population had a uniform distribution. They were surprised again to learn that the pattern illustrated a theorem called the CLT. They intuitively experienced the CLT through the exploration.
PT1 wrote that “I couldn’t believe my eyes when I saw the graphs drawn on the blackboard by each group. I was amazed to find that the result of 50 or so different people rolling the dice produced an almost identical distribution curve. … This exploration made me think that I should be able to utilize what I learned from this exploration. It was a very fascinating and meaningful exploration that led to a great discovery by using a dice.” In addition, PT6 stated that “I only knew how to calculate the mean and variance of the population and the sample using a formula. However, I did not know the difference between the two concepts clearly. Through this exploration, I was able to clearly understand the difference between the population and the sample by learning how to calculate the sample mean and sample variance from this exploration.” As mentioned above, the PTs had the opportunity to control their exploration by rolling a dice, collecting results, and presenting those in a histogram to receive feedback from the class discussion. They experienced success in conducting the exploration, discovering the properties of the sample mean and sampling distribution, and clarifying ambiguous and difficult statistical concepts. Thus, the exploratory lesson built the PTs’ confidence.
Fourth, the exploratory lesson influenced the PTs’ satisfaction. As shown before, many PTs stated that they were surprised because the results of a simple exploration formed a pattern, and it became a theorem. Through the exploration and class discussion, they better understood and learned the properties of the sample mean and sampling distribution and the CLT, and they enjoyed the learning. It seemed that the PTs earned internal rewards such as satisfaction in acquiring new knowledge.
Lastly, the exploratory lesson influenced the PTs’ reflection. Some PTs reflected on their learning or the exploratory lesson. Figure 5 shows Group 1′s histogram of exploratory results. The sample mean has a bell-shaped and symmetrical distribution, with one peak. This shows that Group 1 used the number of strokes in a Chinese character (正) as the method for drawing the histogram, instead of using the stem-and-leaf plot that they had learned in the previous class. Actually, none of the groups used the stem-and-leaf plot to represent or summarize the data.
Only after the instructor reminded the PTs of the usefulness of the stem-and-leaf plot, PTs realized that they had already learned a very easy and convenient way to represent or summarize the data. PT5 wrote that “I realized that knowing and using—propositional and methodical knowledge—are different. Even though I had done the task and taken an exam related to the stem-and-leaf plot, I could not apply the knowledge properly when I faced the challenge. I realized that internalizing the knowledge requires a considerable effort.” PT1 also mentioned that “When I was drawing a histogram, I experienced ‘oops’ moment by remembering hearing the professor say that it is easier to use the stem-and-leaf plot, which I had studied so hard for the mid-term exam.” As shown above, PTs reflected on their learning about the stem-and-leaf plot. The advantage of the stem-and-leaf plot is that it can simply and quickly summarize the results of the investigation without loss of information, which can help one discover the characteristics of the distribution. Thus, the exploratory lesson could stimulate reflection on their learning and relevance by providing the PTs with an opportunity to be reminded of the usefulness of the stem-and-leaf plot, which is part of their prior knowledge.
PT4 reflected on the exploratory lesson, stating that “It would be desirable to conduct the exploration with various populations to prove that the sample mean represents a normal distribution regardless of type of population distribution. Lastly, because the 10 questions in the worksheet could elicit the facts that learners discover directly from this exploration, it would be good to use and apply the exploratory lesson in the field of education.” PT4 showed that he had thought about how to improve this exploratory lesson and how to apply it to his future students when he became a mathematics teacher. Therefore, attention, relevance, confidence, and satisfaction for motivation to learn were gained by the PTs through the exploratory lesson, which was a good experience for them to improve their professionalism and teaching methods as mathematics teachers in the future.
Based on the observations of the exploratory lesson and the written feedback of the PTs in the exploratory lesson, I summarized the findings as follows. The dice-rolling exploration in this study was designed based on Keller’s ARCS model of motivational design theory, and the findings of this study showed that this exploratory lesson model met all four criteria necessary to be a motivational design: attention, relevance, confidence, and satisfaction. If mathematics educators in college were to implement this exploratory lesson with sufficient time for their PTs, the PTs could have opportunities to succeed in the process of understanding mathematical and statistical concepts.

5. Discussion

This case study implemented and analyzed an exploratory lesson that integrated Keller’s ARCS model to provide a more effective lesson on discovering the property of the sample mean in the process of statistical inference of the sampling distribution for prospective mathematics teachers in an introductory statistics course.
In this study, the prospective mathematics teachers shared some overall features. First, through the exploratory lesson, it was revealed that the prospective teachers had misconceptions about the population and sample size in the dice-rolling exploration, even though those are basic concepts. The PTs did not quickly answer the question of what the population of the dice-rolling exploration was. Since the PTs chose one dice among many dice in the pouch and rolled it, they focused on the number of dice in the pouch. Therefore, they had a difficult time recognizing that the population is a set {1, 2, 3, 4, 5, 6} regardless of the number of dice in the pouch. In addition, the PTs confused the sample size with the number of times it took to calculate the sample mean, a statistic. This was because the PTs did not have a clear understanding of the sample size and the sample mean, and they also did not have experience with the sampling process and calculating the statistic.
The misconceptions of the prospective teachers in this study were similar to common misconceptions of students about sampling distribution (Table 3) presented in Chance, delMas, and Garfield’s study [8]. The prospective teachers could not recognize the distribution of the population, which was uniform, and thought that the distribution of the population looked like the sampling distribution, a bell-shaped distribution.
Second, the PTs’ misconceptions about the population and sample size could be corrected by class discussion after the exploration. Through reminders and discussions of the definition of sample size and the processes of sampling and calculating the statistic we want to find, the instructors helped the PTs realize and correct their misconceptions.
Third, the exploratory lesson based on Keller’s ARCS model of motivational design [20] was implemented and was found to meet all the criteria for a motivational lesson (attention, relevance, confidence, and satisfaction), as the prospective teachers actively participated in exploratory activities with vigor and discovered the statistical concepts through these activities. In terms of attention and relevance, the instructor stimulated the prospective teachers’ curiosity and motivation to learn by conducting the dice-rolling exploration, which aligned with the prospective teachers’ learning styles. The exploratory lesson not only helped the prospective teachers discover the property of the sample mean, the sampling distribution, and the connection to the CLT as well as self-correct their common misconceptions, but it also had a positive effect on them as it increased their confidence and satisfaction in acquiring new knowledge on their own. In particular, the process of the exploration revealed how hard it was for the prospective teachers to understand the sample mean and sampling distribution clearly. These observations were helpful for constructing exploratory lesson activities that enabled the prospective teachers to correct their misconceptions, expand their inference, and discover the properties of the sample mean and sampling distribution.
Fourth, the prospective teachers tended to be unable to use what they already knew. In this study, although the prospective teachers had already learned the stem-and-leaf plot before participating in the exploratory lesson, they did not think to use it when summarizing the results of the exploration in a histogram. This was not because the stem-and-leaf plot was a difficult concept to use, but they lacked experience using or applying what they had learned in a problem-solving situation. Therefore, the exploratory lesson was meaningful regarding their rediscovery of the usefulness of the stem-and-leaf plot.
Lastly, the exploratory lesson provided the prospective teachers with an opportunity to think of how to improve the exploratory lesson for their future students. This study is significant, as the exploratory lesson can be seen as a tool for developing professionalism in prospective mathematics teachers while they discover statistical concepts on their own.
Several limitations of this study need to be addressed. First, there was no control group to compare with the participants of the exploratory lesson. Second, there was no pre- or post-test of the prospective teachers’ knowledge about sampling distribution. Due to these limitations, it was difficult to support the results of this study statistically. Rather, this study is a quantitative case study that focused on the process of identifying and correcting the prospective teachers’ misconceptions and reinforcing their motivation to learn through an exploratory lesson. However, since it would be better to support the results of this study by having a control group for comparison or by conducting pre- and post-tests using statistical analyses, these factors should be considered in future studies. Lastly, the gaps of prior knowledge among the participants from the two universities were not considered. Even though the participants took similar introductory statistics courses as well as mathematics education coursework, and the exploratory lesson was taught by the same instructor, the difference in their prior knowledge could have influenced the results of this study.
Despite the limitations of this study, the findings have several important implications. First, the findings of this study provide insight into which aspects instructors of introductory statistics course or mathematics teacher educators (MTEs) should consider to improve their students’ understanding of concepts in an introductory statistics course. For example, in this study prospective teachers could not apply their prior knowledge (e.g., stem-and-leaf plots) during the exploratory lesson, even though this was an easy concept to use. Thus, the instructors or MTEs should provide diverse opportunities for students to apply what they already know in a problem-solving context.
Second, in the field of statistics, we can collect, organize, and interpret data that is appropriate for our purposes in order to produce the desired information; in other words, we are both producers of statistical information and consumers of that information. Therefore, in order to better understand statistics, students in an introductory statistics course should experience the process of collecting, organizing, and interpreting data rather than memorizing formulas from a textbook. By providing an effective exploratory lesson model based on Keller’s ARCS model, this study suggests a way to improve prospective teachers’ understanding of sampling distribution and to increase their motivation to learn sampling distribution. Thus, the instructors or MTEs can access the exploratory lesson and effectively apply it to their own classes, thus motivating their classes to better learn sampling distribution.
Lastly, this study contributes to the literature on teaching methods that can be used to motivate students to learn about and correct their misconceptions of statistics without the use of technology. Many researchers recommend hands-on activities, even if they also use computer-simulated methods, because interactive hands-on activities help students differentiate between sampling distributions and population distributions [22,23,24], especially, repeatedly taking random samples from a population [25]. However, Sotos, Vanhoof, Van den Noortgate, and Onghena [11] also indicated that there is still a lack of empirical research or evidence to detect, describe, and correct the misconceptions of students, and they stressed the need for empirical research into designing experiments as a possible means of overcoming these detected misconceptions. This study illustrates an exploratory lesson model that can be used as empirical evidence to show that diverse teaching methods or approaches, such as the dice-rolling exploration, can be used to motivate students to learn statistics and detect and correct their misconceptions without resorting to technology. In fact, because the prospective teachers used their hands to roll dice, collected the results of the dice-rolling exploration, represented those as a histogram, and discovered the properties of the sample mean and sampling distribution from the results that they had produced, they could build confidence by feeling more personal control than when they used automated computer programs.

Funding

This research received no external funding.

Conflicts of Interest

The authors declare no conflict of interest.

References

  1. Garfield, J. The challenge of developing statistical reasoning. J. Stat. Educ. 2002, 10, 1–12. [Google Scholar] [CrossRef]
  2. Lipson, K. The role of the sampling distribution in understanding statistical inference. Math. Educ. Res. J. 2003, 15, 270–287. [Google Scholar] [CrossRef]
  3. Mills, J. Using computer simulation methods to teach statistics: A review of the literature. J. Stat. Educ. 2002, 10, 1–20. [Google Scholar]
  4. Williams, A.M. Student’s Understanding of the Significance Level Concepts. In Statistical Education-Expanding the Network Proceedings of the 5th International Conference on Teaching Statistics, Singapore, 21–26 June 1998; Pereira-Mendoza, L., Kea, L.S., Kee, T.W., Wong, W., Eds.; International Statistics Institute: Voorburg, The Netherlands, 1998; Volume 2, pp. 743–749. [Google Scholar]
  5. Lipson, K. The Role of the Sampling Distribution in Developing Understanding of the Statistical Inference. Ph.D. Thesis, Swinburne University of Technology, Melbourne, Australia, 2000. [Google Scholar]
  6. Moore, D.S.; McCabe, G.P. Introduction to the Practice of Statistics, 3rd ed.; W. H. Freeman and Company: New York, NY, USA, 1999. [Google Scholar]
  7. Ben-Zvi, D.; Garfield, J. Statistical literacy, reasoning, and thinking: Goals, definitions, and challenges. In The Challenge of Developing Statistical Literacy, Reasoning and Thinking; Ben-Zvi, D., Garfield, J., Eds.; Kluwer Academic Publishers: Dordrecht, The Netherlands, 2004; pp. 3–15. [Google Scholar]
  8. Chance, B.; delMas, R.C.; Garfield, J. Reasoning about sampling distributions. In The Challenge of Developing Statistical Literacy, Reasoning and Thinking; Ben-Zvi, D., Garfield, J., Eds.; Kluwer Academic Publishers: Dordrecht, The Netherlands, 2004; pp. 295–323. [Google Scholar]
  9. Lipson, K. The Role of Computer Based Technology in Developing Understanding of the Sampling Distribution. In Developing a Statistically Literate Society Proceedings of the 6th International Conference on Teaching Statistics, Capetown, South Africa, 7–12 July 2002; Phillips, B., Ed.; International Statistics Institute: Voorburg, The Netherlands, 2002; pp. 1–6. [Google Scholar]
  10. Shaughnessy, J.M. Research in probability and statistics: Reflections and directions. In Handbook of Research on Mathematics Teaching and Learning: A Project of the National Council of Teachers of Mathematics; Grouws, D.A., Ed.; Macmillan: New York, NY, USA, 1992; pp. 465–494. [Google Scholar]
  11. Sotos, A.E.C.; Vanhoof, S.; Van den Noortgate, W.; Onghena, P. Students’ misconceptions of statistical inference: A review of the empirical evidence from research on statistics education. Educ. Res. Rev. 2007, 2, 98–113. [Google Scholar] [CrossRef]
  12. Yu, C.; Behrens, J.T.; Anthony, S. Identification of misconceptions in the central limit theorem and related concepts and evaluation of computer media as a remedial tool. In ERIC Document Reproduction Service No. 395 989; ERIC: New Orleans, LA, USA, 1995; pp. 1–15. [Google Scholar]
  13. Simon, J.L. What some puzzling problems teach about the theory of simulation and the use of resampling. Am. Stat. 1994, 48, 290–293. [Google Scholar]
  14. Saldanha, L.A.; Thompson, P.W. Students’ Reasoning about Sampling Distributions and Statistical Inference. In Proceedings of the Twenty-Third Annual Meeting of the North American Chapter of the International Group for the Psychology of Mathematics Education, Snowbird, UT, USA, 18–21 October 2001; Speiser, R., Maher, C., Charles, W., Eds.; ERIC Clearinghouse: Columbus, OH, USA, 2001; Volume 1, pp. 449–454. [Google Scholar]
  15. Hancock, S.A.; Rummerfield, W. Simulation methods for teaching sampling distributions: Should hands-on activities precede the computer? J. Stat. Educ. 2020, 28, 9–17. [Google Scholar] [CrossRef] [Green Version]
  16. Keller, J.M. The use of the ARCS model of motivation in teacher training. In Aspects of Educational Technology; Trott, K.S.A.J., Ed.; Kogan Page: London, UK, 1984; Volume 17, pp. 140–145. [Google Scholar]
  17. Wong, H.K.; Wong, R.T. The First Days of School: How to Be an Effective Teacher; Harry K Wong Publishing Company: Sunnyvale, CA, USA, 2009. [Google Scholar]
  18. Agresti, A.; Finlay, B. Statistical Methods for the Social Sciences, 4th ed.; Pearson Prentice Hall: Upper Saddle River, NJ, USA, 2009. [Google Scholar]
  19. Garfield, J.; delMas, R.C.; Chance, B. Tools for Teaching and Assessing Statistical Inference. 2002. Available online: http://www.gen.umn.edu/faculty_staff/delmas/stat_tools/index.html (accessed on 23 April 2003).
  20. Keller, J.M. The arcs model of motivational design. In Motivational Design for Learning and Performance; Springer: Boston, MA, USA, 2010; pp. 43–74. [Google Scholar]
  21. Keller, J.M.; Song, S.H. Charming Instruction Design; Kyoukkwahaksa: Seoul, Korea, 1999. [Google Scholar]
  22. Zerbolio, D.J., Jr. A ‘bag of tricks’ for teaching about sampling distributions. Teach. Psychol. 1989, 16, 207–209. [Google Scholar] [CrossRef]
  23. Hodgson, T. The Effects of Hands-on Activities on Students’ Understanding of Selected Statistical Concepts. In Proceedings of the Eighteenth Annual Meeting of the North American Chapter of the International Group for the Psychology of Mathematics Education, Panama City, FL, USA, 12–15 October 1996; Jakubowski, E., Watkins, D., Biske, H., Eds.; ERIC Clearinghouse for Science, Mathematics, and Environmental Education: Columbus, OH, USA, 1996; Volume 1, pp. 241–246. [Google Scholar]
  24. Dyck, J.L.; Gee, N.R. A sweet way to teach students about the sampling distribution of the mean. Teach. Psychol. 1998, 25, 192–195. [Google Scholar] [CrossRef]
  25. Harradine, A.; Batanero, C.; Rossman, A. Students and teachers’ knowledge of sampling and inference. In Teaching Statistics in School Mathematics-Challenges for Teaching and Teacher Education; Batanero, C., Burrill, G., Reading, C., Eds.; Springer: Dordrecht, The Netherlands, 2011; Volume 14, pp. 235–246. [Google Scholar]
Figure 1. Expert concept map for sampling distribution. Reprinted by permission from Springer Nature. Lipson, K. The role of the sampling distribution in understanding statistical inference. Math Ed Res J 15, 270–287 (2003).
Mathematics 08 01706 g001
Figure 2. Worksheets 1 and 2 used in the dice-rolling exploration.
Mathematics 08 01706 g002
Figure 3. Dice used in the exploration.
Mathematics 08 01706 g003
Figure 4. Photo of the group presentation.
Mathematics 08 01706 g004
Figure 5. Group 1′s results represented in a histogram.
Mathematics 08 01706 g005
Table 1. Checklist for assessing the students’ prior knowledge and readiness for learning the sampling distribution [19].
Prior Knowledge for Learning the Sampling Distribution
The concept of variability, random variables, and variance
The concept of central tendency and dispersion or spread
The concept of distribution: normal, skewed, uniform, and bimodal
Being able to read and interpret graphical displays of quantitative data and describe the overall pattern of variation
Properties of normal distribution
Probability related to density curve and area
The concept of sampling
The concept of random samples
The relationship between a sample statistic and a population parameter
Table 2. What students should understand about sampling distributions. Reprinted by permission from Springer. Chance, B., delMas, R., and Garfield, J. Reasoning about sampling distributions. In Ben-Zvi, D., Garfield, J. Eds. The challenge of developing statistical literacy, reasoning, and thinking, 295–323 (2004).
A sampling distribution of sample means (based on quantitative data) is a distribution of all possible sample means (statistics) for a given sample size randomly sampled from a population with mean μ and standard deviation σ . It is a probability distribution for the sample mean.
The sampling distribution for means has the same mean as the population.
As the sample size ( n ) gets larger, the variability of the sample means gets smaller (a statement, a visual recognition, and predicting what will happen or how the next picture will differ).
Standard error of the mean is a measure of variability of sample statistic values.
The building block of a sampling distribution is a sample statistic.
Some values of statistics are more or less likely than others to be drawn from a particular population.
The normal approximation applies in some situations but not others.
If the normal approximation applies, then the empirical rule can be applied to make statements about how often the sample statistic will fall within, say, 2 standard deviations of the mean.
Different sample sizes lead to different probabilities for the same statistic value (know how sample size affects the probability of different outcomes for a statistic).
Sampling distributions tend to have the shape of a normal distribution rather than the shape of the population distribution, even for small samples.
As sample sizes get very large, all sampling distributions for means look alike (i.e., have the same shape) regardless of the population from which they are drawn.
Averages are more normal and less variable than individual observations.
Be able to distinguish between a distribution of observations in one sample and a distribution of X ¯ statistics (sample means) from many samples (sample size n greater than 1) that have been randomly selected.
Table 3. Some Common student misconceptions. Reprinted by permission from Springer. Chance, B., delMas, R., and Garfield, J. Reasoning about sampling distributions. In Ben-Zvi, D., Garfield, J. Eds. The challenge of developing statistical literacy, reasoning, and thinking, 295–323 (2004).
Believe sampling distribution should look like the population (for sample size n > 1 ).
Think sampling distribution should look more like the population as the sample size increases (generalizes expectations for a single sample of observed values to a sampling distribution).
Predict that sampling distributions for small and large sample sizes have the same variability.
Believe sampling distributions for large samples have more variability.
Do not understand that a sampling distribution is a distribution of sample statistics.
Confuse one sample (real data) with all possible samples (in distribution) or potential samples.
Pay attention to the wrong things, for example, heights of histogram bars.
Think the mean of a positive skewed distribution will be greater than the mean of the sampling distribution for samples taken from this population.
Table 4. Descriptions of the strategies for the ARCS model categories.
Major CategoriesStrategiesDescriptions
AttentionPerceptual arousal (A1)Use audiovisual materials such as animations, illustrations, diagrams, graphs, sound, and glitter effects that generate the students’ curiosity and emotions.
Inquiry arousal (A2)Engage students in a problem-solving experiential situation to pose or create their own questions, carry out exploratory activities, and solve problems.
Variability (A3)Modify the components of the class, adopt different approaches to class management, and mix a variety of activities such as practice, quizzes, presentations, and class discussions to sustain the students’ attention.
RelevanceGoal orientation (R1)Set achievable goals and have the students perceive usefulness of the new knowledge to them.
Motive matching (R2)Ensure that the lesson matches with the students’ learning styles and personal motive structures.
Familiarity (R3)Use examples, terminologies, or concepts related to the students’ preexisting beliefs, prior knowledge, experience, or values.
ConfidenceLearning requirements (C1)Present clearly the performance requirements for successful learning and the criteria for evaluation to the students.
Success opportunities (C2)Provide challenging tasks and have the students experience successes in the learning or practicing process.
Personal control (C3)Provide opportunities for students to control their learning and give feedback to support their personal endeavors and skills.
SatisfactionNatural consequences (S1)Provide the learners with opportunities to acquire and apply new skills and knowledge to maintain their intrinsic enjoyment in learning.
Positive consequences (S2)Provide positive verbal feedback or appropriate external reward such as incentives, trophies, and special privileges to students. Do not reward the students’ incorrect responses.
Equity (S3)Ensure that course purpose, expectations, and outcomes are consistent with initial presentations and that consistent standards for measuring students’ academic achievements are maintained.
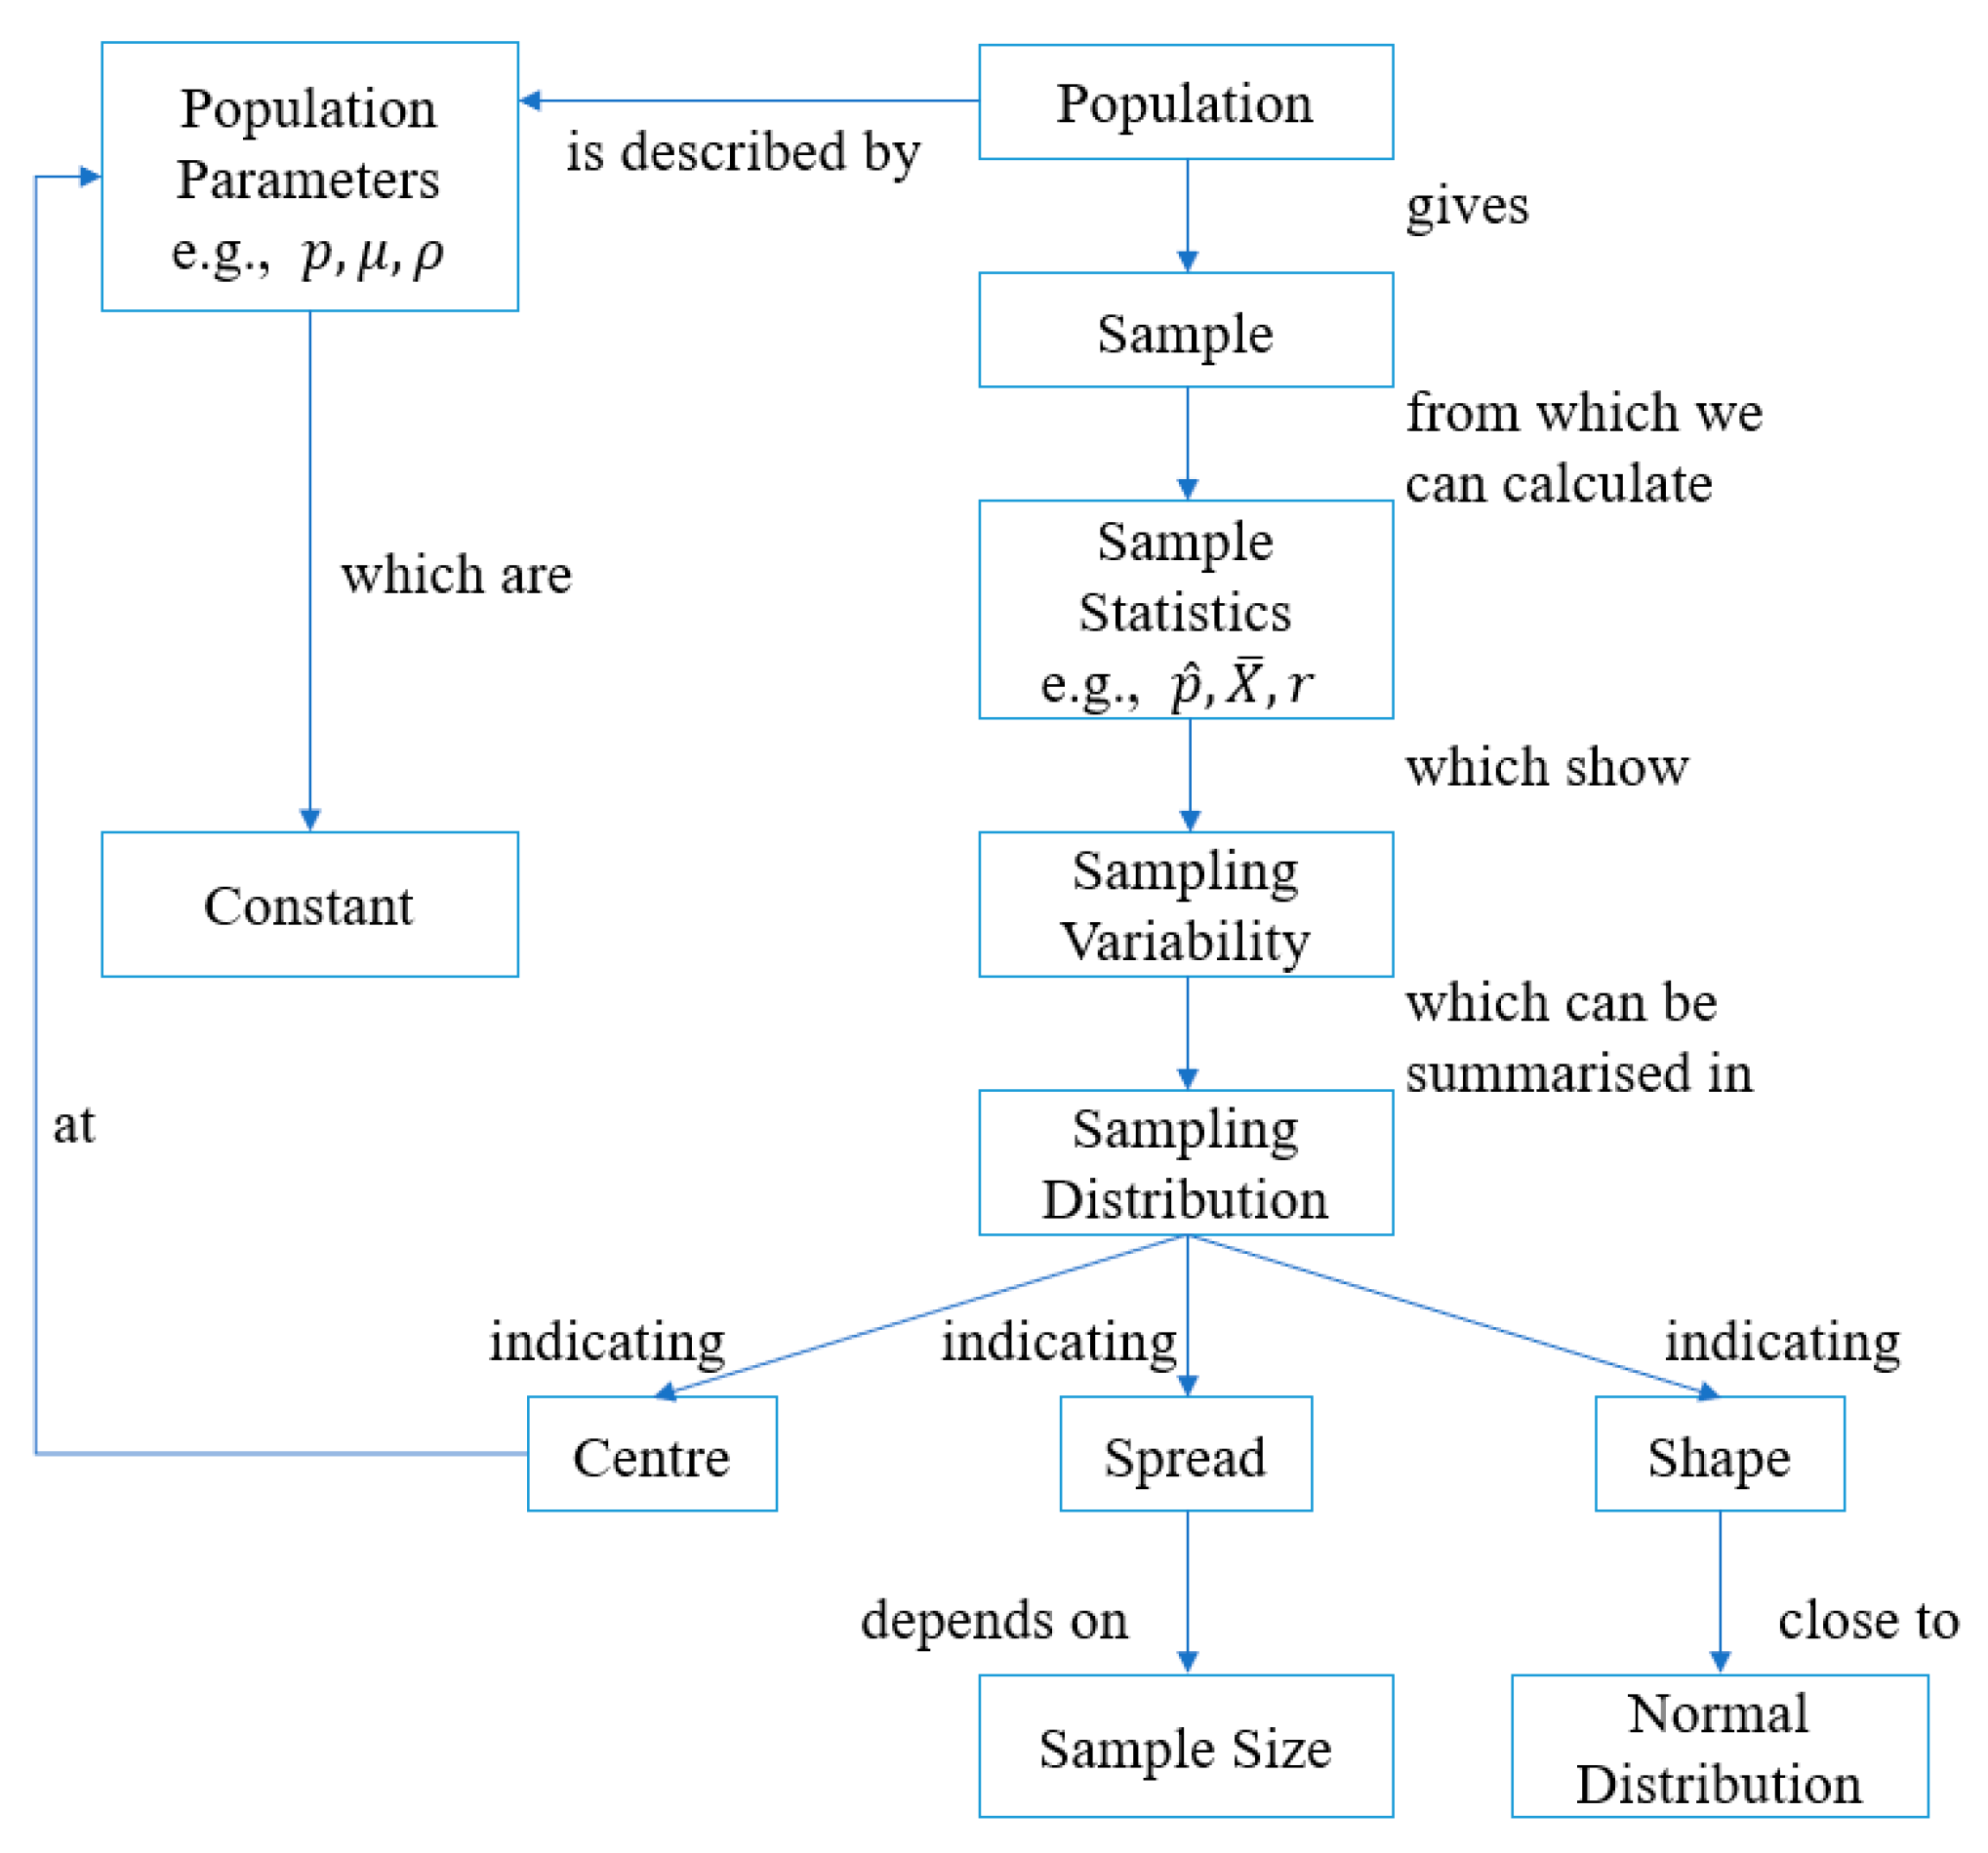
Table 5. Key propositions identified in the expert concept map for sampling distribution. Reprinted by permission from Springer Nature. Lipson, K. The role of the sampling distribution in understanding statistical inference. Math Ed Res J 15, 270–287 (2003).
Propositions
Samples are selected from populations.
Populations (distributions) are described by parameters.
Parameters are constant in value.
Samples are described by statistics.
Statistics are variable quantities.
The distribution of a sample statistics is known as a sampling distribution.
The sampling distribution of the sample statistic is approximately normal.
The sampling distribution of the sample statistic is characterized by shape, center, spread.
The spread of the sampling distribution is related to the sample size.
The sampling distribution is centered at the population parameter.
Table 6. Lesson plan for the exploratory lesson on sample mean and sampling distribution.
Lesson StagesActivitiesConcepts for Sampling DistributionKeller’s Strategies of ARCS
IntroductionTypes of mean
Types of distribution
Population
Sample
Sample statistics
Sample mean
A2 Inquiry arousal
ExplorationRolling a dice exploration
Worksheet
Sampling
Sample mean
Sampling variability
Sampling distribution
A3 Variability
R2 Motive Matching
R3 Familiarity
C1 Learning requirements
C3 Personal control
DevelopmentPresentation and discussion
Question and answer
Center, Spread, Shape
Normal distribution
Central limit theorem
C2 Success opportunities
S1 Natural consequences
EndingSummaryCorrection of misconceptions
Confirmation of central limit theorem
S1 Natural consequences

