Abstract
This study utilized the newly-designed Bayesian equal part regression (BEPR) model to analyze the Taiwan National Security surveyed data from 2015 in order to construct a model of Taiwanese people’s regime acceptance of Mainland China and U.S governments. The study also used the Bayesian Regression model to make a comparison with the BEPR model results and attempted to explore the fluctuations of post mean and post probability of non-zero coefficients for each independent variable in the BEPR model. The major findings are as follows: First, the first equal part of respondents who believe that China would coerce Taiwan to make concessions have the lesser negative level of the regime acceptance of Mainland China, while the second equal part of the respondents who have the same attitude have the higher negative regime acceptance level. The second equal part of respondents who deem the higher possibility of unification have the lesser positive view on the regime acceptance level. Additionally, the first equal part of respondents who have higher evaluation of cross-strait relations have lesser positive impact on the regime acceptance of Mainland China. Second, we obtain the results that the second-third of Taiwanese respondents who have the optimistic household economic outlook or agree to reduce the purchase of U.S. military weapons if Mainland China withdraws its missiles have a higher negative impact on the regime acceptance of the U.S. However, the third equal part of Taiwanese respondents who agree with the current “R.O.C.” country name have a higher negative regime acceptance level of the U.S.
1. Introduction
Taiwanese people’s regime acceptance of China and the U.S. relates to Taiwan’s Cross-Strait and foreign affairs policies formation. Since Taiwan is regarded as the “renegade province” of China by the international community, its relationship with Mainland China and the U.S is important for the island’s future development. This study intends to analyze the regime acceptance of Taiwanese people toward China and the U.S. based on the Taiwan Security Survey data in 2015.
The study also intends to use the newly innovated Bayesian equal part regression method to analyze the influencing factors of regime acceptance in order to comprehend the conditions in different parts of the data. The study also compares our method with the Bayesian linear regression method.
The contents of the study were arranged as follows. The study first introduced the research purpose, literature review, and illustrated the Bayesian equal part regression model and the research results of our regime acceptance model. The study concluded with research results, a discussion, and suggestions.
2. Literature Review
2.1. Regime Acceptance
Regime acceptance is a newly developed concept in political science. The concept of regime acceptance relates to the institutional identity and identity assimilation. Before people have the regime acceptance of a country, they would have the thought of identity assimilation, which means the development of same awareness as the members of the mainstream society [1]. They would have the psychological attachment to that country without considering the government’s performance. It also relates to the policy impacts of other countries on domestic civilians’ political identities. Taiwanese regime acceptance of Mainland China and the U.S. is part of its security issues [2]. Taiwan’s security issues are closely related to the concept of the “China Threat”. The China Threat affects stakeholders’ policies toward Taiwan Strait issues. Some scholars deem the security dilemma of the Taiwan Strait to have influence over cross-strait policy formulation and public opinion in Taiwan [3]. Since Taiwan experienced democratization in the 1990s, Taiwanese political identity grew and deviated from the “One China Principle” proclaimed by China [4]. During the democratization process, Taiwan’s economy waned due to the rising economic power of China. Taiwanese voters focused on economic growth and turned to the Kuomintang (Nationalist Party). This resulted in the KMT’s reign over the government from 2008–2016. In light of Taiwanese voters’ influence, the Taiwanese government’s viewpoint toward cross-strait policy became voter-leaning. The regime acceptance issues also take place in Ukraine. Owing to the extended Russian soft power, researchers find that the different levels of regime acceptance of Russia in Southern, Eastern, and Western Ukraine. The Russian language speakers in Southern and Eastern Ukraine have the higher regime acceptance to Russia and they support more economic integration with Russia [5].
2.1.1. Taiwanese People’s Regime Acceptance of Mainland China
The factors that affect Taiwanese people’s regime acceptance of China include the following [2]:
- (1)
- Social identity: In regard to identity development and change, the Taiwanese people’s identity relates to their social identity, which indicates the social groups to which they belong [6]. According to ethnic identity, Taiwanese people can be classified into three political identity groups, Taiwanese, Chinese, and dual identity. Ethnic identity may affect the Taiwanese people’s political views on unification and other policy preferences. As far as Taiwanese people’s regime acceptance of China is concerned, the political identity issue becomes more intertwined with domestic politics. The political identity issues, such as the degree to which Taiwanese people think of themselves as Taiwanese, Chinese, or both, affects the formulation of Taiwan’s cross-strait policies, economic policies, and social policies [7].
- (2)
- Rational choice: Rational choice theory implies that people can make choices according to their preferences [8]. Taiwanese people’s regime acceptance of China is also based on self-interest. Taiwanese people’s business interests and career paths have a very close relationship with China, and this affects Taiwanese people’s attitude toward China. This means that Taiwanese people’s regime acceptance of Mainland China is also influenced by economic issues. Keng and Schubert also consider that Mainland China used economic incentives as a tool to influence Taiwan’s regime acceptance [9].
- (3)
- Social contact: Social contact theory means that various personal interactions in a group affect the attitudes and behaviors of the group members and individual differences and societal norms construct intergroup contact effects [10]. The regime acceptance of Taiwanese people who do not have close interactions with Mainland China would be influenced by their engrained impression of Mainland China’s political system. Since Taiwan has been regarded as a democratic and free political entity compared with Mainland China’s political system, Taiwanese people have a negative impression of Mainland China’s political system, which would affect Taiwanese people’s regime acceptance of China. Li argues that the different political systems between Mainland China and Taiwan have a significant impact on the social experiences formulation [11]. The difference of political systems also affects the change of nationalism and identities, which would influence the future of cross-strait relations. Lin and Hsieh [12] deem that the Taiwanese people’s public discontent with Mainland China already exists and would aggravate the uncertainty of cross-strait relations.
- (4)
- Political socialization: Political socialization is the process by which political culture can be transferred from one generation to the next [13]. There are four major political socialization agents, including family, school, peer group, and mass communication media. Taiwanese people’s regime acceptance of China can be formulated and affected by these agents. The younger generation in Taiwan, which is different from the older generation, is becoming hostile to Mainland China. This phenomenon aggravates cross-strait relations and resulted in the sabotage of cross-strait trade talks in 2014 [14].
2.1.2. Taiwanese People’s Regime Acceptance of the U.S.
Since Taiwan’s cross-strait policies are entangled with public opinion, the impact of the U.S. attitude on cross-strait issues cannot be omitted. cross-strait policies also involve Taiwanese civilians’ viewpoints toward the island’s future. The U.S. has applied the “strategic ambiguity” framework in order to maintain the status quo in both China and Taiwan. The status quo means the existing international political status of Mainland China and Taiwan. The U.S. attitude toward cross-strait issues aims at maintaining the peace in this area and does not support Taiwan’s independence nor closer ties between China and Taiwan [15]. Roy deems that Taiwan’s future sustainability in the international arena hinges on the relative determination of Taiwan, the U.S. and Mainland China to achieve their own preferences [16].
The factors that affect Taiwanese people’s regime acceptance of the U.S. can be concluded as follows:
- (1)
- Rational choice: Taiwanese people’s regime acceptance of the U.S. is also based on self-interest. Some Taiwanese people believe the U.S. government would protect Taiwan in the event of Mainland China’s invasion. According to the Taiwan National Security Survey in 2011, 56.4% of respondents said the U.S. would defend Taiwan against Chinese invasion, and 73.5% if Taiwan maintains the status quo but faces an attack by China [17]. This result reflects some Taiwanese people’s positive views of the U.S. They think that they can count on the U.S. for Taiwan’s security issues.
- (2)
- Social contact: The Taiwanese people who do not have close interactions with the U.S. would be influenced by their engrained impression of the U.S. political and economic system. The survey by Gries and Su also indicated that the U.S. was ranked as the fifth most admired country, following Germany, Australia, the UK, and France, by Taiwanese people [18]. Their survey focused on the survey respondents’ personal impression on these countries. It implied that these advanced economics, including the U.S., were admired by Taiwanese people.
- (3)
- Political socialization: The popular culture transmitted by the mass media affects young people’s political participation and their political identity, which belong to the characteristics of the political socialization [19]. Taiwanese people’s regime acceptance of the U.S. is also influenced by political socialization. According to the survey by Gries and Su, the popular culture of the U.S. and Japan were the most admired by the Taiwanese people [18]. The engrained popular culture would affect Taiwanese people’s evaluation of the U.S.
Based on the literature, research question 1 was listed as follows:
Research Question 1 (RQ1): What are the influencing factors of Taiwanese people’s regime acceptance of Mainland China and the U.S. in 2015?
3. Methodology
3.1. Equal Part Linear Regression
Equal part linear regression is a newly proposed linear regression model. Pan developed the equal part linear regression model in order to solve the extreme value problems in the traditional linear regression model [20]. For other linear regression models related to the different parts of the research data, Koenker proposes the quantile regression model to predict the mean of the explained variable given a specific value of each explanatory variable [21]. The quantile regression model predicts the value of the explained variable at a specific quantile of the explained variable given a specific value of each explanatory variable [22]. The quantile regression model has one major shortcoming in that the explanation of the quantile regression results is complicated for non-statisticians [20]. As far as the application to the equal part linear regression is concerned, Zhong et al. utilize the multiple equal part regression model to evaluate the influence of fixed assets and human capital on China’s gross domestic products (GDP) and find human capital stock has the significant impact China’s GDP in the first equal part and third equal part of the mutiple equal part regression model [23].
In the equal part linear regression model, Pan divides the data into ”τ” parts and evaluates the regression models [20]. The equal part regression model for each part of the data can be represented as:
The least square estimation of the equal part regression can be represented as follows:
The confidence level of the equal part regression model can be represented as follows:
3.2. Bayesian Equal Part Linear Regression
The research design of the Bayesian equal part regression model was based on the equal part linear regression model. The latter is modified so that we can retrieve results of the Bayesian fitting subset of the data. In the Bayesian equal part regression model, we also divide the data into τ parts. We also fit the Bayesian linear regression in each part of the data. The Bayesian equal part least square regression can be represented as:
The likelihood can be represented as:
In Equation (6):
Additionally, in Equation (7), k is the number of coefficients.
The study uses the Bayesian Adaptive Sampling (BAS) package of the R language to implement Bayesian model averaging in linear models and generalized linear models. In the BAS package, we use the g-priors in our estimation of GLM models. G-priors are introduced by Arnold Zellner [24] to indicate the prior distribution for the regression coefficients and use the beta-binomial prior distribution in the evaluation of Bayesian multivariate regression coefficients [25]. Suppose the residual of the Bayesian linear regression model is εi, and we assume εi is an independent and identically normal distribution of random errors with zero mean and the variance is ψ−1, and X is the independent variable matrix with the ith row equal to XiT. The g-prior of the independent variable coefficient β is the multivariate normal distribution with prior mean a hyperparameter β0 and covariance matrix proportional to ψ−1(XTX)−1. The Bayesian linear regression coefficents can be represented as:
In Equation (8), g is a positive scalar parameter. MVN means normal distribution of multivariates models.
The posterior distribution of β is given as the Equation (9):
where q = g/(1 + g) and Equation (10) is the maximum likelihood estimator of β:
The vector of regression coefficients β can be estimated by its posterior mean under the g-prior.
Bayesian equal part regression (BEPR) incorporated the latest development of the equal part regression model. In this study, the BEPR functions in the sample point equal part linear regression (SPEPLR). Figure 1 shows an example of SPEPLR, in which the distance between each of the sample points is equal. The “dots” in Figure 1 represents the sample points and the horizontal axis of Figure 1 represents the distance of sample points. The number of sample points in each part of the data is equal. The SPEPLR model is feasible for comprehension because the sample points are divided into equal parts.
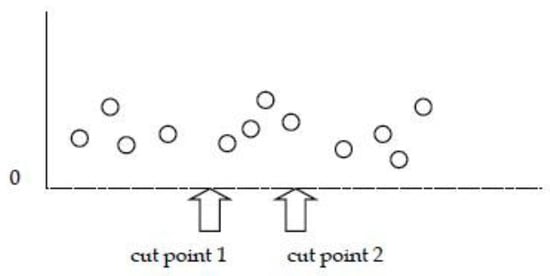
Figure 1.
Three EPLRMs (sample points).
Figure 2 is an example of DEPLR, in which the distance between the starting point to cut point 1, cut point 1 to cut point 2 and that after cut point 2 is equal. From the starting point to cut point 1, there are four sample points; from point 1 to point 2, five sample points; and after point 2, three sample points. The DEPLR method needs the sample points in each equal part to equal or exceed 3 in order to establish the linear regression model. The DEPLR can be utilized when sample data cannot be divided equally, such as the second part (τ = 2) and third part (τ = 3) of the data points in Figure 2.
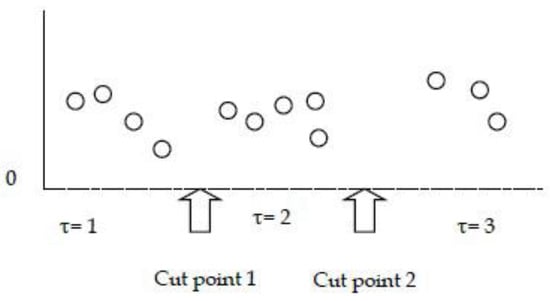
Figure 2.
Three EPLRMs (distance equal part).
Therefore, the following research question was posed:
Research Question 2 (RQ2): What is the advantage of the Bayesian equal part regression model in the application to our data compared with the traditional Bayesian regression model?
In our study, the division of first, second and third equal part in our sample is based on the original order of the survey results.
3.3. Research Design
The flowchart of this study is shown as Figure 3. The study first obtains the surveyed data and attempted to construct the Bayesian equal part regression (BEPR) model about the Taiwanese people’s regime acceptance of Mainland China and the U.S. In the beginning, the study filters for the suitable variables according to the results of the “BayesVarSel” package of the R language [26]. The BayesVarSel package uses the Bayesian variable selection approach [27] to choose the suitable model and variables. The study then utilizes the suitable variables to construct the BEPR model.
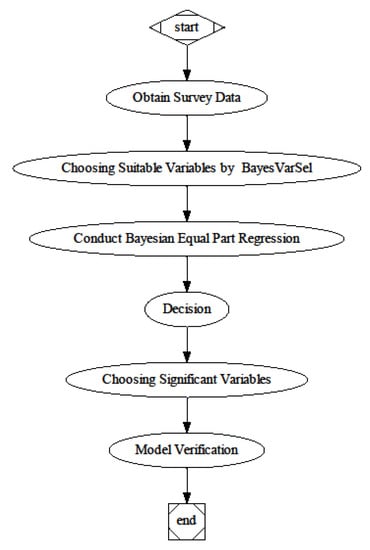
Figure 3.
Flowchart of the research.
Then, we choose the variables according to the results. By means of the evaluation standard of the BEPR model, our model is finally determined.
3.4. Data Description
The study obtained the survey data from the Taiwan National Security Studies Surveys database from the Program in Asian Security Studies of Duke University (https://sites.duke.edu/pass/data/). The Taiwan National survey was conducted by the Program in Asian Security Studies of Duke University and the Election Study Center of National Chengchi University. The study utilizes the data in 2015 to construct the Taiwan security BEPR model. The study attempted to construct Taiwanese people’s regime acceptance model toward Mainland China and the U.S.
In model 1, we used the Taiwanese people’s psychological feeling about Mainland China as the dependent variable (nQ9) to evaluate their regime acceptance of Mainland China. The connection between the question nQ9 and the regime acceptance is because the level of sentiment about Mainland China can represent the level of psychological attachment. The original minimum value (very disappointed) is 0, and the original maximum value (very satisfied) is 10. The study chose the following variables from the results of the “BayesVarSel” package as the independent variables, as shown in Table 1. The independent variables of model 1 were listed as follows:

Table 1.
Variables of model 1.
- Whether the Taiwanese respondents agree with the viewpoint that Mainland China would coerce Taiwan to make more political concessions in the case of more economic dependence (nQ4). The minimum value (strongly disapprove) is 1, and the maximum value (strongly approve) is 4.
- Whether the Taiwanese respondents support the declaration of Taiwanese independence in the case of Mainland China’s attack after the announcement of independence (nQ13). The minimum value (strongly disagree) is 1, and the maximum value (strongly agree) is 4.
- Whether the Taiwanese respondents agree with the unification with Mainland China in the case of a smaller gap in their societies, political systems and economic systems (nQ16). The minimum value (strongly disagree) is 1, and the maximum value (strongly agree) is 4.
- The question nQ18 is the Taiwanese respondents’ evaluation of the possibility of unification. The minimum value is 0 and the maximum value is 10.
- The question nQ25 is the Taiwanese respondents’ evaluation of cross-strait (Mainland China and Taiwan) relations. The minimum value 0 means that they feel the cross-strait relations hostile and the maximum value 10 means they feel the cross-strait relations peaceful.
After filtering invalid samples, the number of valid samples in BEPR model 1is 785.
The study also analyzed the BEPR model of the Taiwanese people’s regime acceptance toward the U.S. (model 2). In model 2, we used the Taiwanese people’s regime acceptance toward the U.S. as the dependent variable (nQ8). In nQ8, the original question asked the respondents about their sentiment about the U.S. The minimum value (very disappointed) is 0, and the original maximum value (like it very much) is 10. The study chose the following variables from the results of the “BayesVarSel” package as the independent variables, as shown in Table 2. The independent variables of model 2 are as follows:
Table 2.
Variables of model 2.
- Question nQ6 asks the respondents about the future prospect evaluation of their household economic conditions one year later. The minimum value is 1 (worse) and the maximum value is 2 (the same as the present).
- Question nQ18 asks the respondents about the evaluation of the possibility of unification. The minimum value is 0, and the maximum value is 10.
- Whether Taiwanese respondents agree that the Taiwanese government should reduce the amount of its military weaponry and equipment if Mainland China withdraws its missiles from its southeast coastline (nQ21). The minimum value is 1 (strongly disagree) and the maximum value is 4 (strongly agree).
- Question nQ25 asks the respondents about their evaluation of current cross-strait relations. The minimum value (very hostile) is 0, and the maximum value (very peaceful) is 10.
- Question nQ27 asks the respondents about their evaluation of the possibility of the military actions in case of Taiwan’s unilateral declaration of independence. The minimum value is 1 (impossible) and the maximum value is 4 (very possible).
- Question nQ29 asks the respondents whether most Taiwanese people would fight back in case of Chinese military actions resulting from Taiwan’s unilateral declaration of independence. The minimum value is 1 (impossible) and the maximum value is 4 (very possible).
- Question nQ31 asks the respondents about the viewpoint that Taiwan is an independent country with sovereignty and its current country name is Republic of China (R.O.C) and it is unnecessary to declare for independence. The minimum value is 1 (strongly disagree) and the maximum value is 4 (strongly agree).
After filtering invalid samples, the number of valid samples in BEPR model 2 was 717.
4. Results and Discussion
4.1. BEPR Model 1
This study focused on the BEPR models of Taiwanese people’s regime acceptance toward Mainland China (model 1) and the U.S. (model 2). In model 1, we used the Taiwanese people’s regime admittance of Mainland China (nQ9) as the dependent variable (y). The independent variables of model 1 were X1 (nQ4), X2 (nQ13), X3 (nQ16), X4 (nQ18), and X5 (nQ25). After filtering, there are 785 effective samples in BEPR model 1. The BEPR model 1 divides the whole data into three equal parts with the same distance (262 data points), so the BEPR model 1 belongs to the DEPLR model.
The results of Bayesian linear regression model 1 are shown in Table 4 and Figure 4. The study compares the results of BEPR model 1 (Table 3) with the Bayesian linear regression model 1. The study finds that X1(nQ4) and X2 (nQ13) have the negative post means in the Bayesian linear regression model 1, which is shown in Table 4. However, BEPR model 1evaluates three equal parts with the same amount of sample data, as shown in Table 3. In BEPR model 1, X1 and X2 also have negative post means in the three equal parts. However, X1’s post mean is the largest (−0.061) on the first equal part (τ = 1) and its post probability of the non-zero coefficient is the lowest (0.327). X1’s post mean is the lowest (−0.256) on the first equal part (τ = 2) and its post probability of the non-zero coefficient is the highest (0.787).
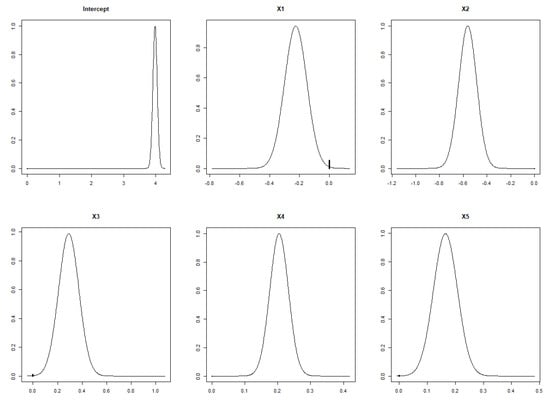
Figure 4.
The probability of coefficients of independent variables on Bayesian linear regression model 1.
Table 3.
Results of BEPR model 1.
Table 4.
Results of Bayesian linear regression model 1.
Regarding the variables with the positive coefficients, X3 has the lowest post mean (0.110) in the second equal part (τ = 2) and the lowest post probability of the non-zero coefficients (0.471). X5 has the lowest post mean (0.07) in the first equal part (τ = 1) and the lowest post probability of the non-zero coefficients (0.501).
The horizontal axis of Figure 4 is the posterior mean of the independent variables. The vertical axis of Figure 4 is the probability of the coefficients of independent variables. We can observe that a black segment exists in the sub-plot X1. It represents the zero value of posterior mean. X1’s posterior mean is obviously less than zero in Bayesian linear regression model 1.
To reasonably evaluate the BEPR model for equal parts, the study utilized the parallel shift method suggested by Pan [20]. We moved the whole sample for one third of all sample points (i.e., 785/3 ≈ 262 sample points) to the right by the X coordinate to construct the regression line each time and create the coefficients and the confidence intervals of all independent variables to avoid potential evaluation errors. The post mean and the post probability of the non-zero coefficient created by the parallel shift method of BEPR model 1 are shown in Figure 5, Figure 6, Figure 7 and Figure 8.
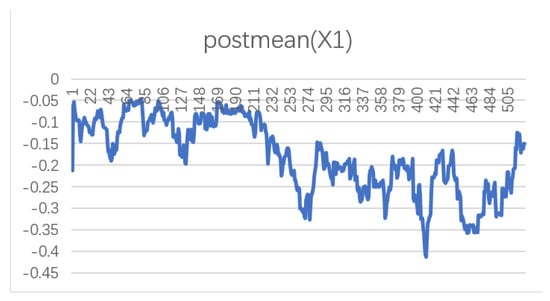
Figure 5.
Post mean of X1 of BEPR model 1.
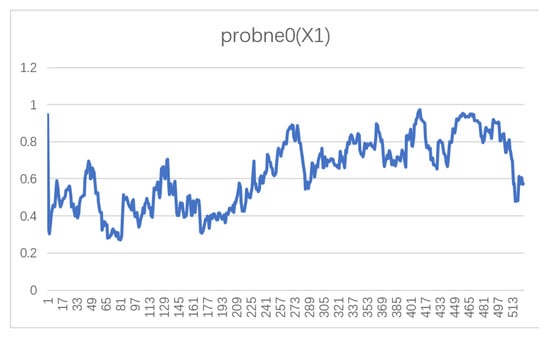
Figure 6.
Post probability of non-zero coefficients of X1 of BEPR model 1.
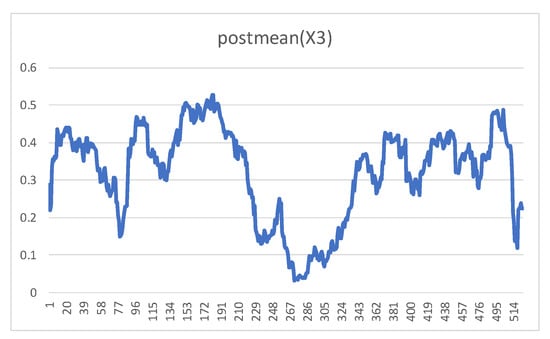
Figure 7.
Post mean of X3 of BEPR model 1.
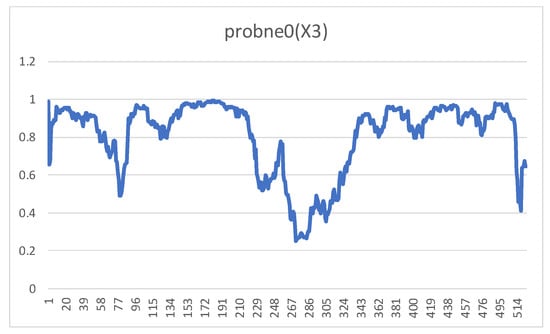
Figure 8.
Post probability of non-zero coefficients of X3 of BEPR model 1.
The horizontal axis of the Figure 5 and Figure 6 is the number of iterations (785 − 262 + 1 = 524) of Bayesian linear regression models. The vertical axis of Figure 6 is the post mean of X1. It is the largest on the first one-third tier of the post mean curve, and the post possibility of the non-zero coefficient (probne0) is the lowest on the first one-third tier of the probne0 curve.
According to Figure 7 and Figure 8, the post mean of X3 is the lowest on the second one-third tier of the post mean curve, and the post possibility of the non-zero coefficient (probne0) is the lowest on the second one-third tier of the probne0 curve.
According to Figure 9 and Figure 10, the post mean of X5 is the lowest on the first one-third tier of the post mean curve, and the post possibility of the non-zero coefficient (probne0) is the lowest on the second one-third tier of the probne0 curve.
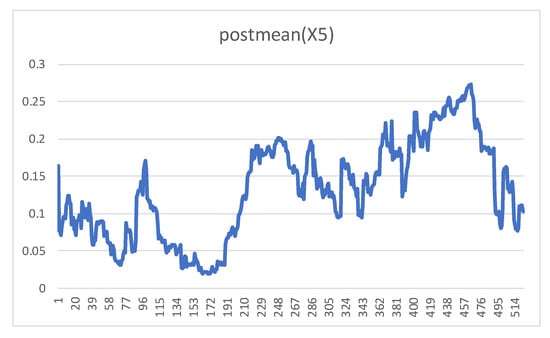
Figure 9.
Post mean of X5 of BEPR model 1.
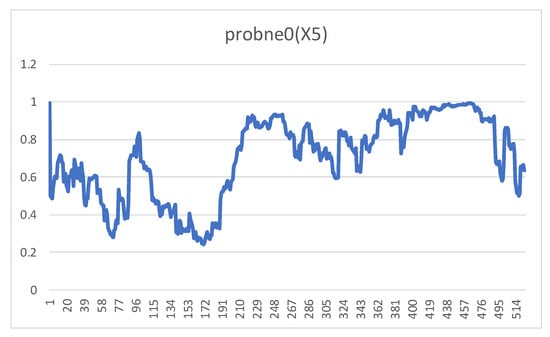
Figure 10.
Post probability of non-zero coefficients of X5 of BEPR model 1.
For the independent variables X2 and X4, the post possibility of the non-zero coefficient is above 0.9 in all iterations.
4.2. BEPR Model 2
In BEPR model 2, we used the Taiwanese people’s regime acceptance toward the U.S. (nQ8) as the dependent variable (Y). The independent variables of model 2 were X1 (nQ6), X2 (nQ18), X3 (nQ21), X4 (nQ25), X5 (nQ27), X6 (nQ29) and X7 (nQ31).
We compare the BEPR model 2 (Table 5) with the Bayesian linear regression model 2 (Table 6 and Figure 11), and find that X3 (nQ21) and X7 (nQ31) have negative relationships with the dependent variable with the post probability of the non-zero probability which is larger than 0.5 according to the results of the Bayesian linear regression model. However, we also find that X1 and X3 have the negative relationship with the dependent variable with the post probability of the non-zero probability which is larger than 0.5 on the second equal part (τ = 2) of the BEPR model.
Table 5.
Results of BEPR model 2.
Table 6.
Results of Bayesian linear regression model 2.
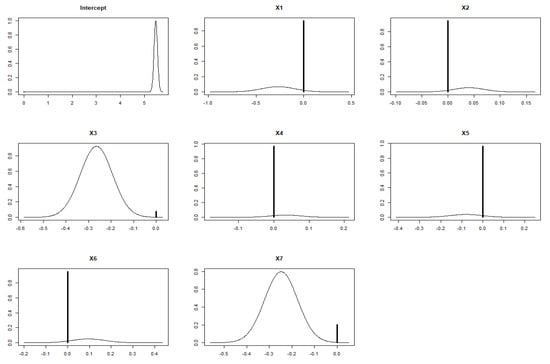
Figure 11.
The probability of coefficients of independent variables on Bayesian linear regression model 2.
The horizontal axis of Figure 11 is the posterior mean of the independent variables. The vertical axis of Figure 11 is the probability of the coefficients of independent variables. We can observe that a black segment exists in the sub-plot X1, X2, X3, X4, X5, X6, and X7. It represents the zero value of posterior mean. The probability of the coefficients of X1, X2, X4, X5, and X6 is near zero, while the coefficients of X3 and X7 are obviously less than zero.
This study also utilizes the parallel shift method suggested by Pan [20]. We move the whole sample for one third of all sample points (i.e., 717/3 = 239 sample points) to the right by the X coordinate to construct the regression line each time and created the coefficients and the confidence interval of all independent variables to avoid potential evaluation errors. In order to search for the fluctuations of post mean and the post probability of non-zero coefficients after the parallel shift, the study chooses X1, X3, and X7 to analyze. It is because the post probability of non-zero coefficients of other independent variables on Table 5 and Table 6 is less than 0.5, and their credible intervals approximates 0. The post mean graphs and post probability of the non-zero coefficients graphs are from Figure 12, Figure 13, Figure 14, Figure 15, Figure 16 and Figure 17.
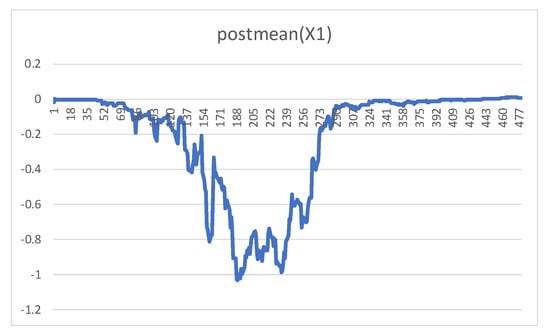
Figure 12.
Post mean of X1 of BEPR model 2.
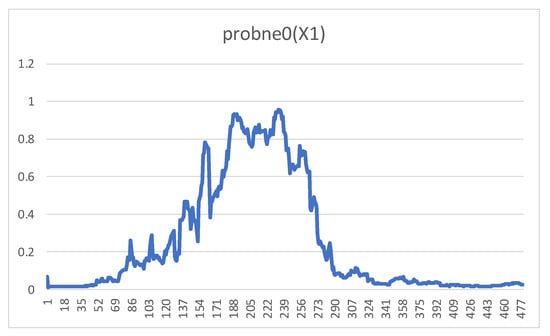
Figure 13.
Post probability of non-zero coefficients of X1 of BEPR model 2.
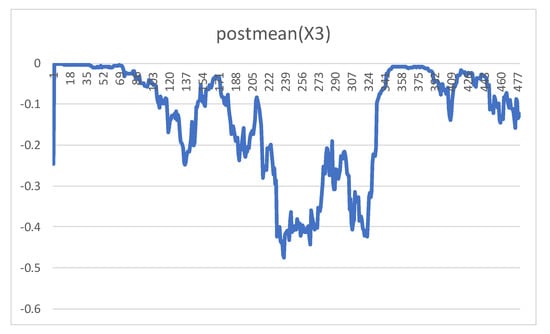
Figure 14.
Post mean of X3 of BEPR model 2.
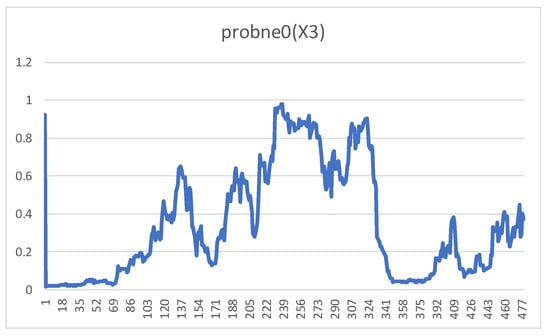
Figure 15.
Post probability of non-zero coefficients of X3 of BEPR model 2.
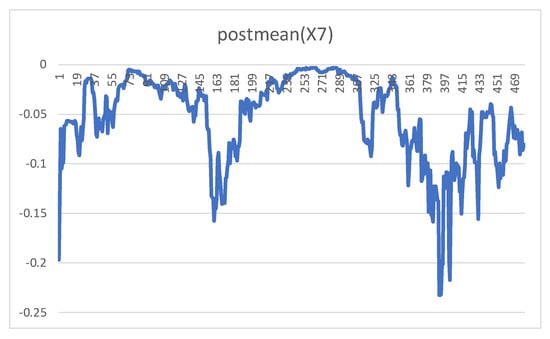
Figure 16.
Post mean of X7 of BEPR model 2.
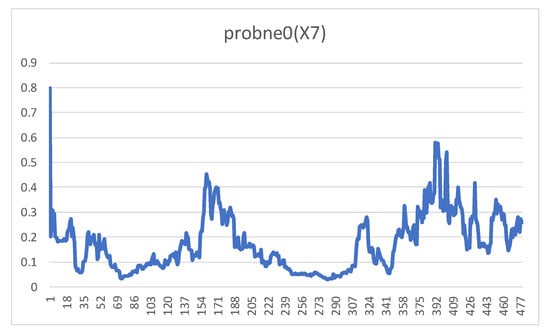
Figure 17.
Post probability of non-zero coefficients of X7 of BEPR model 2.
The horizontal axis of the Figure 12 and Figure 13 shows the number of iterations (717 − 239 + 1 = 479) of the Bayesian linear regression models. The vertical axis of Figure 12 is the post mean of X1. It is the lowest on the second one-third tier of the post mean curve, and the post possibility of the non-zero coefficient (probne0) is the highest on the second one-third tier of the probne0 curve.
4.3. Discussion
This study utilizes the newly developed Bayesian equal part regression model to evaluate Taiwanese people’s regime acceptance of Mainland China and the U.S. The major findings are as follows.
By extending from Wang [2], this study focuses on factual exploration by means of the newly developed Bayesian equal part regression model. The study also utilizes the “BayesVarSel” package of the R software to obtain the best variables to explore the influencing factors of the regime acceptance toward Mainland China and the U.S. The results of Bayesian linear regression model 1 determine that Taiwanese respondents who agree that Mainland China would coerce Taiwan to make more political concessions in the case of more economic dependence (nQ4) and support the declaration of Taiwanese independence in the case of Mainland China’s attack after the announcement of independence (nQ13) have the negative regime acceptance of Mainland China. Taiwanese respondents who agree with the unification with Mainland China in the case of a smaller gap in their societies, political systems, and economic systems (nQ16), deem the higher possibility of unification (nQ18) and higher evaluation of cross-strait (Mainland China and Taiwan) relations (nQ25) have positive regime acceptance of Mainland China. However, according to the results of BEPR model 1, the first one-third (equal part) of respondents who support that China would coerce Taiwan to make concessions have the lesser negative impact on the regime acceptance of Mainland China, while the second equal part of the respondents who have the same attitude have the higher negative view on the regime acceptance level. The second equal part of respondents who deem the higher possibility of unification have the lesser positive view on the regime acceptance level. Additionally, the first equal part of respondents who have higher evaluation of cross-strait relations have lesser positive impact on the regime acceptance level. The reason of the posterior means fluctuations in different equal parts relates to the characteristics of each equal part sample. These characteristics include the regional factors and the demographic factors of the survey respondents.
The study also obtains that Taiwanese people who agree to reduce the purchase of U.S. military weapons if Mainland China withdraws its missiles (nQ21) or agree Taiwanese current “R.O.C.” country name (nQ31) would have the negative regime acceptance of the U.S. The results of BEPR model 2 also indicate that some Taiwanese survey respondents who have the good household economic expectations have the negative regime acceptance attitude toward the U.S. It can be concluded that Taiwanese people’s regime acceptance of the U.S. is involved in the attitude of Mainland China and their independence attitude. This result meets the results of Cabestan [28] and can be taken as the impact of the closer economic relationship between Mainland China and Taiwan. Since the level of Taiwan’s dependence on China is increasing, some Taiwanese people do not want to have antagonistic attitudes toward Mainland China once it shows good intentions for cross-strait relations, and they would have negative views of the U.S.
The results of the two BEPR models indicate the change of the post mean and post probability of non-zero coefficients of the independent variables in each equal part. In the Bayesian linear regression model, we can only obtain the coefficients’ probability distribution from Figure 4 and Figure 11. However, we can observe the highest and the lowest point of the post mean and post probability of non-zero coefficients of each independent variable from the results of the two BEPR models. The development of the Bayesian equal part regression model makes the explanation of results much easier. The results of the Bayesian quantile regression model can only offer researchers the value range of the independent variables, and the quantile points of the data cannot be identified in the case of non-integral quantiles, just like the study shows [29,30]. It seems that researchers have limited room to choose the proper equal part. However, the BEPR model can obtain the change of the post mean and the post probability of the non-zero coefficients of independent variables on each equal part. Researchers can easily divide all the sample data into equal parts to construct the BEPR models and explain the results.
The study intends to use the BEPR method to verify the Bayesian linear regression in different equal parts. The setting of equal part is determined by the research requirement. The equal part setting in this study only represents one of the examples. Researchers can choose to do other equal part analysis as they need.
5. Conclusions
In the beginning, our data, which is drawn from the Taiwan Security Survey data (2015), was second-hand data; therefore, to obtain the information we needed the study first used the “BayesVarSel” package in R to obtain the independent variables from all survey questions. The study constructed the two BEPR models in order to verify the Taiwanese people’s regime acceptance of Mainland China and the U.S. According to the results of BEPR model 1, the first equal part of respondents who support that China who would coerce Taiwan to make concessions have the lesser negative impact on the regime acceptance of Mainland China, while the second equal part of the respondents who have the same attitude have the higher negative view on the regime acceptance level. The second equal part of respondents who deem the higher possibility of unification have the lesser positive view on the regime acceptance level. Additionally, the first equal part of respondents who have higher evaluation of cross-strait relations have lesser positive impact on the regime acceptance level.
The results of BEPR model 2 show that the second-third of Taiwanese respondents who think about their household economic outlook not worse than the present or agree to reduce the purchase of U.S. military weapons if Mainland China withdraws its missiles have a higher negative impact on the regime acceptance of the U.S. However, the third equal part of Taiwanese respondents who agree with the current R.O.C. country name have a higher negative regime acceptance level of the U.S.
The study also finds that the results of the BEPR model can be easily explained. We can observe the highest and the lowest point of the post mean and post probability of non-zero coefficients of each independent variable from the results of two BEPR models. The development of the Bayesian equal part regression model makes the explanation of the results much easier.
Finally, it should be mentioned that the study intended to use the newly developed Bayesian equal part regression model to obtain the influencing factors of the regime acceptance. Future research is encouraged to focus on exploring other influencing factors and further improving the BEPR model.
Funding
The study was partially supported by the Faculty Research Fund of Macau University of Science and Technology.
Conflicts of Interest
The author declares no conflict of interest.
References
- Gordon, M.M. Assimilation in American Life: The Role of Race, Religion, and National Origins; Oxford University Press: New York, NY, USA, 1964; pp. 70–71. [Google Scholar]
- Wang, C.C. Primordialism, Instrumentalism, Constructivism: Factors Influencing Taiwanese People’s Regime Acceptance of Mainland China’s Government. J. Contemp. China 2018, 27, 137–150. [Google Scholar] [CrossRef]
- Lin, C.M.; Chou, C.C.; Kuang, C.C. The security Situation in the Taiwan Strait: An Analysis from Security Dilemma. Lang. Int. Stud. Chin. 2015, 13, 105–129. [Google Scholar]
- Tzeng, W.F.; Lee, K.C.; Macaulay, C. Why Is China Unwelcome in Taiwan? Cultural Alienation, Democratic Anxiety or Economic Loss in Explaining Taiwanese Resistance to China. Issues Stud. 2017, 53, 1750011. [Google Scholar] [CrossRef]
- Feklyunina, V. Soft power and identity: Russia, Ukraine and the ‘Russian world(s)’. Eur. J. Int. Relat. 2016, 22, 773–796. [Google Scholar] [CrossRef]
- Zhong, Y. Explaining national identity shift in Taiwan. J. Contemp. China 2016, 25, 336–352. [Google Scholar] [CrossRef]
- Cabestan, J.P.; DeLisle, J. Political Changes in Taiwan under Ma Ying-jeou: Partisan Conflict, Policy Choices, External Constraints and Security Challenges; Routledge: New York, NY, USA, 2014. [Google Scholar]
- Green, D.P.; Fox, J. Rational choice theory. Social Science Methodology; Sage Publications: London, UK, 2007; pp. 269–281. [Google Scholar]
- Keng, S.; Schubert, G. Agents of Taiwan-China unification? The political roles of Taiwanese business people in the process of cross-strait integration. Asian Surv. 2010, 50, 287–310. [Google Scholar] [CrossRef]
- Pettingrew, T.F. Intergroup Contact Theory. Annu. Rev. Psychol. 1998, 49, 65–85. [Google Scholar] [CrossRef] [PubMed]
- Li, Y. Constructing peace in the Taiwan Strait: A Constructivist Analysis of the Changing Dynamics of Identities and Nationalisms. J. Contemp. China 2014, 23, 119–142. [Google Scholar] [CrossRef]
- Lin, Y.; Hsieh, J.F.S. Change and Continuity in Taiwan’s Public Opinion on the Cross-Strait Economic Interactions. J. Asian Afr. Stud. 2017, 52, 1103–1116. [Google Scholar] [CrossRef]
- Langton, K. Political Socialization; Oxford University Press: New York, NY, USA, 1969; p. 4. [Google Scholar]
- Liu, F.C.S.; Li, Y. Generation matters: Taiwan’s perceptions of Mainland China and Attitudes towards Cross-Strait Trade Talks. J. Contemp. China 2017, 26, 263–279. [Google Scholar] [CrossRef]
- Chen, D.P. US Strategic Ambiguity, Rising China, and Taiwan’s Security. In US-China Rivalry and Taiwan’s Mainland Policy; Palgrave Macmillan: Cham, Switzerland, 2017; pp. 137–171. [Google Scholar]
- Roy, D. Prospects for Taiwan Maintaining Its Autonomy under Chinese Pressure. Asian Surv. 2017, 57, 1135–1158. [Google Scholar] [CrossRef]
- Wang, Y.K. Taiwan Public Opinion on Cross-Strait Security Issues: Implications for US Foreign Policy. Strateg. Stud. Q. 2013, 7, 93–113. [Google Scholar]
- Gries, P.H.; Su, J. Taiwanese views of China and the world: Party identification, ethnicity, and cross–strait relations. Jpn. J. Political Sci. 2013, 14, 73–96. [Google Scholar] [CrossRef]
- Loader, B.D.; Vromen, A.; Xenos, M.A. The networked young citizen: Social media, political participation and civic engagement. Inf. Commun. Soc. 2014, 17, 143–150. [Google Scholar] [CrossRef]
- Pan, W.T. A Newer Equal Part Linear Regression Model: A Case Study of the Influence of Educational Input on Gross National Income. Eurasia J. Math. Sci. Technol. Educ. 2017, 13, 5765–5773. [Google Scholar] [CrossRef]
- Koenker, R.W.; Basset, G. Regression Quantile. Econometrica 1978, 46, 33–50. [Google Scholar] [CrossRef]
- Pan, W.T.; Leu, Y. An analysis of bank service satisfaction based on quantile regression and grey relational analysis. Math. Probl. Eng. 2016. [Google Scholar] [CrossRef]
- Zhong, Z.C.; Chen, X.Y.; Yang, H.L.; Wang, G.; Pan, W.T. Theoretical and Case Study on Multiple Equal Part Linear Regression. In DEStech Transactions on Computer Science and Engineering (CMSAM), Proceedings of the 2017 2nd International Conference on Computational Modeling, Simulation and Applied Mathematics (CMSAM 2017), Beijing, China, 22–23 October 2017; DEStech Publications: Toronto, ON, Canada, 2017. [Google Scholar]
- Agliari, A.; Parisetti, C.C. A-G Reference Informative Prior: A Note on Zellner’s G-Prior. J. R. Stat. Soc. Ser. D Stat. 1988, 37, 271–275. [Google Scholar] [CrossRef]
- Merlise, C. Bayesian Variable Selection and Model Averaging Using Bayesian Adaptive Sampling; R package version 1.5.3. 2018. Available online: https://rdrr.io/cran/BAS/ (accessed on 15 April 2019).
- Garcia-Donato, G.; Forte, A. BayesVarSel: Bayes Factors, Model Choice and Variable Selection in Linear Models, R package version 1.8.0.; 2017. Available online: https://CRAN.R-project.org/package=BayesVarSel (accessed on 29 May 2019).
- O’Hara, R.B.; Sillanpää, M.J. A review of Bayesian variable selection methods: What, how and which. Bayesian Anal. 2009, 4, 85–117. [Google Scholar] [CrossRef]
- Cabestan, J.P. Cross-Strait integration and Taiwan’s new security challenges. In Taiwan and The China Impact; Routledge: New York, NY, USA, 2015; pp. 300–318. [Google Scholar]
- Omata, Y.; Katayama, H.; Arimura, T.H. Same concerns, same responses? A Bayesian quantile regression analysis of the determinants for supporting nuclear power generation in Japan. Environ. Econ. Policy Stud. 2017, 19, 581–608. [Google Scholar] [CrossRef]
- Wu, S.; Guo, J. The Bayesian quantile regression and rough set classification: Taiwanese satisfaction level analysis. Kybernetes 2017, 46, 1262–1274. [Google Scholar] [CrossRef]
© 2019 by the author. Licensee MDPI, Basel, Switzerland. This article is an open access article distributed under the terms and conditions of the Creative Commons Attribution (CC BY) license (http://creativecommons.org/licenses/by/4.0/).