A Probabilistic Classification Procedure Based on Response Time Analysis Towards a Quick Pre-Diagnosis of Student’s Attention Deficit


 , and
, and 
Abstract
1. Introduction
2. Materials and Methods
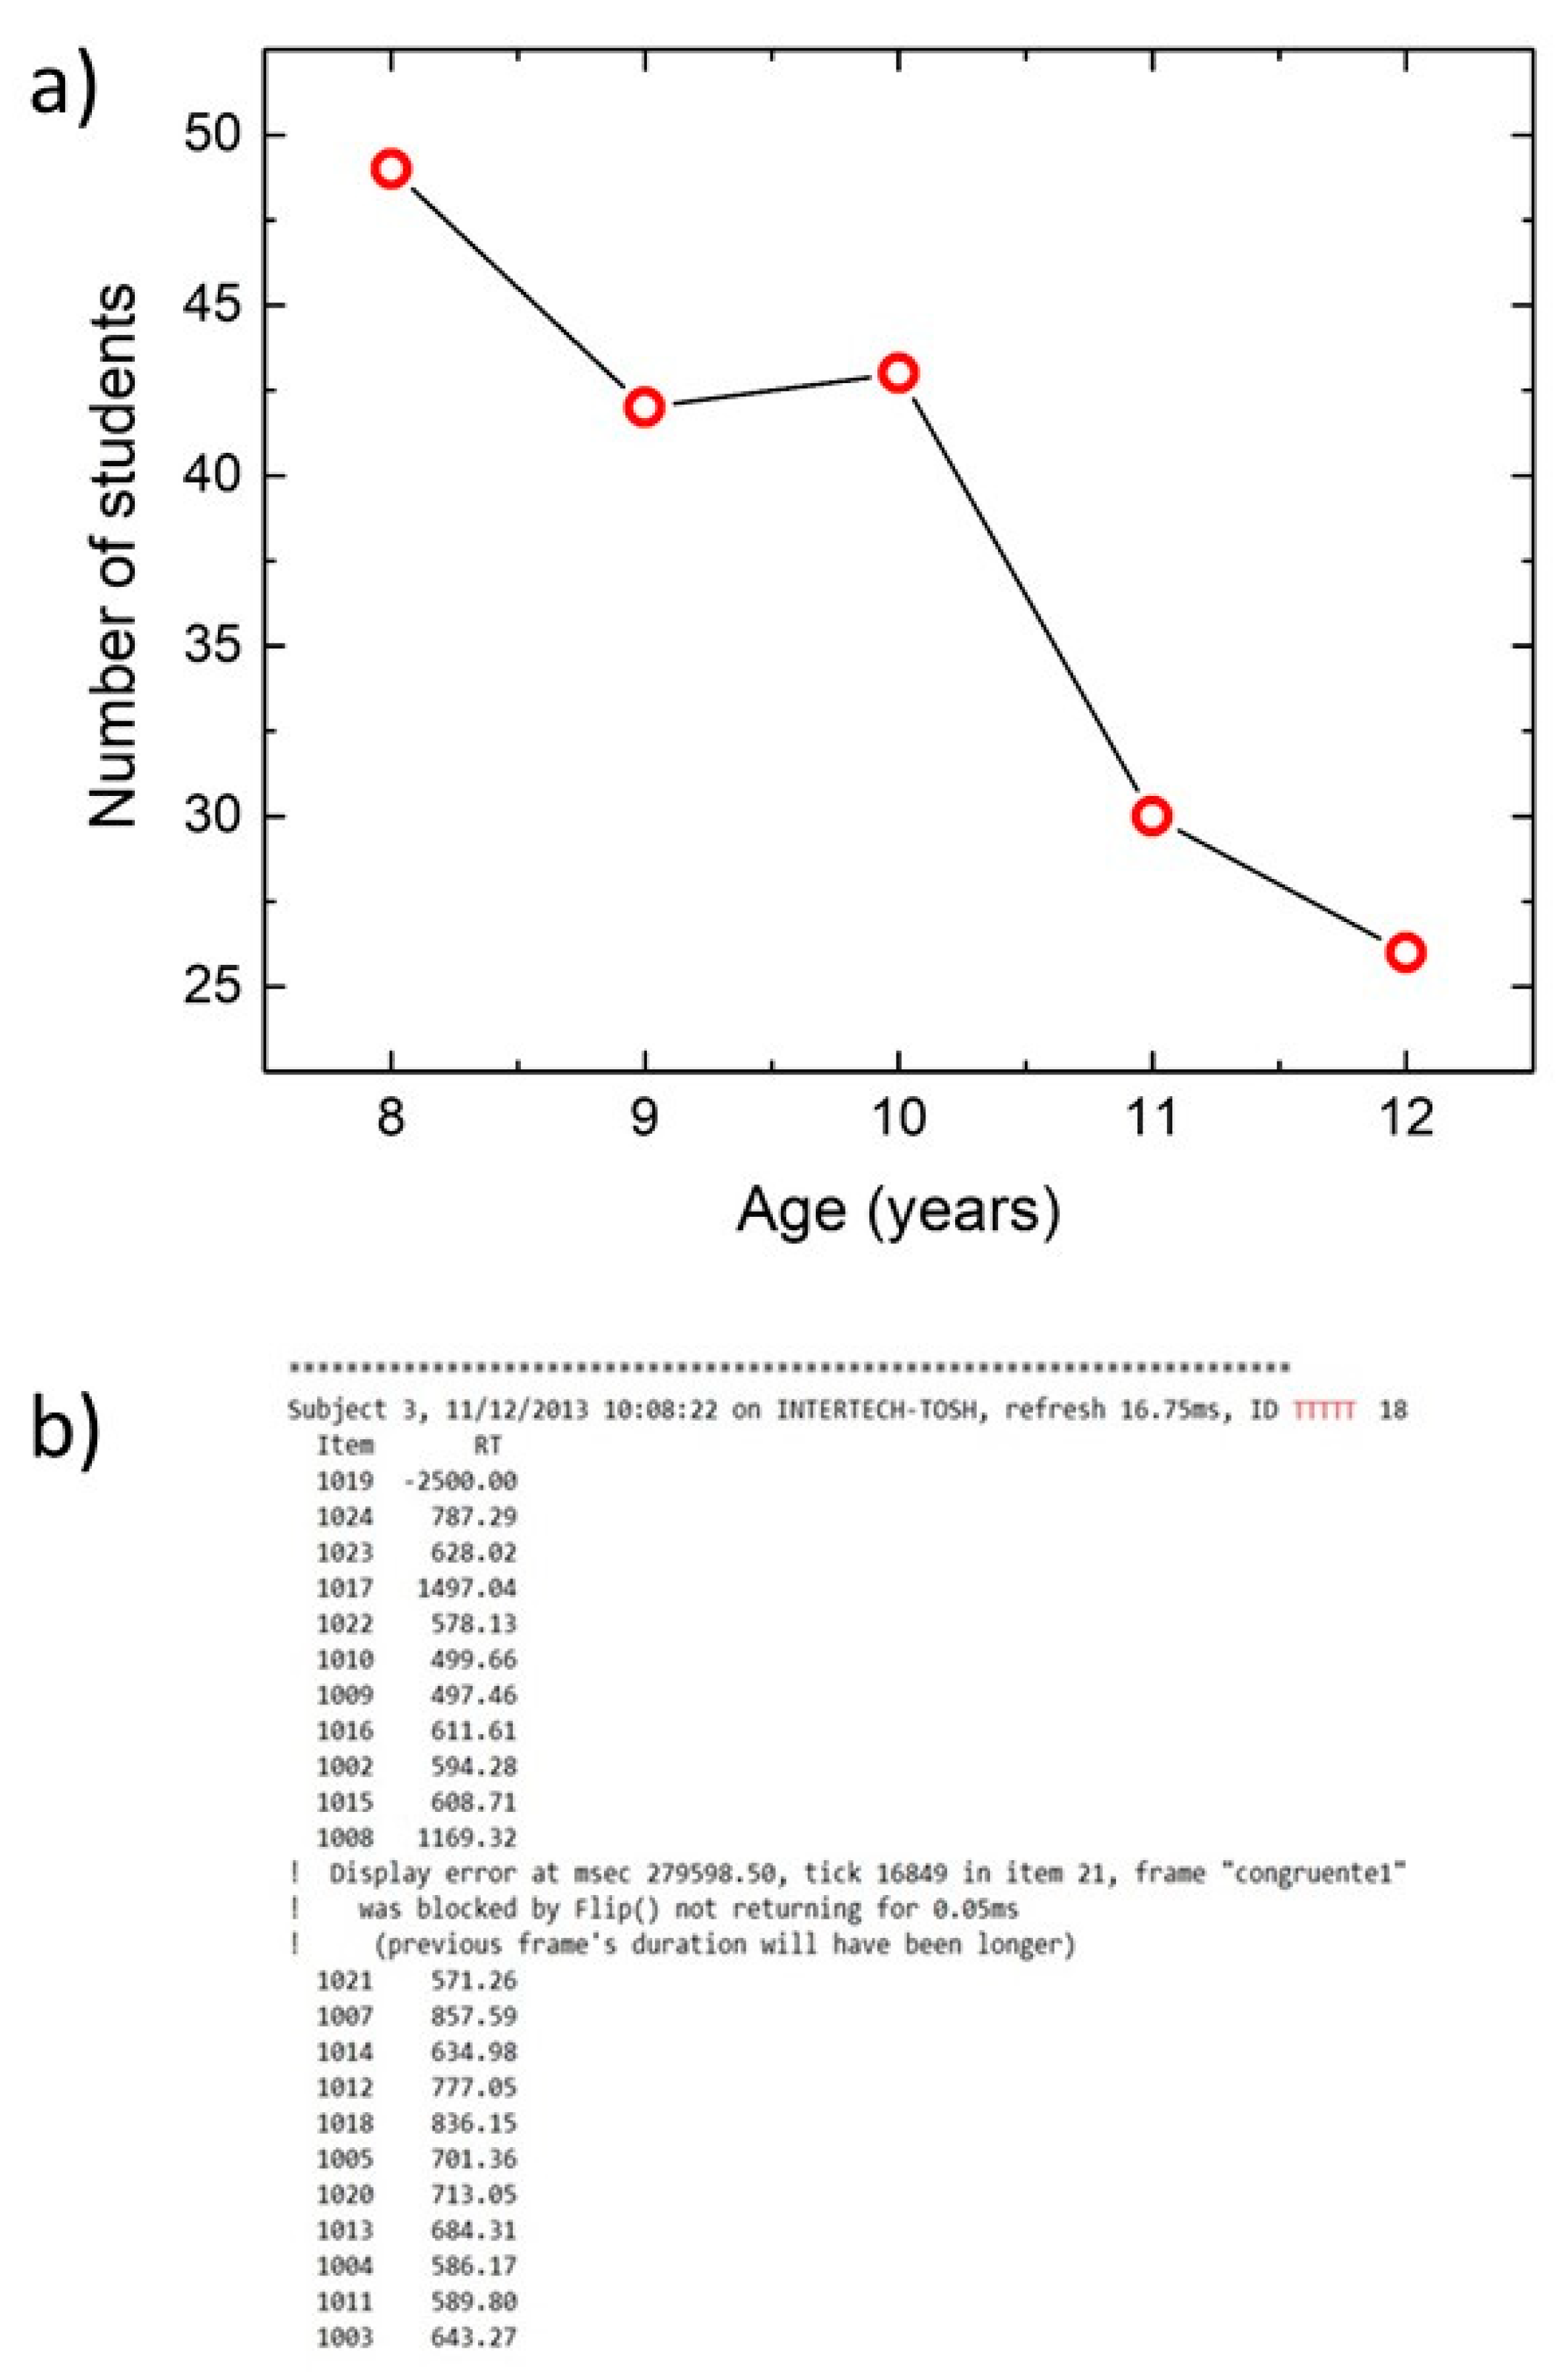
2.1. Participants
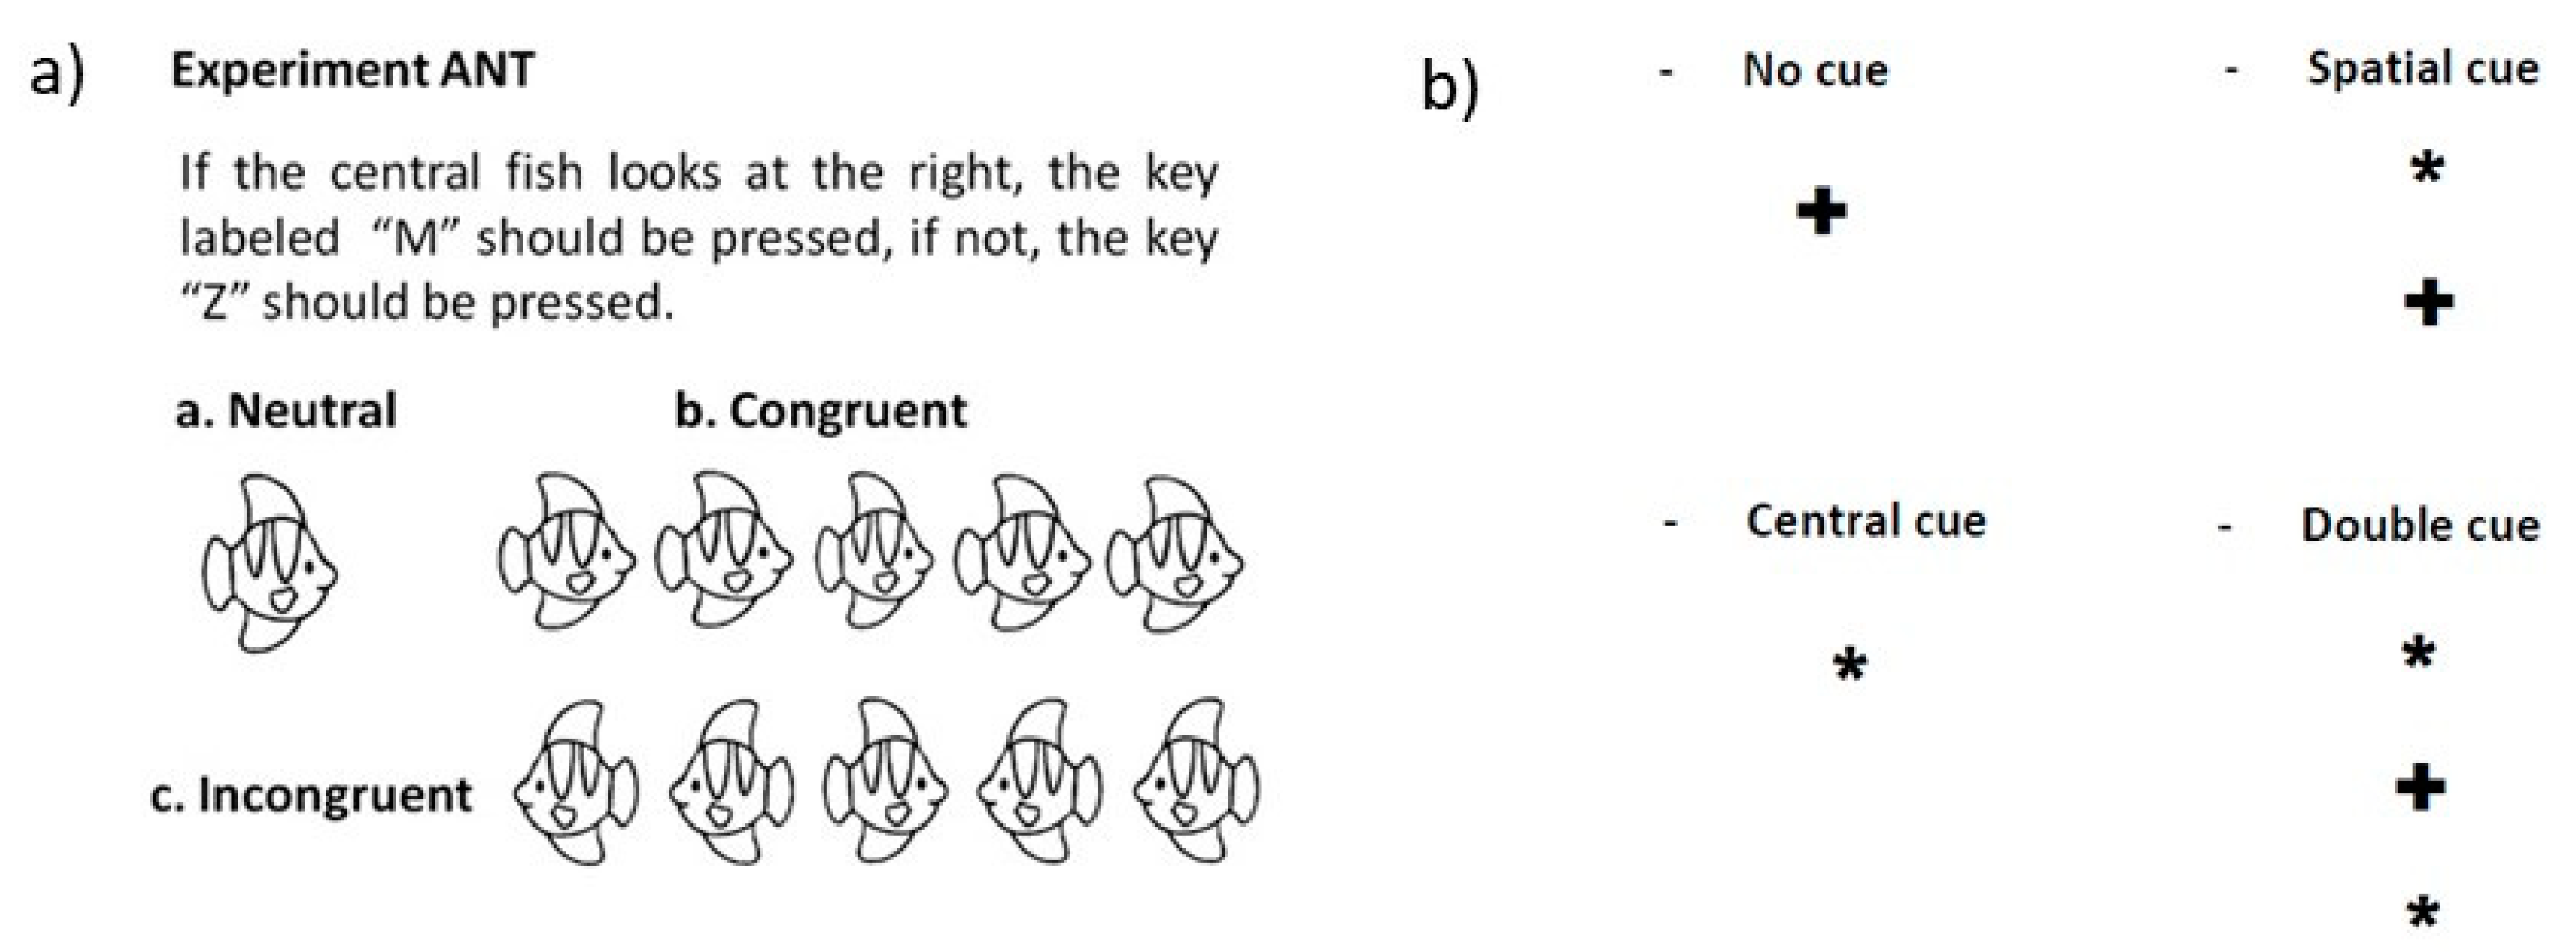
2.2. Experiments with DMDX
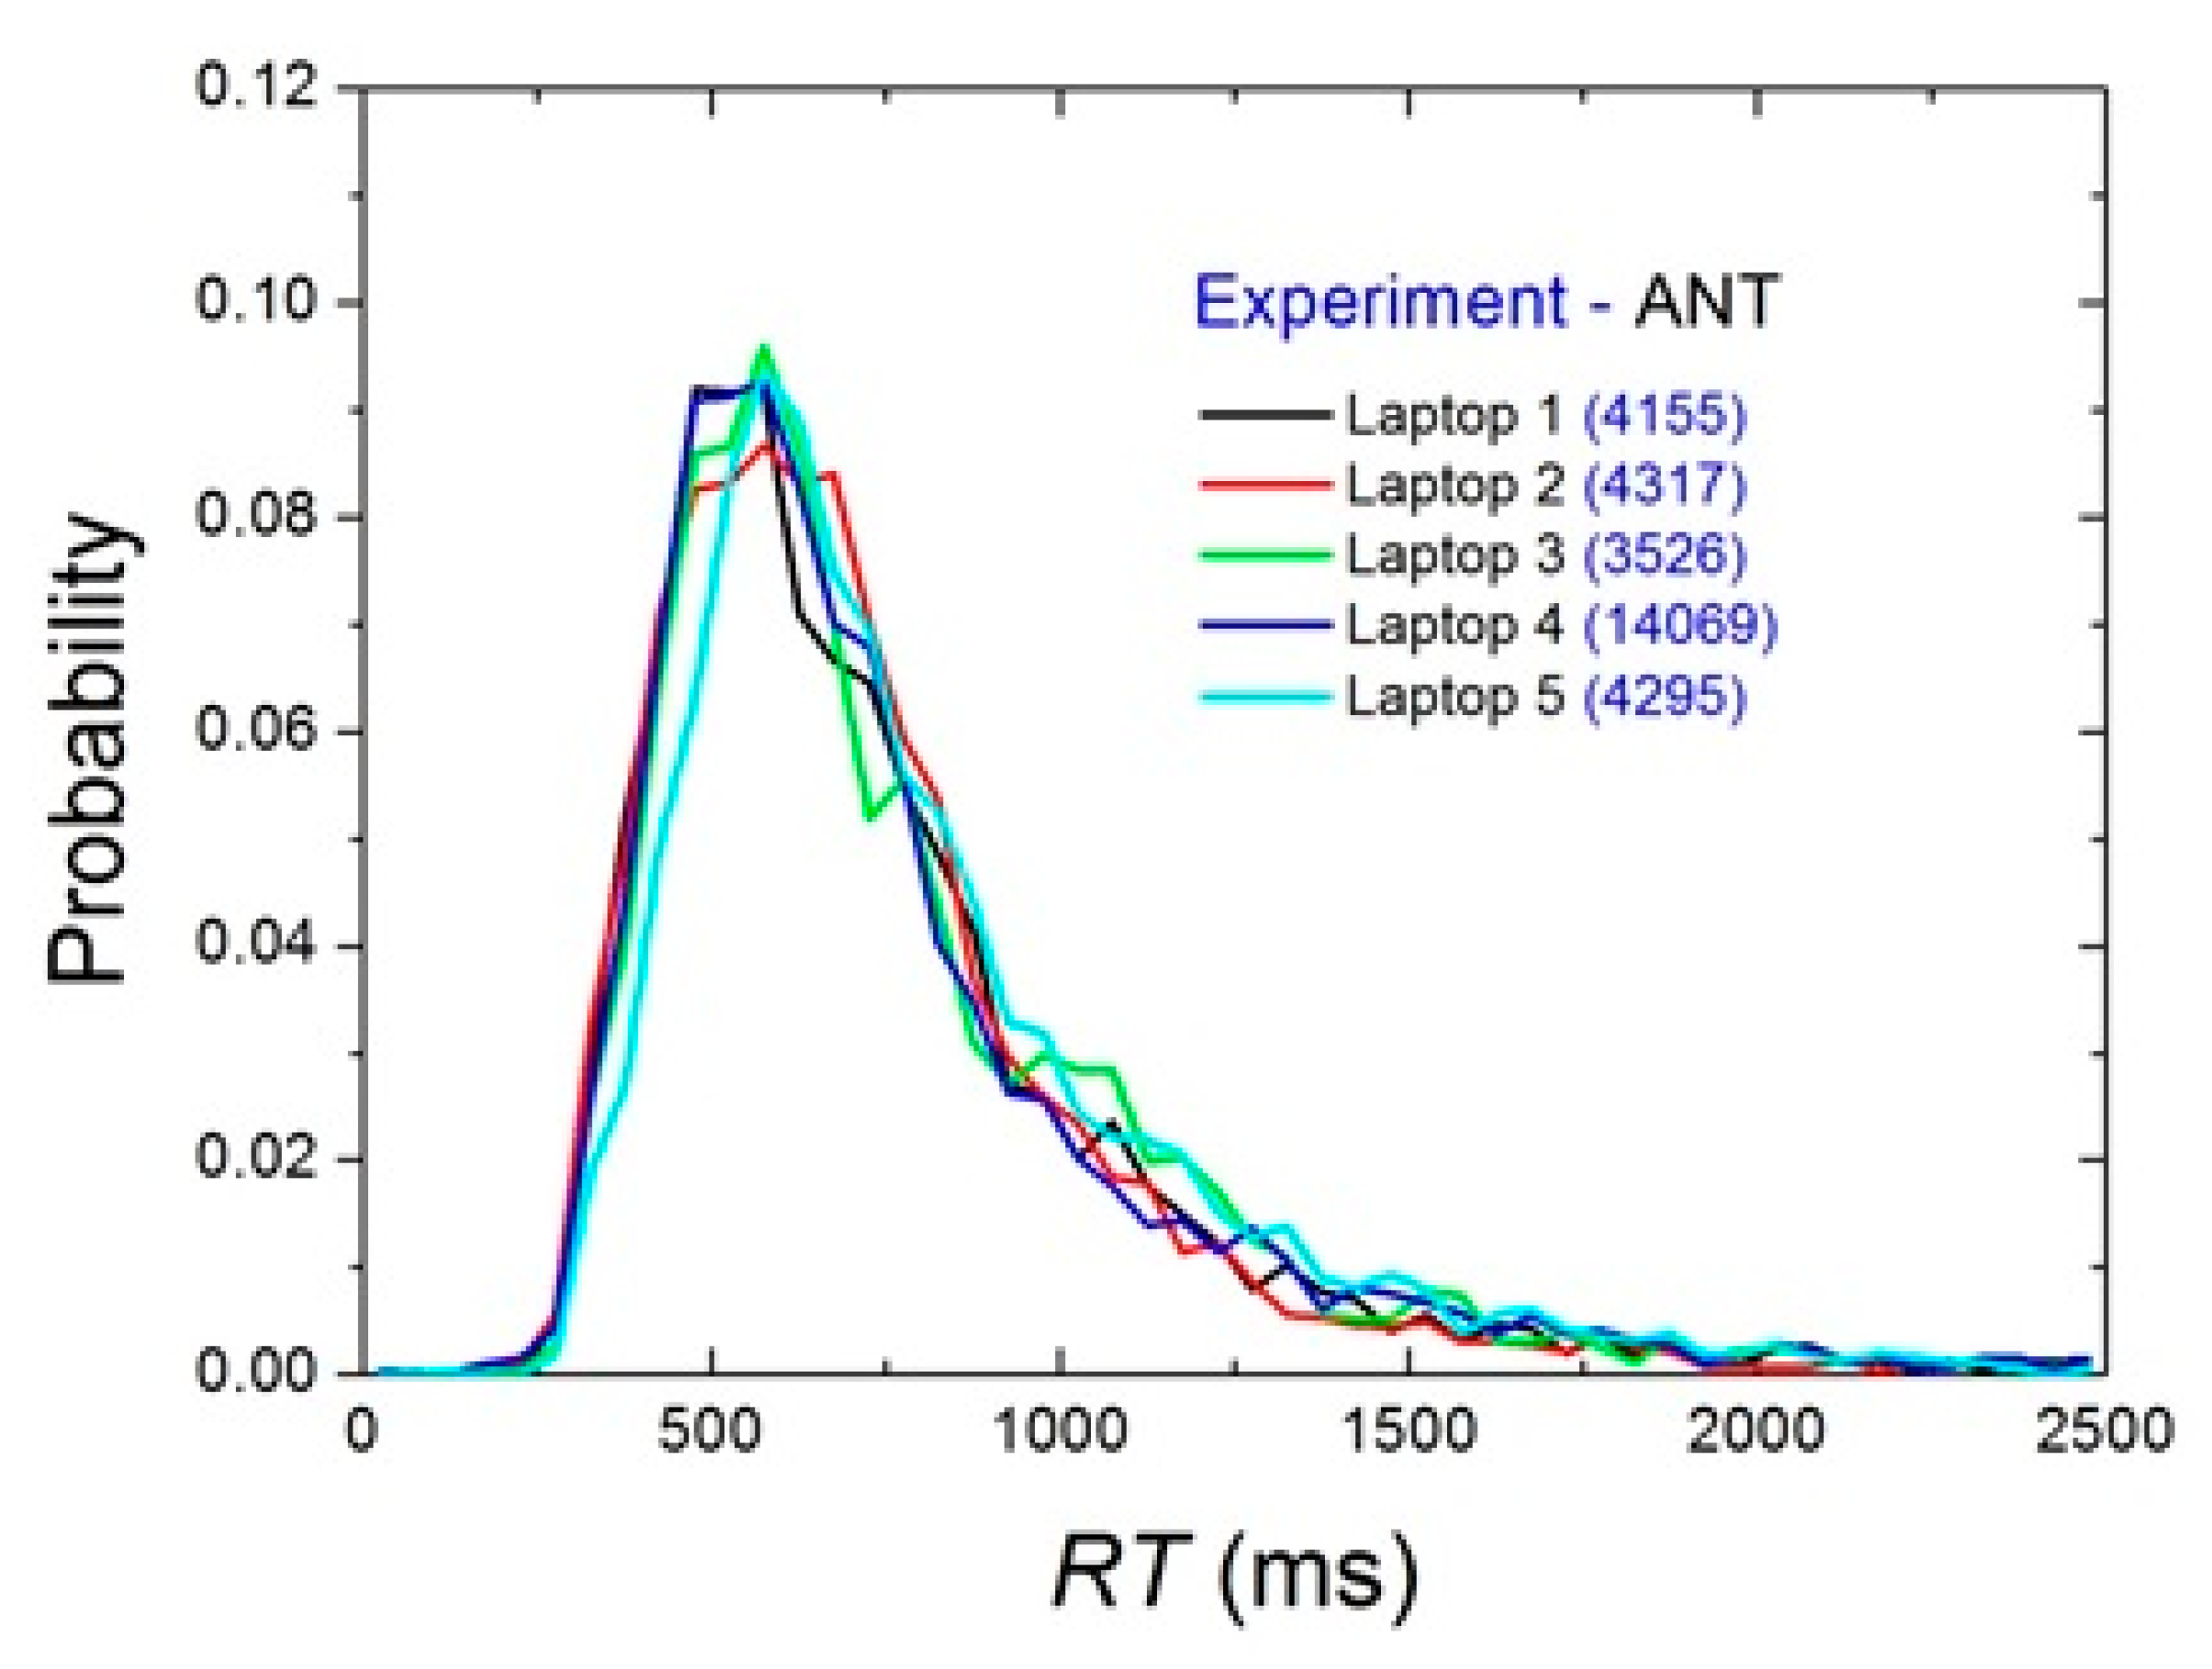
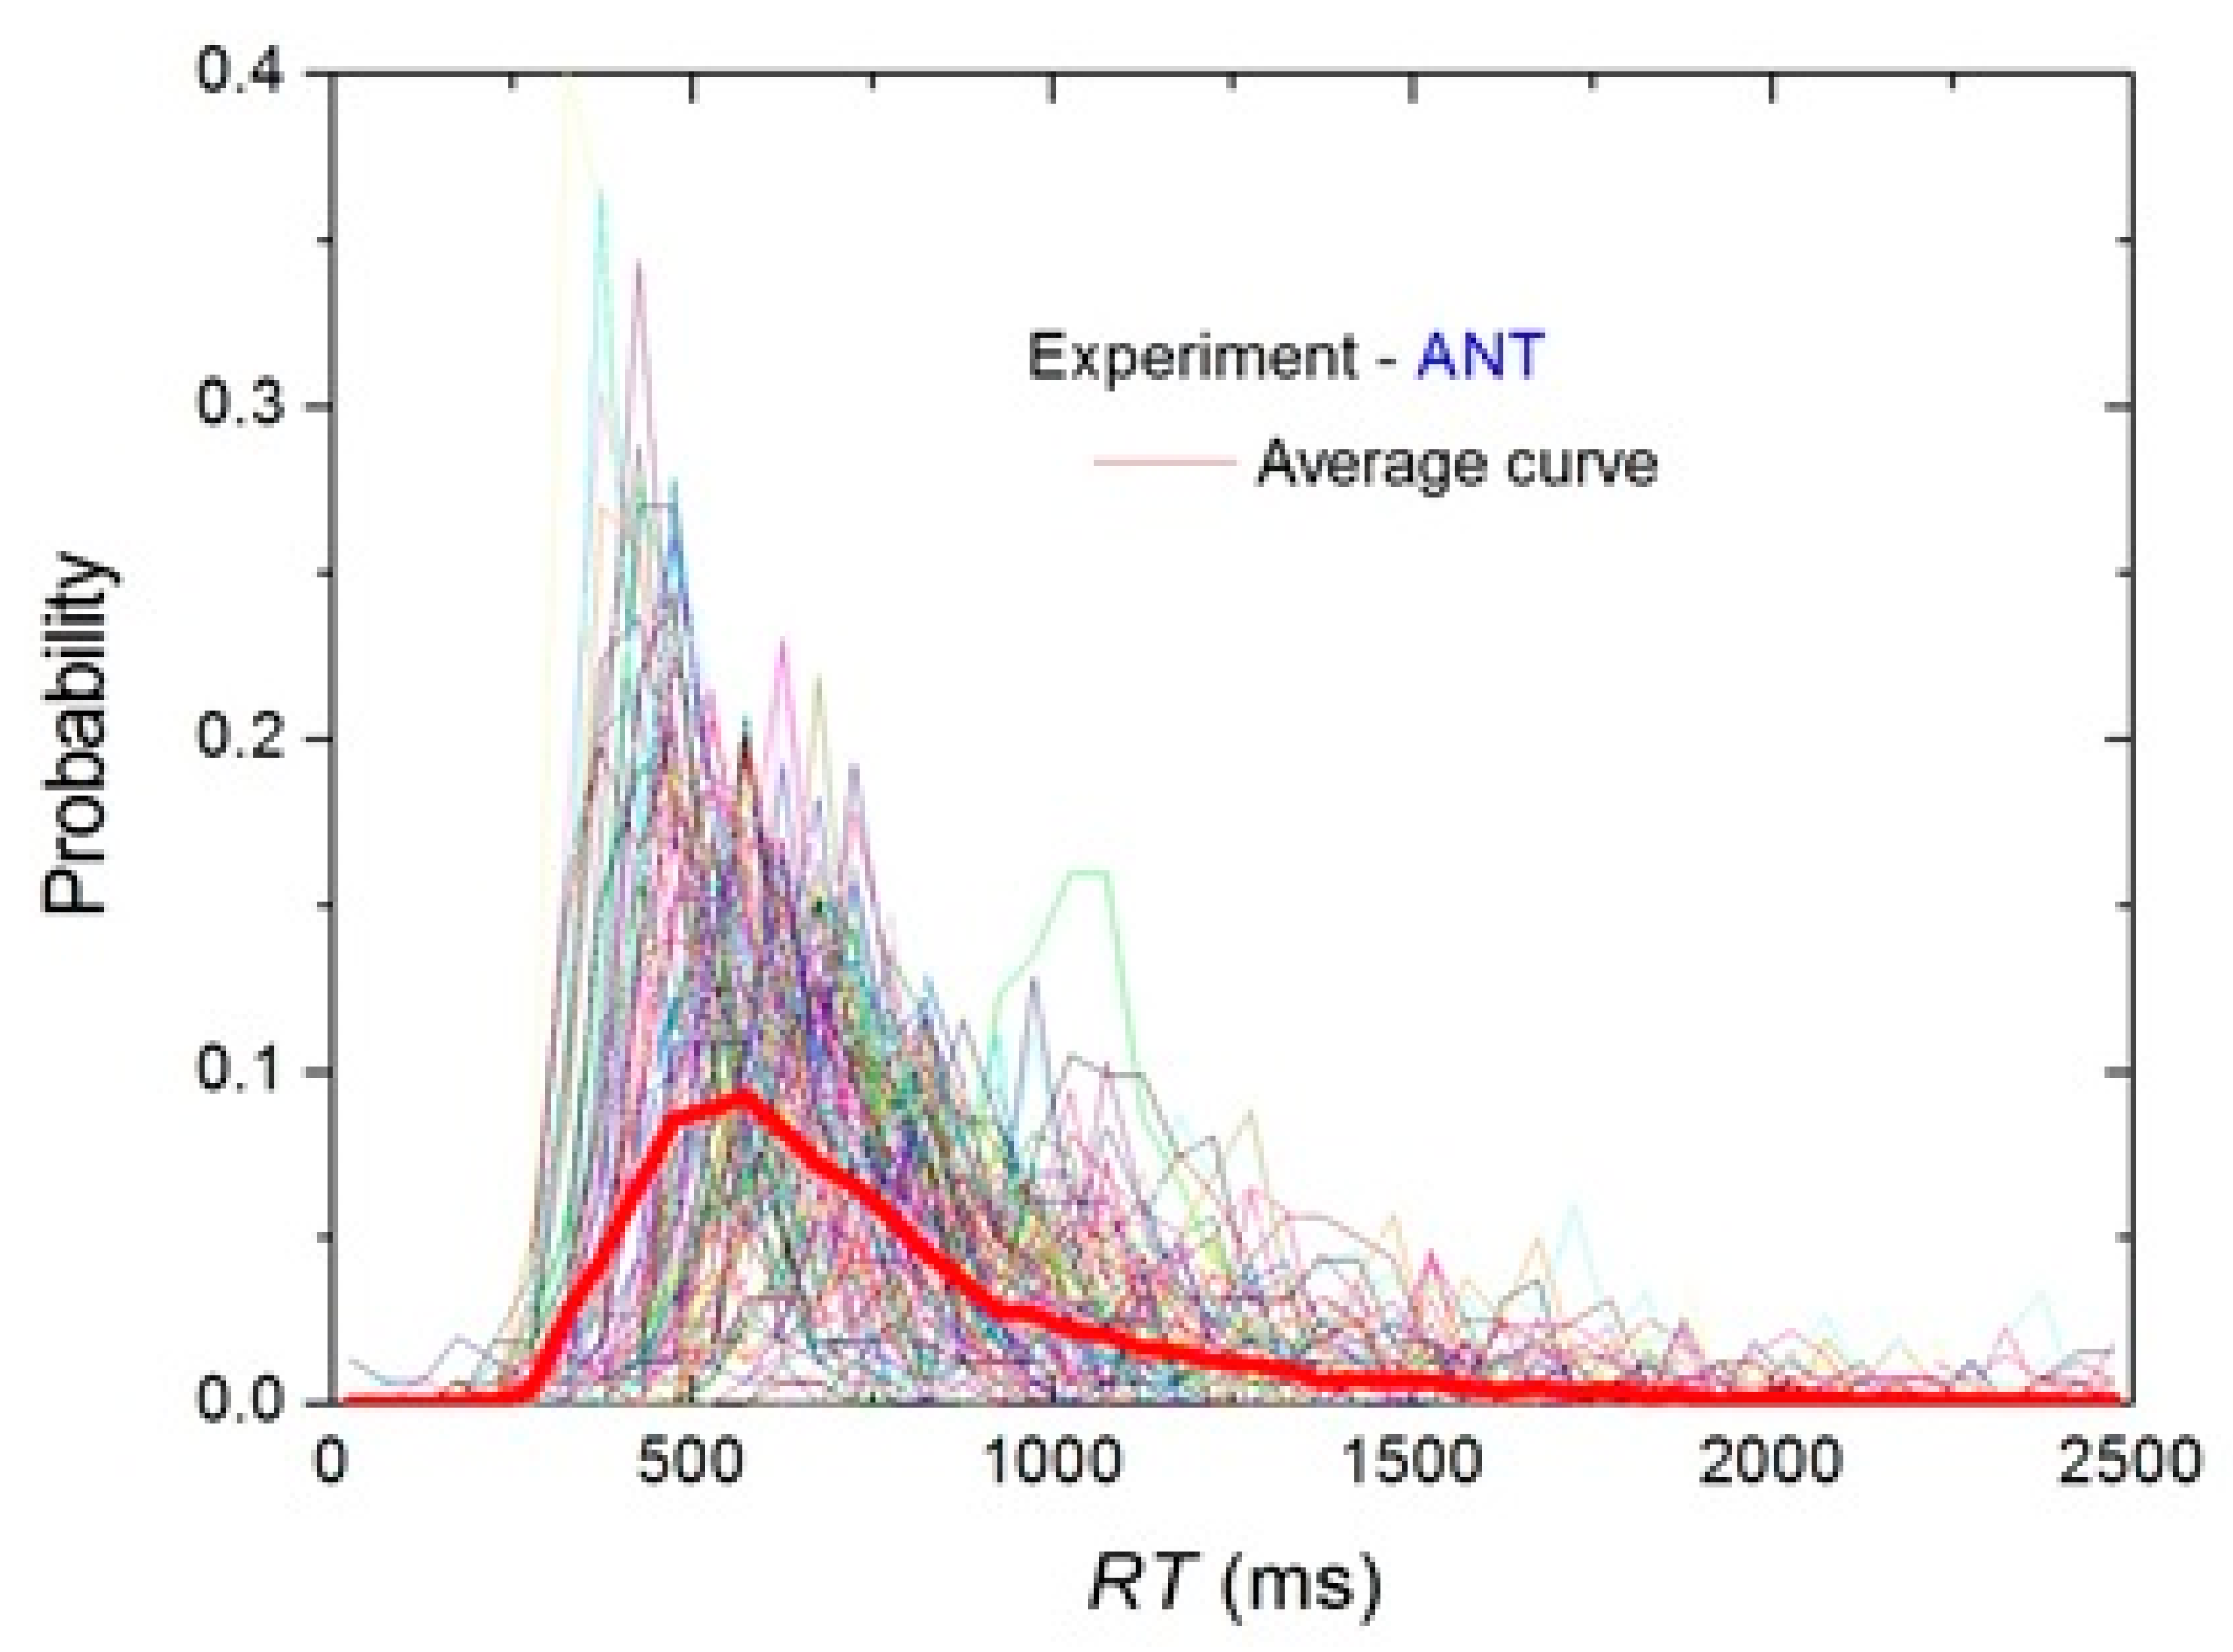
2.3. Procedure for the Data Analysis
3. Results and Discussions
3.1. Ex-Gaussian Analysis
3.2. Classification Methodology
3.3. Vector Criterion Based on the Ex-Gaussian Parameters
4. Conclusions
Author Contributions
Funding
Acknowledgments
Conflicts of Interest
References
- Sroubek, A.; Kelly, M.; Li, X. Inattentiveness in attention-deficit/hyperactivity disorder. Neurosci. Bull. 2013, 29, 103–110. [Google Scholar] [CrossRef] [PubMed]
- Clauss-Ehlers, C.S. (Ed.) Encyclopedia of Cross-Cultural School Psychology; Springer Science & Business Media LLC: Boston, MA, USA, 2010. [Google Scholar]
- American Psychiatric Association. American Psychiatric Association Diagnostic and Statistical Manual of Mental Disorders, 5th ed.; APA: Washington, DC, USA, 2013. [Google Scholar]
- Barkley, R.A. Attention Deficit Hyperactivity Disorder: A Handbook for Diagnosis and Treatment, 3rd ed.; Guilford: New York, NY, USA, 2006. [Google Scholar]
- DuPaul, G.J.; Volpe, R.J.; Jitendra, A.K.; Lutz, J.G.; Lorah, K.S.; Gruber, R. Elementary school students with AD/HD: Predictors of academic achievement. J. Sch. Psychol. 2004, 42, 285–301. [Google Scholar] [CrossRef]
- Sonuga-Barke, E.; Koerting, J.; Smith, E.; McCann, D.C.; Thompson, M. Early detection and intervention for attention-deficit/hyperactivity disorder. Expert Rev. Neurother. 2011, 11, 557–563. [Google Scholar] [CrossRef] [PubMed]
- Lavigne Cerván, R.; Romero-Pérez, J.F. The Attention Deficit Hyperactivity Dissorder; Ediciones Pirámide: Madrid, Spain, 2010; (In Spanish, EL TDAH). [Google Scholar]
- Pliszka, S. Practice parameter for the assessment and treatment of children and adolescents with attention-deficit/hyperactivity disorder. J. Am. Acad. Child Adolesc. Psychiatry 2007, 46, 894–921. [Google Scholar] [CrossRef]
- Tarantino, S.C.; Mogentale, C.; Bisiacchi, P.S. Time-on-Task in Children with ADHD: An ex-Gaussian Analysis. Vincenza J. Int. Neuropsychol. Soc. 2013, 19, 820–828. [Google Scholar] [CrossRef]
- Klein, C.; Wendling, K.; Huettner, P.; Ruder, H.; Peper, M. Intra-subject variability in attention-deficit hyperactivity disorder. Biol. Psychiatry 2006, 60, 1088–1097. [Google Scholar] [CrossRef] [PubMed]
- Nigg, J.T.; Willcutt, E.G.; Doyle, A.E.; Sonuga-Barke, E.J. Causal heterogeneity in attention-deficit/hyperactivity disorder: Do we need neuropsychologically impaired subtypes? Biol. Psychiatry 2005, 57, 1224–1230. [Google Scholar] [CrossRef] [PubMed]
- Willcutt, E.G.; Doyle, A.E.; Nigg, J.T.; Faraone, S.V.; Pennington, B.F. Validity of the executive function theory of attention-deficit/hyperactivity disorder: A meta-analytic review. Biol. Psychiatry 2005, 57, 1336–1346. [Google Scholar] [CrossRef]
- Castellanos, F.X.; Sonuga-Barke, E.J.; Scheres, A.; Di Martino, A.; Hyde, C.; Walters, J.R. Varieties of attention-deficit/hyperactivity disorder-related intra-individual variability. Biol. Psychiatry 2005, 57, 1416–1423. [Google Scholar] [CrossRef]
- Luce, R.D. Response Times: Their Role in Inferring Elementary Mental Organization; Oxford University Press: New York, NY, USA, 1986. [Google Scholar]
- Hockley, W.E.; Corballis, M.C. Test of serial scanning in item recognition. Can. J. Psychol. 1982, 36, 189–212. [Google Scholar] [CrossRef]
- Ratcliff, R.; Murdock, B.B. Retrieval processes in recognition memory. Psychol. Rev. 1976, 83, 190–214. [Google Scholar] [CrossRef]
- Gmehlin, D.; Fuermaier, A.B.M.; Walther, S.; Debelak, R.; Rentrop, M.; Westermann, C.; Sharma, A.; Tucha, L.; Koerts, J.; Tucha, O.; et al. Intraindividual Variability in Inhibitory Function in Adults with ADHD—An Ex-Gaussian Approach. PLoS ONE 2014, 9, e112298. [Google Scholar] [CrossRef]
- Adamo, N.; Hodsoll, J.; Asherson, P.; Buitelaar, J.K.; Kuntsi, J. Ex-Gaussian, Frequency and Reward Analyses Reveal Specificity of Reaction Time Fluctuations to ADHD and Not Autism Traits. J. Abnorm. Child Psychol. 2019, 47, 557–567. [Google Scholar] [CrossRef]
- Burbeck, S.L.; Luce, R.D. Evidence from auditory simple reaction times for both change and level detectors. Percept. Psychophys. 1982, 32, 117–133. [Google Scholar] [CrossRef]
- Heathcote, A.; Popiel, S.J.; Mewhort, D.J.K. Analysis of response time distributions: An example using the Stroop task. Psychol. Bull. 1991, 109, 340–347. [Google Scholar] [CrossRef]
- Matzke, D.; Wagenmakers, E.-J. Psychological interpretation of the ex-Gaussian and shifted Wald parameters: A diffusion model analysis. Psychon. Bull. Rev. 2009, 16, 798–817. [Google Scholar] [CrossRef]
- Shahar, N.; Teodorescu, A.R.; Karmon-Presser, A.; Anholt, G.E.; Meiran, N. Memory for Action Rules and Reaction Time Variability in Attention-Deficit/Hyperactivity Disorder. Biol. Psychiatry Cogn. Neurosci. Neuroimaging 2016, 1, 132–140. [Google Scholar] [CrossRef]
- Leth-Steensen, C.; King Elbaz, Z.; Douglas, V.I. Mean response times, variability, and skew in the responding of ADHD children: A response time distributional approach. Acta Psychol. 2000, 104, 167–190. [Google Scholar] [CrossRef]
- Navarro-Pardo, E.; Navarro-Prados, A.B.; Gamermann, D. Moret-Tatay, C. Differences between younger and older university students on lexical decision task: Evidence through an ex-Gaussian approach. J. Gen. Psychol. 2013, 140, 251–268. [Google Scholar] [CrossRef][Green Version]
- Lemus-Zúñiga, L.G.; Navarro-Pardo, E.; Moret-Tatay, C.; Pocinho, R. Serious games for elderly continuous monitoring. In Data Mining in Clinical Medicine; Springer: New York, NY, USA, 2015; pp. 259–267. [Google Scholar] [CrossRef]
- Moret-Tatay, C.; Moreno-Cid, A.; Argimon, I.I.D.L.; Quarti Irigaray, T.; Szczerbinski, M.; Murphy, M.; Vázquez-Martínez, A.; Vázquez-Molina, J.; Sáiz-Mauleon, B.; Navarro-Pardo, E.; et al. The effects of age and emotional valence on recognition memory: An ex-Gaussian components analysis. Scand. J. Psychol. 2014, 55, 420–426. [Google Scholar] [CrossRef] [PubMed]
- Moret-Tatay, C.; Irigaray, T.Q.; Oliveira, C.; Argimon, I.I.D.L. Reaction Times as a dependent variable of memory: Future lines of research through an ex-Gaussian fit. Horiz. Neurosci. Res. 2015, 17, 60–71. [Google Scholar]
- Hohle, R.H. Inferred components of reaction times as functions of foreperiod duration. J. Exp. Psychol. 1965, 69, 382–386. [Google Scholar] [CrossRef]
- Borella, E.; de Ribaupierre, A.; Cornoldi, C.; Chicherio, C. Beyond interference control impairment in ADHD: Evidence from increased intraindividual variability in the color—Stroop test. Child Neuropsychol. 2012, 19, 495–515. [Google Scholar] [CrossRef] [PubMed]
- World Medical Association. Declaration of Helsinki: Ethical Principles for Medical Research Involving Human Subjects. J. Am. Med. Assoc. 2013, 310, 2191–2194. [Google Scholar] [CrossRef]
- Forster, K.I.; Forster, J.C. DMDX: A windows display program with millisecond accuracy. Behav. Res. Methods Instrum. Comput. 2003, 35, 116–124. [Google Scholar] [CrossRef]
- Fan, J.; McCandliss, B.D.; Sommer, T.; Raz, A.; Posner, M.I. Testing the efficiency and independence of attentional networks. J. Cogn. Neurosci. 2002, 14, 340–347. [Google Scholar] [CrossRef]
- Posner, M.I.; Dehaene, S. Attentional networks. Trends Neurosci. 1994, 17, 75–79. [Google Scholar] [CrossRef]
- Posner, M.I.; Raichle, M.E. Images of Mind; Scientific American Library: New York, NY, USA, 1994. [Google Scholar]
- Lacouture, Y.; Cousineau, D. How to use MATLAB to fit the ex-Gaussian and other probability functions to a distribution of response times. Tutor. Quant. Methods Psychol. 2008, 4, 35–45. [Google Scholar] [CrossRef]
- Ratcliff, R.; McKoon, G. The diffusion decision model: Theory and data for two-choice decision tasks. Neural Comput. 2008, 20, 873–922. [Google Scholar] [CrossRef] [PubMed]
- Ratcliff, R. Group reaction time distributions and an analysis of distribution statistics. Psychol. Bull. 1979, 86, 446–461. [Google Scholar] [CrossRef] [PubMed]
- Moret-Tatay, C.; Gamermann, D.; Navarro-Pardo, E.; Fernández-de-Córdoba-Castellá, P. ExGUtils: A python package for statistical analysis with the ex-Gaussian probability density. Front. Psychol. 2018, 9, 1–11. [Google Scholar] [CrossRef]
- Levenberg, K. A method for the solution of certain non-linear problems in least squares. Q. Appl. Math. 1944, 2, 164–168. [Google Scholar] [CrossRef]
- Marquardt, D. An algorithm for least-squares estimation of nonlinear parameters. J. Soc. Ind. Appl. Math. 1963, 11, 431–441. [Google Scholar] [CrossRef]
- Castellanos, F.X.; Sonuga-Barke, E.J.; Milham, M.P.; Tannock, R. Characterizing cognition in ADHD: Beyond executive dysfunction. Trends Cogn. Sci. 2006, 10, 117–123. [Google Scholar] [CrossRef]
- Emond, V.; Joyal, C.; Poissant, H. Neuroanatomie structurelle et fonctionnelle du trouble déficitaire d’attention avec ou sans hyperactivité (TDAH) [Structural and functional neuroanatomy of attention-deficit hyperactivity disorder (ADHD)]. Encephale 2009, 35, 107–114. (In French) [Google Scholar] [CrossRef] [PubMed]
- Reinhardt, M.C.; Reinhardt, C.A. Attention deficit-hyperactivity disorder, comorbidities, and risk situations. J. Pediatr. (Rio. J.) 2013, 89, 124–130. [Google Scholar] [CrossRef] [PubMed]
- Hwang-Gu, S.L.; Chen, Y.C.; Liang, S.H.; Ni, H.C.; Lin, H.Y.; Lin, C.F.; Gau, S.S. Exploring the Variability in Reaction Times of Preschoolers at Risk of Attention-Deficit/Hyperactivity Disorder: An ex-Gaussian Analysis. J. Abnorm. Child Psychol. 2019. [Google Scholar] [CrossRef] [PubMed]


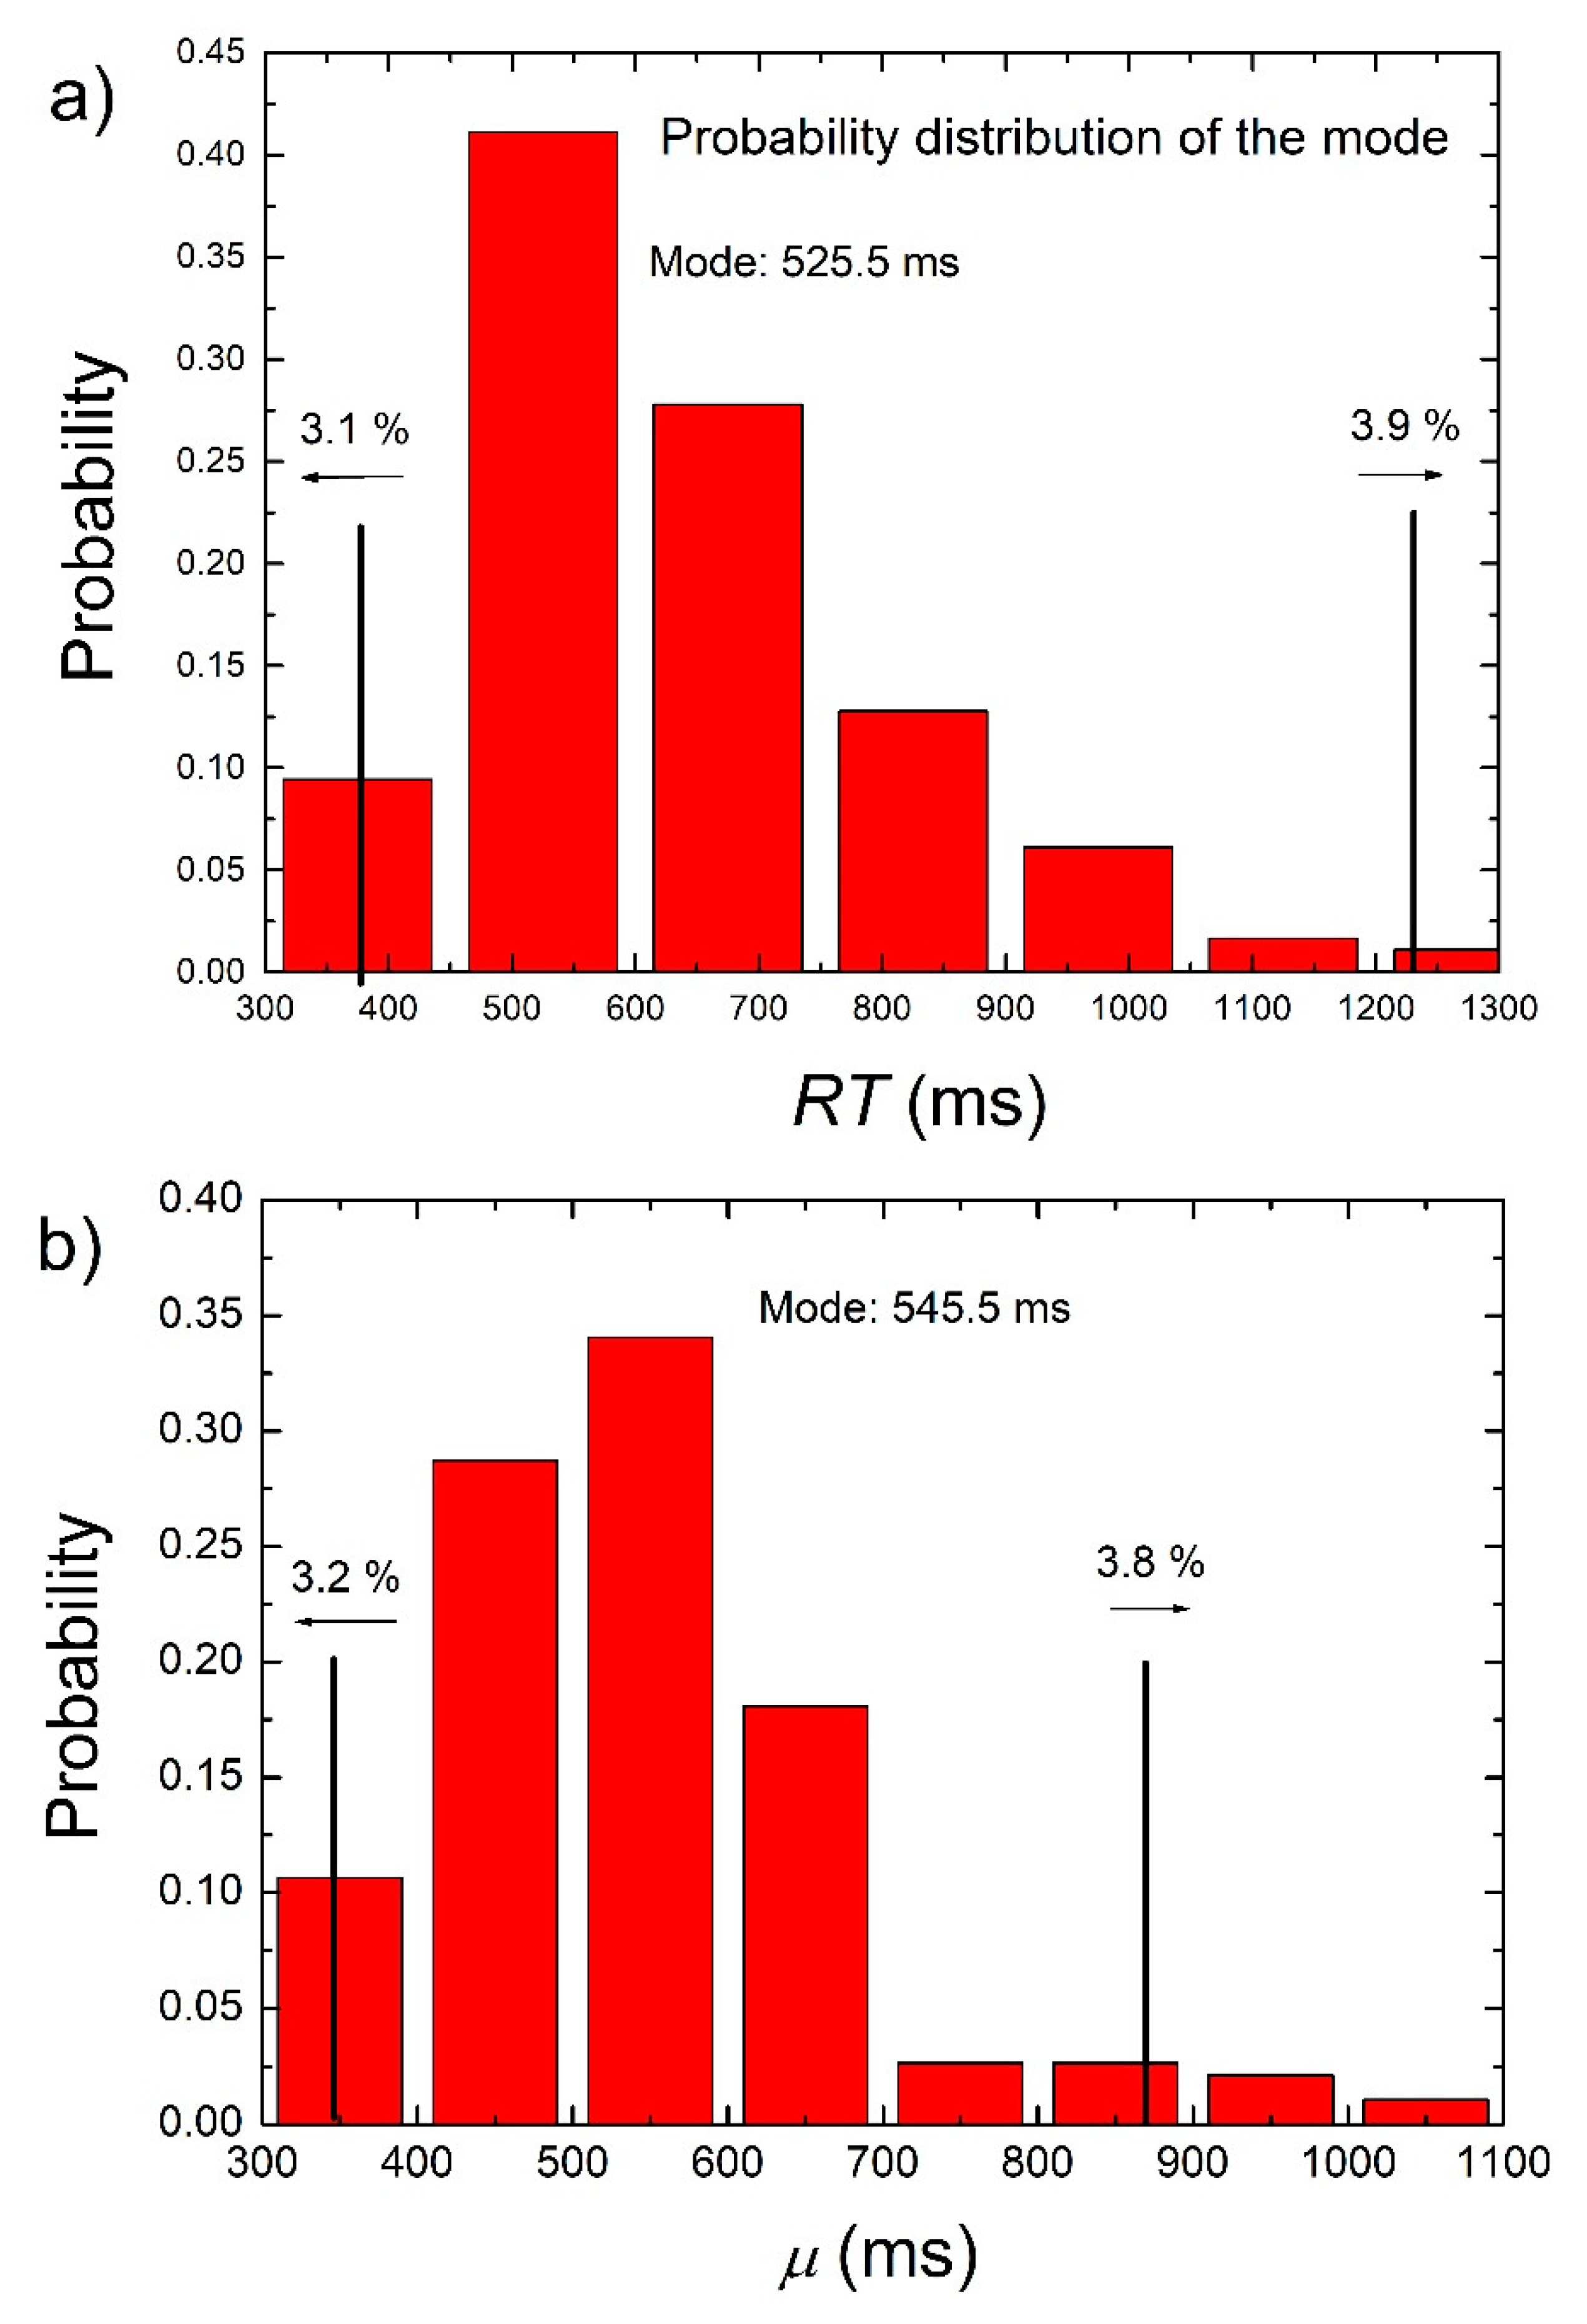
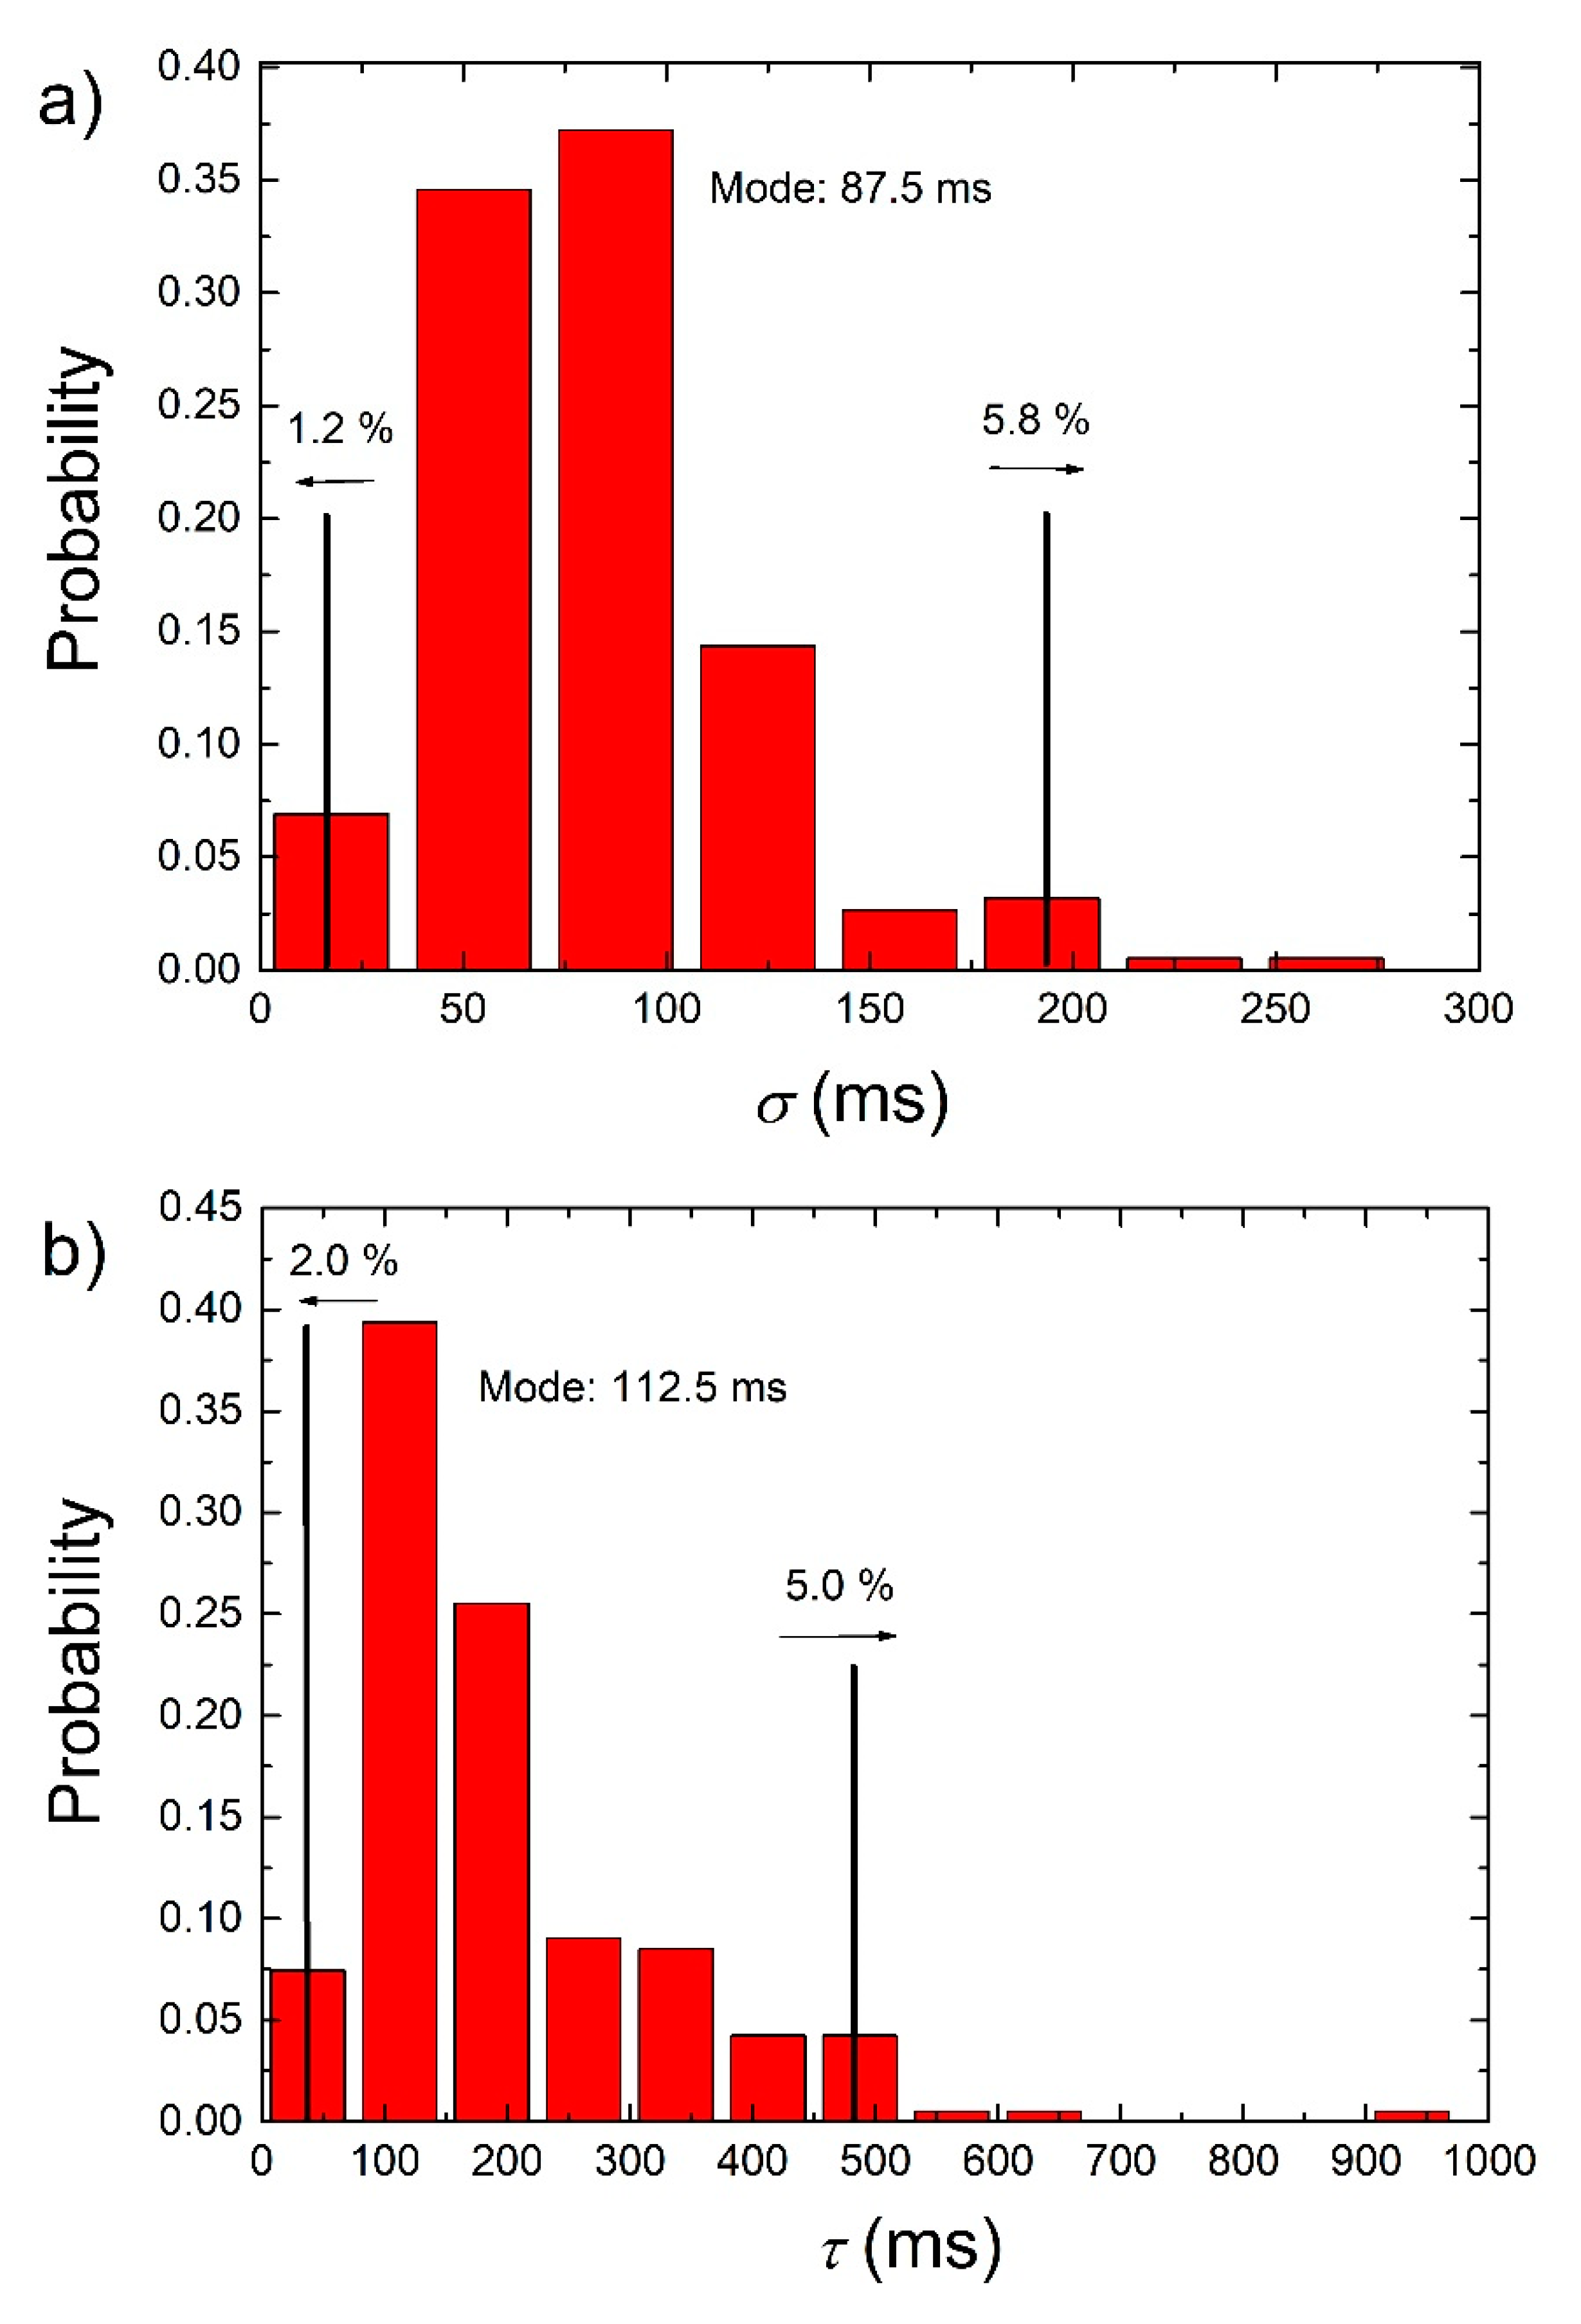
| Mode | ||||||||
|---|---|---|---|---|---|---|---|---|
| Mode (ms) | 525.5 | 545.5 | 87.5 | 112.5 | ||||
| L | R | L | R | L | R | L | R | |
| %-PD | 44.4 | 55.6 | 45.0 | 55.0 | 16.5 | 83.5 | 14.9 | 85.1 |
| %-Prev. | 3.1 | 3.9 | 3.2 | 3.8 | 1.2 | 5.8 | 2.0 | 5.0 |
| No. Ch. | 6 | 7 | 6 | 7 | 2 | 11 | 2 | 11 |
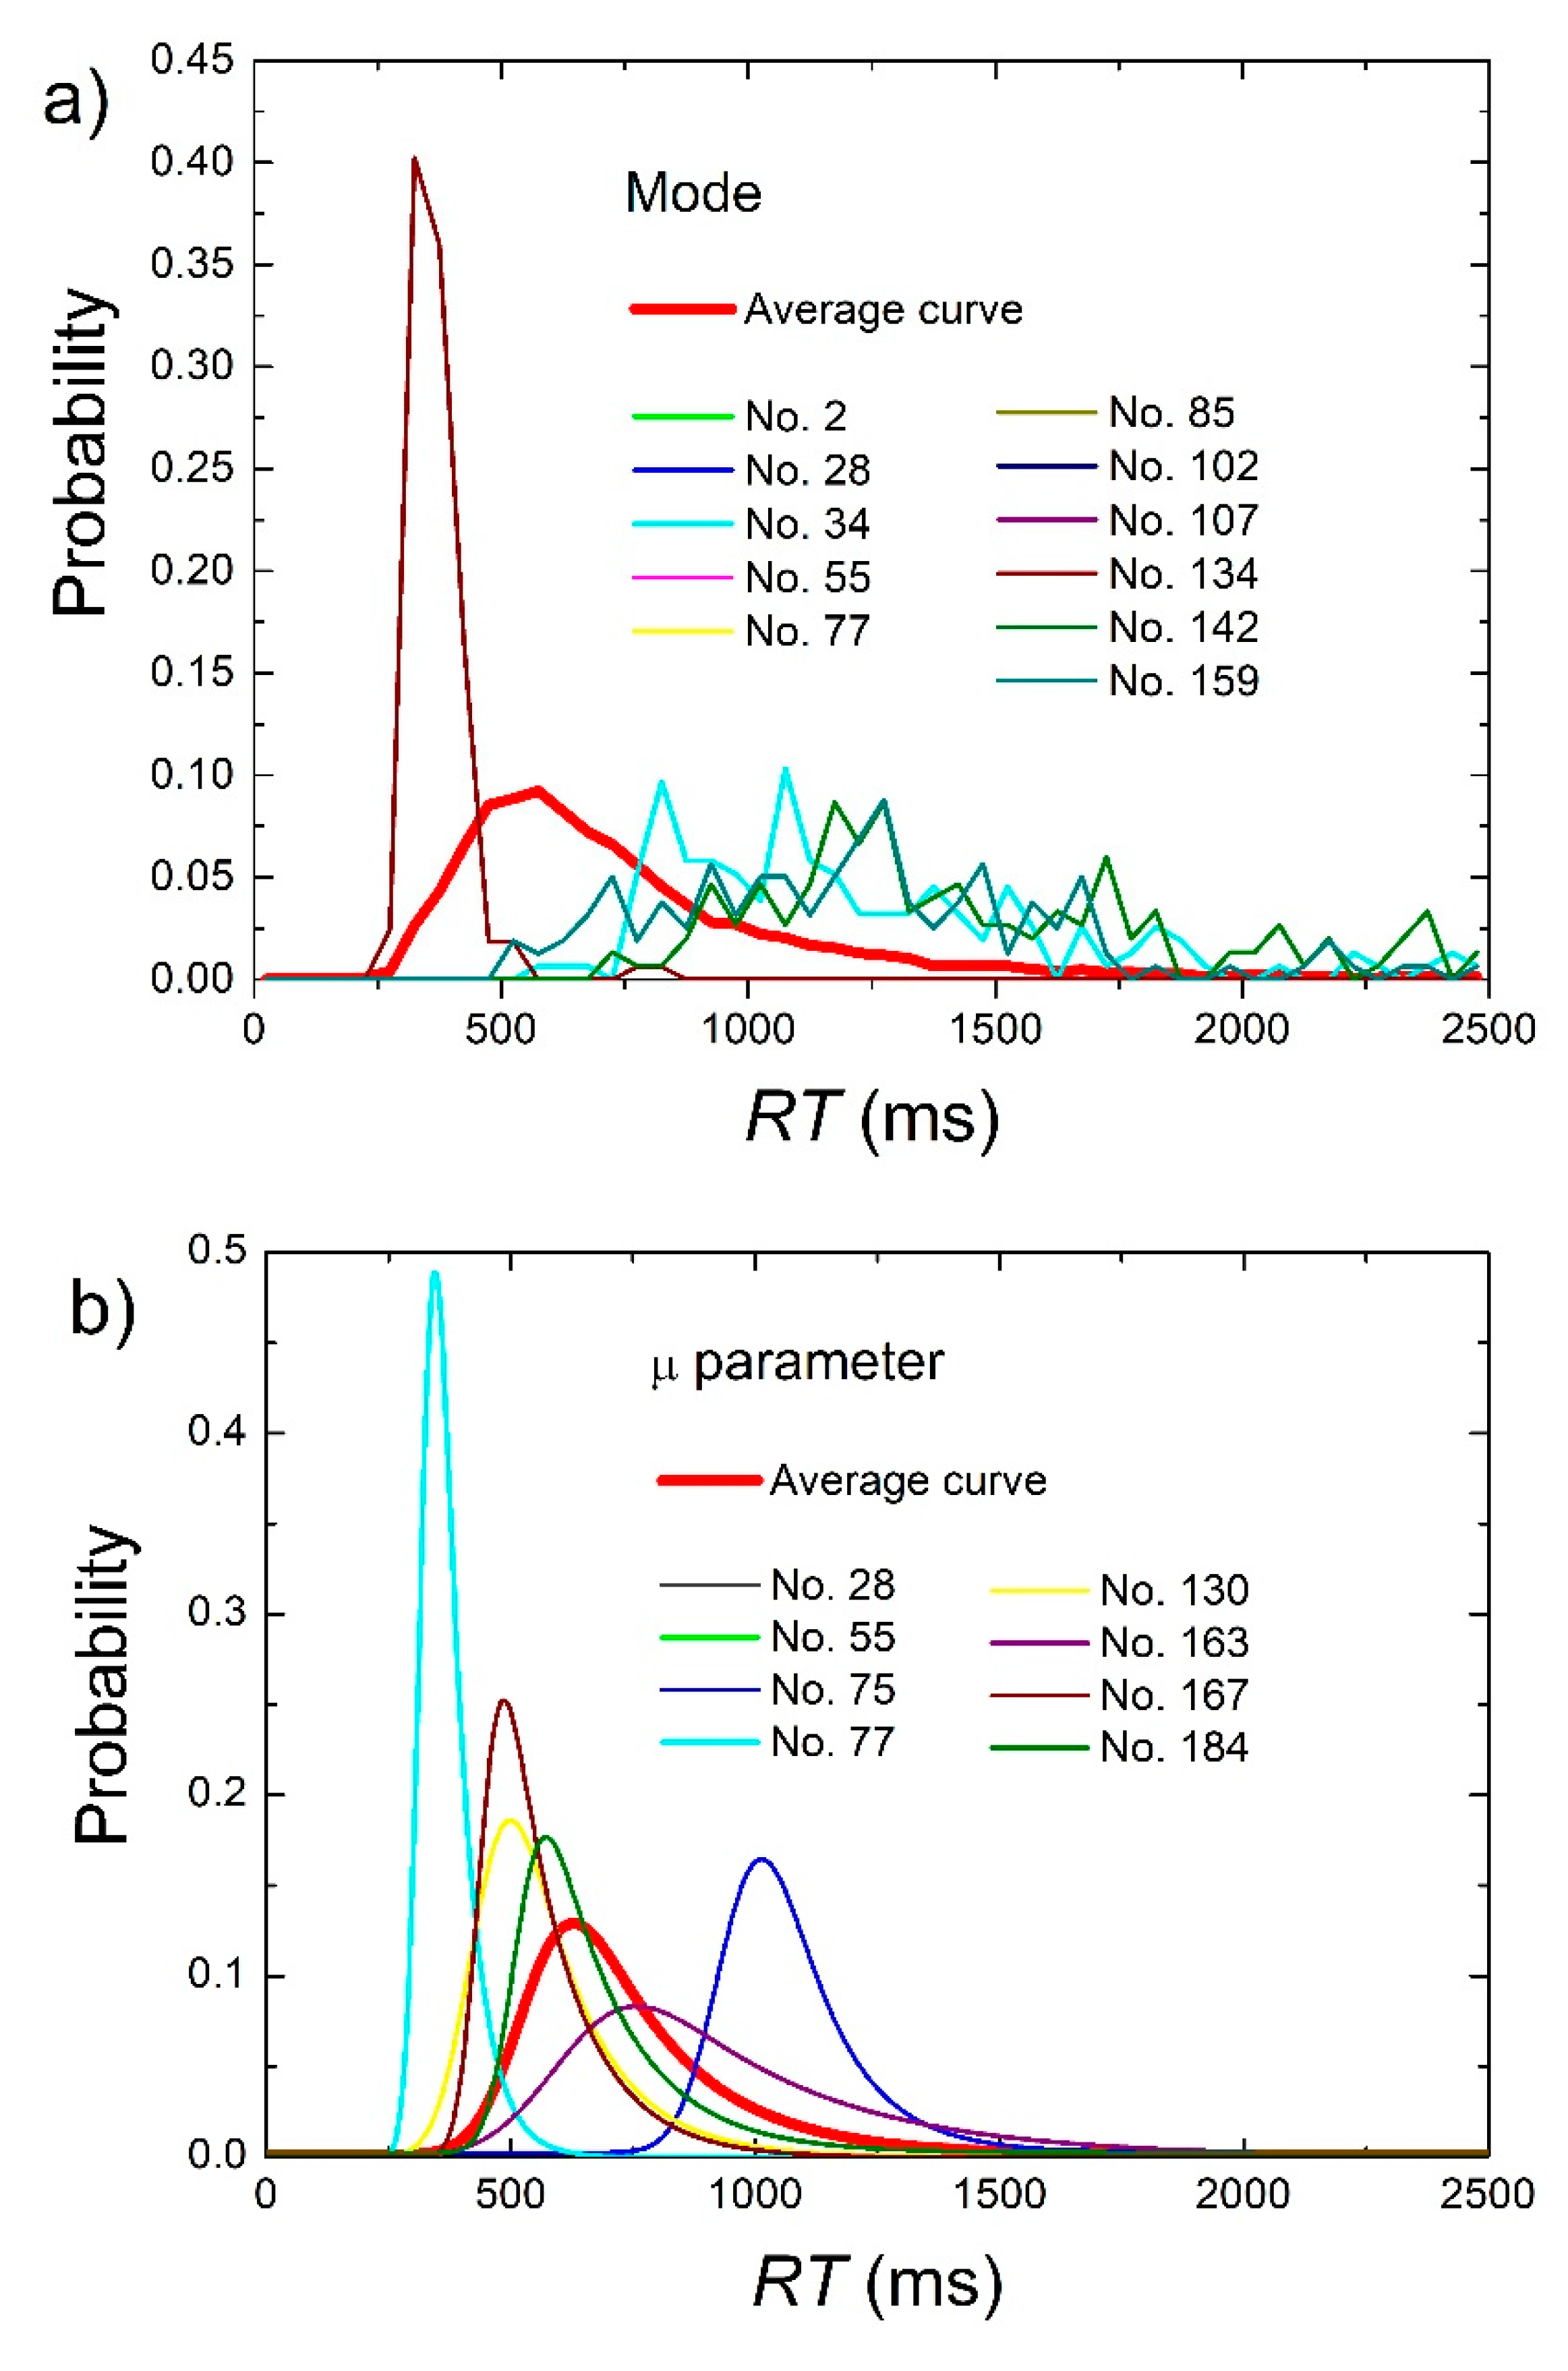
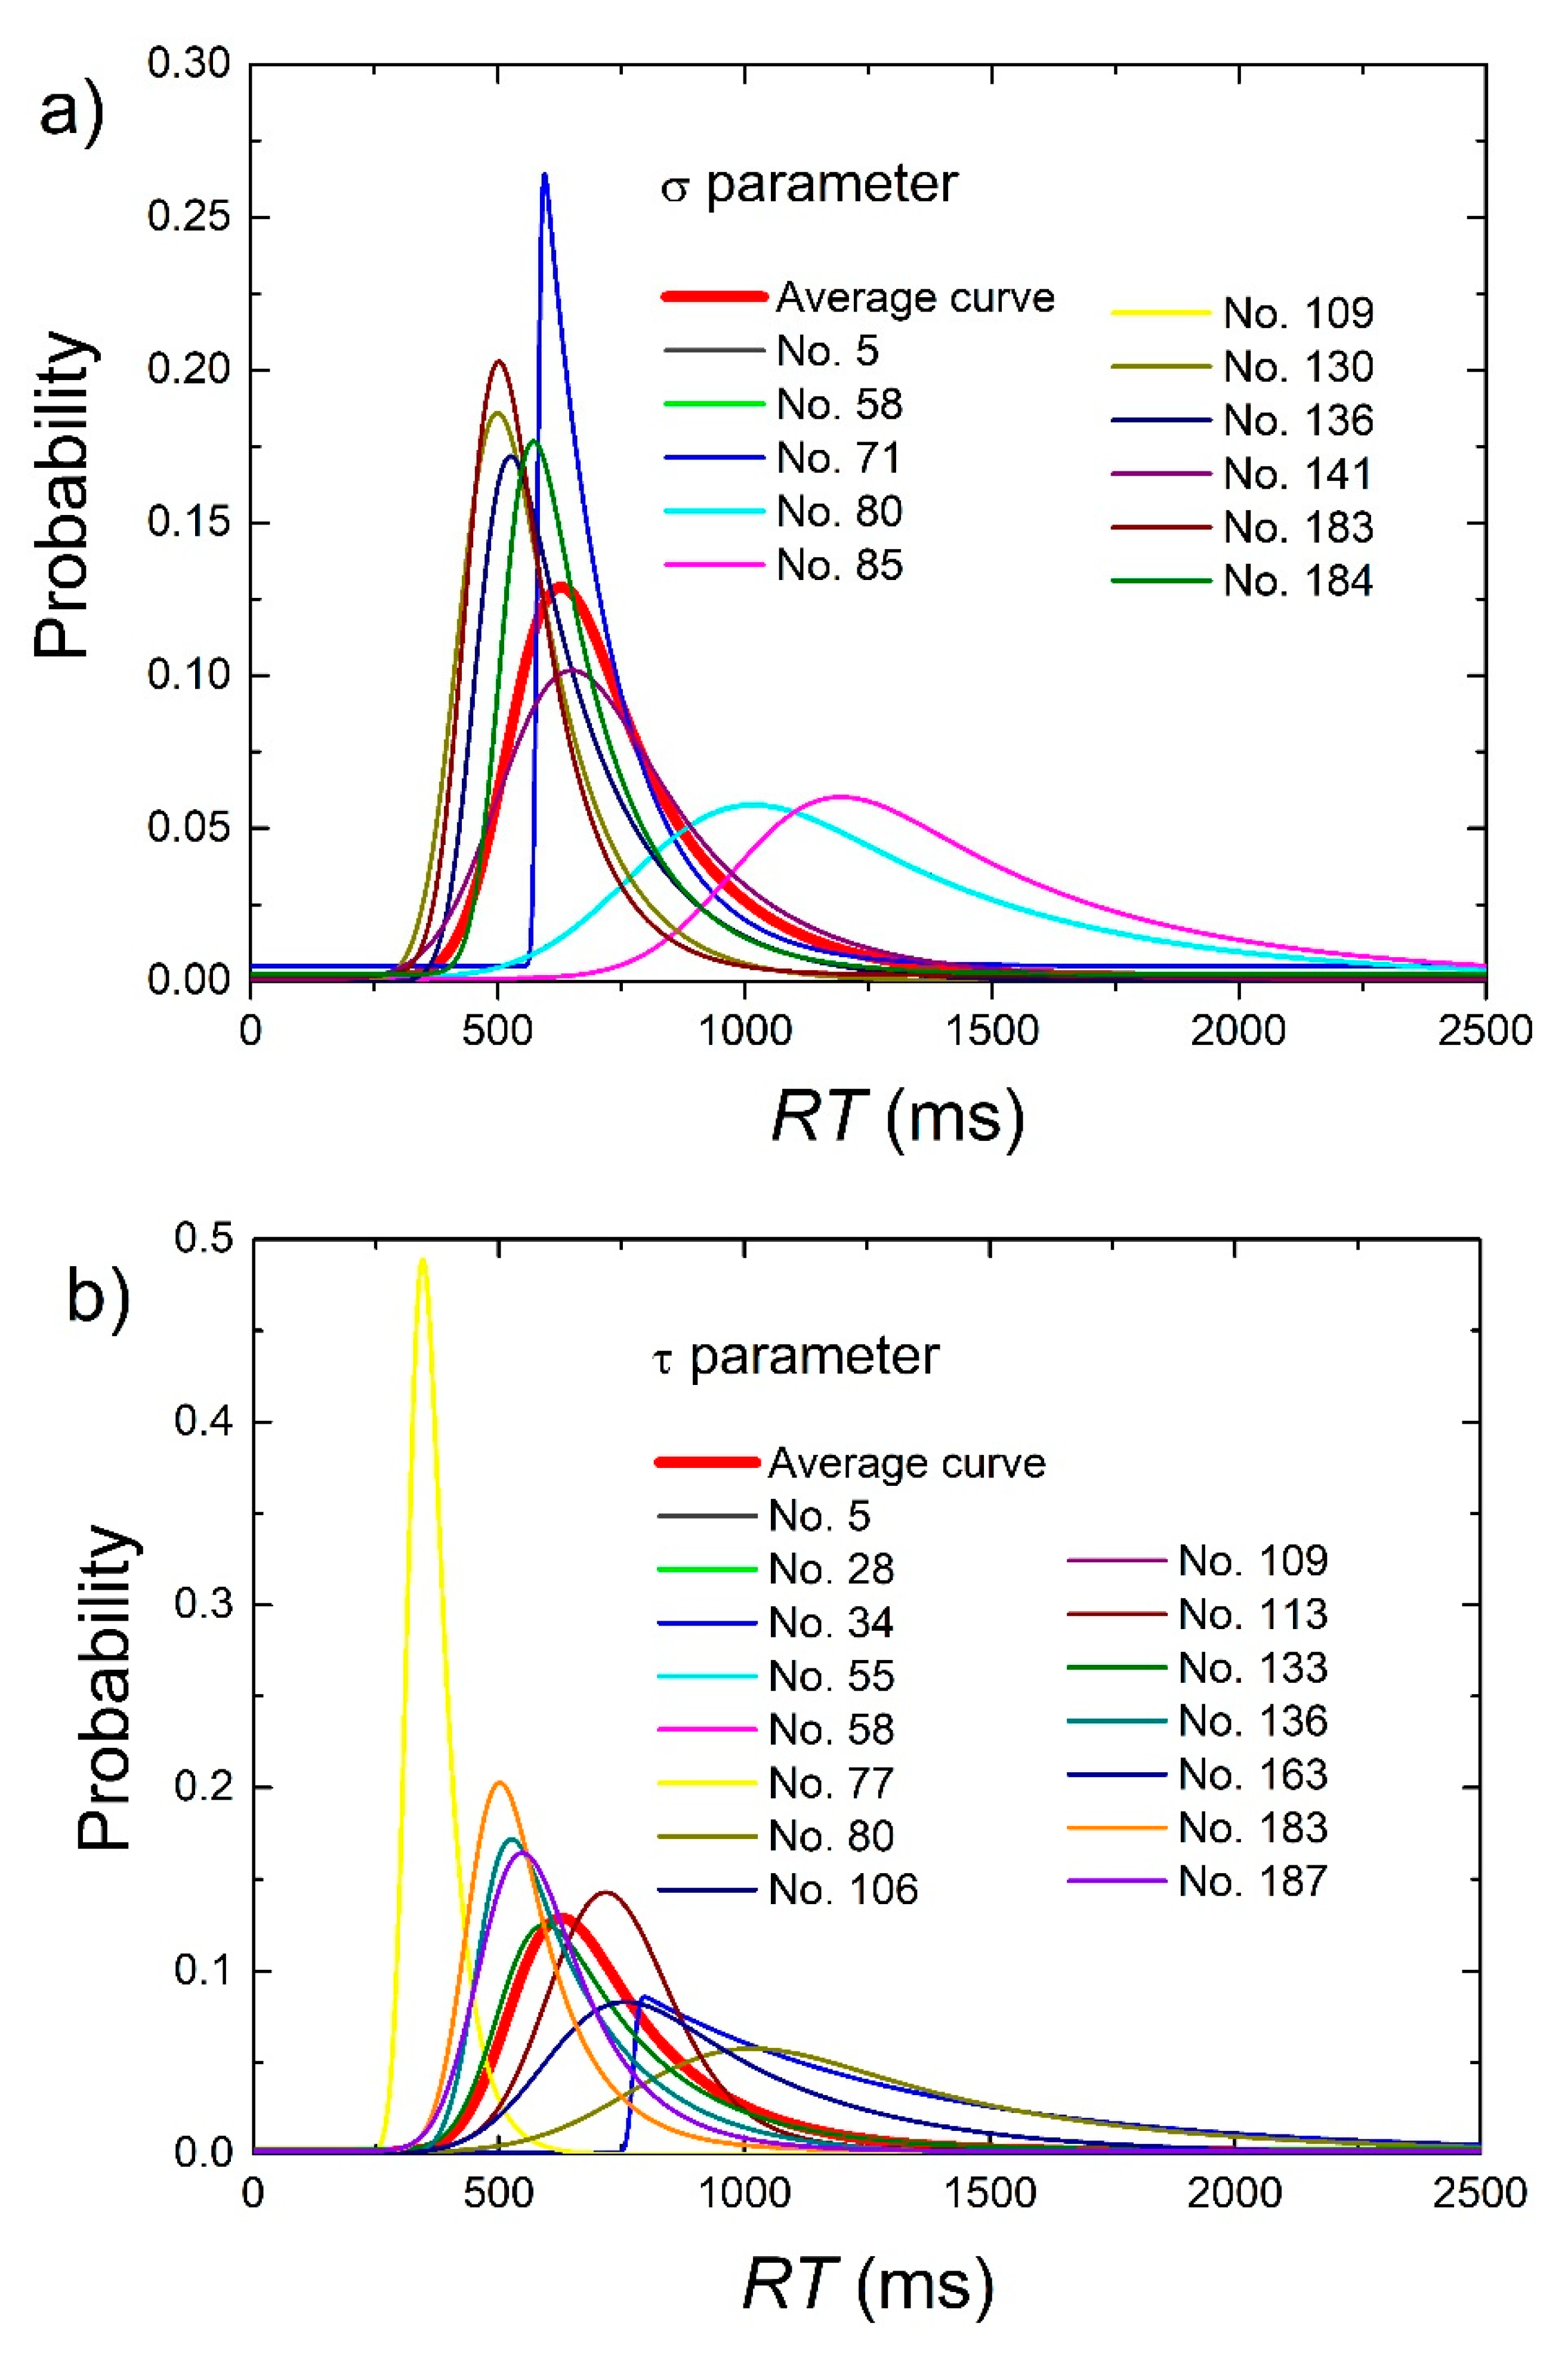
| Selected children (labels) | 2, 28, 34, 55, 77, 75, 130, 85, 102, 107, 134, 142, 159 | 28, 34, 55, 58, 75, 77, 80, 102, 106, 130, 163, 167, 184 | 5, 39, 41, 58, 71, 80, 85, 109, 130, 136, 141, 183, 184 | 5, 28, 34, 55, 58, 80, 109, 113, 133, 136, 163, 183, 187 | ||||
© 2019 by the authors. Licensee MDPI, Basel, Switzerland. This article is an open access article distributed under the terms and conditions of the Creative Commons Attribution (CC BY) license (http://creativecommons.org/licenses/by/4.0/).
Share and Cite
Hernaiz-Guijarro, M.; Castro-Palacio, J.C.; Navarro-Pardo, E.; Isidro, J.M.; Fernández-de-Córdoba, P. A Probabilistic Classification Procedure Based on Response Time Analysis Towards a Quick Pre-Diagnosis of Student’s Attention Deficit. Mathematics 2019, 7, 473. https://doi.org/10.3390/math7050473
Hernaiz-Guijarro M, Castro-Palacio JC, Navarro-Pardo E, Isidro JM, Fernández-de-Córdoba P. A Probabilistic Classification Procedure Based on Response Time Analysis Towards a Quick Pre-Diagnosis of Student’s Attention Deficit. Mathematics. 2019; 7(5):473. https://doi.org/10.3390/math7050473
Chicago/Turabian StyleHernaiz-Guijarro, M., J. C. Castro-Palacio, E. Navarro-Pardo, J. M. Isidro, and P. Fernández-de-Córdoba. 2019. "A Probabilistic Classification Procedure Based on Response Time Analysis Towards a Quick Pre-Diagnosis of Student’s Attention Deficit" Mathematics 7, no. 5: 473. https://doi.org/10.3390/math7050473
APA StyleHernaiz-Guijarro, M., Castro-Palacio, J. C., Navarro-Pardo, E., Isidro, J. M., & Fernández-de-Córdoba, P. (2019). A Probabilistic Classification Procedure Based on Response Time Analysis Towards a Quick Pre-Diagnosis of Student’s Attention Deficit. Mathematics, 7(5), 473. https://doi.org/10.3390/math7050473